Chart Color Schemes
This analysis uses ABS Statistical Areas Level 2 (SA2) boundaries, which can materially differ from Suburbs and Localities (SAL) even when sharing similar names.
SA2 boundaries are defined by the Australian Bureau of Statistics and are designed to represent communities for statistical reporting (e.g., census and ERP).
Suburbs and Localities (SAL) represent commonly-used suburb/locality names (postal-style areas) and may use different geographic boundaries. For comprehensive analysis, consider reviewing both boundary types if available.
est. as @ -- *
ABS ERP | -- people | --
2021 Census | -- people
Sales Activity
Curious about local property values? Filter the chart to assess the volume and appreciation (including resales) trends and regional comparisons, or scroll to the map below view this information at an individual property level.
Find a Recent Sale
Sales Detail
Population
Aldinga has seen population growth performance typically on par with national averages when looking at short and medium term trends
Aldinga's population, as per AreaSearch's analysis, stood at 16,892 by November 2025. This figure represents an increase of 969 people since the 2021 Census, which reported a population of 15,923. The growth is inferred from ABS' estimated resident population of 16,787 in June 2024 and an additional 214 validated new addresses post-Census date. This results in a density ratio of 478 persons per square kilometer. Aldinga's 6.1% growth since the 2021 census surpassed both SA3 area (4.9%) and SA4 region, indicating it as a regional growth leader. Overseas migration contributed approximately 50.1% to overall population gains recently, with other factors like natural growth and interstate migration also positive.
AreaSearch uses ABS/Geoscience Australia projections for each SA2 area, released in 2024 using 2022 as the base year. For areas not covered by this data and years post-2032, SA State Government's Regional/LGA projections are adopted with adjustments made via weighted aggregation of population growth from LGA to SA2 levels. Looking ahead, demographic trends suggest a population increase just below the median for national statistical areas by 2041, with Aldinga expected to grow by 1,417 persons, reflecting a total gain of 7.7% over the 17 years based on latest annual ERP population numbers.
Frequently Asked Questions - Population
Development
AreaSearch assessment of residential development activity positions Aldinga among the top 25% of areas assessed nationwide
Aldinga has seen approximately 122 new homes approved each year over the past five financial years, totalling 613 homes. By the end of FY-26, 54 approvals have been recorded. On average, 1.3 new residents per year per dwelling constructed were recorded between FY-21 and FY-25. This indicates a balanced supply and demand market, supporting stable conditions.
The average construction cost value for new homes is $319,000. In the current financial year, there have been $121.8 million in commercial approvals, suggesting strong commercial development momentum. Compared to Greater Adelaide, Aldinga shows 54.0% higher new home approvals per person, offering greater choice for buyers. New developments consist of 86.0% standalone homes and 14.0% attached dwellings, maintaining the area's traditional low density character focused on family homes.
With around 138 people per approval, Aldinga reflects a low density area. According to AreaSearch's latest quarterly estimate, Aldinga is forecasted to gain 1,302 residents by 2041. Given current construction levels, housing supply should adequately meet demand, creating favourable conditions for buyers and potentially enabling growth that exceeds current forecasts.
Frequently Asked Questions - Development
Infrastructure
Aldinga has limited levels of nearby infrastructure activity, ranking in the 19thth percentile nationally
Infrastructure changes significantly impact an area's performance. AreaSearch identified 13 projects likely affecting the region. Notable ones are Aldinga Master Planned Community by Villawood Properties, Aldinga Sports Park Master Plan Redevelopment, Main South Road Duplication Project (Stage 2) from Aldinga to Sellicks Beach, and Aldinga - A New Community. The following list details those most relevant.
Professional plan users can use the search below to filter and access additional projects.
INFRASTRUCTURE SEARCH
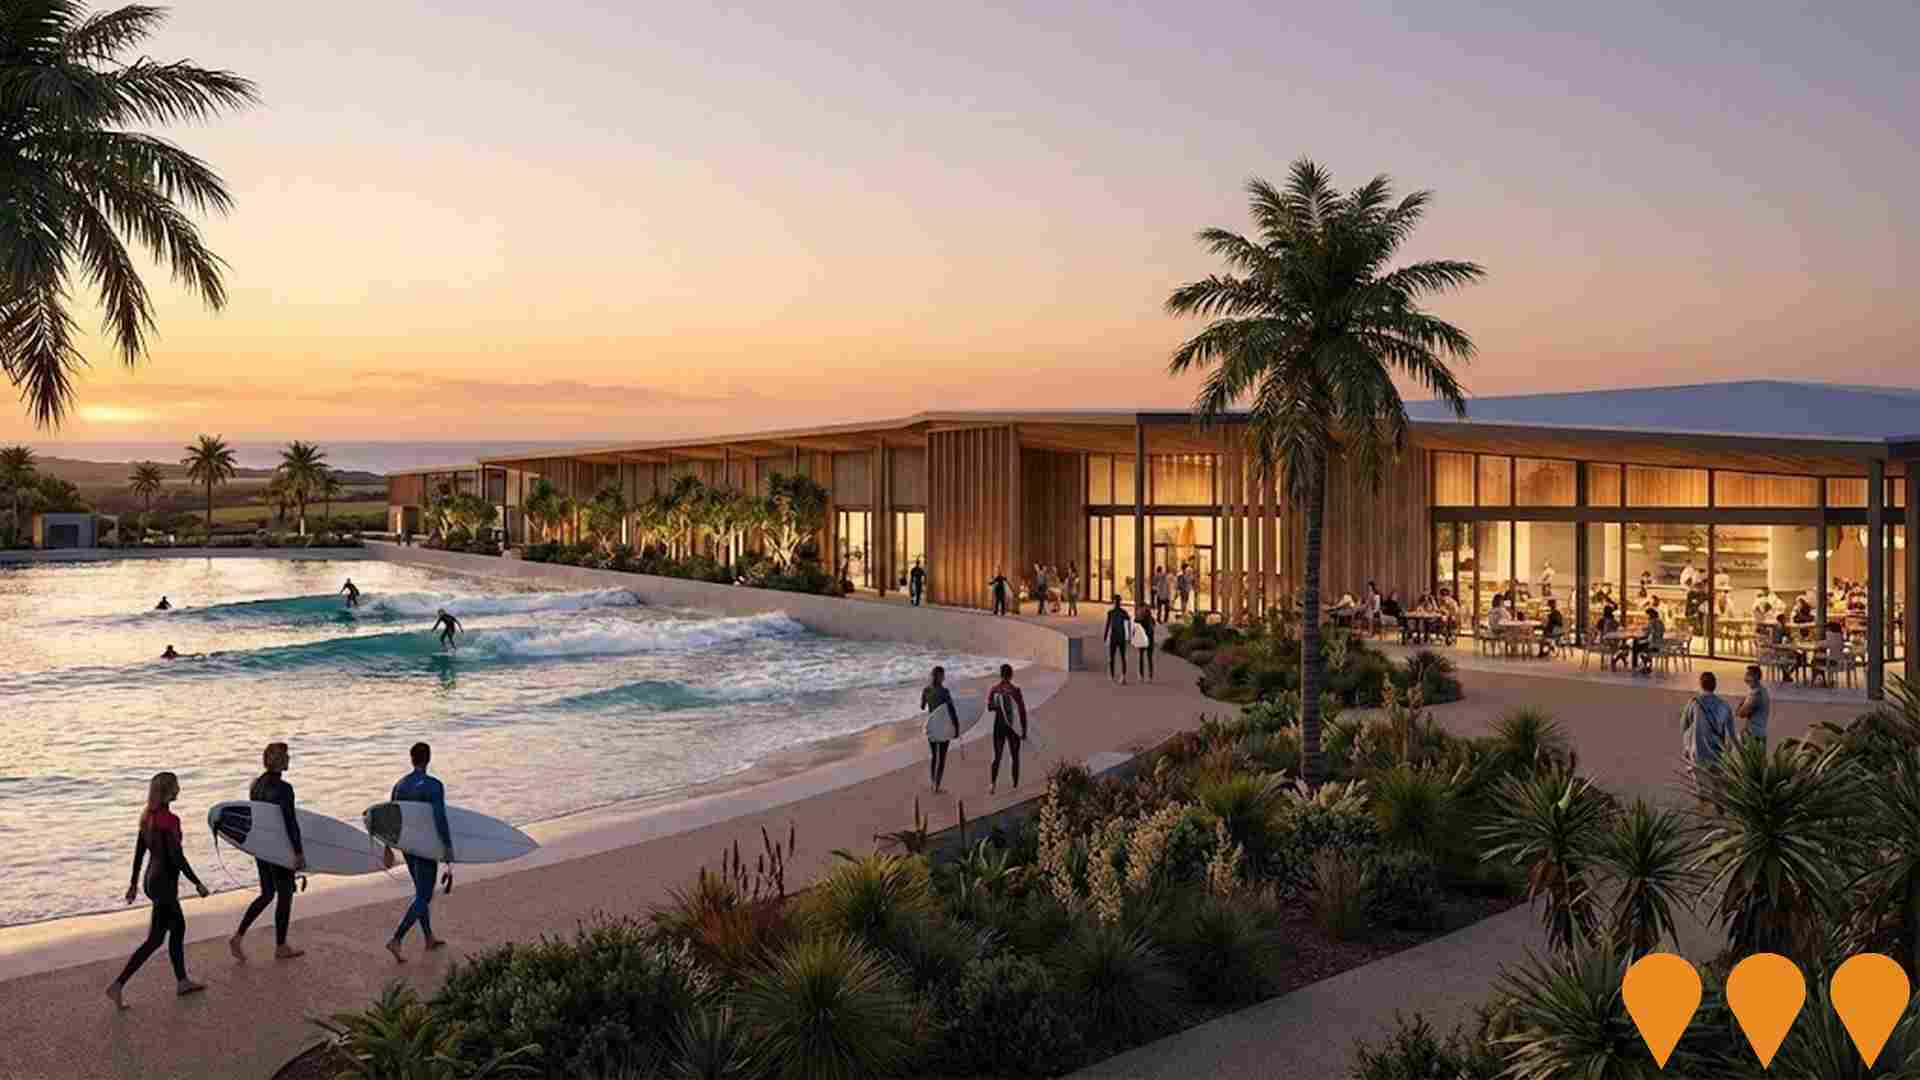
 Denotes AI-based impression for illustrative purposes only, not to be taken as definitive under any circumstances. Please follow links and conduct other investigations from the project's source for actual imagery. Developers and project owners wishing us to use original imagery please Contact Us and we will do so.
Frequently Asked Questions - Infrastructure
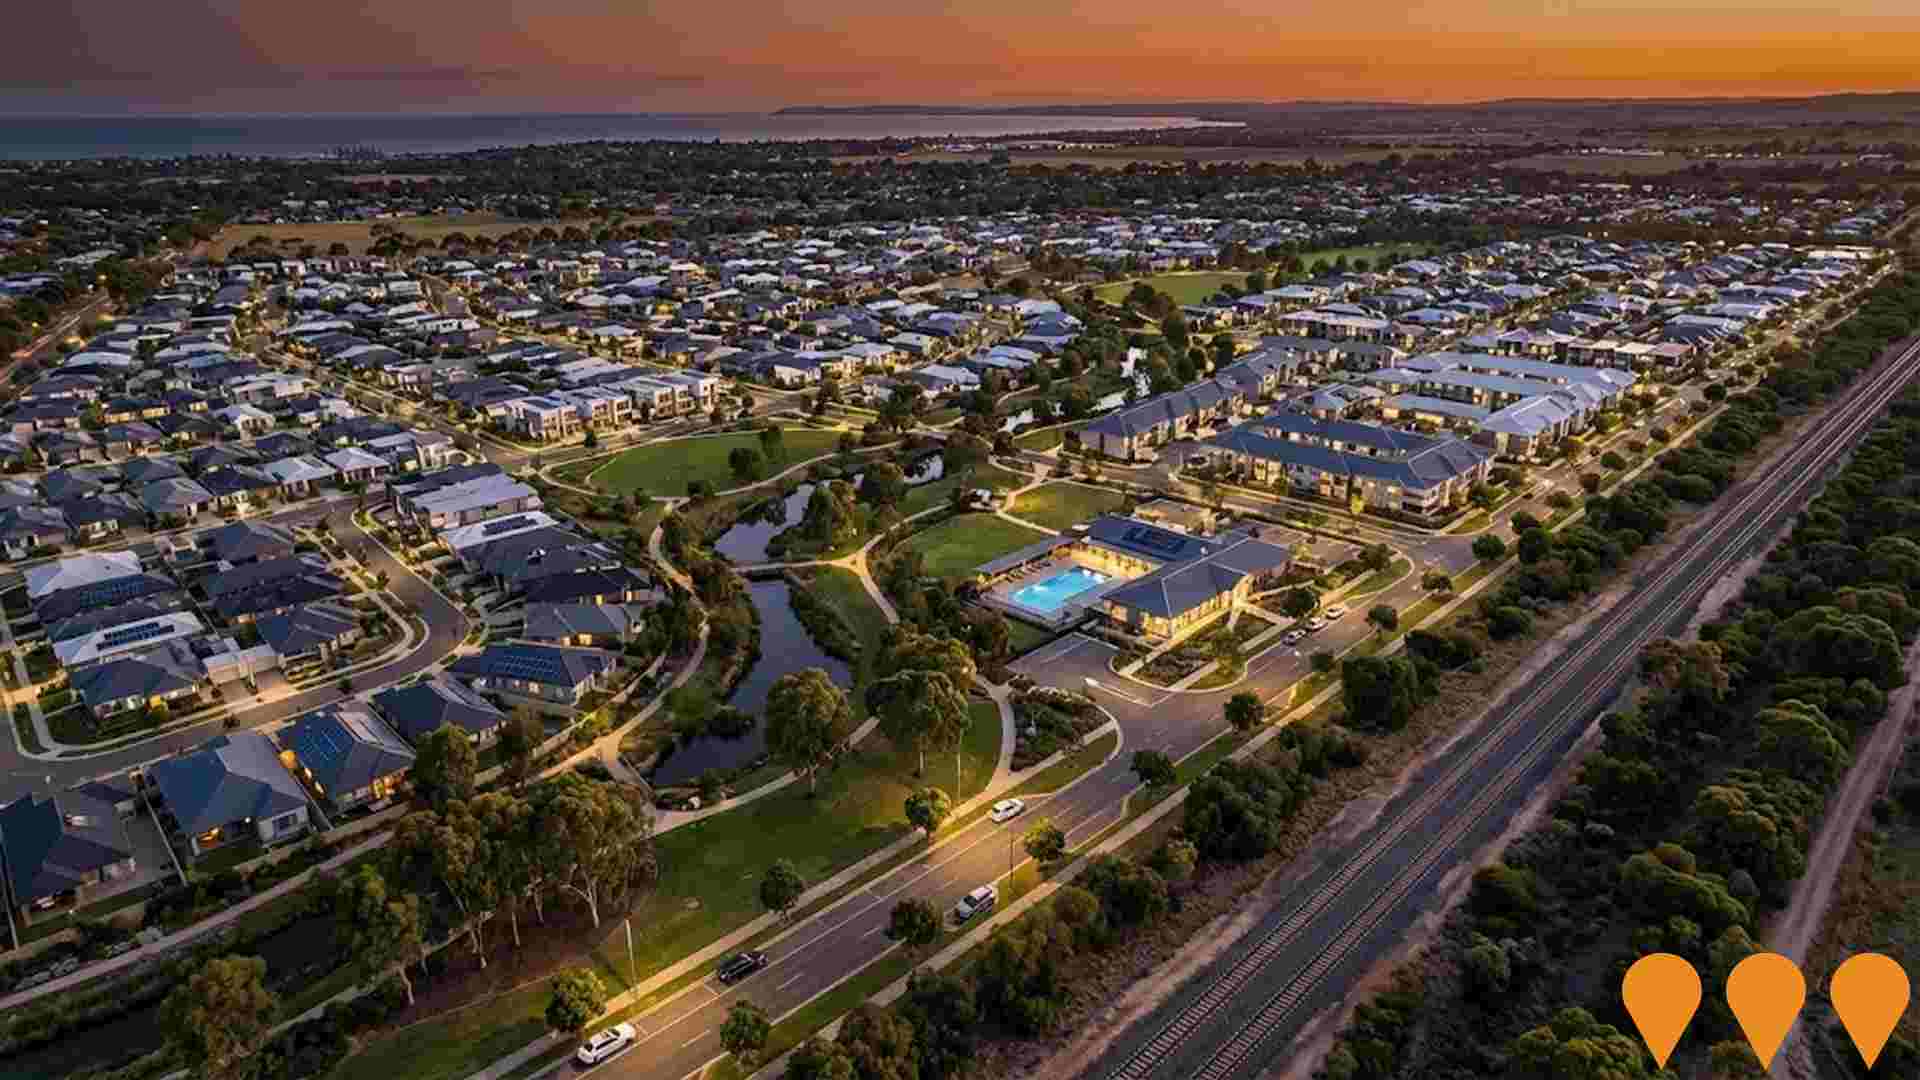
Aldinga - A New Community
46-hectare master-planned net-zero carbon community delivering approximately 850 residential lots including at least 25% affordable housing. Features diverse housing types, a residents club with pool and gym, over-55s lifestyle village, extensive parks, chain-of-ponds water corridors, and energy-efficient homes with solar PV, batteries, heat pumps and community microgrid. Over 40 hectares of land donated for conservation and a 60-metre rail corridor preserved for future Seaford line extension.
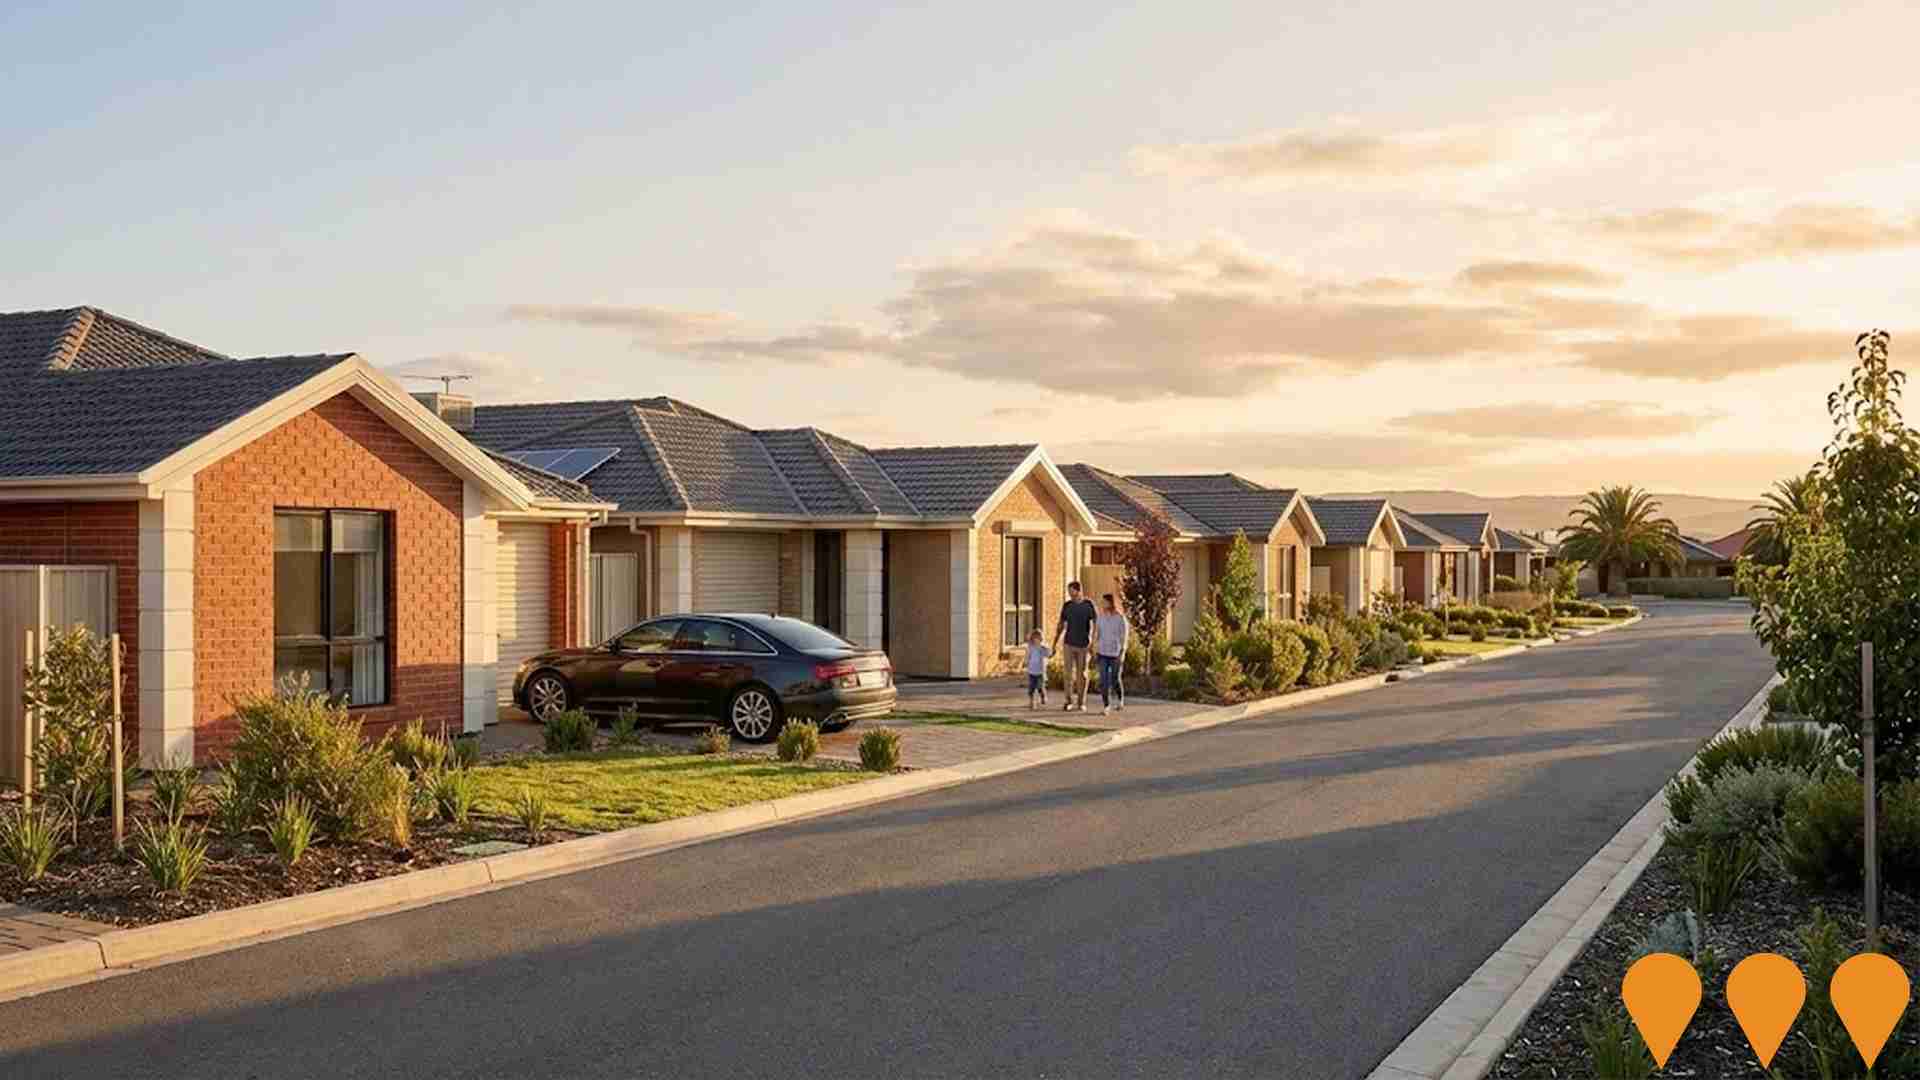
Aldinga Master Planned Community - Villawood Properties
A strategic partnership between Renewal SA and Villawood Properties to create a 46-hectare master planned net zero carbon community delivering over 800 homes, including 200 in an over-55s lifestyle village, with a minimum of 25% affordable housing. Features diverse housing mix (detached, semi-detached, townhouses), extensive open spaces with parks, reserves and chain-of-ponds corridors, residents club with pool, gym, cafe and play spaces, embedded energy network with solar, heat pumps, batteries, microgrid in all-electric development, and 25% tree canopy coverage. Preserves 60-metre wide rail corridor for future Seaford line extension. Master planning underway in 2025, sales launch anticipated for Summer 2025, civil construction to commence in early 2026.
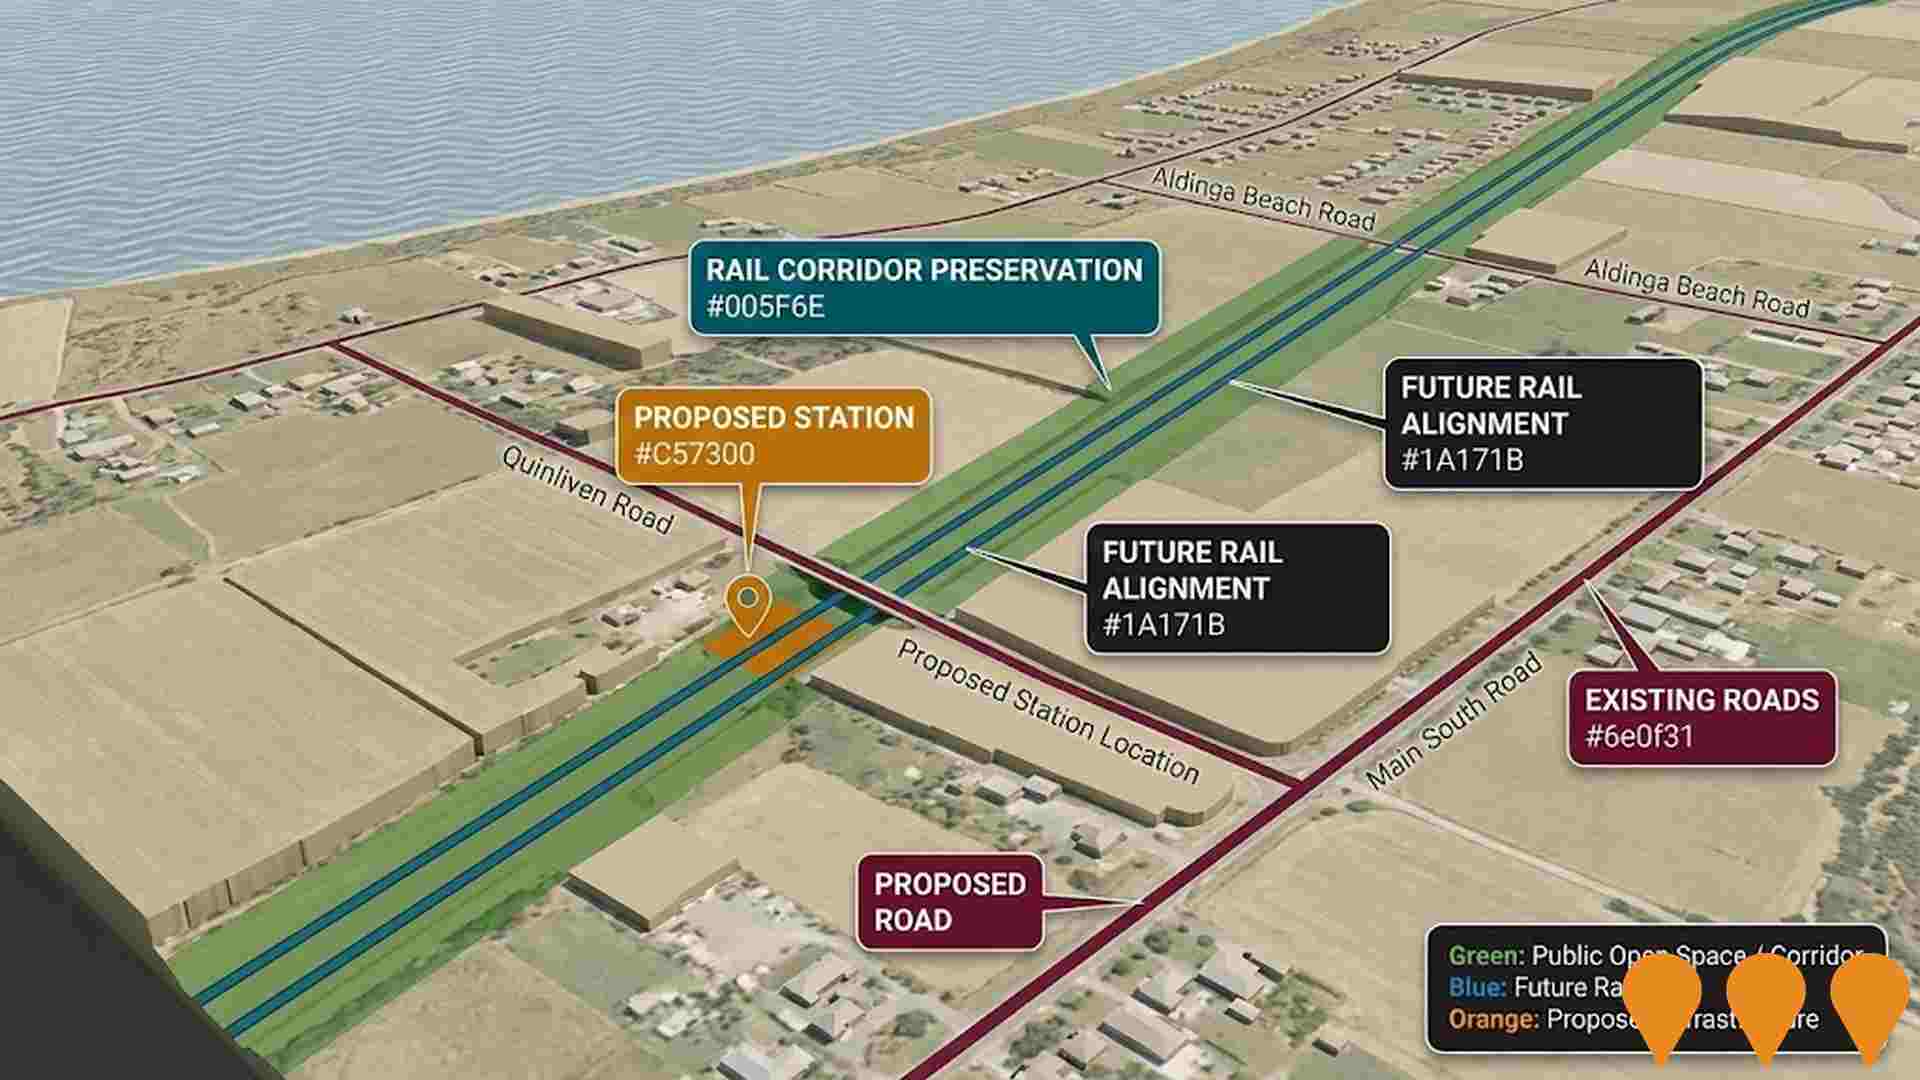
Aldinga Rail Extension Corridor Preservation
Preservation of a 60 metre wide rail corridor from Quinliven Road to Aldinga Beach Road to enable a future extension of the Seaford rail line to Aldinga. Preliminary planning has identified two potential stations (near Aldinga Beach Road with future Park and Ride, and south of Quinliven Road) and an intended grade separated crossing at Quinliven Road. The corridor is currently unfunded and available as public open space until pursued in the 2030s.
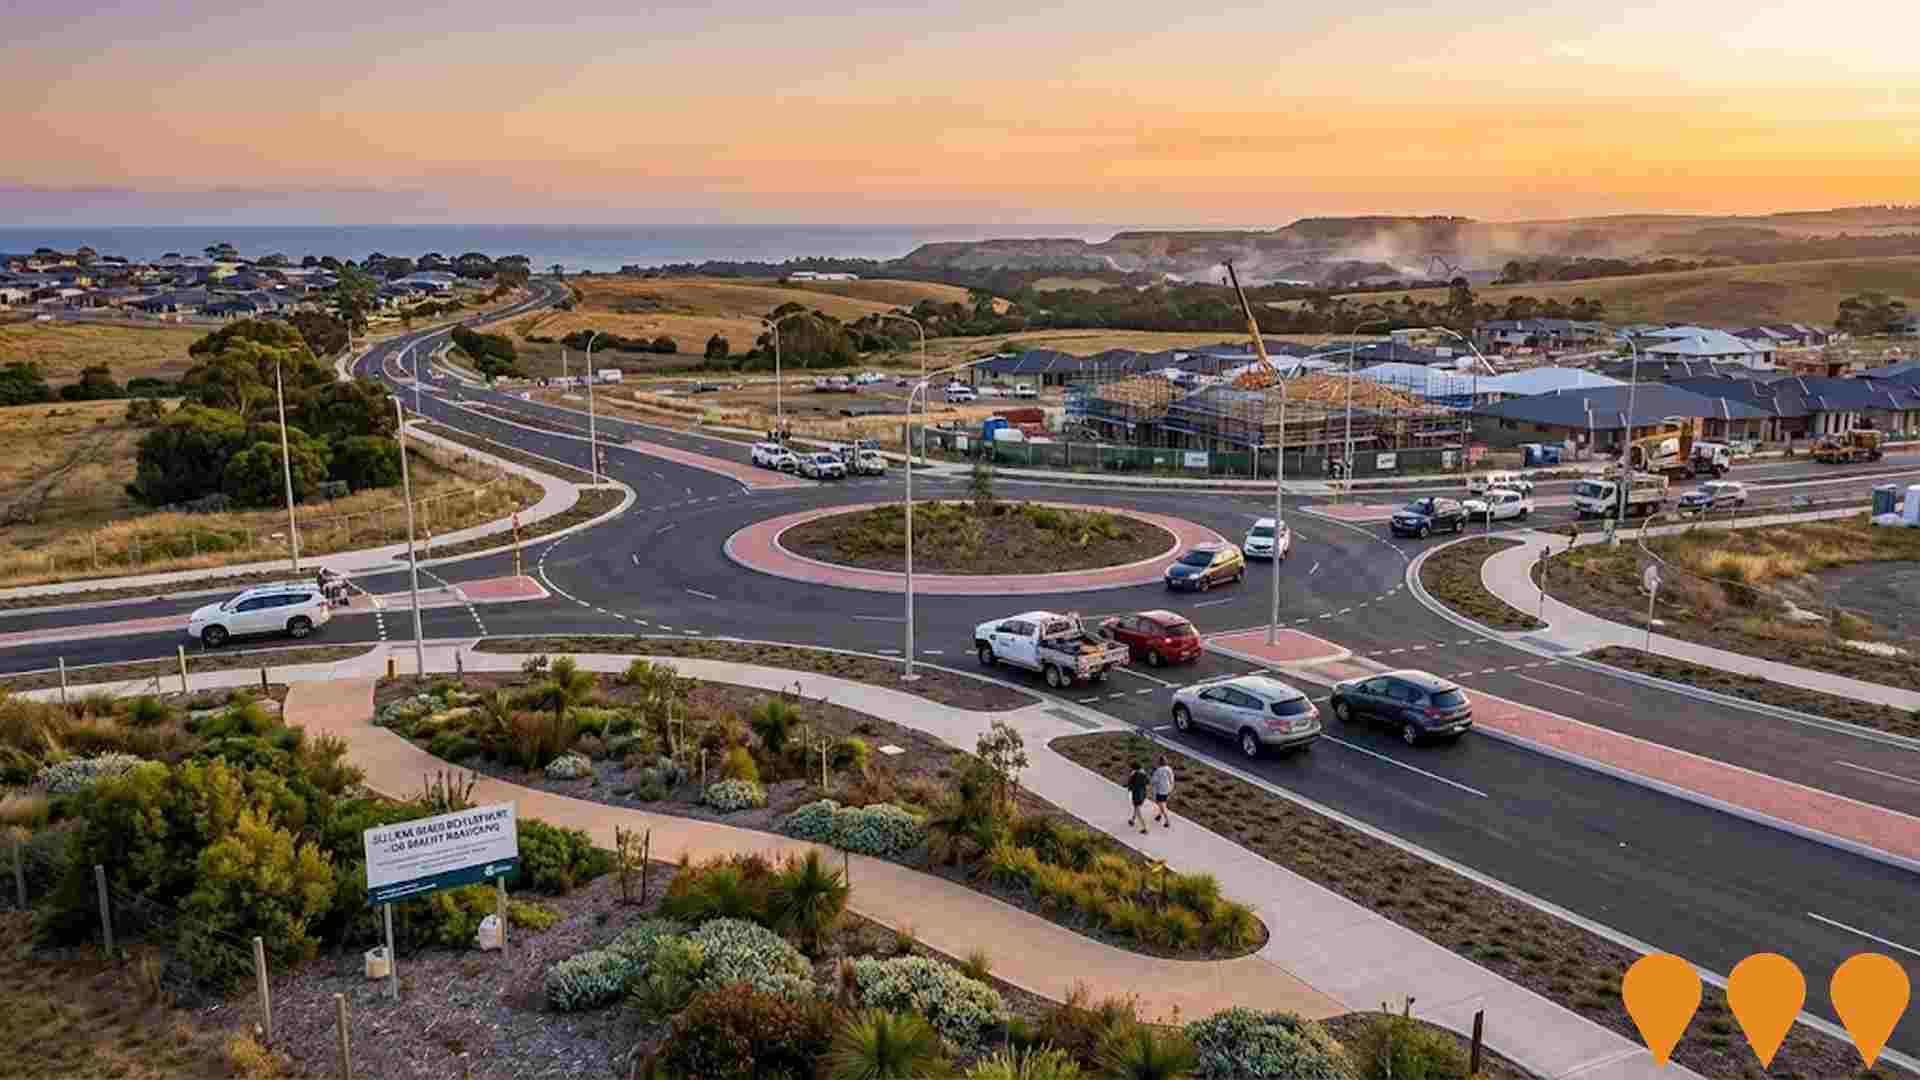
Sellicks Beach Code Amendment
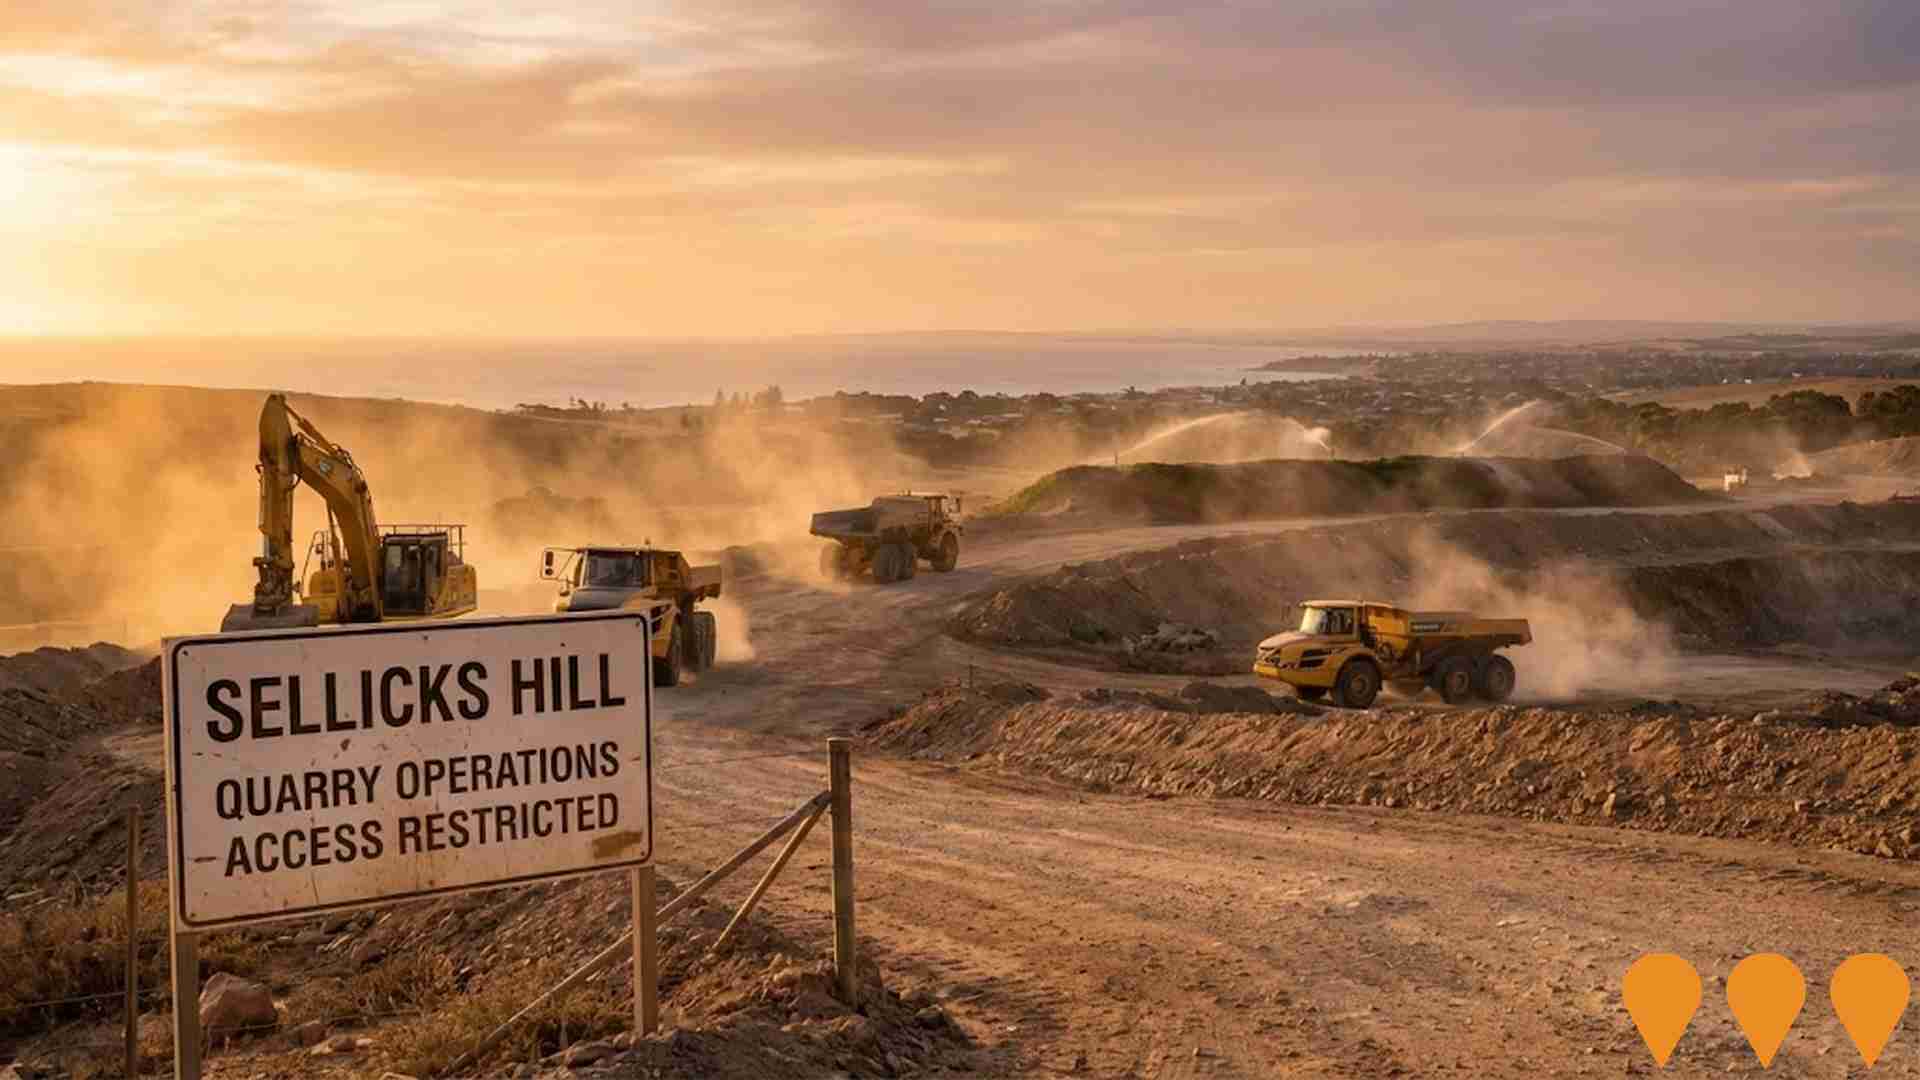
Major master planned residential development for 1,700 new homes across 130 hectares. Includes transport infrastructure upgrades, activity centre, open space network and range of housing options. Air quality assessment underway due to nearby quarry concerns.
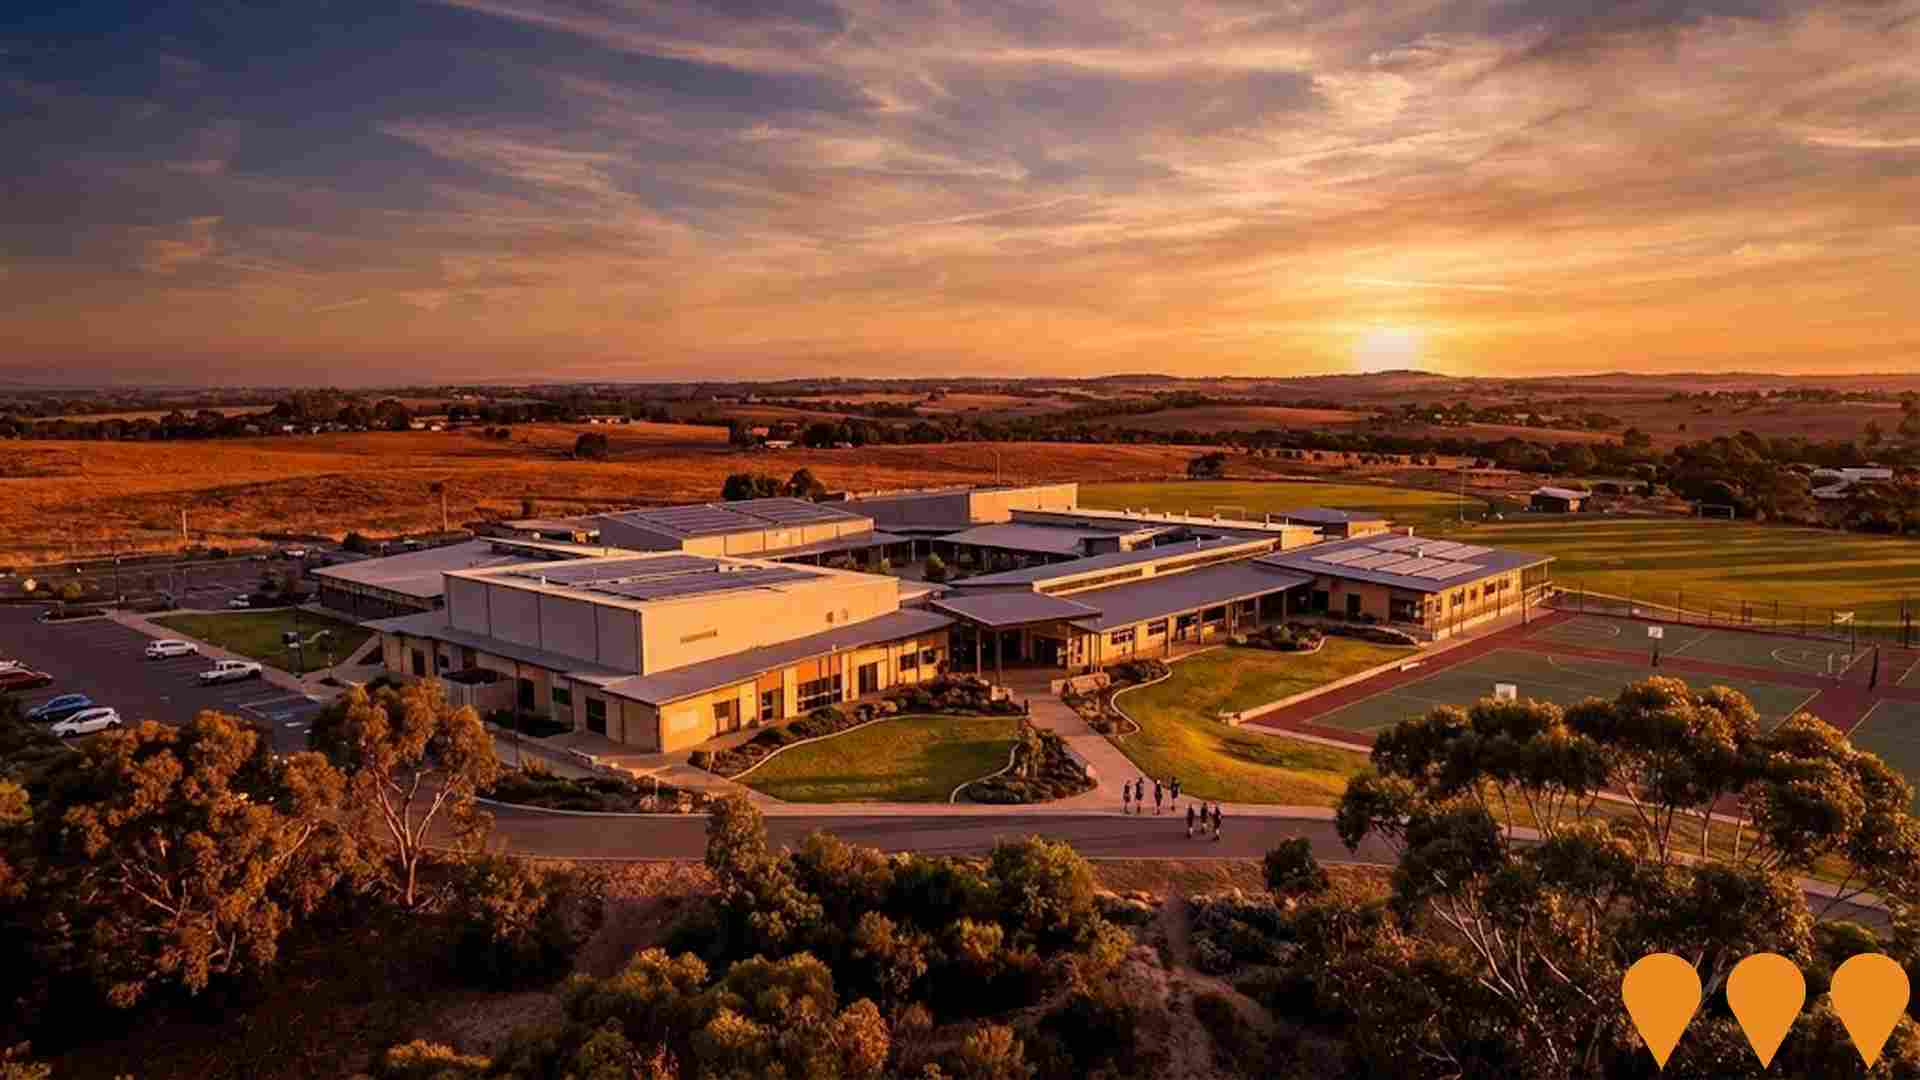
Aldinga Payinthi College
Birth to Year 12 'super school' accommodating up to 1,675 students and 250 staff, including 100 inclusive places for students with disability and 75-place children's centre. $125 million build featuring contemporary learning environments with STEM focus, performing arts theatre, libraries, VET kitchen, gym facilities, sports courts, community usage facilities, and extensive cultural and heritage elements recognizing Aboriginal significance. Construction complete, school open and accommodating up to 1500 students by 2026.
Aldinga Sports Park Master Plan Redevelopment
Multi-million dollar redevelopment of Aldinga Sports Park including Stage 1 (completed 2023) with four state-of-the-art unisex change facilities, new accessible public toilets, upgraded umpire and first aid facilities, amenities for local sports clubs, playground equipment upgrades, and landscaping improvements. Further upgrades include netball court upgrades, new cricket nets, hockey and soccer buildings, new soccer pitch, and relocated equestrian facilities. Future plans include a new skate park and potential $30 million aquatic centre. Aims to create a large sports and community hub integrated with adjacent Aldinga Payinthi College over the next 10+ years.

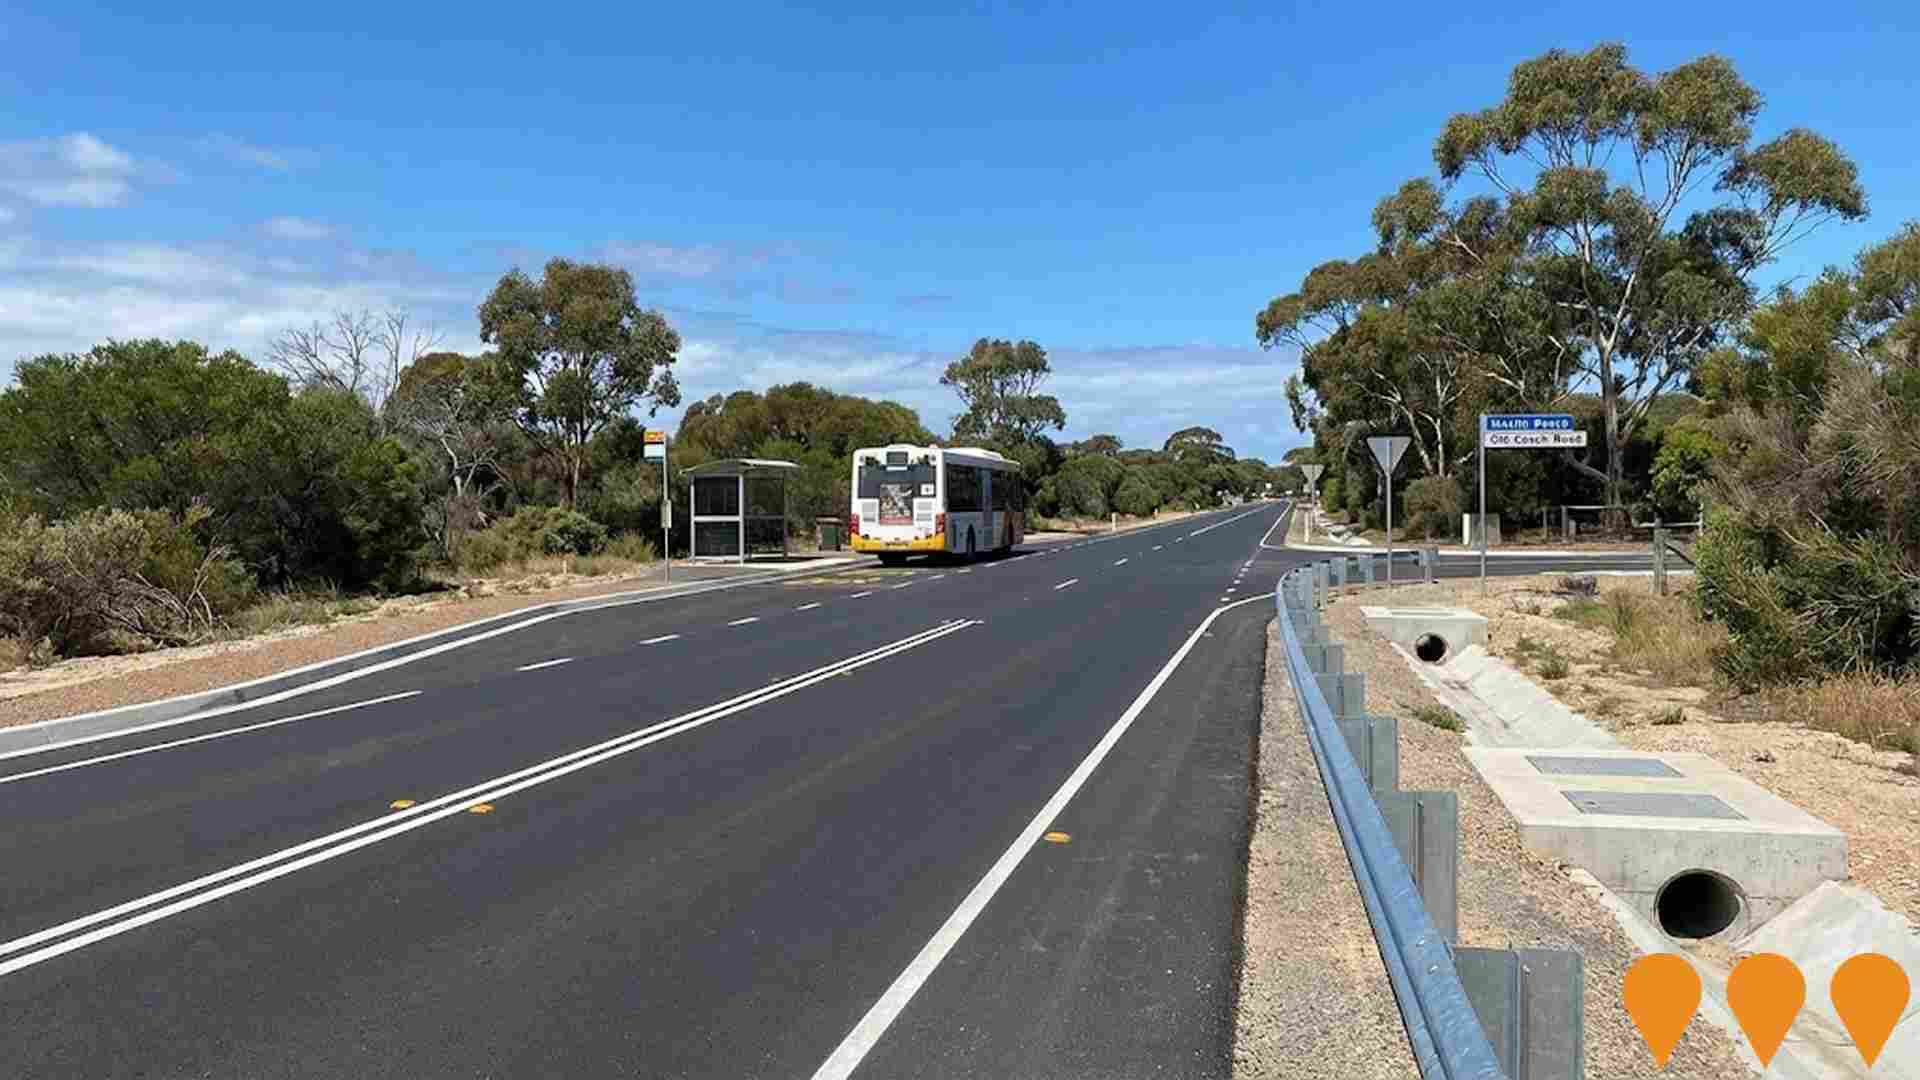
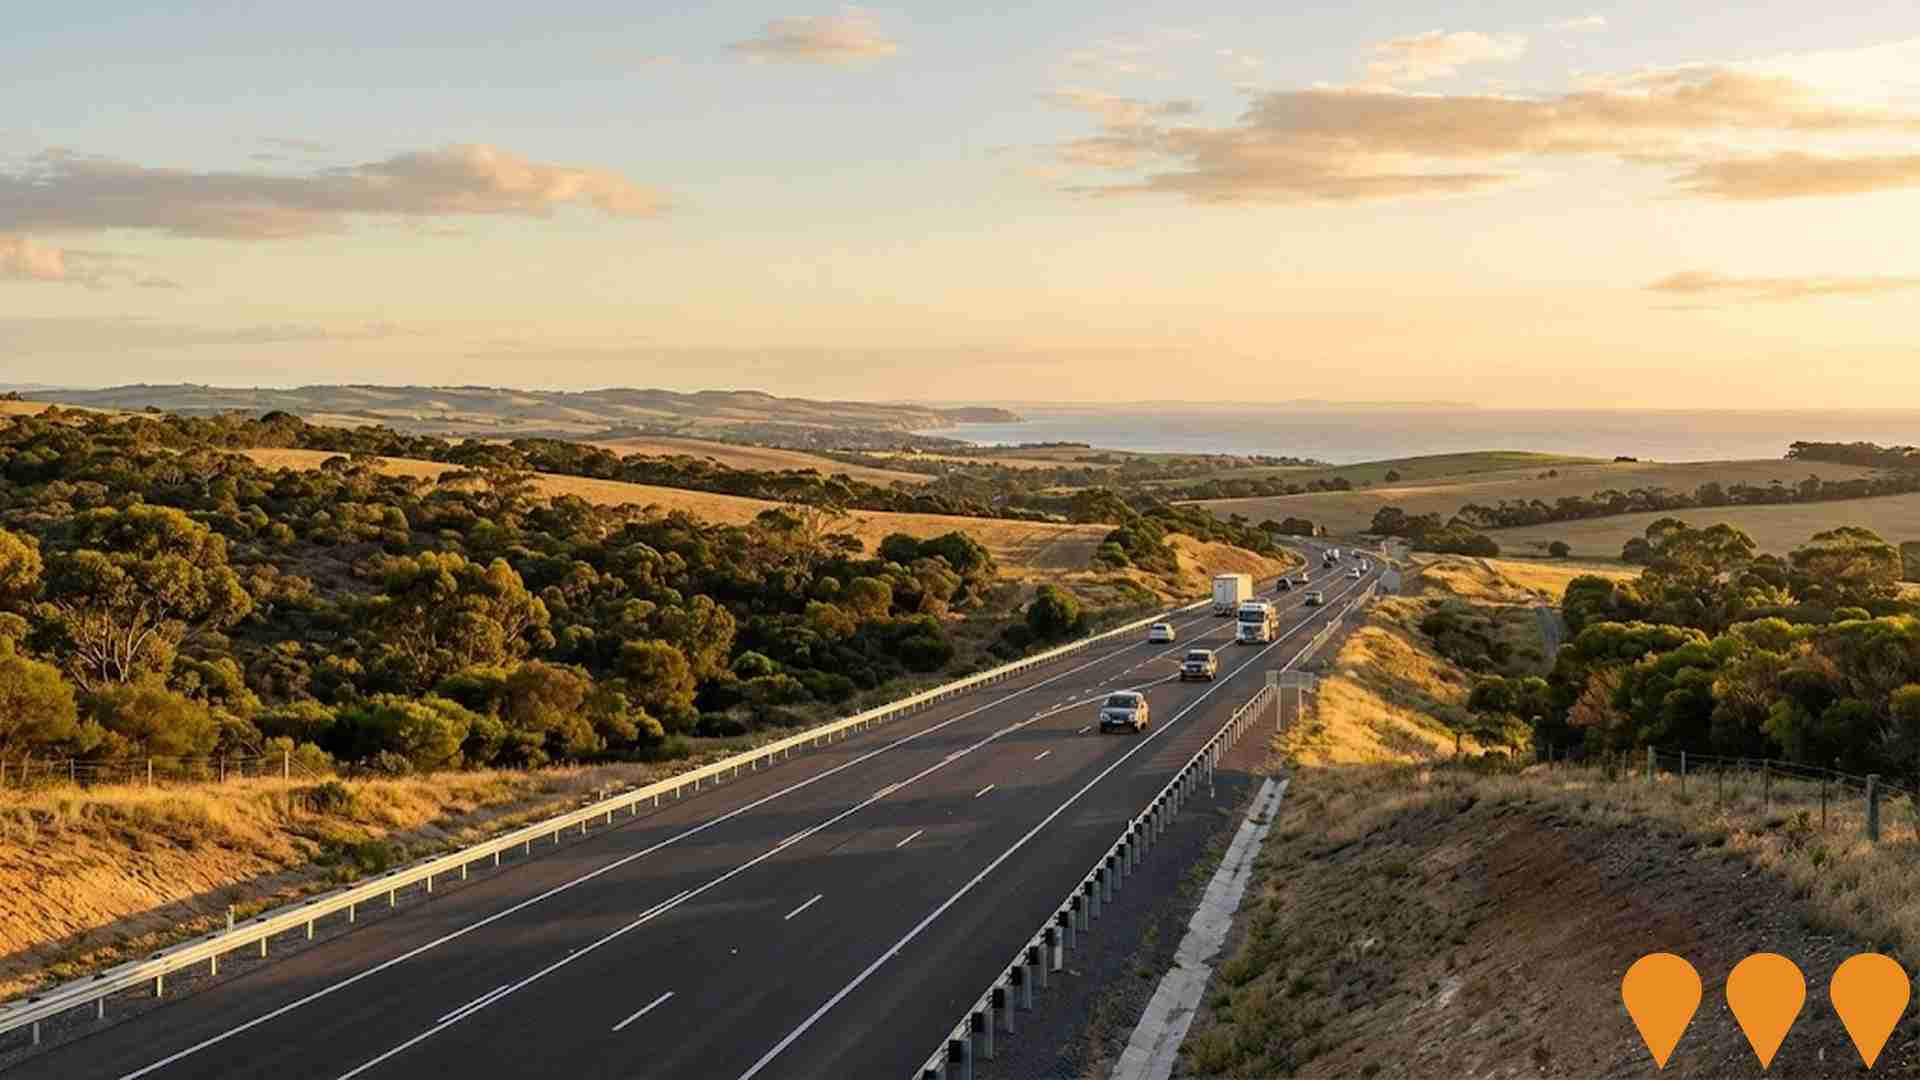
Main South Road Duplication Project (Stage 2) - Aldinga to Sellicks Beach
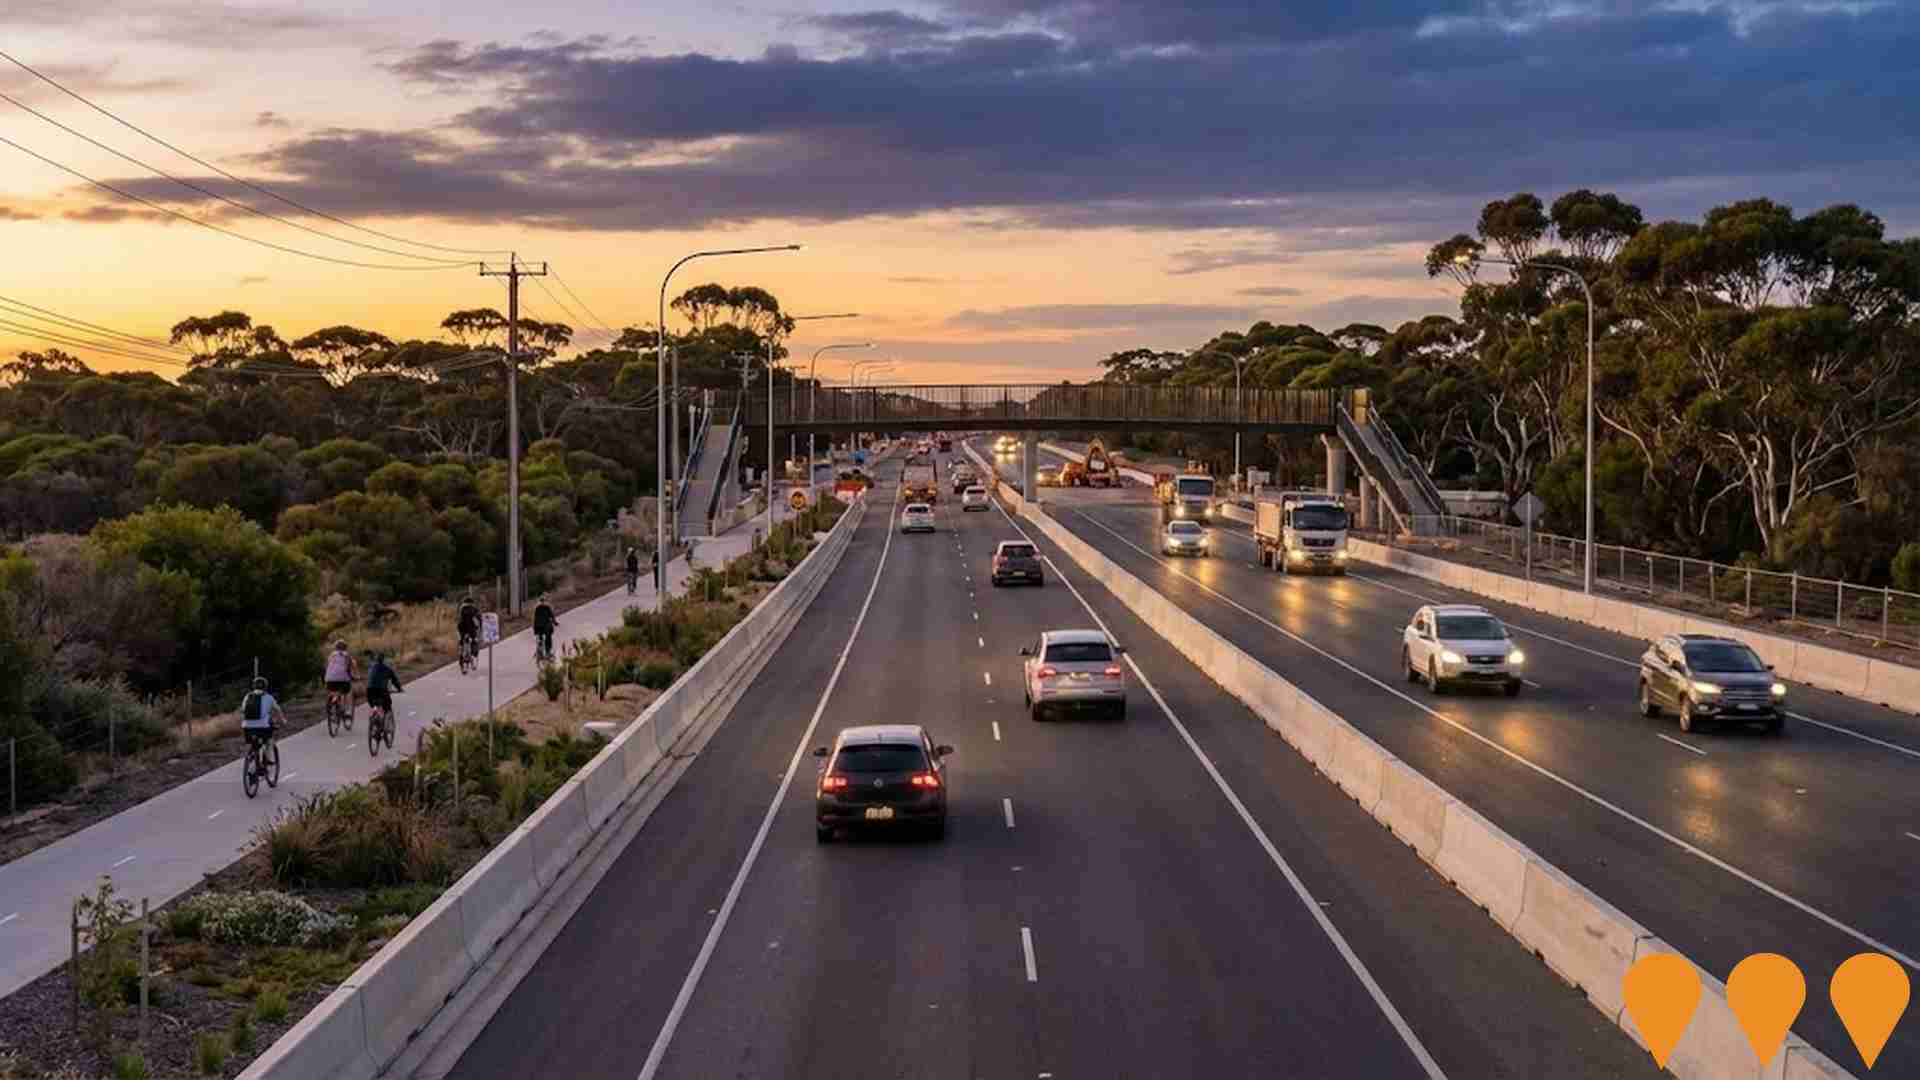
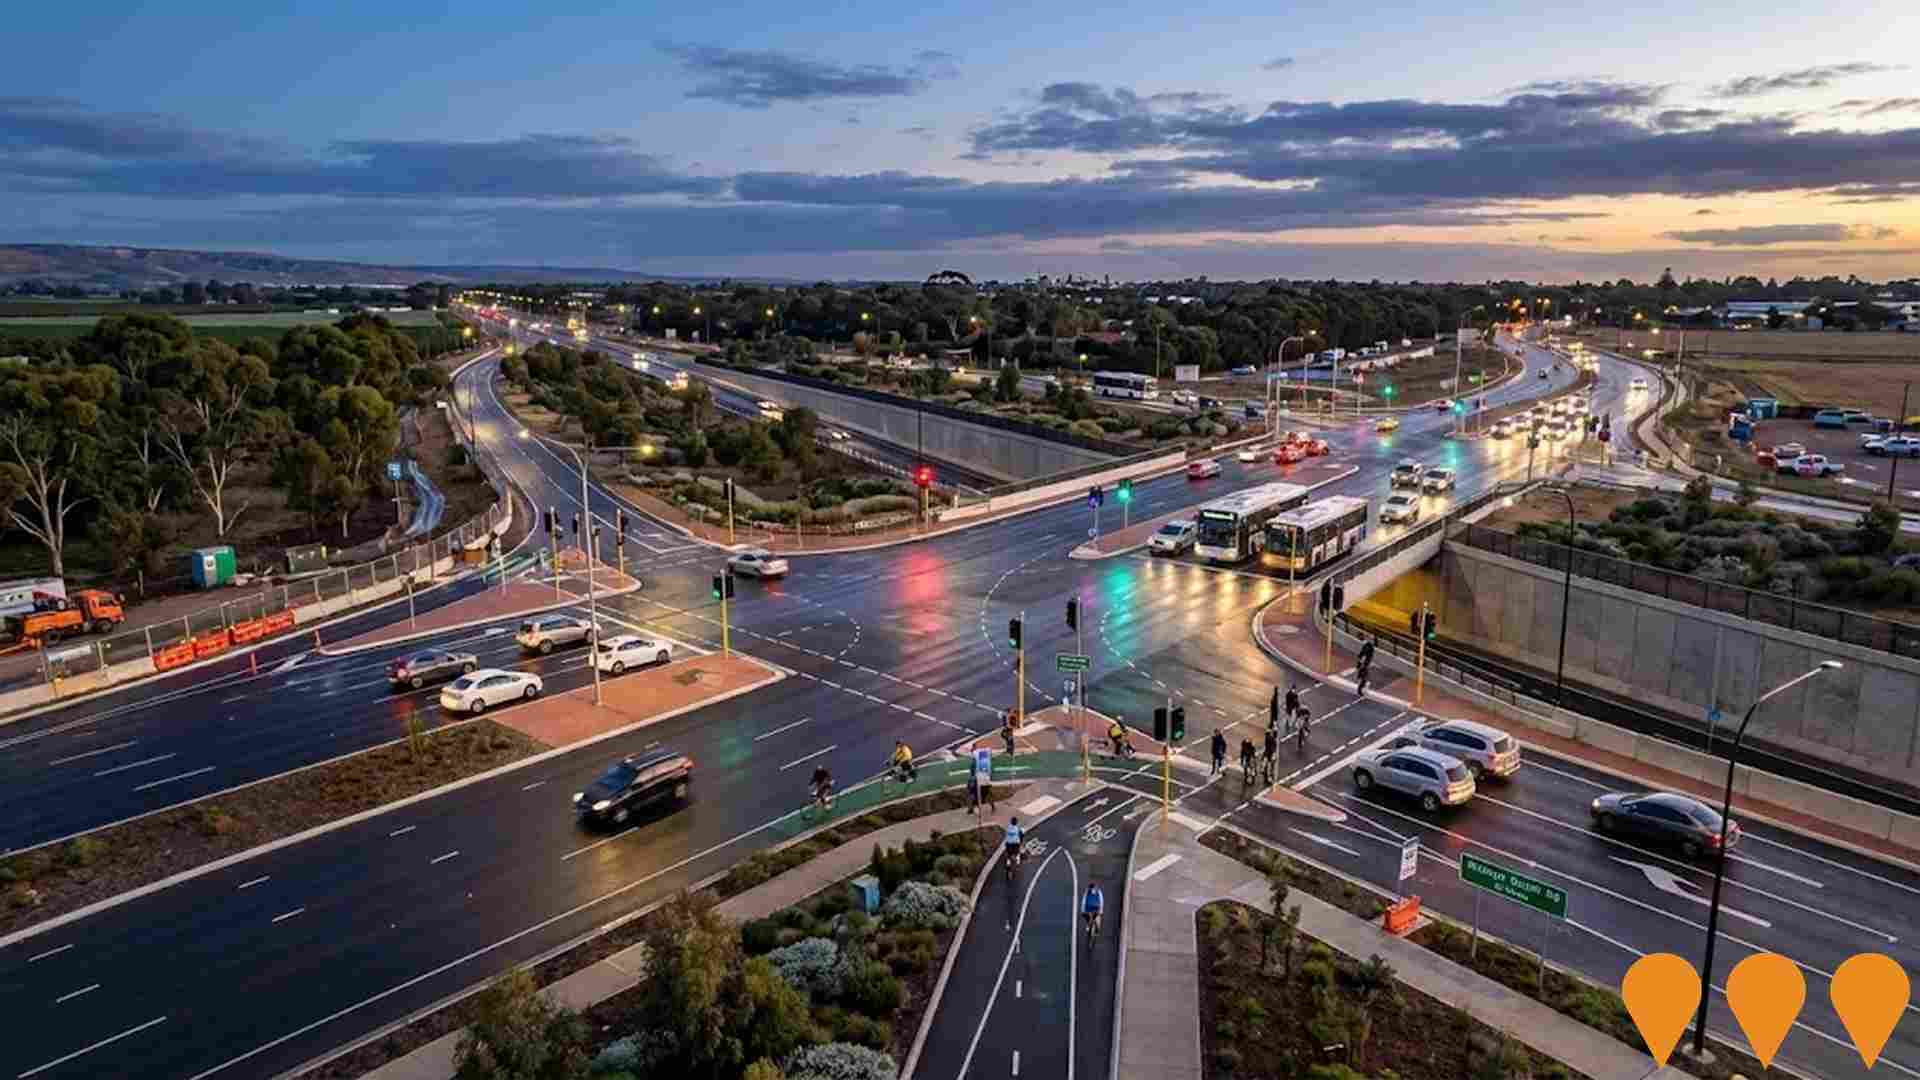
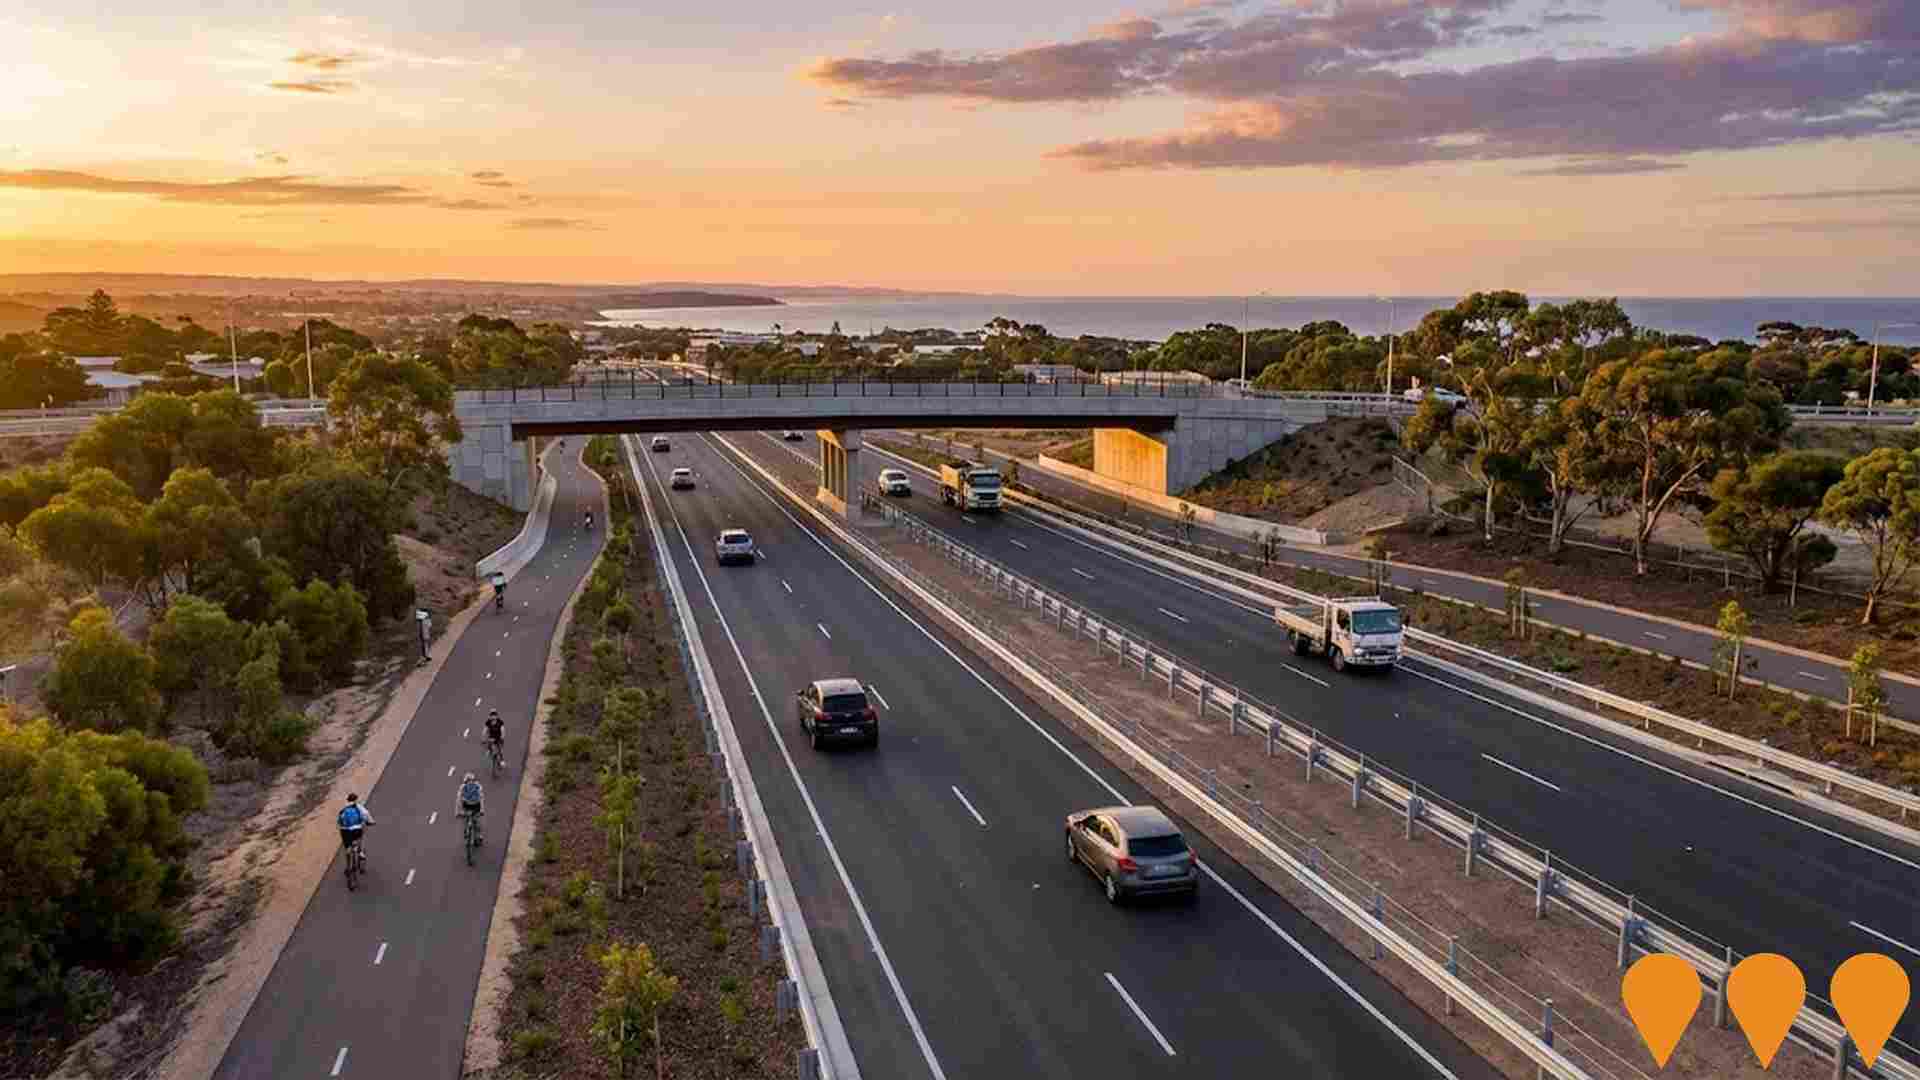
Stage 2 of the Main South Road duplication between Aldinga Beach Road and Sellicks Beach, delivered as part of the approximately $810 million Fleurieu Connections project jointly funded by the Australian and South Australian governments. Works include the new Aldinga Interchange with bridge and underpass, realignment of Aldinga Beach Road and Sellicks Beach Road, intersection upgrades on key local roads, new U-turn facilities, installation of wire rope safety barriers and wide centre medians, and a shared use path along the western side of Main South Road. Construction is well advanced and is expected to be completed in 2026, supporting around 405 full time equivalent jobs during delivery and improving safety, capacity and travel times for motorists accessing southern Adelaide and the Fleurieu region.
Aldinga Ambulance Station Upgrade
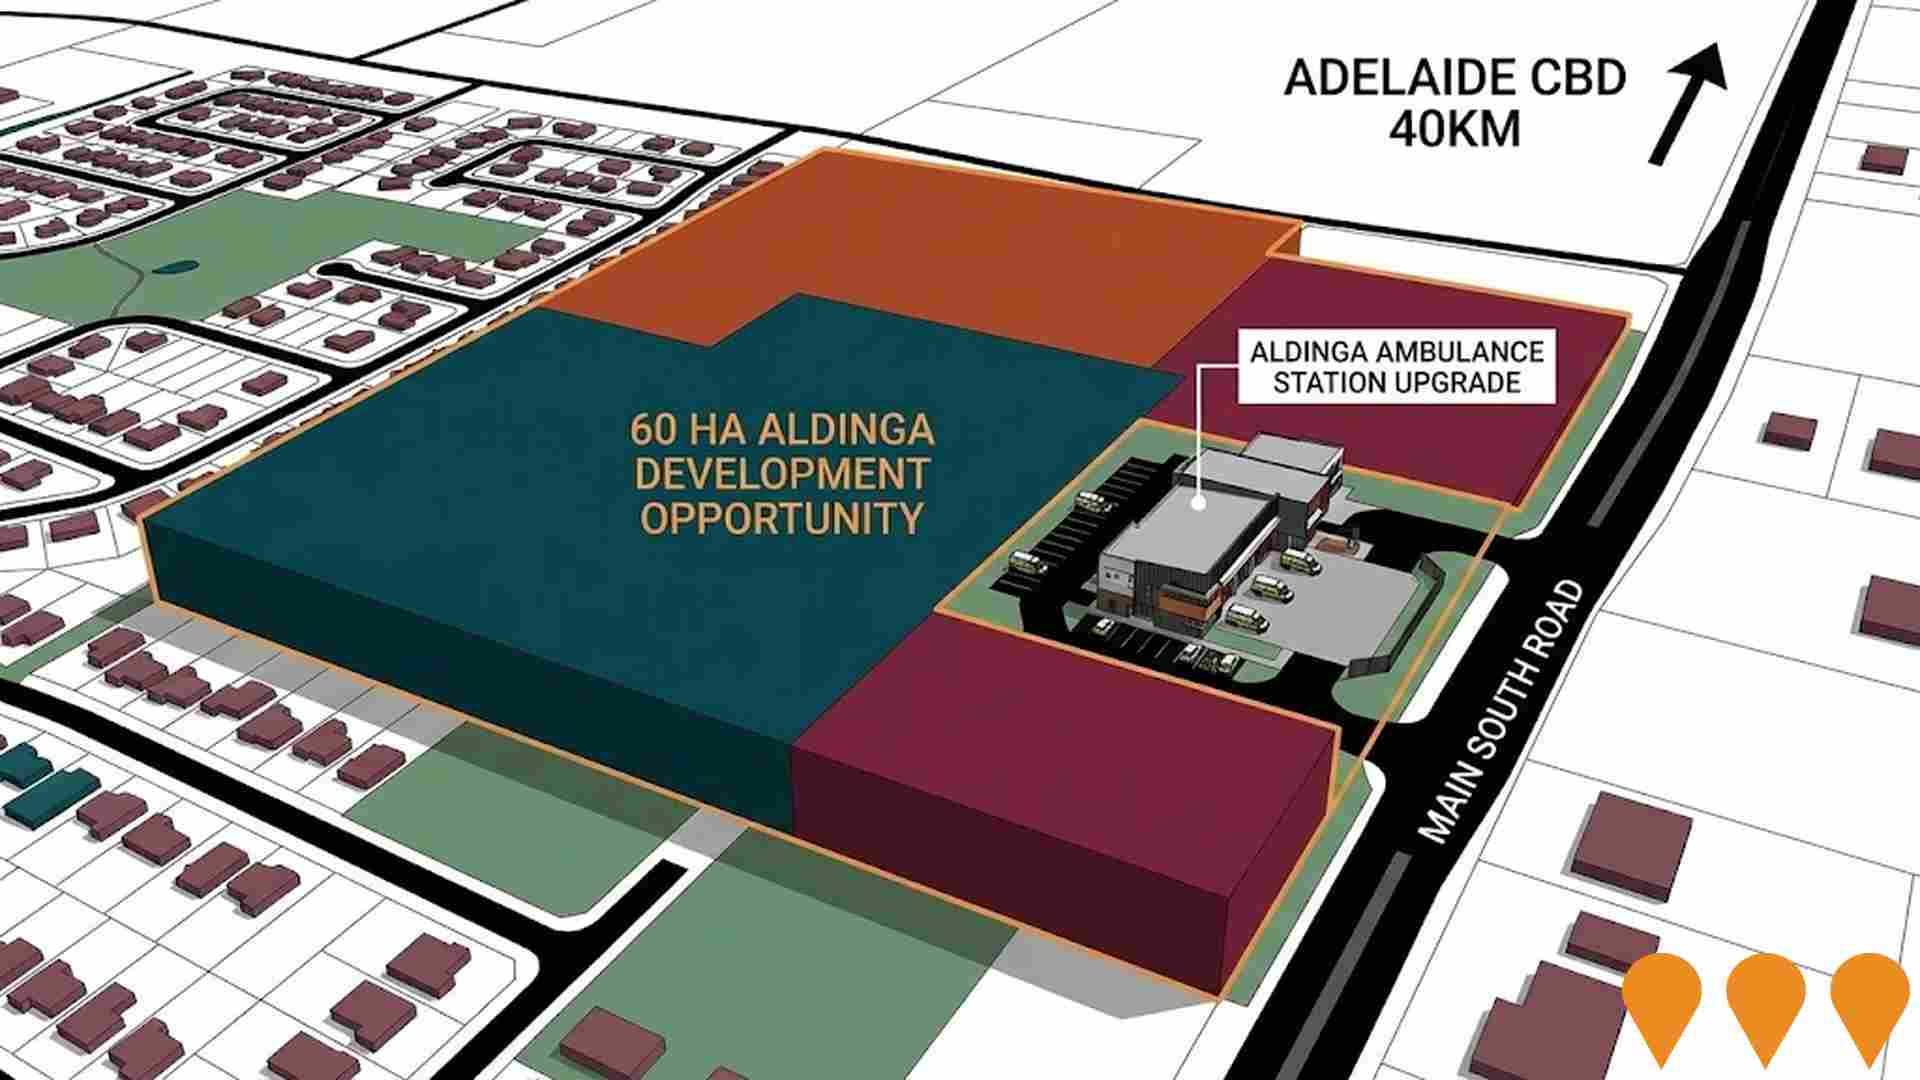
Upgraded ambulance station facility completed in November 2024 as part of broader emergency medical services enhancement across South Australia. Provides improved emergency response capabilities for southern suburbs and Fleurieu Peninsula.
Employment
Employment conditions in Aldinga remain below the national average according to AreaSearch analysis
Aldinga has a skilled workforce with notable representation in essential services sectors. The unemployment rate was 4.8% in September 2025, with an estimated employment growth of 4.4% over the past year.
As of this date, 8,463 residents were employed while the unemployment rate was 0.8% higher than Greater Adelaide's rate of 3.9%. Workforce participation stood at 59.1%, below Greater Adelaide's 61.7%. Key industries for employment among residents are health care & social assistance, construction, and retail trade. Aldinga has a particular employment specialization in construction, with an employment share of 1.5 times the regional level.
In contrast, professional & technical services employ only 4.2% of local workers, compared to Greater Adelaide's 7.3%. The area appears to offer limited local employment opportunities, as indicated by the count of Census working population versus resident population. Over the 12 months to September 2025, employment increased by 4.4%, while labour force grew by 3.7%, leading to a 0.7 percentage point decrease in unemployment rate. In comparison, Greater Adelaide saw employment grow by 3.0% and labour force expand by 2.9%, with unemployment falling by 0.1 percentage points. State-level data from 25-Nov shows SA employment grew by 1.19% year-on-year, adding 10,710 jobs, with the state unemployment rate at 4.0%. This compares favourably to the national unemployment rate of 4.3%, where the state's employment growth outpaced the national average of 0.14%. National employment forecasts from Jobs and Skills Australia project a 6.6% increase over five years and 13.7% over ten years. Applying these projections to Aldinga's employment mix suggests local employment should increase by 6.3% over five years and 13.3% over ten years, based on simple weighting extrapolation for illustrative purposes only.
Frequently Asked Questions - Employment
Income
Income figures position the area below 75% of locations analysed nationally by AreaSearch
AreaSearch's latest postcode level ATO data for financial year 2022 shows that Aldinga SA2 has lower income compared to national averages. The median income is $46,734 and the average income is $54,294. In contrast, Greater Adelaide has a median income of $52,592 and an average income of $64,886. Based on Wage Price Index growth of 12.83% since financial year 2022, estimated incomes as of September 2025 would be approximately $52,730 (median) and $61,260 (average). Census 2021 income data indicates that Aldinga's household, family, and personal incomes all fall between the 21st and 23rd percentiles nationally. Income distribution shows that the $1,500 - 2,999 bracket dominates with 31.4% of residents (5,304 people), similar to the surrounding region at 31.8%. Housing affordability pressures are severe in Aldinga, with only 82.8% of income remaining, ranking at the 20th percentile nationally.
Frequently Asked Questions - Income
Housing
Aldinga is characterized by a predominantly suburban housing profile, with a higher proportion of rental properties than the broader region
Aldinga's dwelling structure, as per the latest Census, had 91.4% houses and 8.6% other dwellings (semi-detached, apartments, 'other' dwellings). This compares to Adelaide metro's 89.2% houses and 10.7% other dwellings. Home ownership in Aldinga was at 29.8%, with the rest either mortgaged (44.7%) or rented (25.6%). The median monthly mortgage repayment was $1,400, lower than Adelaide metro's $1,452. Median weekly rent was $320, compared to Adelaide metro's $314. Nationally, Aldinga's mortgage repayments were significantly lower at $1,400 versus the Australian average of $1,863, and rents were substantially below the national figure of $375.
Frequently Asked Questions - Housing
Household Composition
Aldinga has a typical household mix, with a fairly typical median household size
Family households account for 70.7% of all households, including 27.8% couples with children, 26.8% couples without children, and 15.4% single parent families. Non-family households make up the remaining 29.3%, with lone person households at 26.5% and group households comprising 2.7%. The median household size is 2.5 people, which aligns with the Greater Adelaide average.
Frequently Asked Questions - Households
Local Schools & Education
Educational outcomes in Aldinga fall within the lower quartile nationally, indicating opportunities for improvement in qualification attainment
The area's university qualification rate is 17.3%, significantly lower than the Australian average of 30.4%. This disparity presents both a challenge and an opportunity for targeted educational initiatives. Bachelor degrees are the most common at 12.0%, followed by postgraduate qualifications (3.1%) and graduate diplomas (2.2%). Vocational credentials are prevalent, with 43.4% of residents aged 15+ holding them, including advanced diplomas (10.6%) and certificates (32.8%).
Educational participation is high, with 29.2% of residents currently enrolled in formal education. This includes 12.4% in primary education, 7.7% in secondary education, and 3.4% pursuing tertiary education.
Frequently Asked Questions - Education
Schools Detail
Nearby Services & Amenities
Transport
Transport servicing is low compared to other areas nationally based on assessment of service frequency, route connectivity and accessibility
The public transport analysis indicates that Aldinga has 115 active transport stops, all of which are bus stops. These stops are served by 11 different routes, offering a total of 621 weekly passenger trips. The accessibility to transport is rated as excellent, with residents being an average of 199 meters away from the nearest stop.
On average, there are 88 trips per day across all routes, which equates to approximately five weekly trips per individual stop.
Frequently Asked Questions - Transport
Transport Stops Detail
Health
Health performance in Aldinga is lower than average with common health conditions somewhat prevalent across both younger and older age cohorts
Aldinga faces significant health challenges. Common health conditions are somewhat prevalent among both younger and older age cohorts.
The rate of private health cover is very low at approximately 47% of the total population (~7,973 people), compared to the national average of 55.3%. The most common medical conditions in the area are mental health issues and arthritis, impacting 10.2 and 9.5% of residents respectively. Sixty-four point one percent of residents declared themselves completely clear of medical ailments, compared to 62.9% across Greater Adelaide. Twenty point zero percent of residents are aged 65 and over (3,381 people). Health outcomes among seniors present some challenges, broadly in line with the general population's health profile.
Frequently Asked Questions - Health
Cultural Diversity
Aldinga ranks below the Australian average when compared to other local markets across a number of language and cultural background related metrics
Aldinga's cultural diversity was found to be below average, with 79.4% of its population born in Australia, 89.8% being citizens, and 95.9% speaking English only at home. Christianity is the dominant religion in Aldinga, comprising 31.1% of people there. Notably, the category 'Other' comprises 0.5% of Aldinga's population compared to 0.7% across Greater Adelaide.
The top three ancestry groups in Aldinga are English (37.5%), Australian (27.6%), and Scottish (7.8%). There are also notable differences in the representation of certain ethnic groups: German is overrepresented at 5.1% in Aldinga compared to 5.4% regionally, Dutch remains consistent at 1.7%, while Welsh is slightly underrepresented at 0.7% compared to 0.8%.
Frequently Asked Questions - Diversity
Age
Aldinga's population is slightly older than the national pattern
The median age in Aldinga is 40 years, similar to Greater Adelaide's average of 39 years but somewhat older than Australia's median age of 38 years. The 5-14 age group comprises 13.3% of Aldinga's population, higher than Greater Adelaide's percentage. Conversely, the 25-34 cohort makes up 10.9%, which is less prevalent compared to Greater Adelaide. Post-2021 Census data shows that the 75-84 age group has increased from 5.6% to 7.0% of Aldinga's population, while the 5-14 cohort has declined from 14.5% to 13.3%. Population forecasts for 2041 indicate substantial demographic changes in Aldinga. Notably, the 85+ age group is expected to grow by 147%, reaching 826 people from 334. The combined 65+ age groups will account for 75% of total population growth, reflecting Aldinga's aging demographic profile. In contrast, the 0-4 and 35-44 cohorts are expected to experience population declines.
