Chart Color Schemes
This analysis uses ABS Statistical Areas Level 2 (SA2) boundaries, which can materially differ from Suburbs and Localities (SAL) even when sharing similar names.
SA2 boundaries are defined by the Australian Bureau of Statistics and are designed to represent communities for statistical reporting (e.g., census and ERP).
Suburbs and Localities (SAL) represent commonly-used suburb/locality names (postal-style areas) and may use different geographic boundaries. For comprehensive analysis, consider reviewing both boundary types if available.
est. as @ -- *
ABS ERP | -- people | --
2021 Census | -- people
Sales Activity
Curious about local property values? Filter the chart to assess the volume and appreciation (including resales) trends and regional comparisons, or scroll to the map below view this information at an individual property level.
Find a Recent Sale
Sales Detail
Population
Population growth drivers in Underwood are strong compared to national averages based on AreaSearch's ranking of recent, and medium to long-term trends
Underwood's population was approximately 7,483 as of November 2025, reflecting a growth of 674 people since the 2021 Census. This increase represents a 9.9% rise from the previous population count of 6,809. The change is inferred from ABS's estimated resident population of 7,415 in June 2024 and an additional 140 validated new addresses since the Census date. Underwood's population density was 1,785 persons per square kilometer, exceeding the average seen across national locations assessed by AreaSearch. The area's growth rate of 9.9% since the 2021 census surpassed the SA3 area's 6.1% and the national average, positioning Underwood as a growth leader in the region. Overseas migration contributed approximately 61.8% of overall population gains during recent periods.
AreaSearch adopts ABS/Geoscience Australia projections for each SA2 area, released in 2024 with 2022 as the base year. For areas not covered by this data and years post-2032, Queensland State Government's SA2 area projections are used, released in 2023 based on 2021 data. These state projections do not provide age category splits; thus, AreaSearch applies proportional growth weightings aligned with ABS Greater Capital Region projections for each age cohort, released in 2023 based on 2022 data. Future population trends project an above median growth for the area, with Underwood expected to expand by 1,084 persons to 2041, reflecting a total gain of 13.6% over the 17 years.
Frequently Asked Questions - Population
Development
AreaSearch assessment of residential approval activity sees Underwood among the top 30% of areas assessed nationwide
Underwood averaged approximately 49 new dwelling approvals annually between FY21 and FY25. A total of 248 homes were approved during these five financial years, with an additional 16 approved so far in FY26. This equates to around 2.4 people moving to the area per new home constructed over the past five financial years, indicating robust demand that supports property values.
The average construction cost value of new homes was approximately $430,000, suggesting developers are targeting the premium market segment with higher-end properties. In FY26, $9.0 million in commercial approvals have been registered, reflecting the area's residential character. Compared to Greater Brisbane, Underwood has 151.0% more new home approvals per person. This abundance of new homes provides buyers with ample choice. The current building activity shows a split of 35.0% detached dwellings and 65.0% attached dwellings, offering affordable entry pathways and attracting downsizers, investors, and first-time purchasers. This shift reflects the reduced availability of development sites and addresses changing lifestyle demands and affordability requirements, marking a significant change from the current housing mix, which is predominantly houses (85.0%).
With around 230 people per dwelling approval, Underwood demonstrates a developing market. According to AreaSearch's latest quarterly estimate, Underwood is projected to gain approximately 1,016 residents by 2041. Based on current development patterns, new housing supply should readily meet demand, offering favorable conditions for buyers and potentially facilitating population growth beyond current projections.
Frequently Asked Questions - Development
Infrastructure
Underwood has very high levels of nearby infrastructure activity, ranking in the top 20% nationally
Changes in local infrastructure significantly affect an area's performance. AreaSearch has identified 23 projects that could impact this region. Major initiatives include Penrose Place Estate, Underwood Central, South East Busway extension to Springwood (due for completion in December 2021), and Eight Mile Plains Shopping Centre Expansion (commencing in late 2022). The following list details those projects most likely to be relevant:.
Professional plan users can use the search below to filter and access additional projects.
INFRASTRUCTURE SEARCH
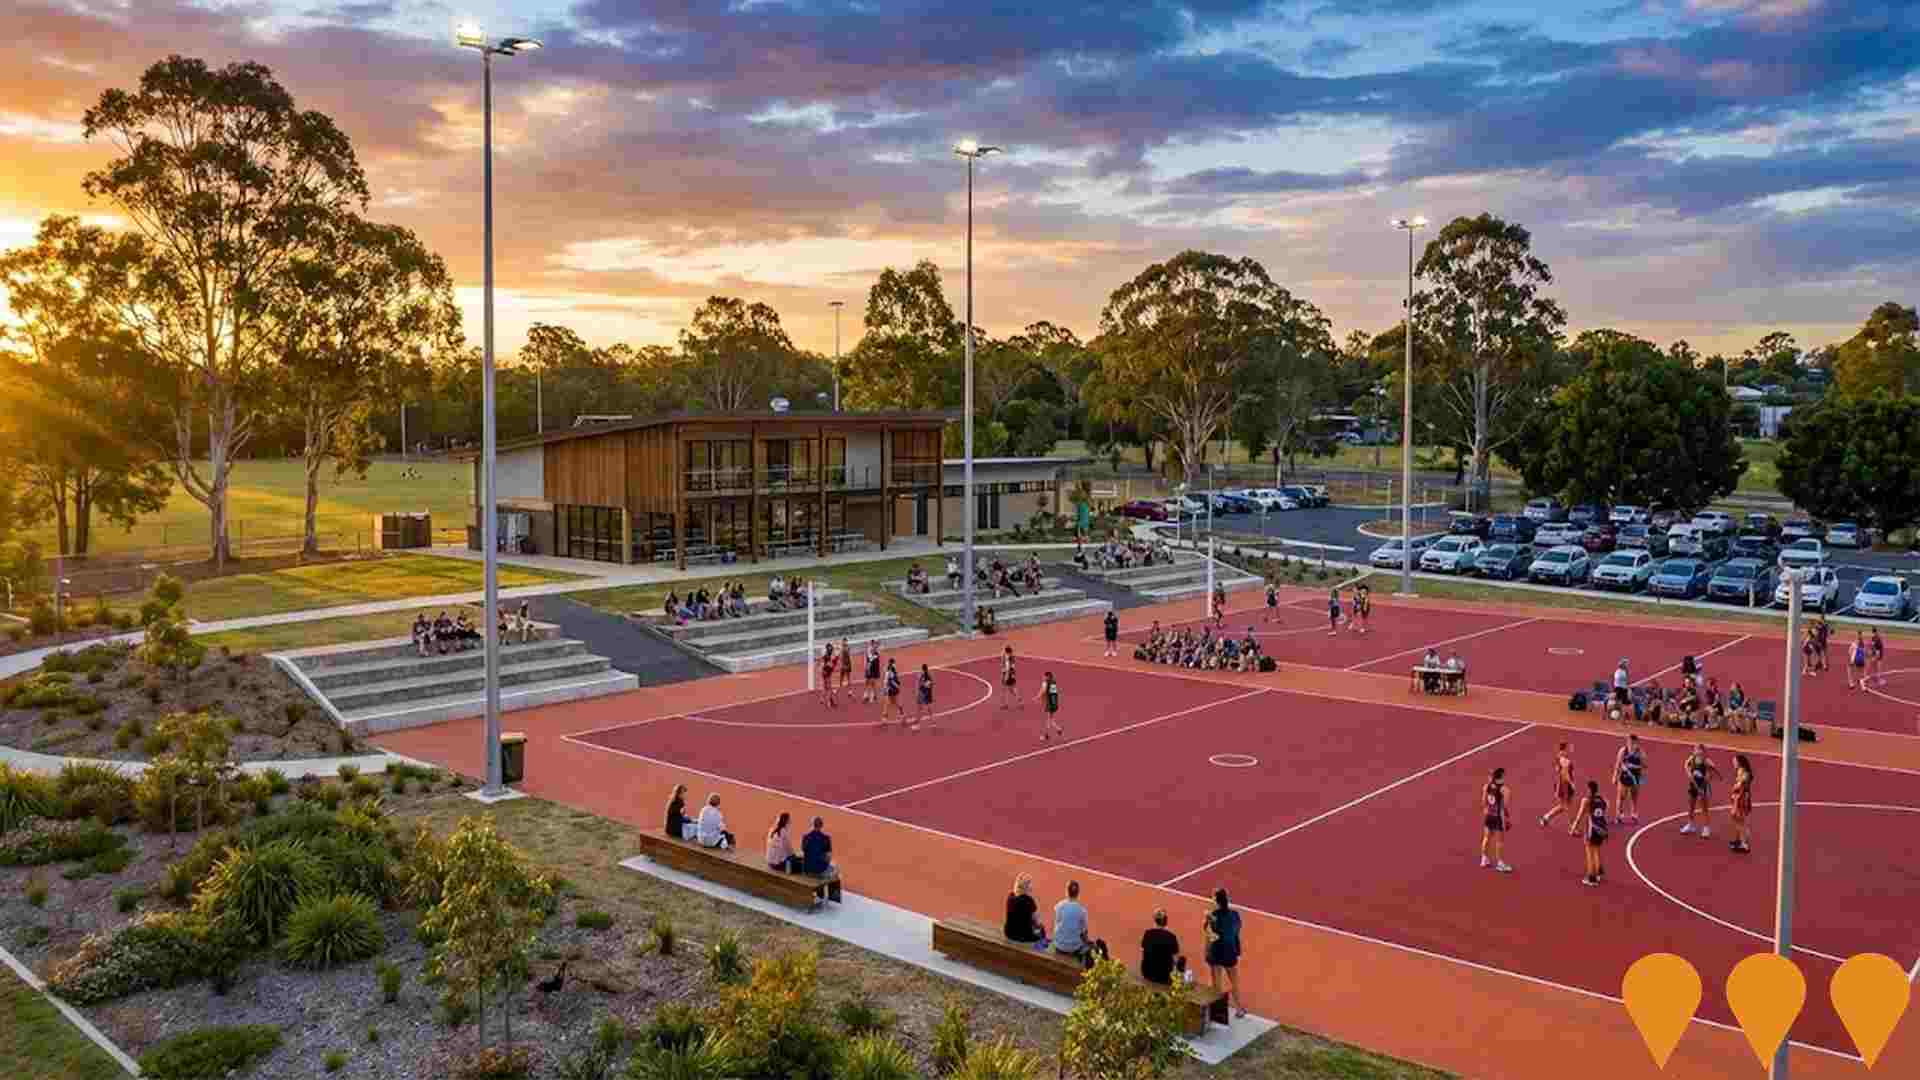
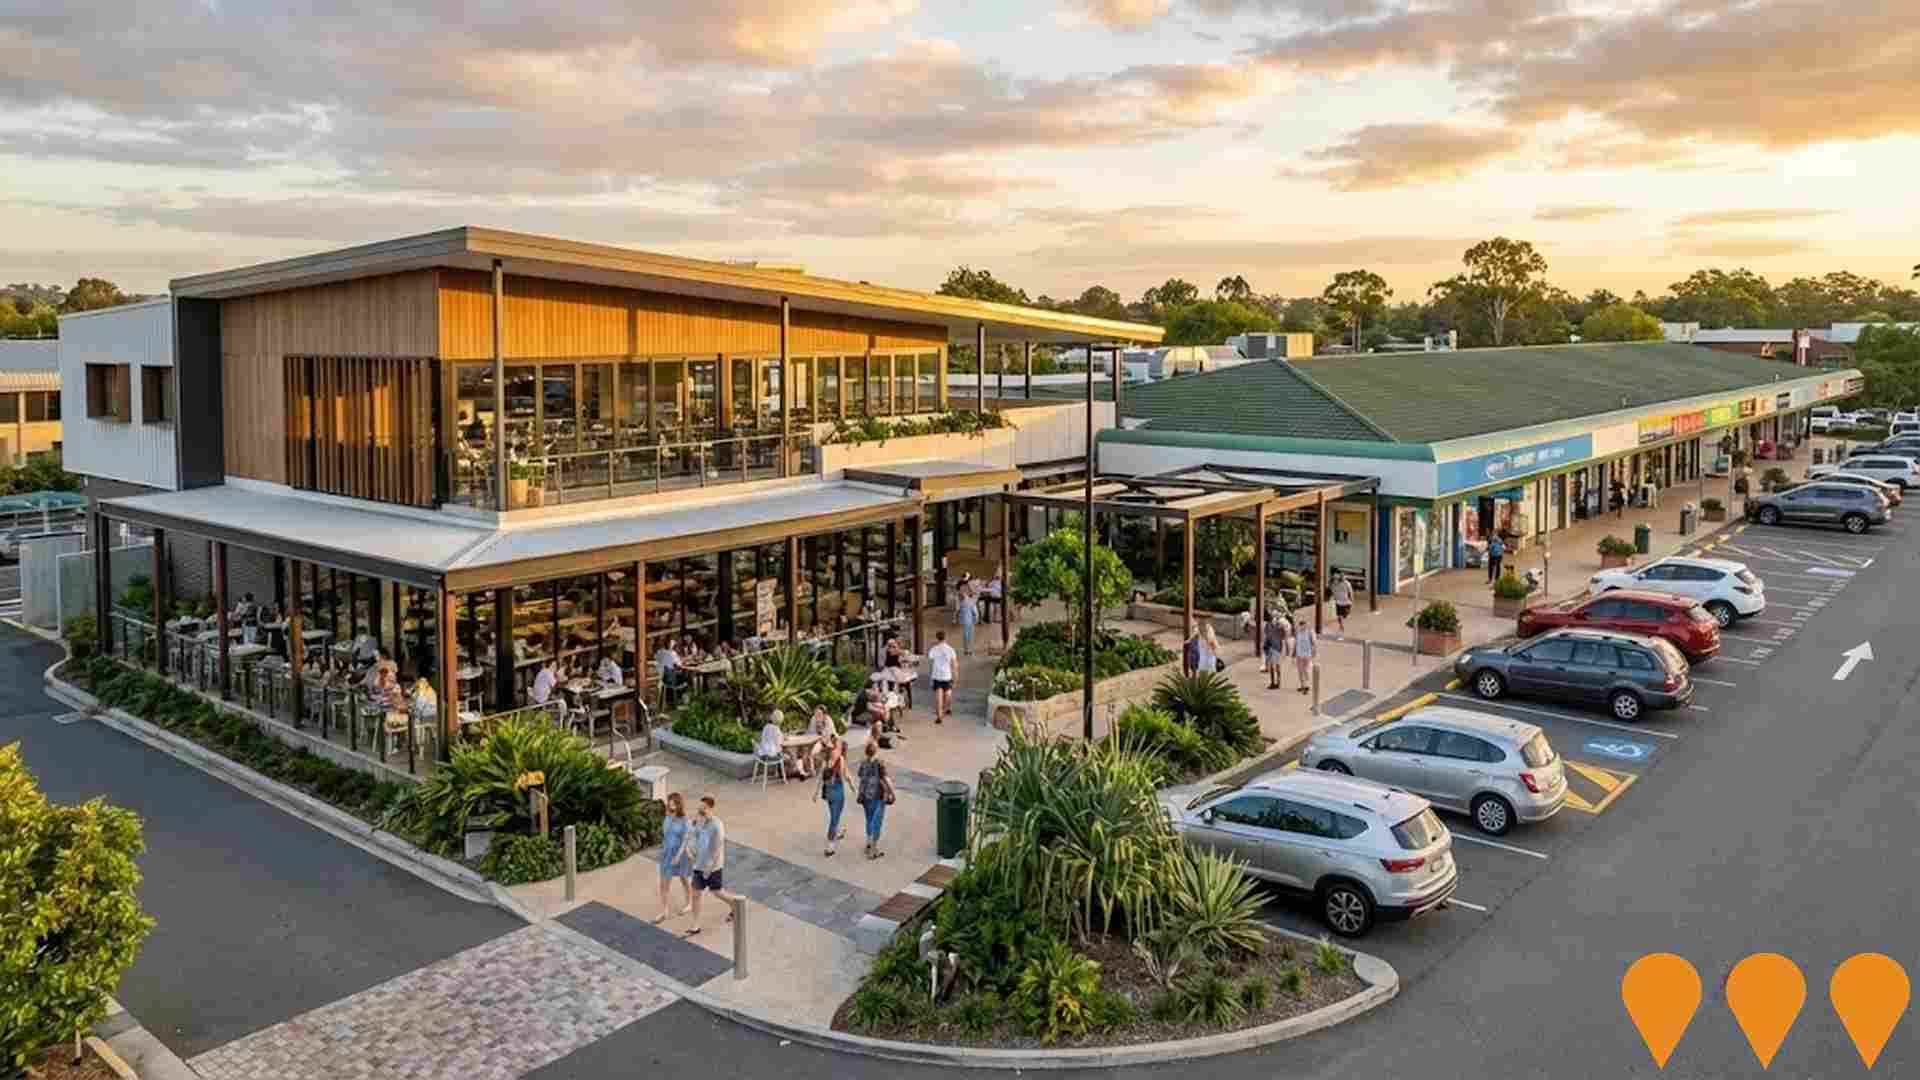
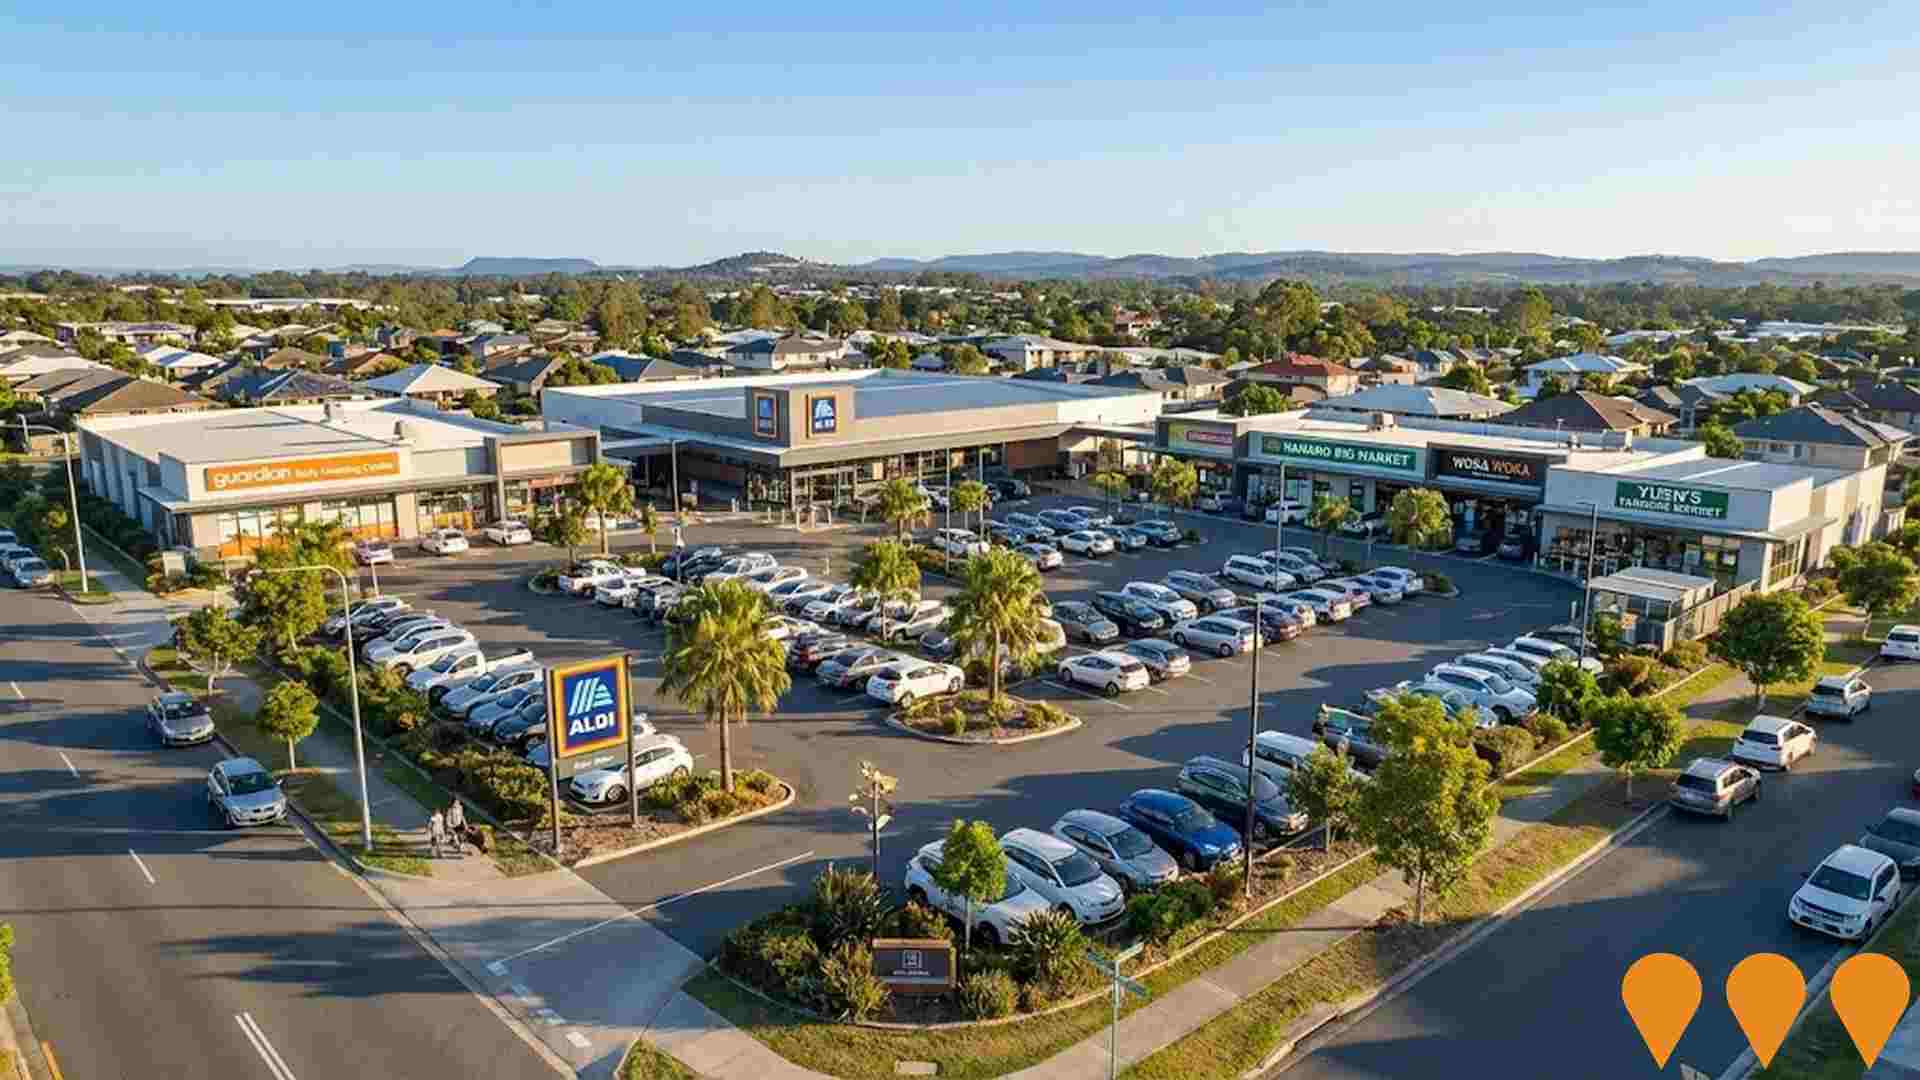
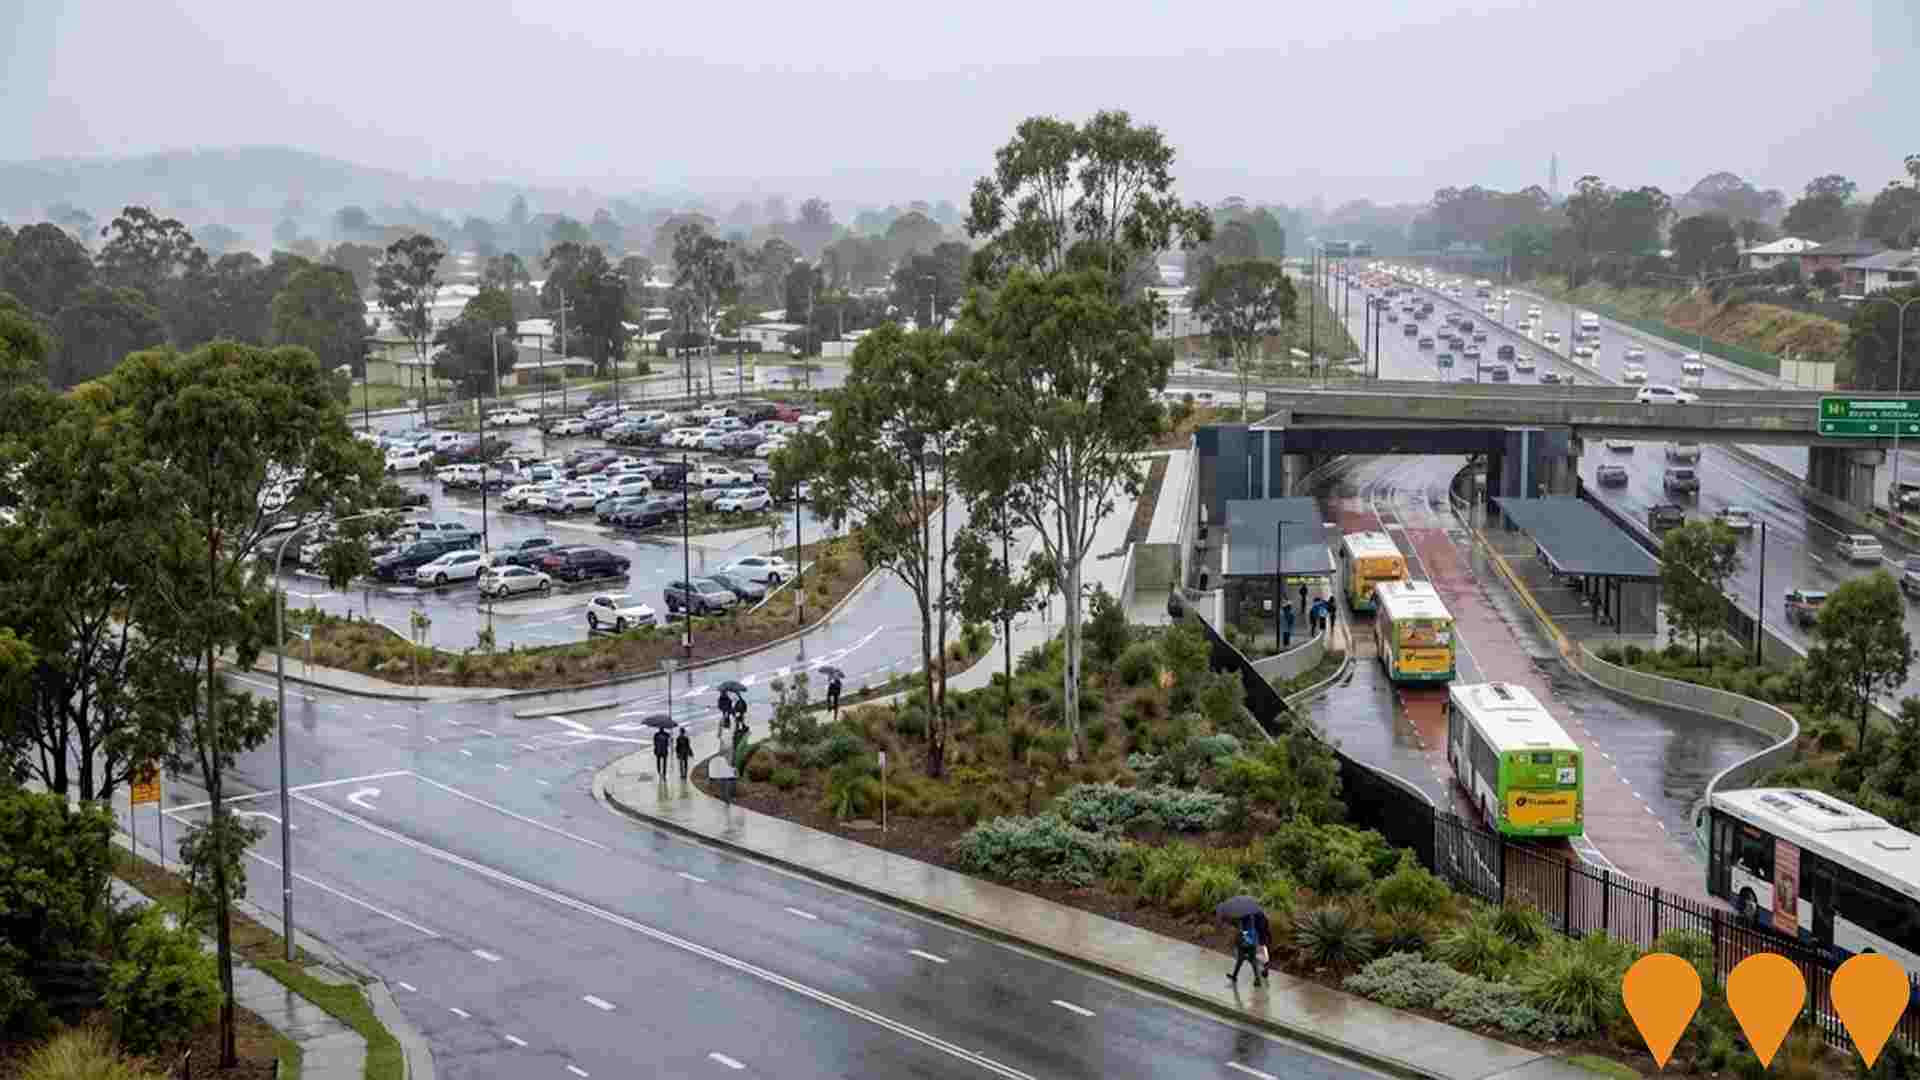
 Denotes AI-based impression for illustrative purposes only, not to be taken as definitive under any circumstances. Please follow links and conduct other investigations from the project's source for actual imagery. Developers and project owners wishing us to use original imagery please Contact Us and we will do so.
Frequently Asked Questions - Infrastructure
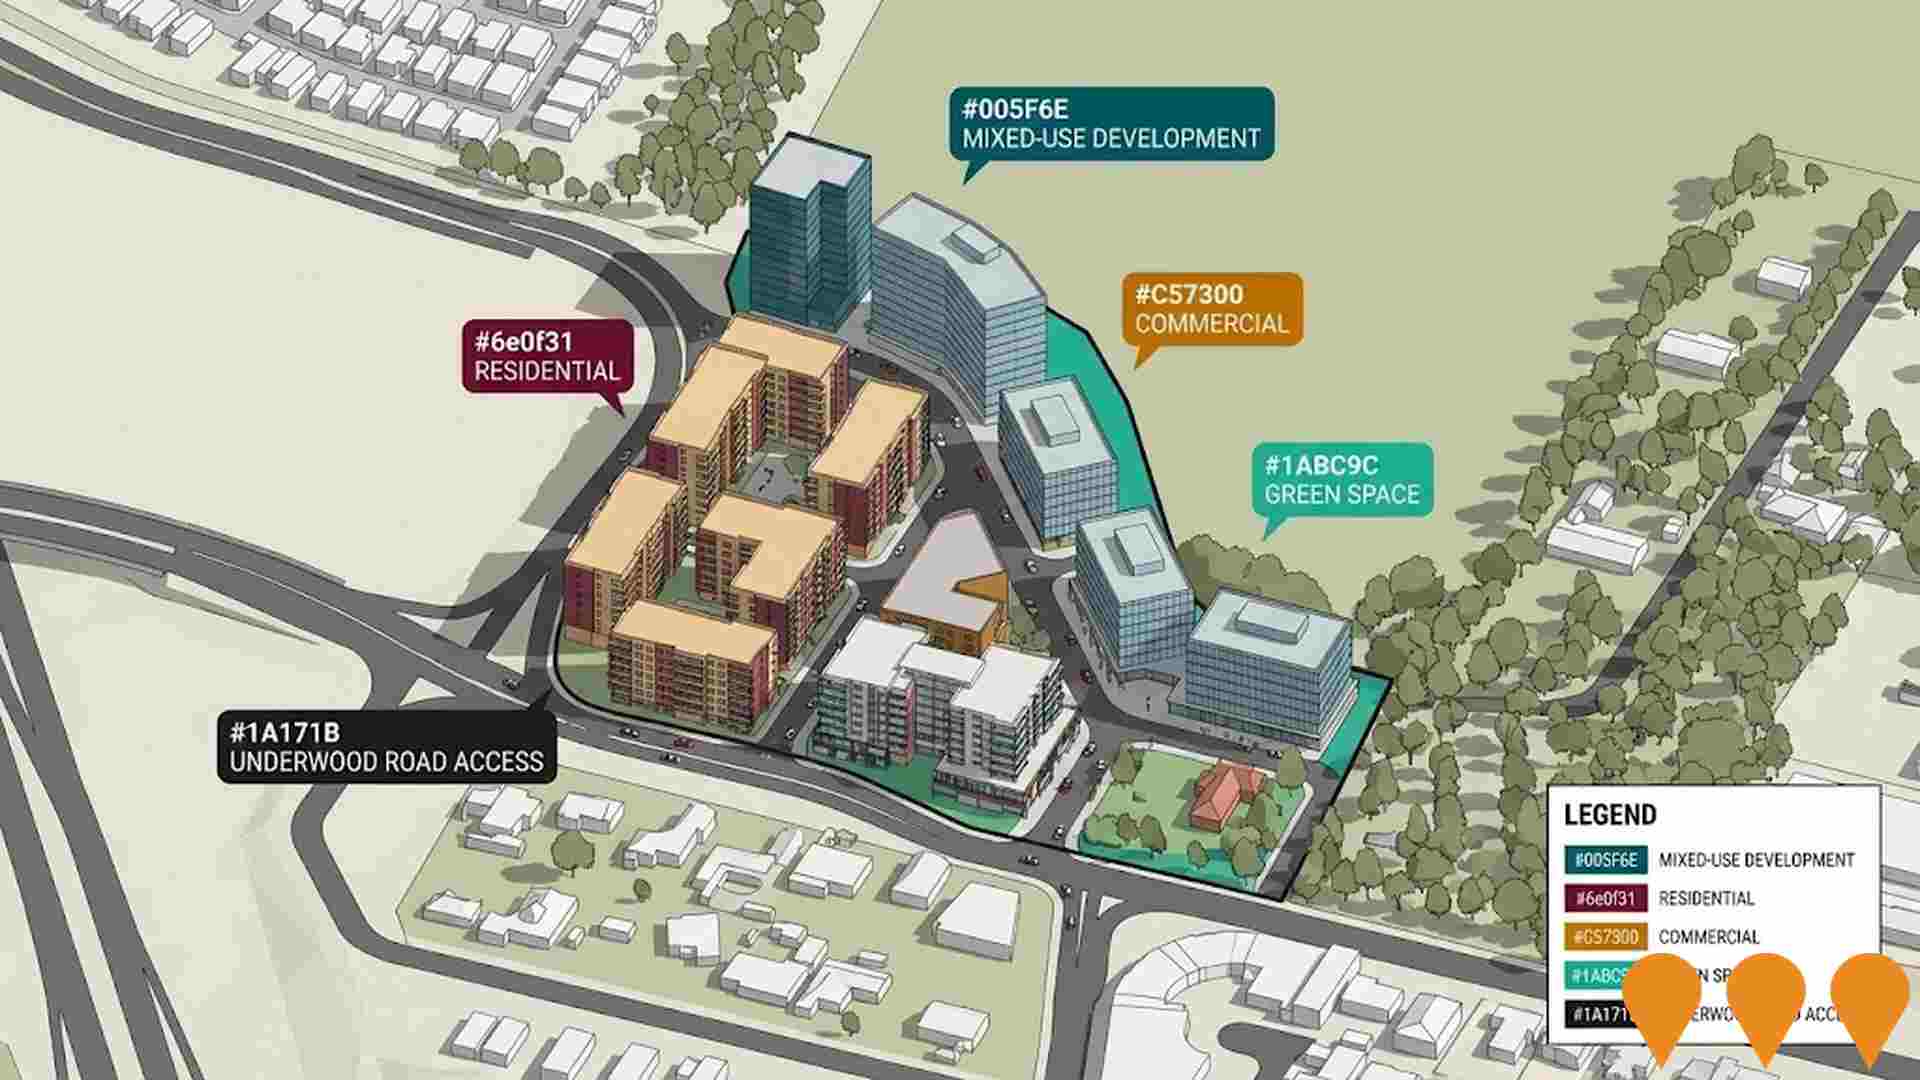
Underwood Central
Established prominent retail complex in Underwood, Logan suburbs, anchored by Aldi. Features diverse tenants including Guardian Early Learning Centre, Hanaro Big Market, Woka Woka, and Yuen's Farmers Market, with ample parking. Owned and managed by Centa Property Group as part of their commercial portfolio.
South East Busway extension to Springwood
Extension of the South East Busway from Eight Mile Plains to Springwood, including the new Rochedale station and Springwood terminal, delivered as part of the Pacific Motorway (M1) Eight Mile Plains to Daisy Hill Upgrade. The extension opened to passengers in May 2025, improving public transport connectivity across Brisbane's southside and Logan.
Kuraby Residential Development (Stockland)
Large-scale master-planned residential community featuring approximately 850 new homes, integrated parks and recreational facilities, retail precinct, and community centre. Includes affordable housing component.

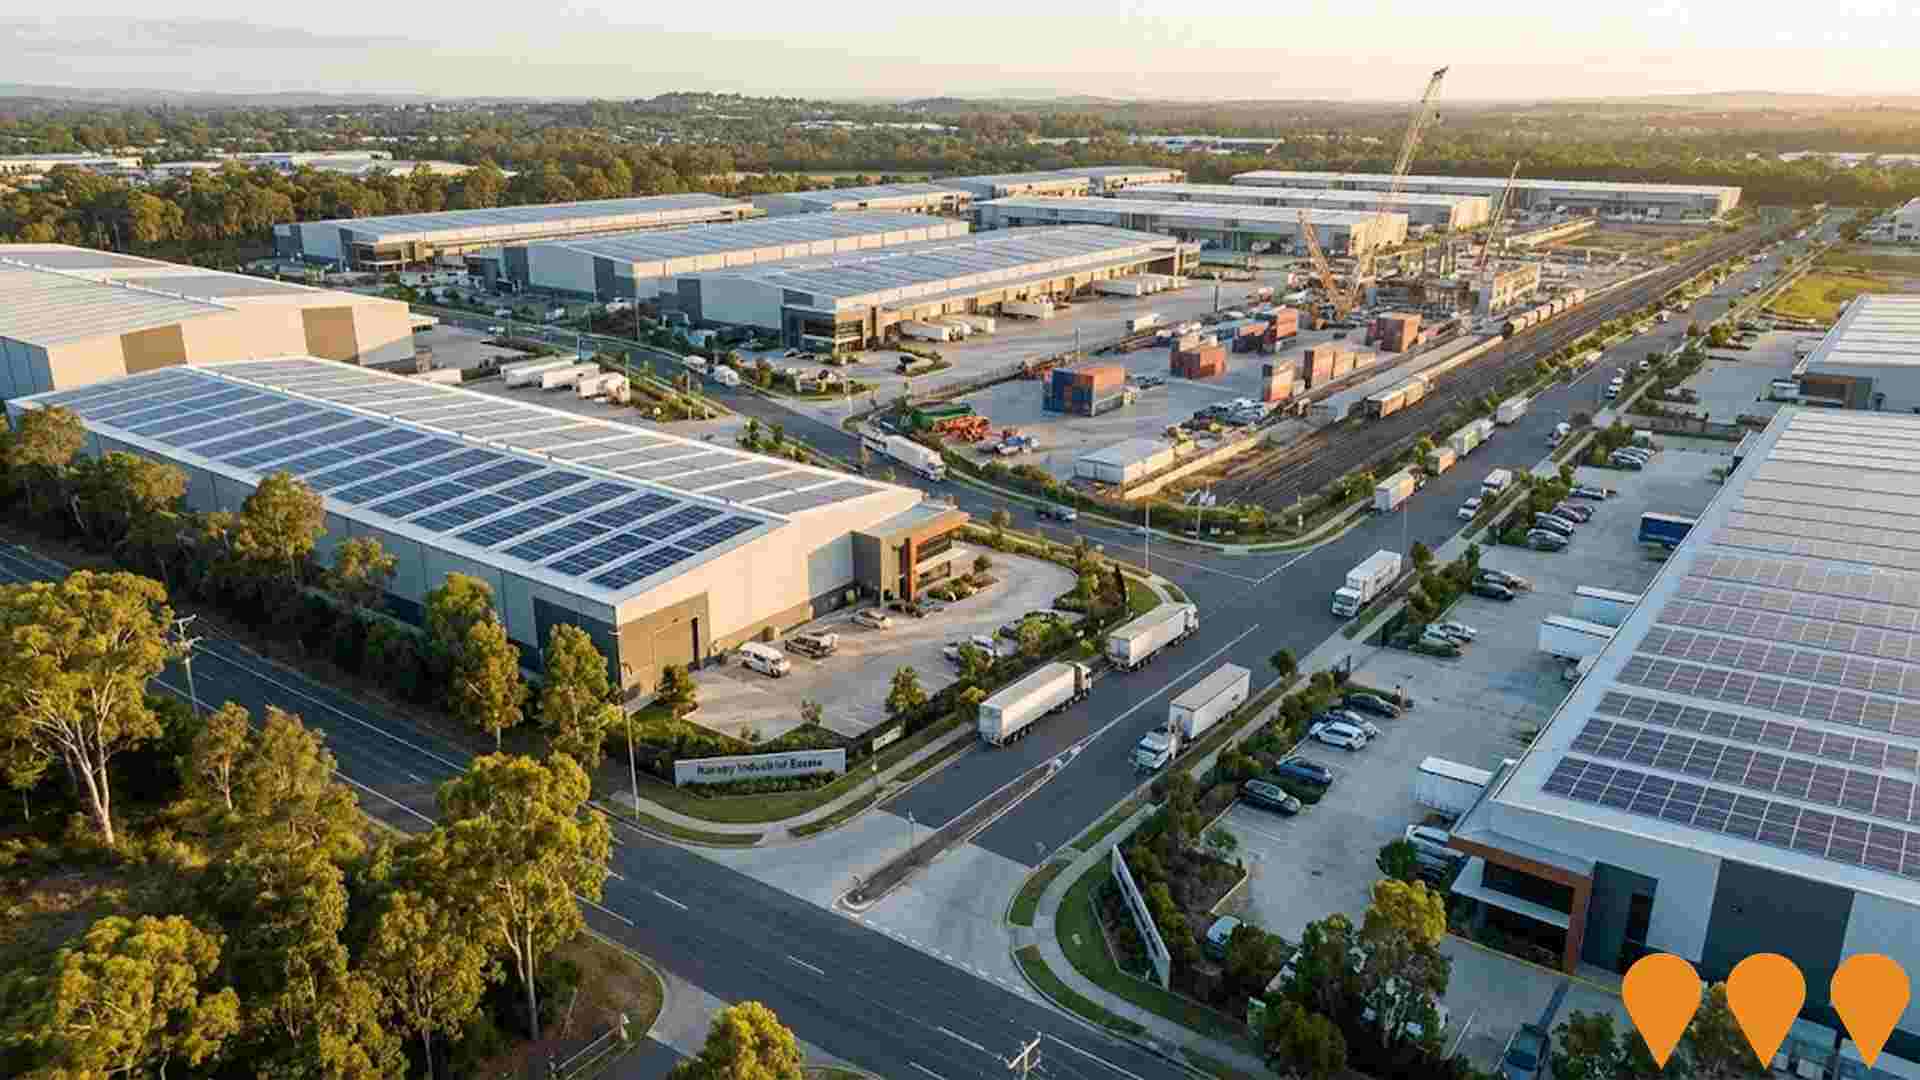
Kuraby Industrial Estate Expansion
Expansion of existing industrial estate to include additional warehousing, light manufacturing facilities, logistics centres, and improved transport connections. Focus on sustainable industrial practices.
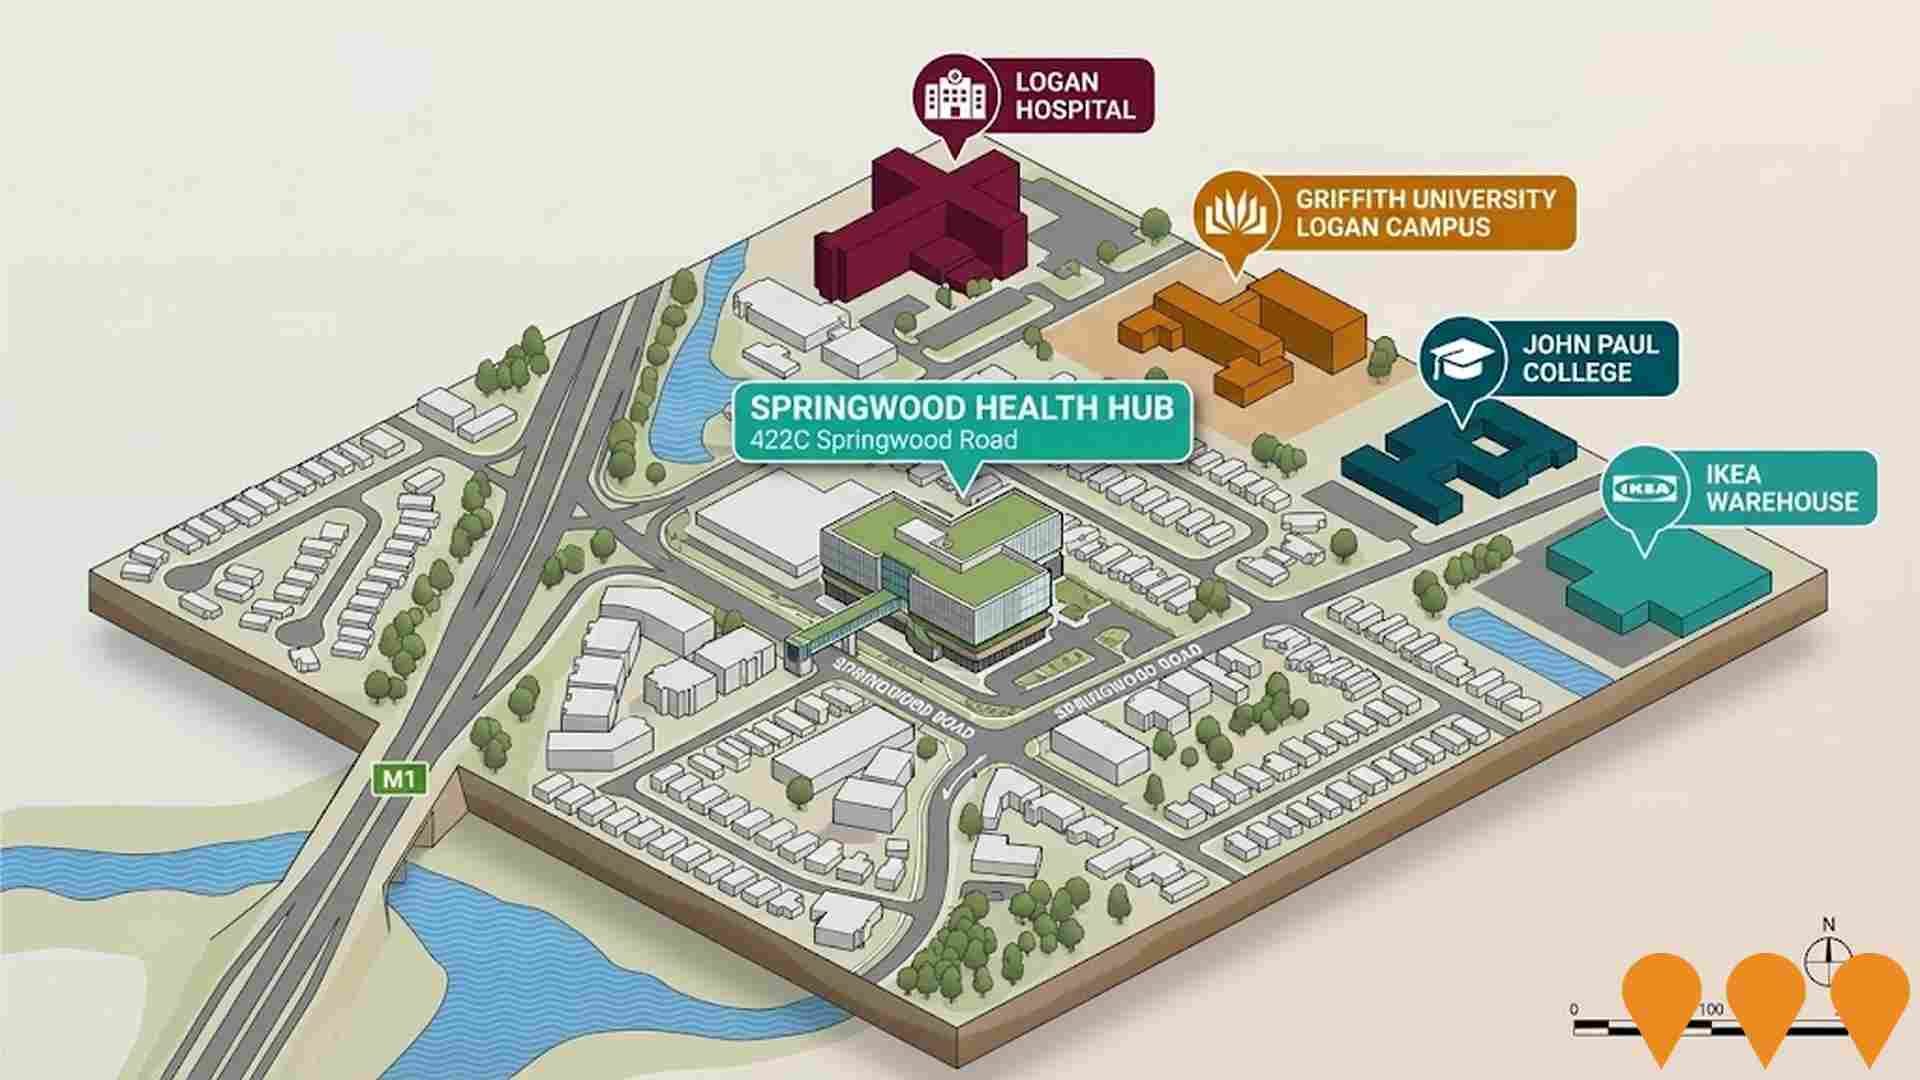
Springwood Health Hub
Integrated health hub combining primary healthcare, community health services, and allied health programs. Part of Metro South Health's strategy to improve healthcare access in outer Brisbane areas.
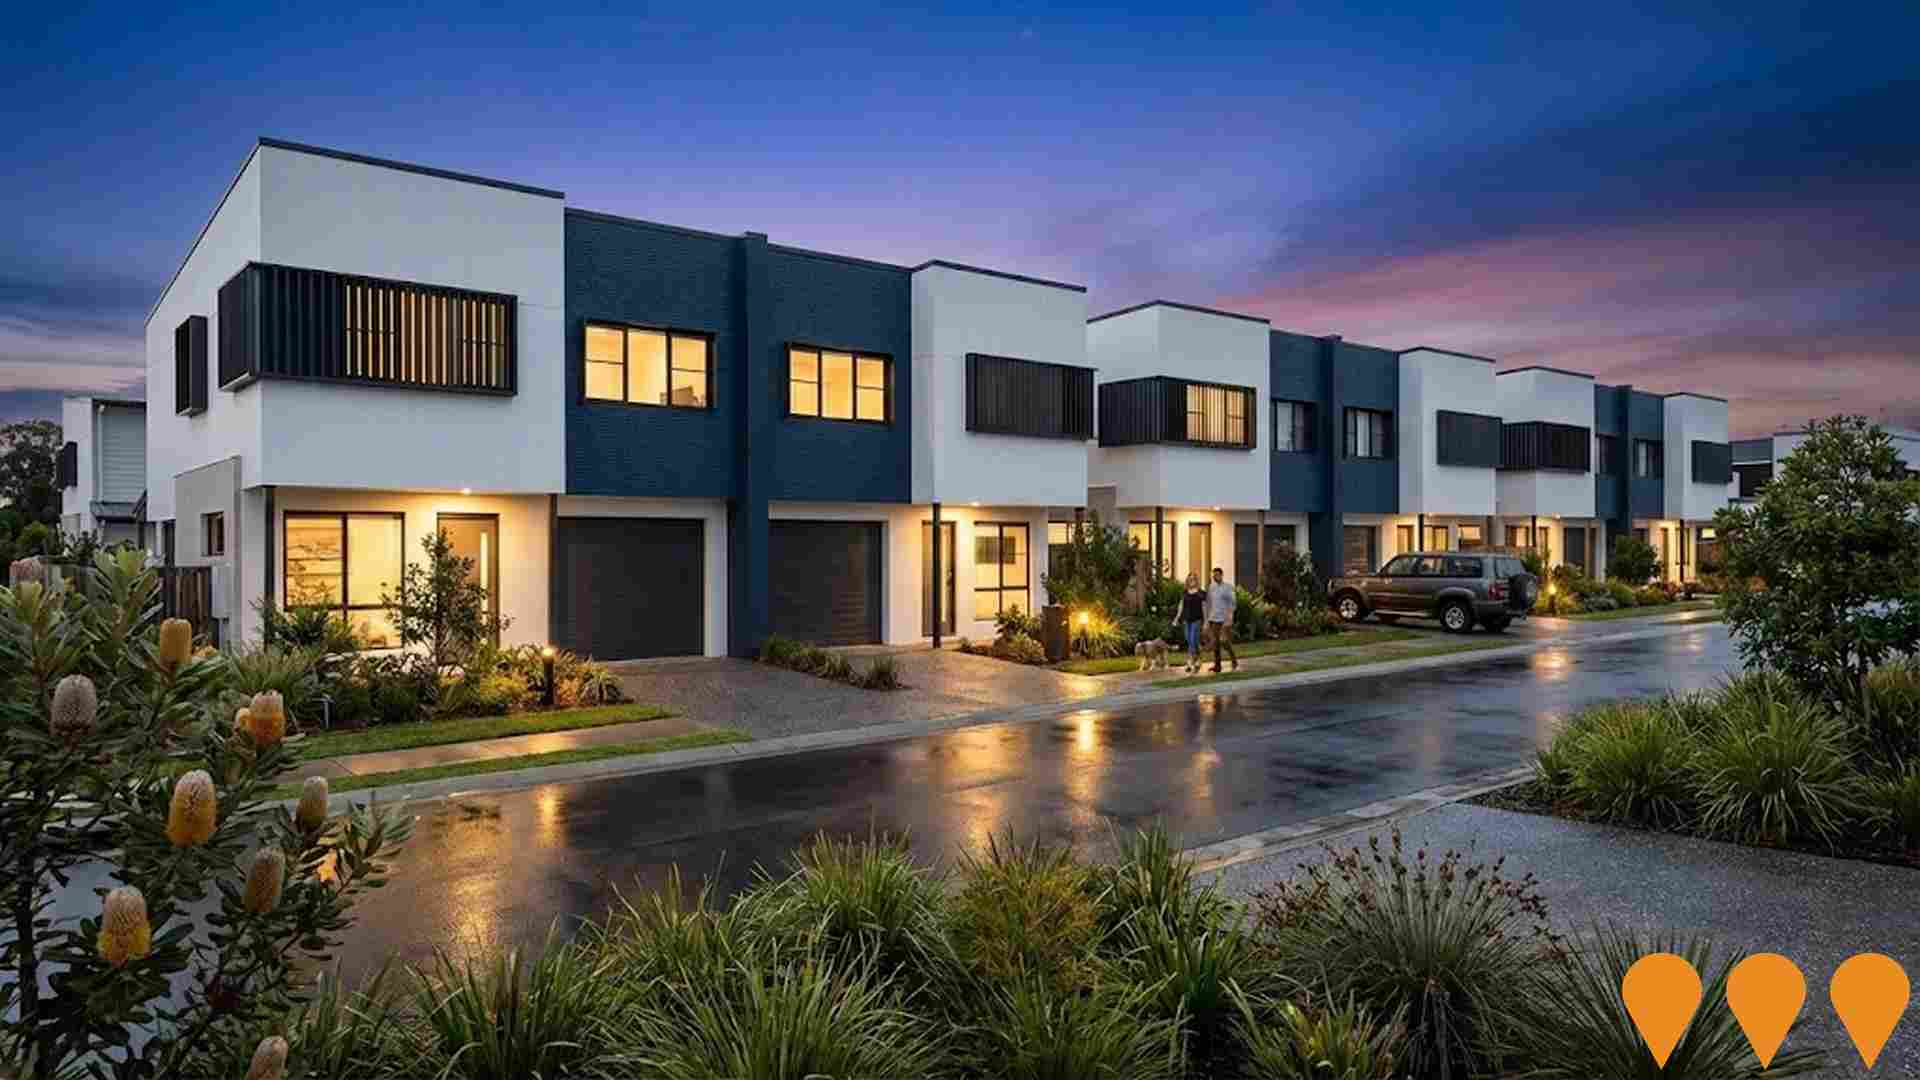
Solaris Rochedale
$82 million townhouse community by Kinstone Group at 313-315 Gardner Road. Features 129 architecturally designed 3-4 bedroom townhomes with study areas, built by Rawcorp. Includes resident amenities with gym, pool and barbecue facilities. Completed development featuring contemporary design and quality finishes to meet housing demand in growing Rochedale residential precinct.
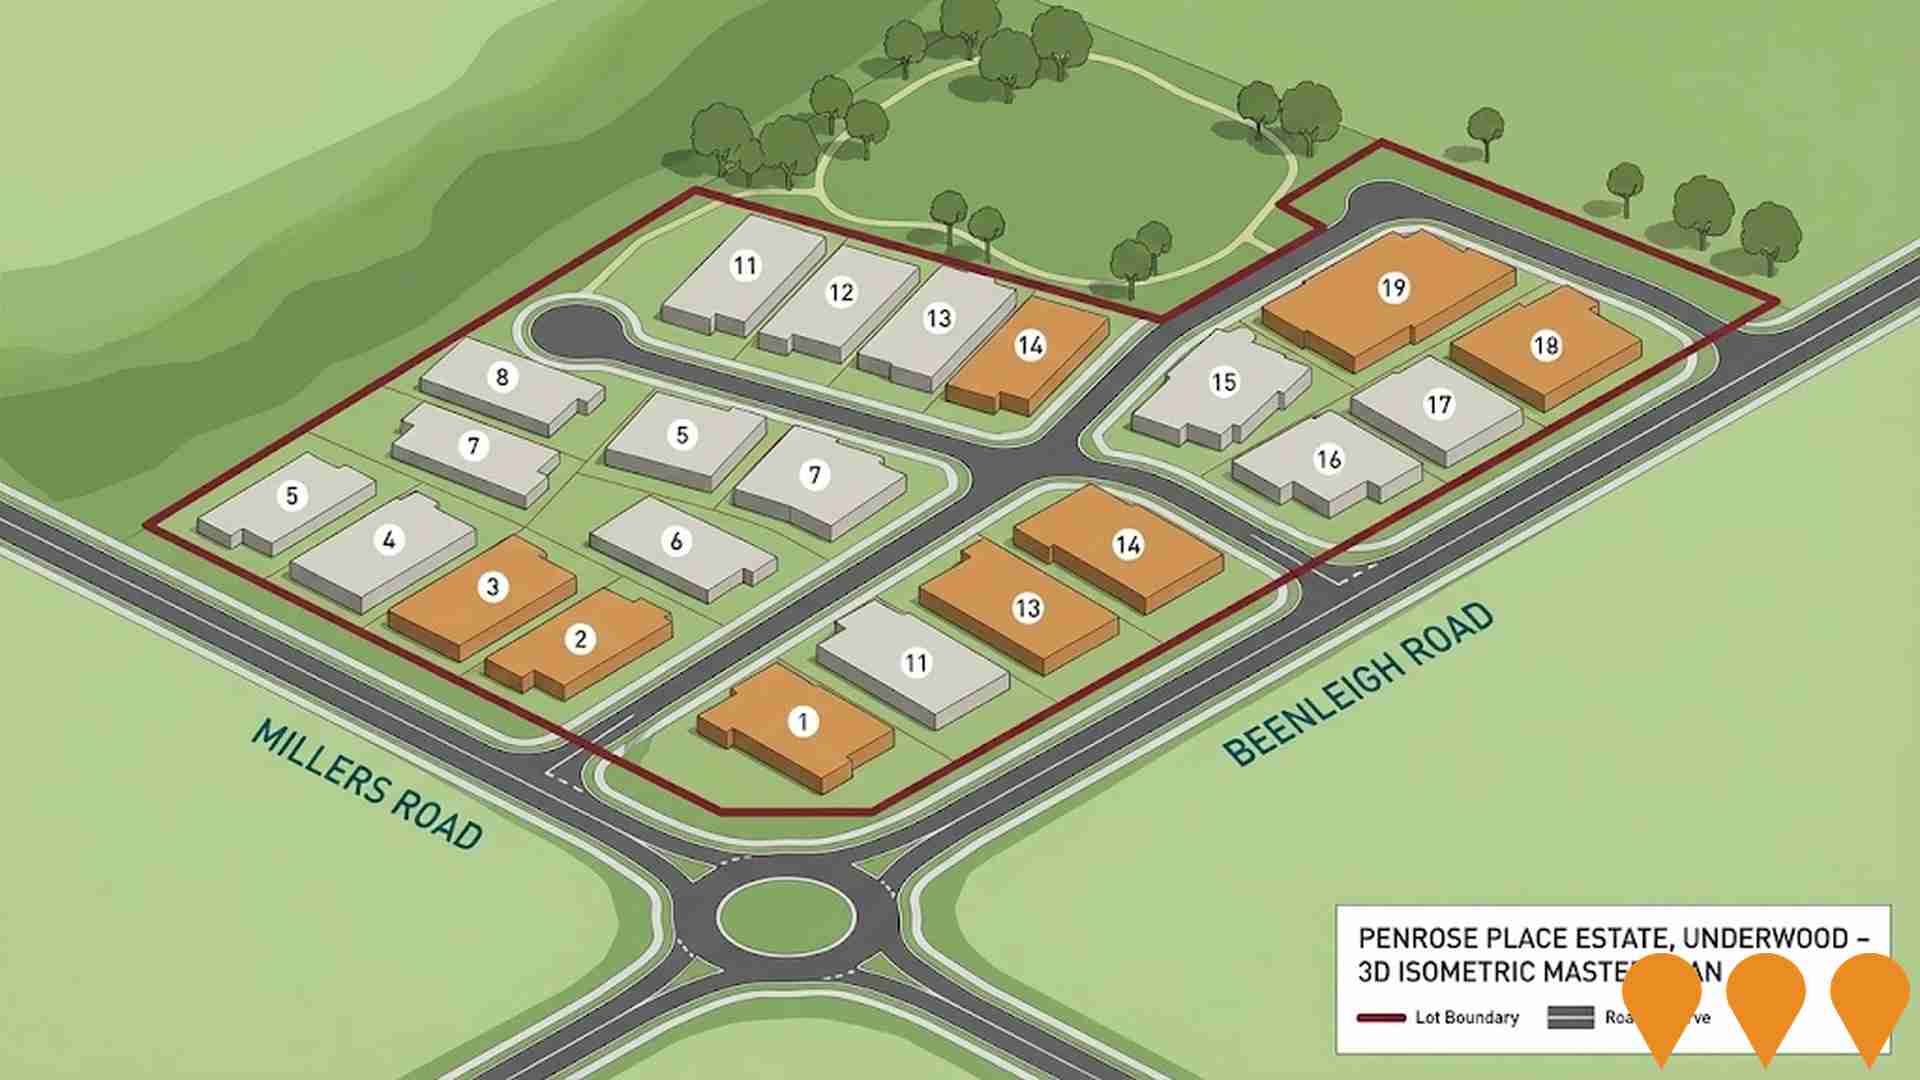
Penrose Place Estate
Limited release of 18 outstanding hilltop homesites ranging from 434m2 to 570m2, offering expansive easterly and northerly views and proximity to Underwood Marketplace, schools, and Brisbane CBD. Lots are fully retained and level, allowing buyers to choose their own builder for custom homes. The lots are now selling.
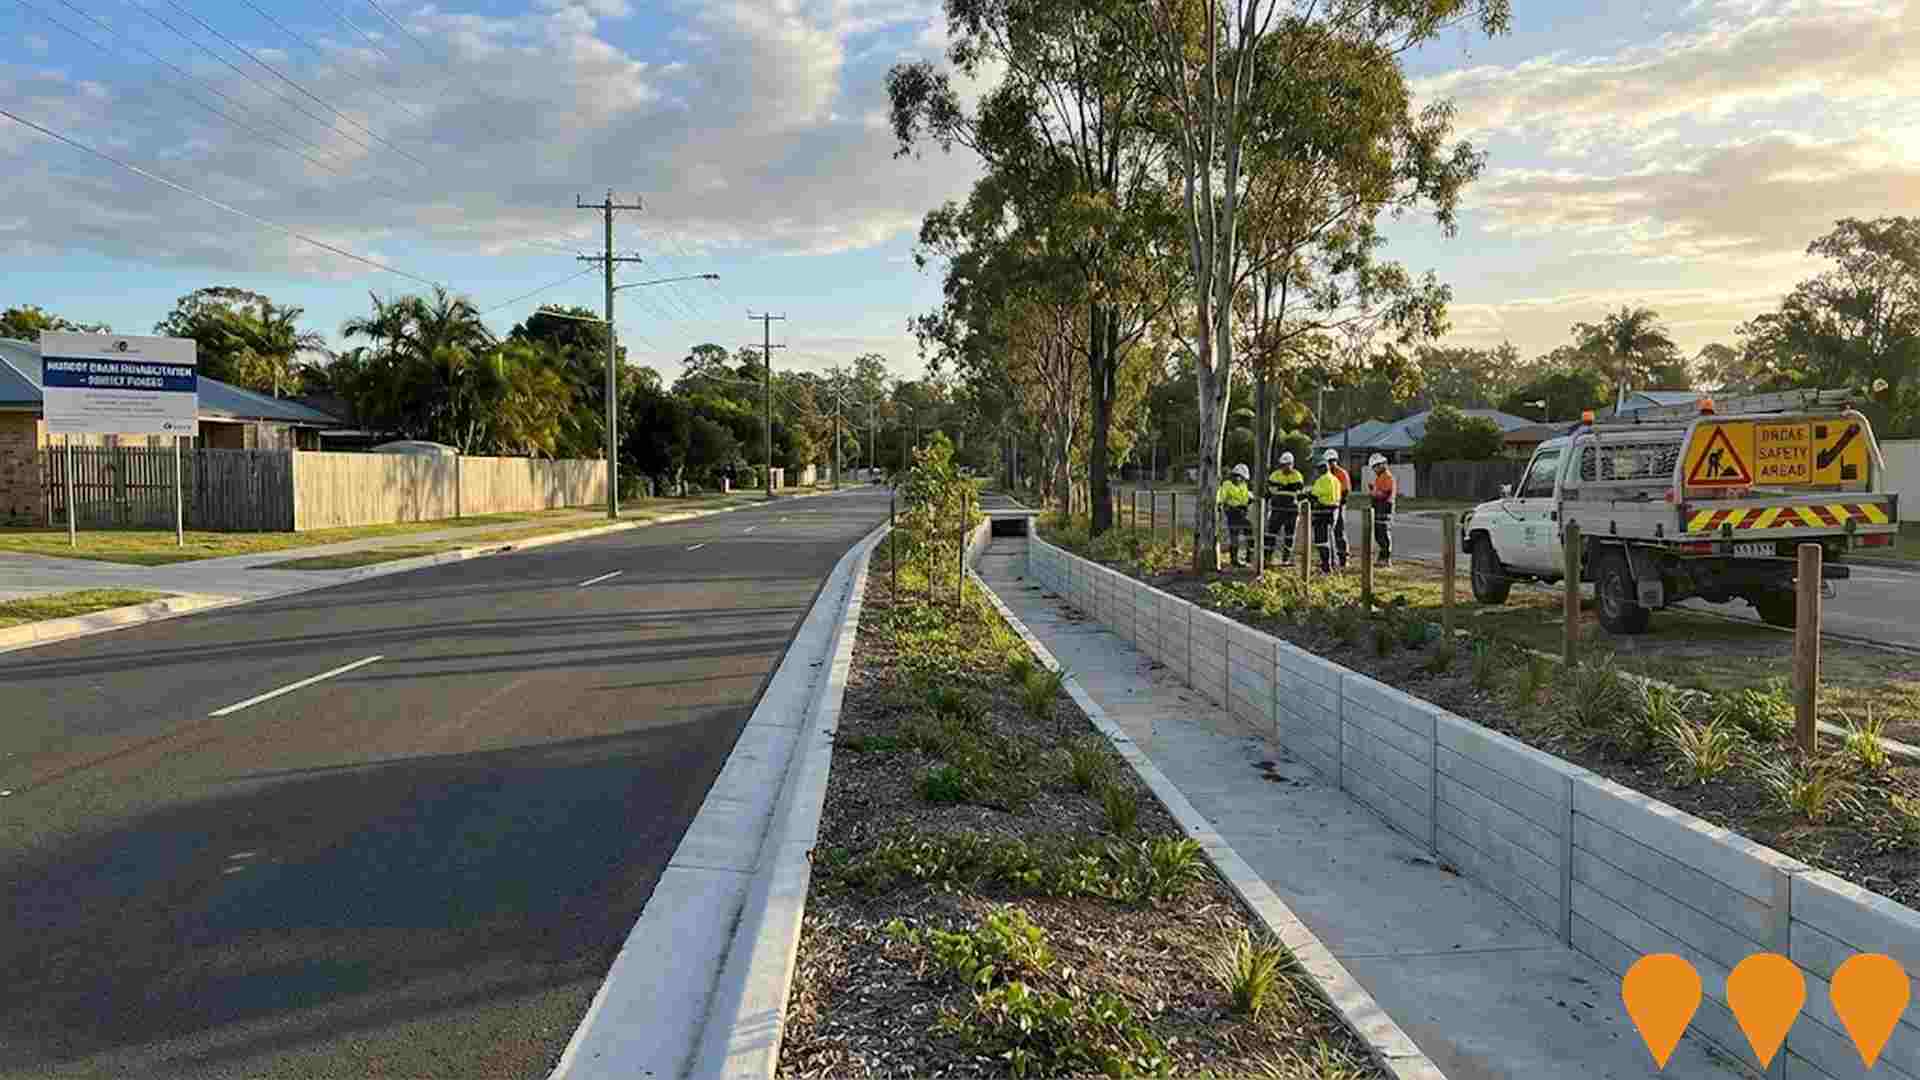
Murcot Drain Rehabilitation Project
Reconstruction of the road and drainage network post-2022 floods, including 110 meters of new stormwater infrastructure with pre-cast concrete block elements and drain base, vegetation management, and boundary fence repairs for enhanced flood resilience. This project was jointly funded by the Commonwealth and State Governments Disaster Recovery Funding Arrangements (DRFA) for the Restoration of Essential Public Assets and the programs Betterment Fund.
Employment
AreaSearch analysis reveals Underwood significantly outperforming the majority of regions assessed nationwide
Underwood's workforce is highly educated with significant representation in essential services sectors. The unemployment rate was 2.5% as of September 2025.
Employment growth over the past year was estimated at 2.9%. As of September 2025, 4,231 residents were employed, with an unemployment rate of 1.5% below Greater Brisbane's rate of 4.0%. Workforce participation in Underwood was 67.8%, compared to Greater Brisbane's 64.5%. The leading employment industries among residents were health care & social assistance, retail trade, and construction.
There was particularly strong specialization in transport, postal & warehousing, with an employment share of 1.3 times the regional level. However, professional & technical services had a limited presence at 7.1% compared to the regional rate of 8.9%. The ratio of 0.9 workers per resident indicated substantial local employment opportunities. Between September 2024 and September 2025, employment increased by 2.9%, while labour force grew by 2.3%, causing the unemployment rate to fall by 0.6 percentage points. In contrast, Greater Brisbane saw employment rise by 3.8% and unemployment fall by 0.5 percentage points over the same period. State-level data from Queensland up to 25-Nov showed employment contracted by 0.01%, with an unemployment rate of 4.2%. Nationally, the unemployment rate was 4.3%. Jobs and Skills Australia's national employment forecasts from May-25 suggested that national employment would expand by 6.6% over five years and 13.7% over ten years. Applying these projections to Underwood's employment mix indicated local employment should increase by 6.6% over five years and 13.6% over ten years, although this was a simple weighting extrapolation for illustrative purposes and did not account for localised population projections.
Frequently Asked Questions - Employment
Income
Income levels align closely with national averages, indicating typical economic conditions for Australian communities according to AreaSearch analysis
AreaSearch's latest postcode level ATO data for financial year 2022 shows Underwood SA2 had a median income among taxpayers of $50,587 and an average of $61,960. This is lower than the national average, with Greater Brisbane having a median of $55,645 and an average of $70,520. Based on Wage Price Index growth of 13.99% since financial year 2022, current estimates suggest approximately $57,664 (median) and $70,628 (average) as of September 2025. Census data indicates household, family and personal incomes in Underwood are around the 56th percentile nationally. The earnings profile shows that 36.1% of residents (2,701 people) fall into the $1,500 - 2,999 income bracket, similar to regional levels where 33.3% occupy this range. High housing costs consume 16.5% of income, but strong earnings place disposable income at the 64th percentile nationally. Underwood's SEIFA income ranking places it in the 6th decile.
Frequently Asked Questions - Income
Housing
Underwood is characterized by a predominantly suburban housing profile, with ownership patterns similar to the broader region
Underwood's dwelling structure, as per the latest Census, consisted of 84.6% houses and 15.4% other dwellings (semi-detached, apartments, 'other' dwellings), contrasting with Brisbane metro's 77.9% houses and 22.2% other dwellings. Home ownership in Underwood stood at 23.8%, similar to Brisbane metro, with mortgaged dwellings at 48.4% and rented ones at 27.8%. The median monthly mortgage repayment was $1,950, higher than the Brisbane metro average of $1,638. Median weekly rent in Underwood was $400, compared to Brisbane metro's $320. Nationally, Underwood's mortgage repayments exceeded the Australian average of $1,863, while rents were higher than the national figure of $375.
Frequently Asked Questions - Housing
Household Composition
Underwood features high concentrations of family households, with a higher-than-average median household size
Family households account for 82.0% of all households, including 46.6% couples with children, 22.2% couples without children, and 11.6% single parent families. Non-family households make up the remaining 18.0%, with lone person households at 15.2% and group households comprising 2.6% of the total. The median household size is 3.1 people, larger than the Greater Brisbane average of 2.8.
Frequently Asked Questions - Households
Local Schools & Education
Underwood shows strong educational performance, ranking in the upper quartile nationally when assessed across multiple qualification and achievement indicators
Underwood's educational attainment is notably higher than broader benchmarks. Among residents aged 15 and above, 35.0% hold university qualifications compared to 16.2% in the SA4 region and 20.6% in the SA3 area. The most common university qualification is a bachelor degree, held by 23.2%. Postgraduate qualifications are held by 8.8%, and graduate diplomas by 3.0%.
Vocational credentials are also prevalent, with 30.7% of residents aged 15 and above holding them. Advanced diplomas account for 11.8%, while certificates make up 18.9%. Educational participation is high in Underwood, with 33.6% of residents currently enrolled in formal education. This includes 12.2% in primary education, 8.6% in secondary education, and 6.2% pursuing tertiary education.
Frequently Asked Questions - Education
Schools Detail
Nearby Services & Amenities
Transport
Transport servicing is low compared to other areas nationally based on assessment of service frequency, route connectivity and accessibility
Underwood has 19 operational public transport stops, all of which are bus stops. These stops are served by three distinct routes that together facilitate 282 weekly passenger trips. The accessibility of these transport services is deemed good, with Underwood residents typically residing 303 meters away from the nearest stop.
On average, there are 40 trips per day across all routes, which equates to roughly 14 weekly trips per individual stop.
Frequently Asked Questions - Transport
Transport Stops Detail
Health
Underwood's residents boast exceedingly positive health performance metrics with younger cohorts in particular seeing very low prevalence of common health conditions
Underwood's health outcomes show notable results, with younger age groups having a very low prevalence of common health conditions.
Approximately 51% (~3,786 people) of Underwood's total population has private health cover. The most prevalent medical conditions are asthma (6.5%) and mental health issues (5.4%). A majority (78.6%) of residents report no medical ailments, compared to 68.5% in Greater Brisbane. Underwood has a lower proportion of seniors aged 65 and over (11.2%, or 841 people), compared to Greater Brisbane's 15.4%. However, health outcomes among seniors require more attention than those for the broader population.
Frequently Asked Questions - Health
Cultural Diversity
Underwood is among the most culturally diverse areas in the country based on AreaSearch assessment of a range of language and cultural background related metrics
Underwood has a high level of cultural diversity, with 47.7% of its population speaking a language other than English at home and 47.2% born overseas. Christianity is the main religion in Underwood, making up 36.7% of the population. However, Islam is significantly overrepresented, comprising 16.7%, compared to the Greater Brisbane average of 7.6%.
In terms of ancestry, the top three groups are Other at 19.9%, English at 16.2%, and Australian at 15.1%. Notably, Underwood has lower percentages for English and Australian ancestry than the regional averages of 23.2% and 20.5% respectively. Additionally, certain ethnic groups show notable differences in representation: Korean is overrepresented at 4.1% (regional average 1.1%), Indian at 9.1% (regional average 2.3%), and Samoan at 1.2% (regional average 2.4%).
Frequently Asked Questions - Diversity
Age
Underwood hosts a young demographic, positioning it in the bottom quartile nationwide
Underwood's median age is 34, which is slightly lower than Greater Brisbane's figure of 36 and Australia's national average of 38 years. Compared to Greater Brisbane, Underwood has a higher percentage of residents aged 5-14 (15.5%) but fewer residents aged 75-84 (3.5%). Between the 2021 Census and the present, the 75 to 84 age group has increased from 2.8% to 3.5% of Underwood's population, while the 25 to 34 cohort has decreased from 15.5% to 14.2%. By 2041, Underwood's population is forecasted to experience significant demographic shifts. The 45 to 54 age group is projected to grow by 34%, adding 339 residents and reaching a total of 1,326. Conversely, both the 0 to 4 and 25 to 34 age groups are expected to have reduced numbers.
