Chart Color Schemes
This analysis uses ABS Statistical Areas Level 2 (SA2) boundaries, which can materially differ from Suburbs and Localities (SAL) even when sharing similar names.
SA2 boundaries are defined by the Australian Bureau of Statistics and are designed to represent communities for statistical reporting (e.g., census and ERP).
Suburbs and Localities (SAL) represent commonly-used suburb/locality names (postal-style areas) and may use different geographic boundaries. For comprehensive analysis, consider reviewing both boundary types if available.
est. as @ -- *
ABS ERP | -- people | --
2021 Census | -- people
Sales Activity
Curious about local property values? Filter the chart to assess the volume and appreciation (including resales) trends and regional comparisons, or scroll to the map below view this information at an individual property level.
Find a Recent Sale
Sales Detail
Population
Woodridge is positioned among the lower quartile of areas assessed nationally for population growth based on AreaSearch's assessment of recent, and medium term trends
Woodridge's population is approximately 13,910 as of November 2025. This figure represents an increase of 928 people, a growth rate of 7.1%, since the 2021 Census which reported a population of 12,982. The change is inferred from the estimated resident population of 13,902 in June 2024 and an additional 18 validated new addresses since the Census date. This results in a population density ratio of 2,978 persons per square kilometer, placing Woodridge in the upper quartile relative to national locations assessed by AreaSearch. The area's growth rate exceeded that of its SA3 region (6.1%), making it a growth leader. Overseas migration contributed approximately 74% of overall population gains during recent periods.
AreaSearch adopts ABS/Geoscience Australia projections for each SA2 area, released in 2024 with a base year of 2022. For areas not covered by this data and years post-2032, Queensland State Government's SA2 area projections are used, released in 2023 based on 2021 data. However, these state projections do not provide age category splits, so AreaSearch applies proportional growth weightings from the ABS Greater Capital Region projections (released in 2023, based on 2022 data) for each age cohort. Considering projected demographic shifts, Woodridge is expected to grow by just below the median of national areas. Based on the latest annual ERP population numbers, the area is projected to increase by 807 persons to reach a total population of approximately 15,719 by 2041, reflecting an overall increase of 5.7% over the 17-year period.
Frequently Asked Questions - Population
Development
Residential development activity is slightly higher than average within Woodridge when compared nationally
Woodridge averaged approximately 25 new dwelling approvals annually over the past five financial years, totalling 129 homes. As of FY-26 so far, there have been 4 approvals recorded. On average, 5.1 people moved to the area per year for each dwelling built between FY-21 and FY-25, indicating demand significantly outpacing supply. This typically puts upward pressure on prices and increases competition among buyers.
New properties are constructed at an average expected construction cost value of $296,000. In this financial year, $3.4 million in commercial development approvals have been recorded, highlighting the area's primarily residential nature. Compared to Greater Brisbane, Woodridge shows approximately 69% of the construction activity per person and places among the 38th percentile nationally, resulting in relatively constrained buyer choice. This supports interest in existing homes, though development activity has picked up in recent periods.
This activity is also below average nationally, reflecting the area's maturity and possible planning constraints. New development in Woodridge consists of 80.0% detached dwellings and 20.0% medium and high-density housing, preserving the area's suburban nature with an emphasis on detached housing attracting space-seeking buyers. Interestingly, developers are building more traditional houses than the current mix suggests (60.0% at Census), indicating continued strong demand for family homes despite density pressures. At around 472 people per approval, Woodridge indicates a mature market. Looking ahead, Woodridge is expected to grow by 799 residents through to 2041, based on the latest AreaSearch quarterly estimate. Given current development patterns, new housing supply should readily meet demand, offering good conditions for buyers and potentially facilitating population growth beyond current projections.
Frequently Asked Questions - Development
Infrastructure
Woodridge has very high levels of nearby infrastructure activity, ranking in the top 20% nationally
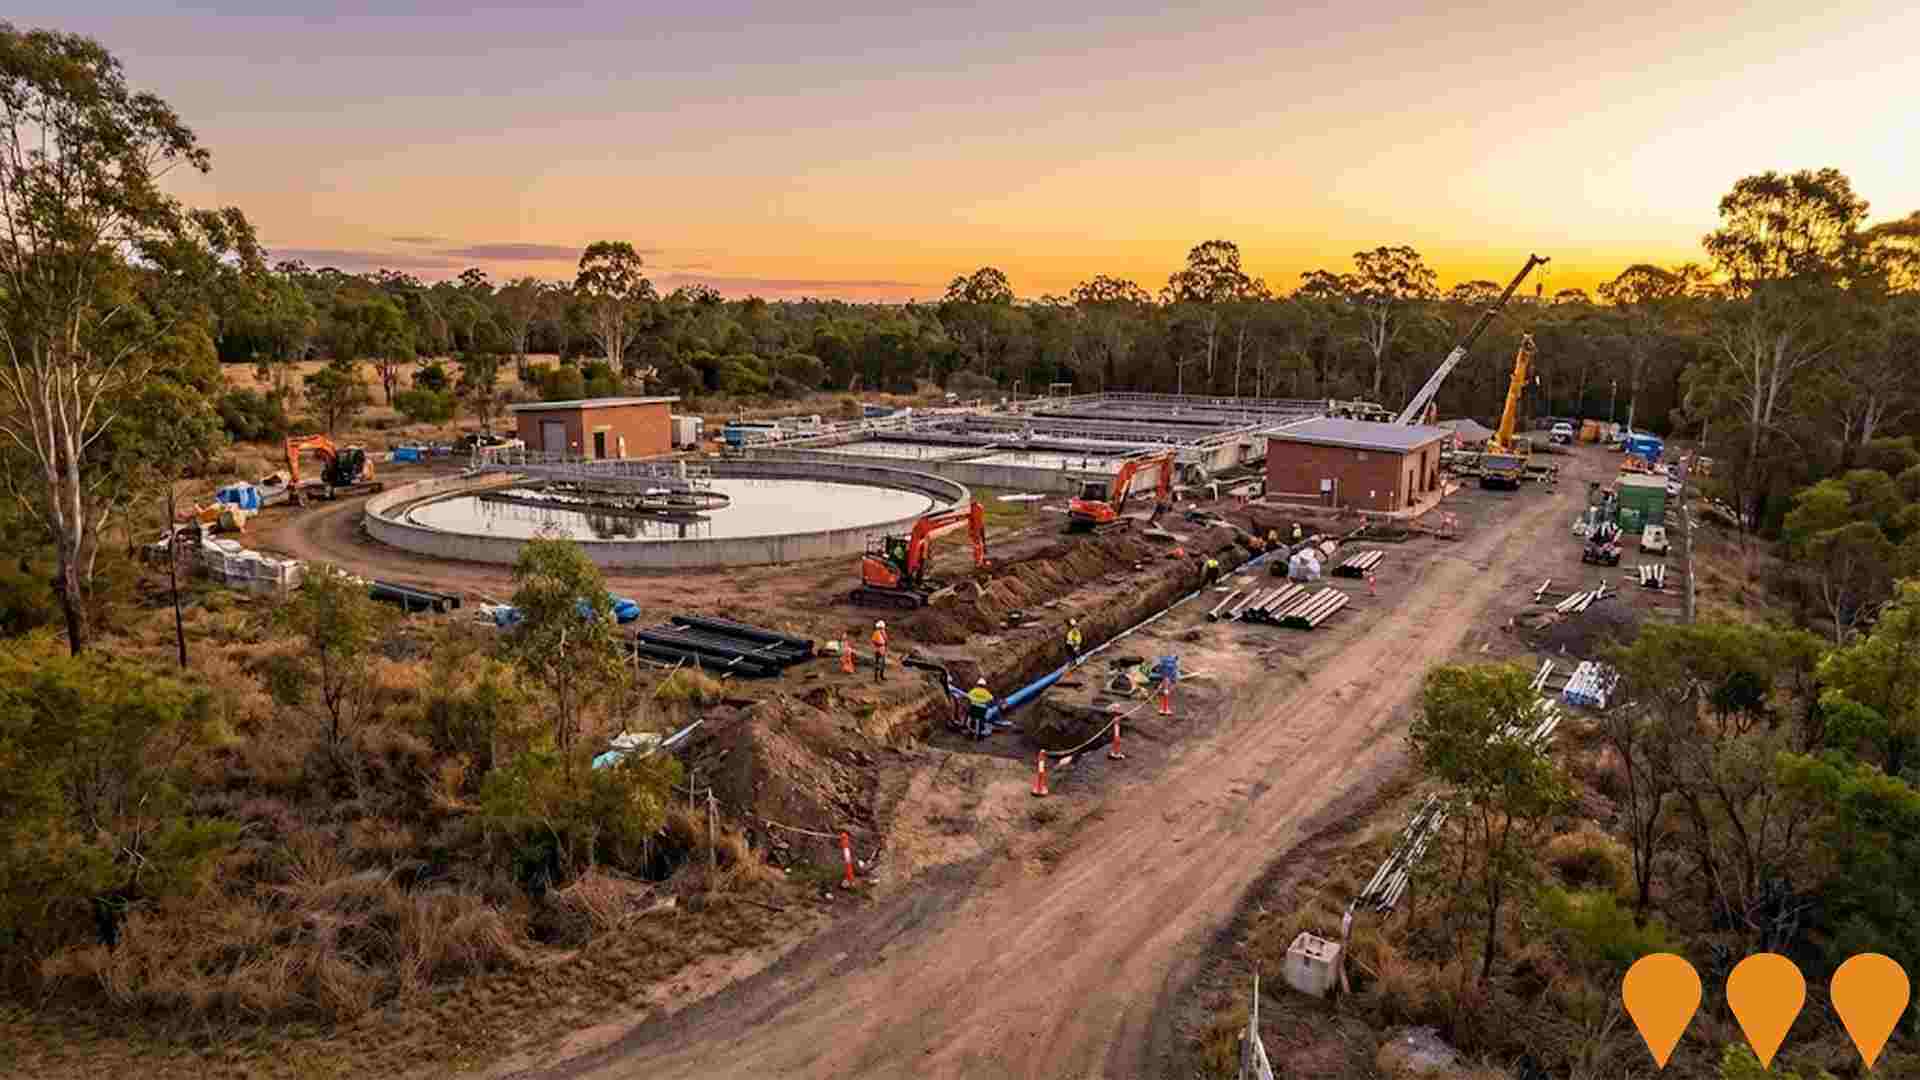
Changes to local infrastructure significantly impact an area's performance. AreaSearch has identified 26 projects likely affecting the region. Notable initiatives include Stockland's Kuraby Residential Development, Northwest Healthcare Centre - Meadowbrook, Logan Central Civic and Community Precinct, and Kuraby Industrial Estate Expansion. The following list details those most relevant:.
Professional plan users can use the search below to filter and access additional projects.
INFRASTRUCTURE SEARCH
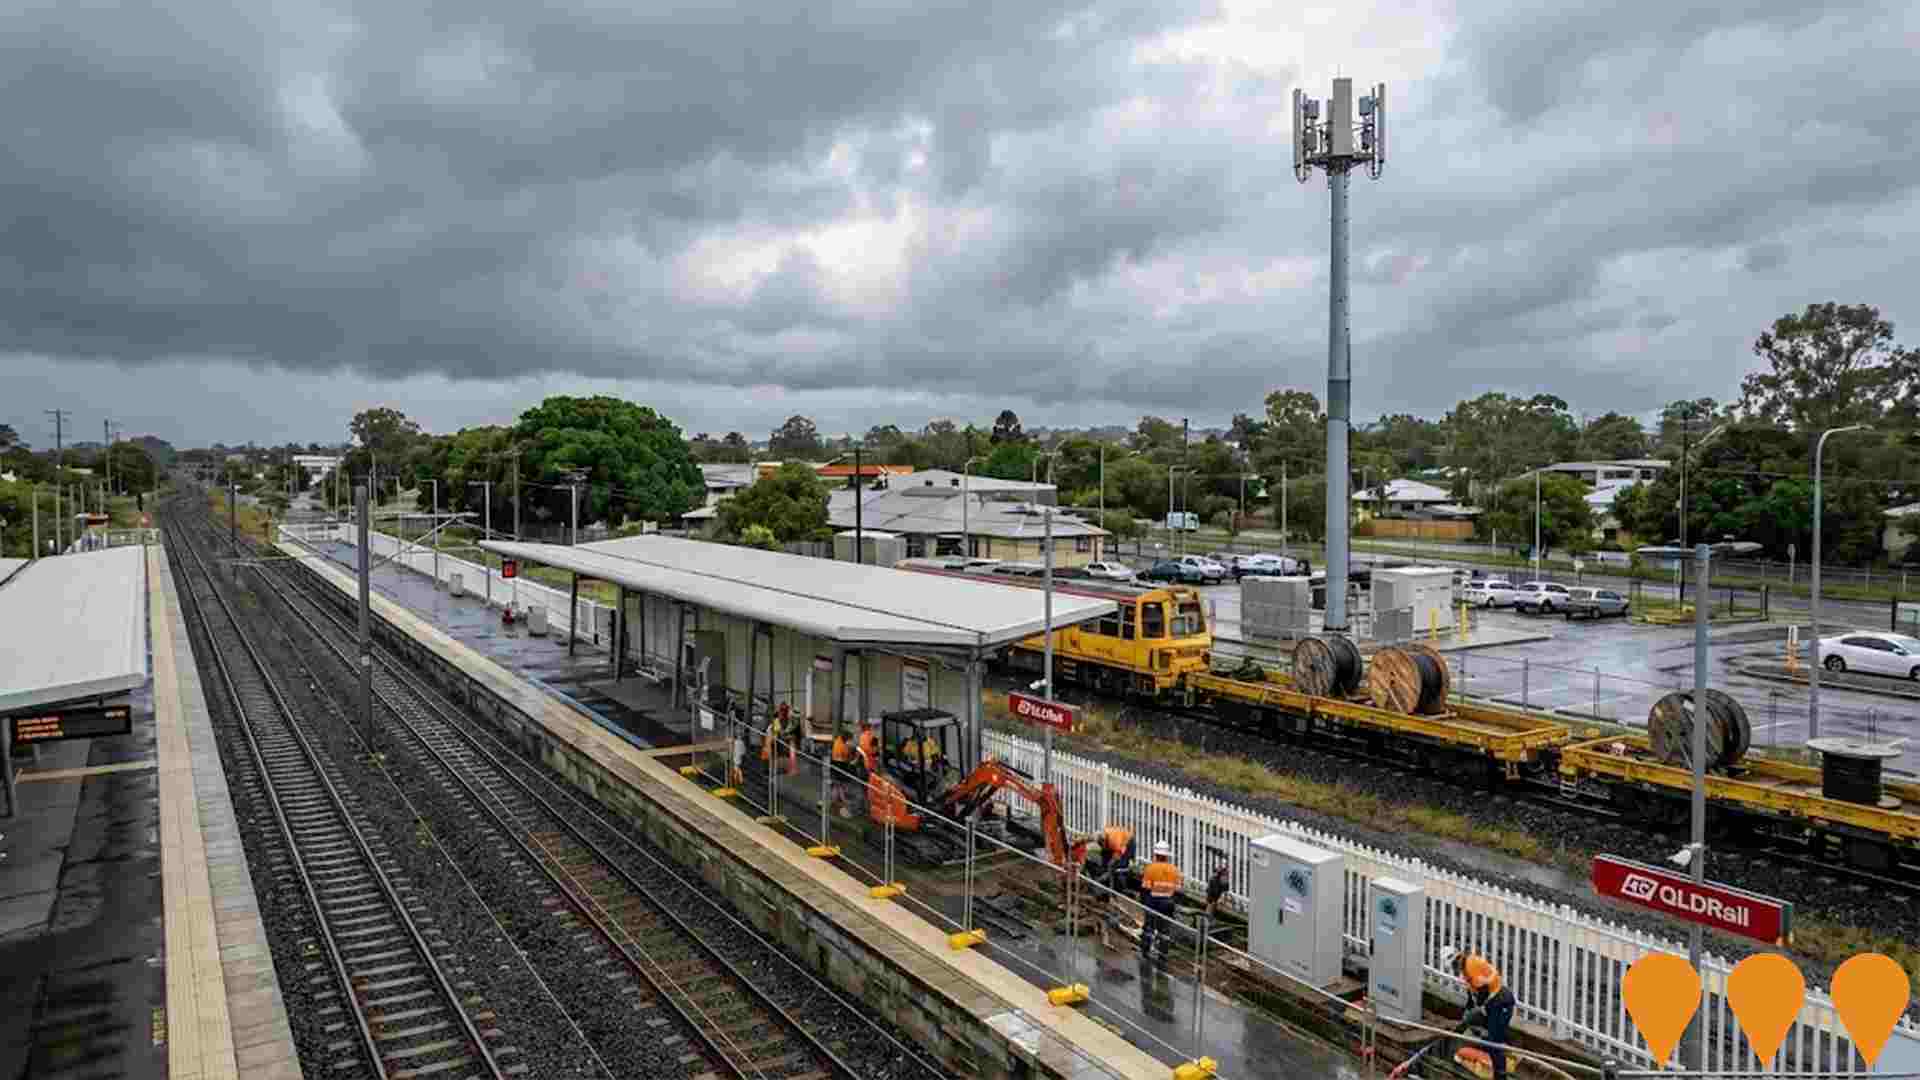
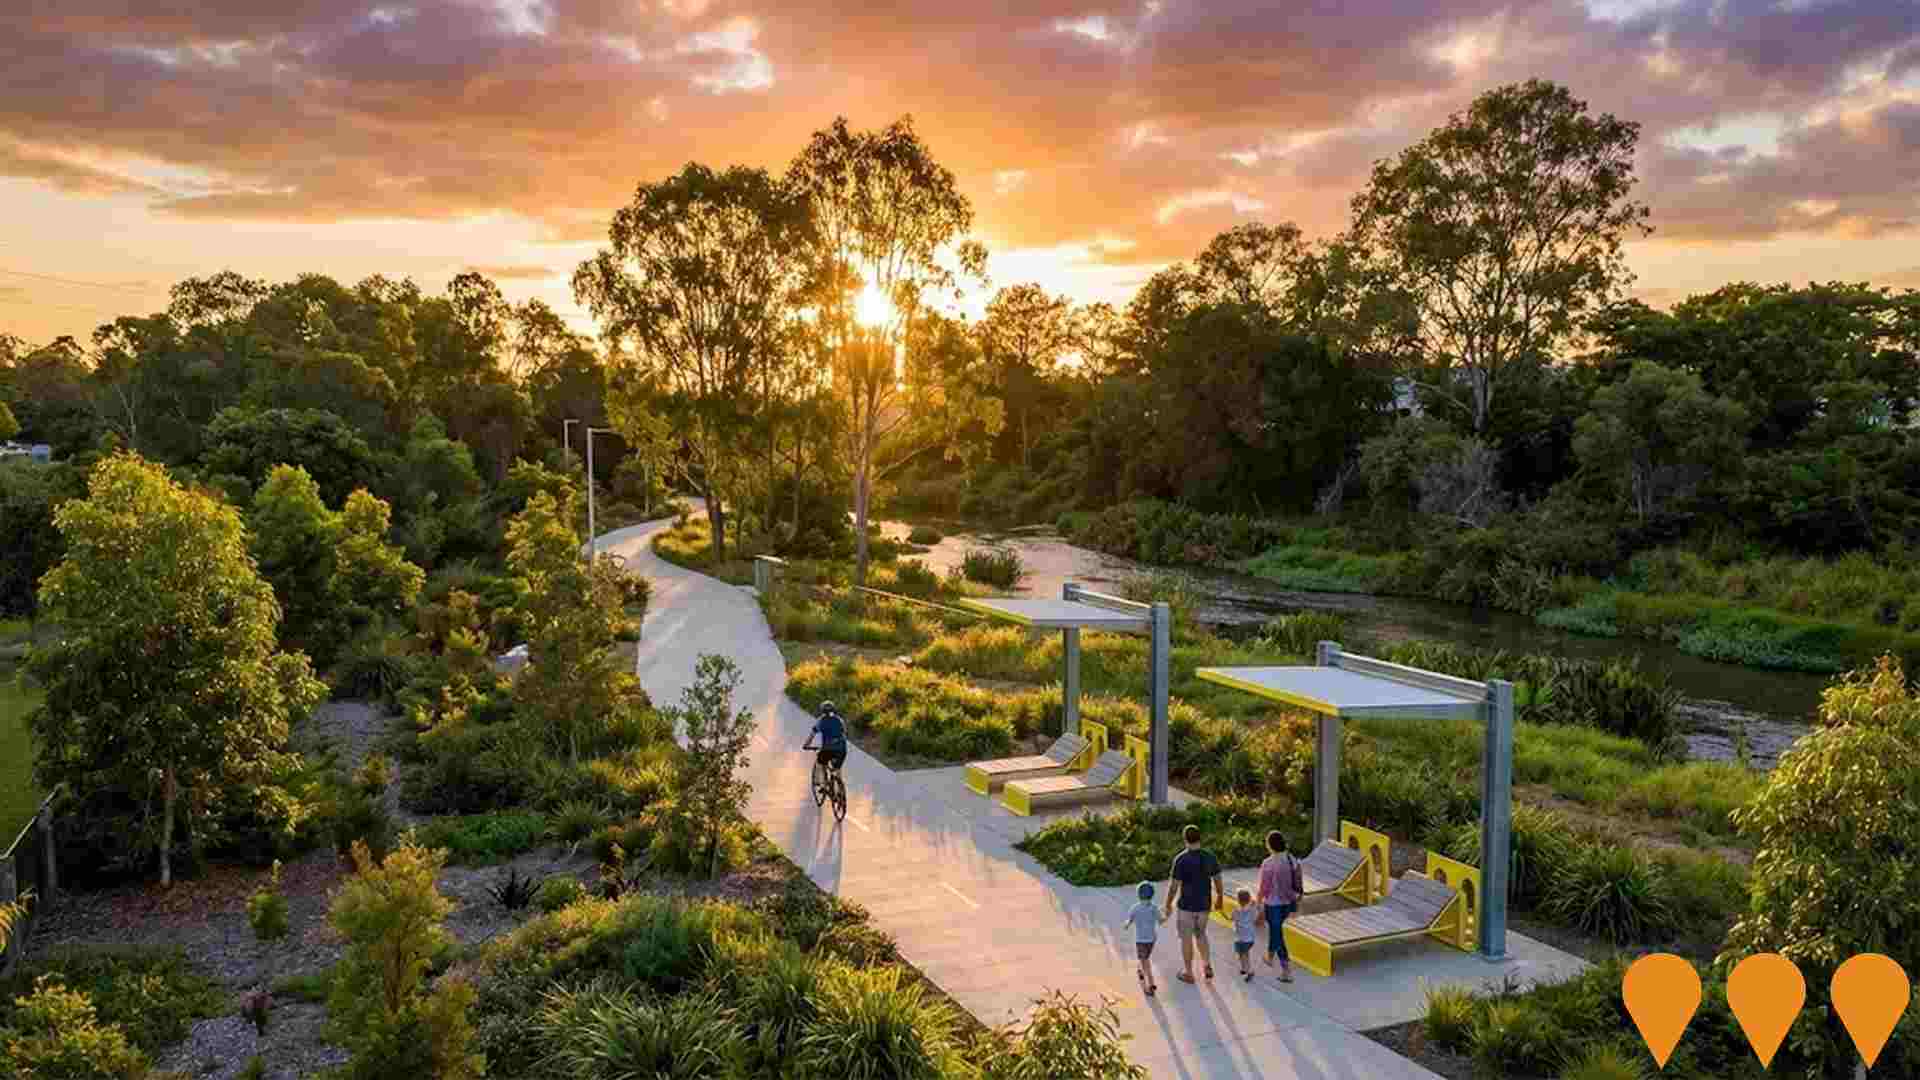
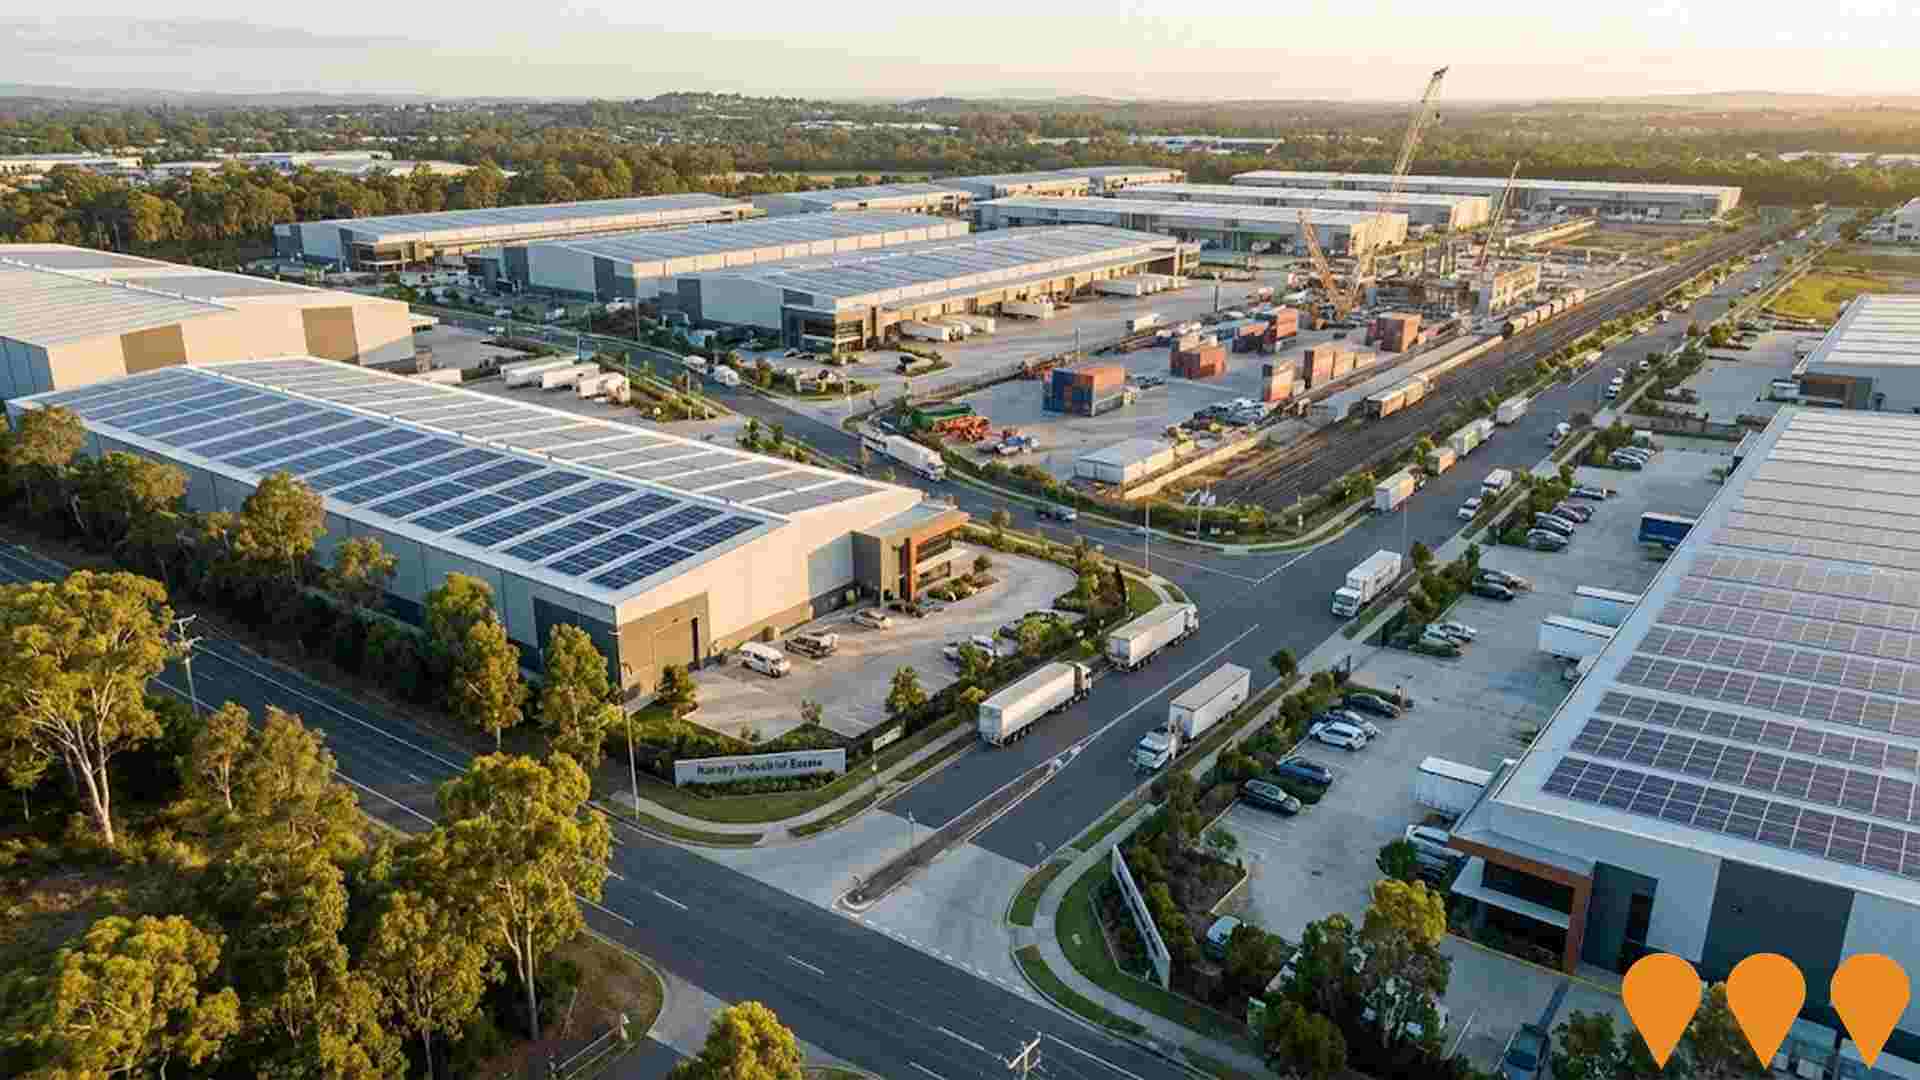
 Denotes AI-based impression for illustrative purposes only, not to be taken as definitive under any circumstances. Please follow links and conduct other investigations from the project's source for actual imagery. Developers and project owners wishing us to use original imagery please Contact Us and we will do so.
Frequently Asked Questions - Infrastructure
Loganlea Station Relocation
Relocation of Loganlea Station as part of the Logan and Gold Coast Faster Rail project. New station will feature improved accessibility, platforms for four-track configuration, and enhanced passenger facilities.

Logan Central Civic and Community Precinct
Major civic redevelopment project transforming Logan Central with new civic buildings, community facilities, public spaces, and mixed-use developments. The project aims to create a vibrant heart for the Logan community.

Paradise Road Large Format Retail Development
High-exposure DA-approved retail development site in the heart of Logan's dynamic commercial precinct. The site sits directly behind IKEA and the Logan Super Centre, making it ideal for large format retail users. DA and Operational Works approvals are in place for two substantial showrooms totaling approximately 2,500 square meters with 71 on-site car parks. The property is zoned for Retail Showroom use with flexibility for alternate uses subject to council approval. The site features drive-through access with two driveways allowing full ingress and egress via Paradise Road and Meakin Road, plus approval to modify existing traffic lights for vehicle-activated right turn signals into the site.

Kuraby Residential Development (Stockland)
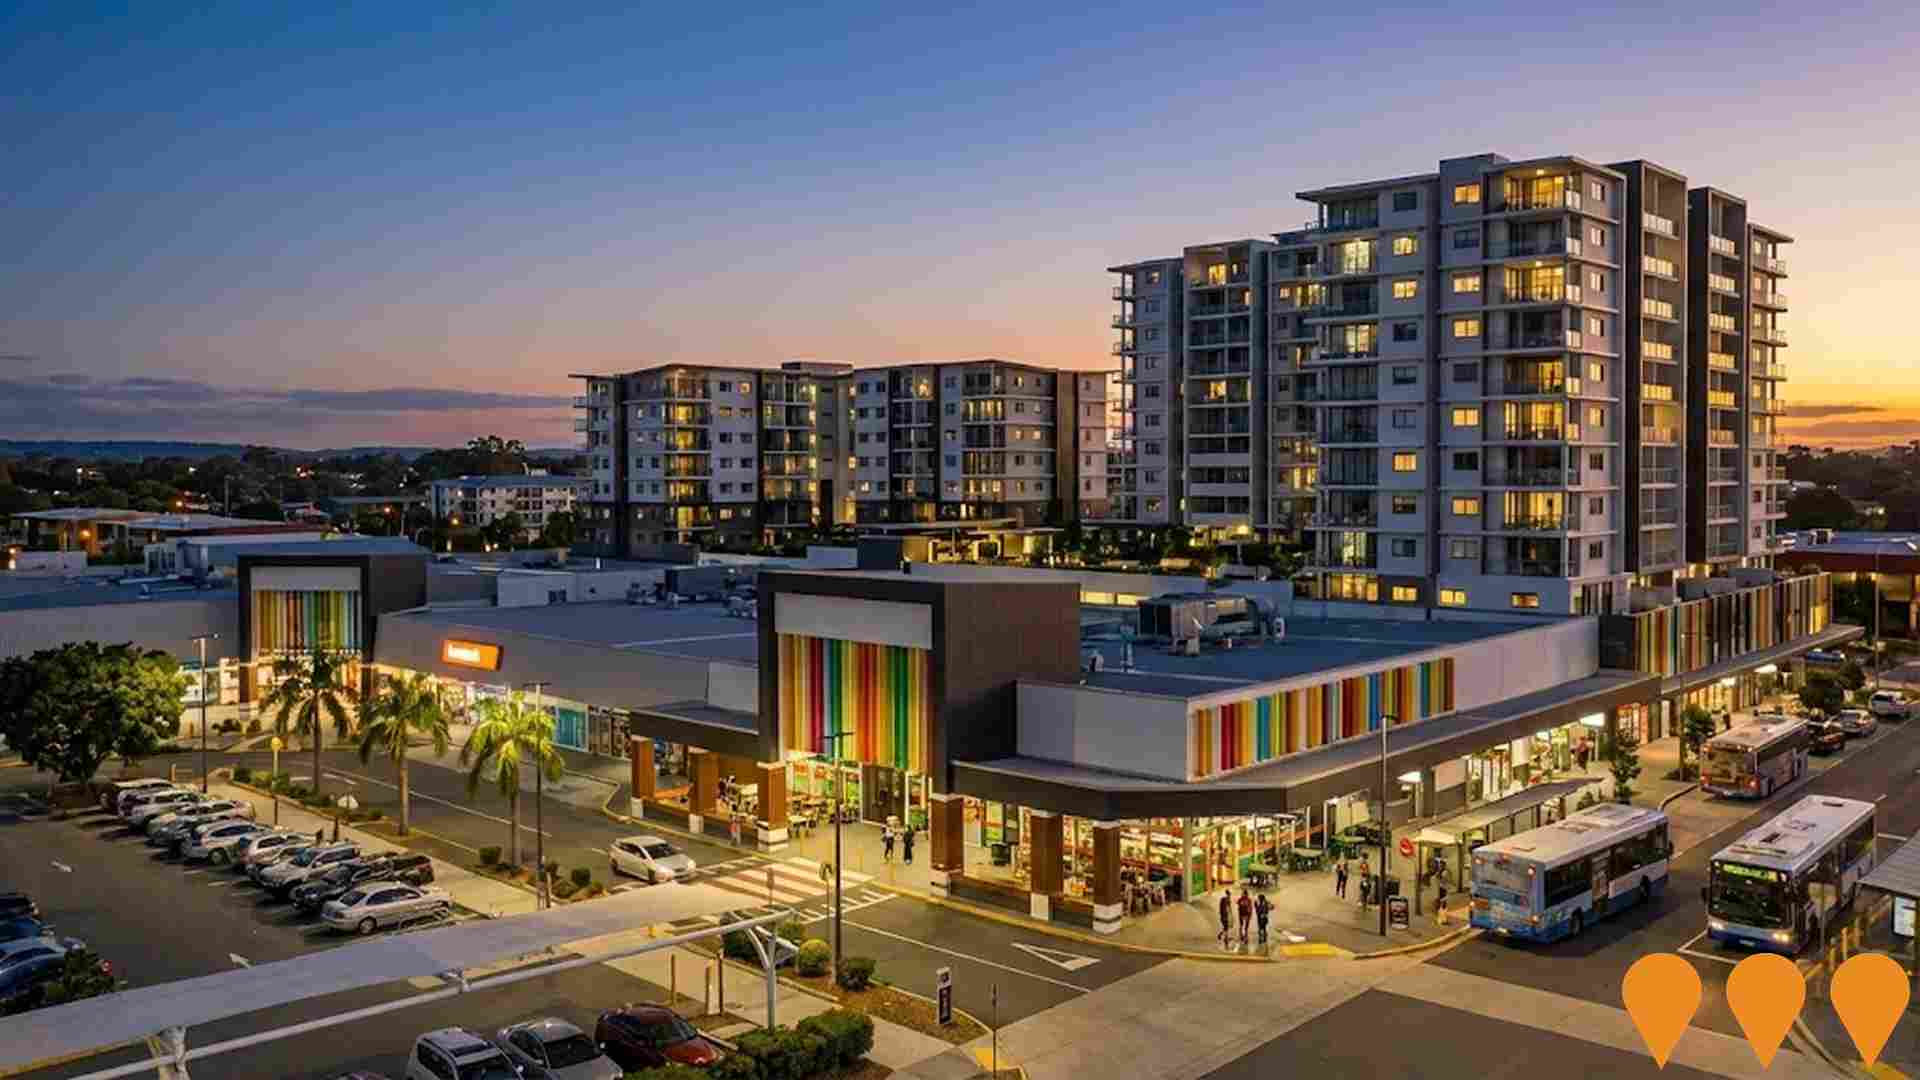
Large-scale master-planned residential community featuring approximately 850 new homes, integrated parks and recreational facilities, retail precinct, and community centre. Includes affordable housing component.

Slacks Creek Recovery Plan
Comprehensive creek recovery and rehabilitation project involving riparian corridor restoration, community-led initiatives, recreational activities and public artwork activations. Over 90,000 native species planted along 2.5km of creek corridor.
Kuraby Industrial Estate Expansion
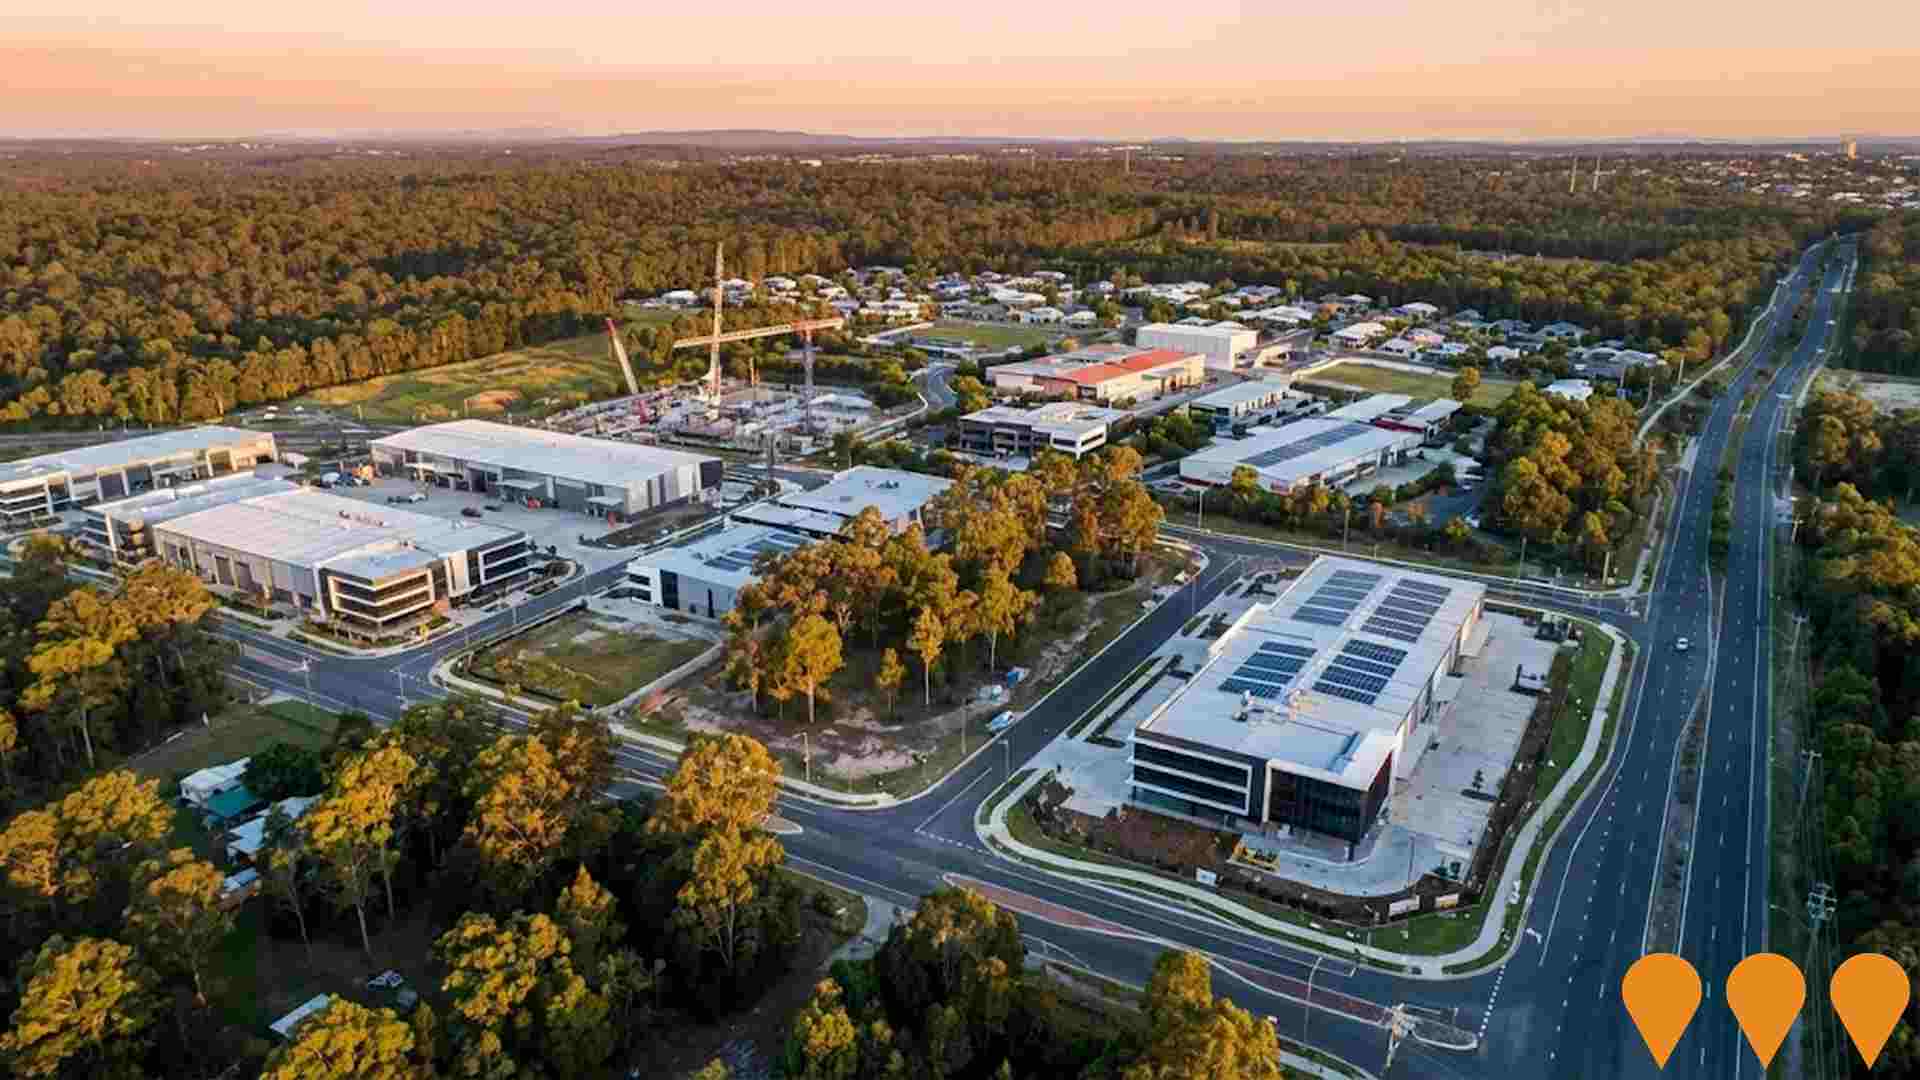
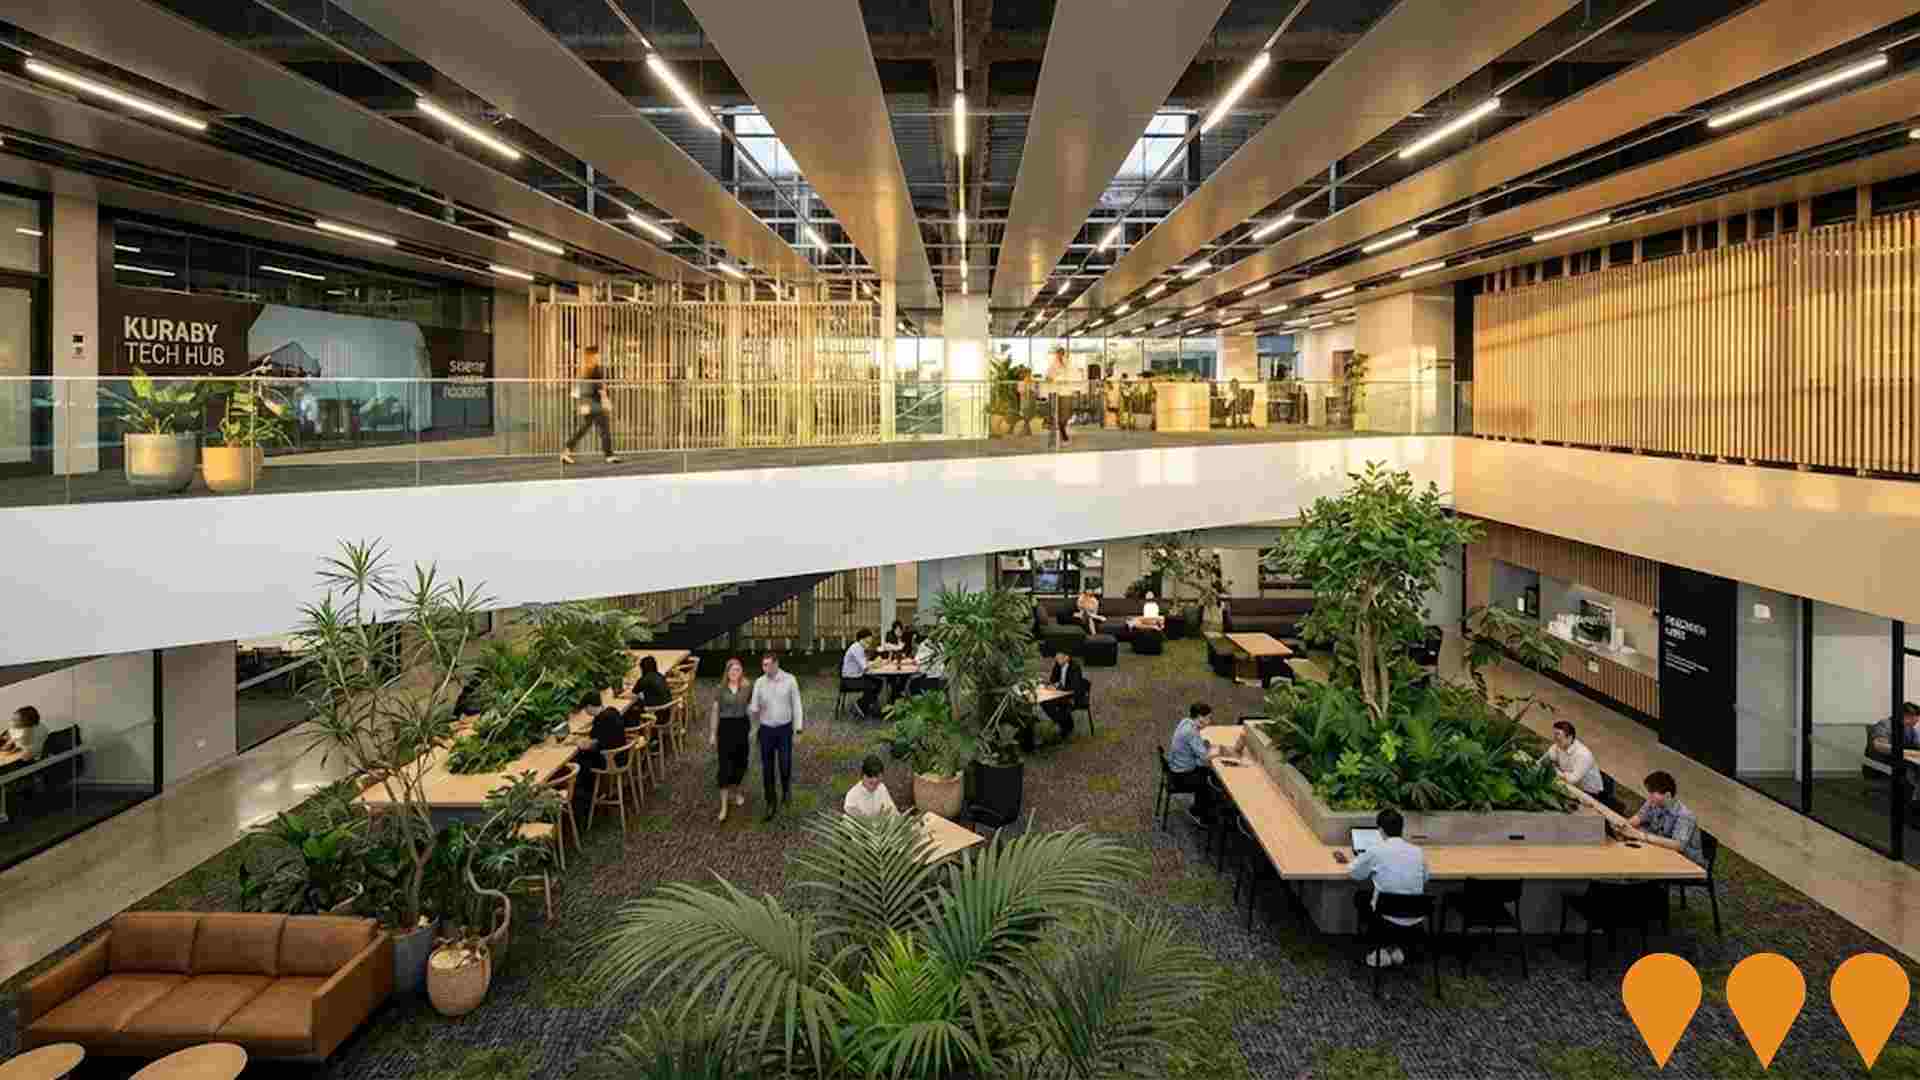
Expansion of existing industrial estate to include additional warehousing, light manufacturing facilities, logistics centres, and improved transport connections. Focus on sustainable industrial practices.
Northwest Healthcare Centre - Meadowbrook
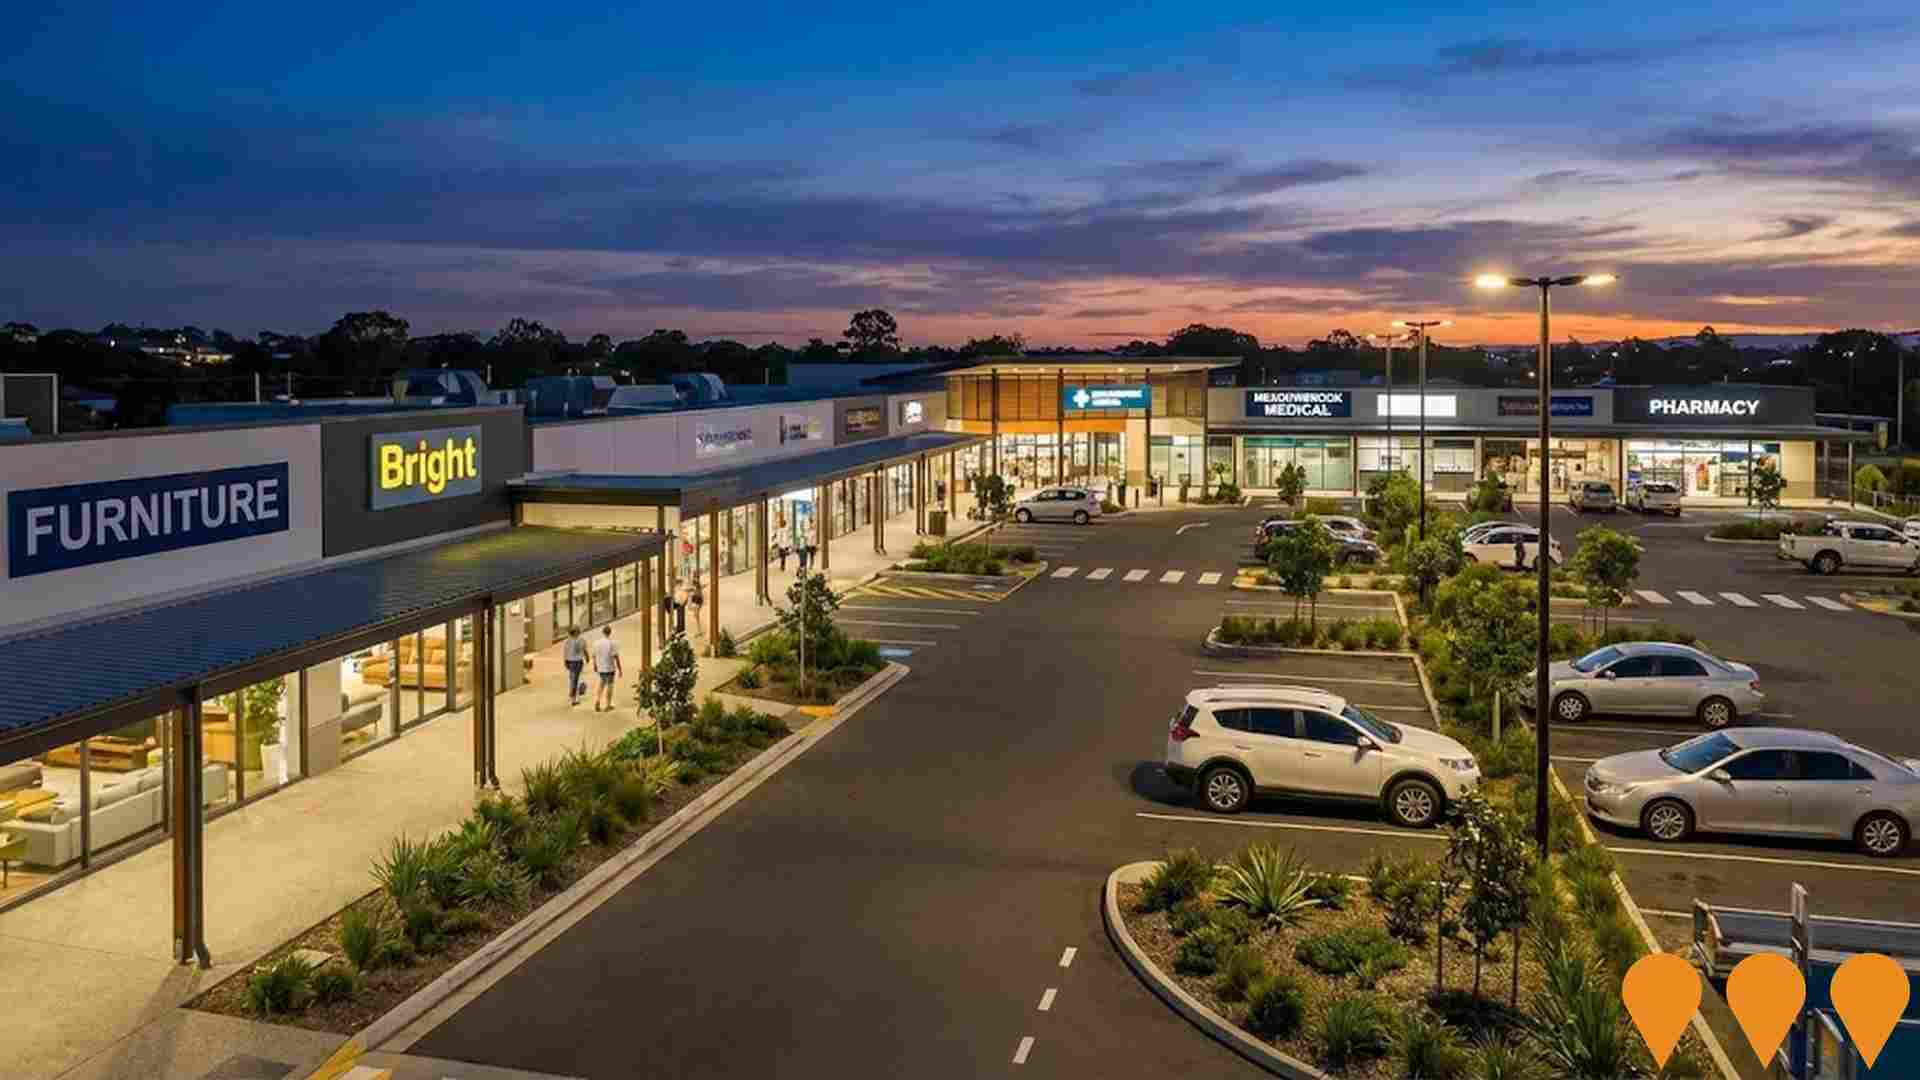
Seven-storey private healthcare centre by Northwest Healthcare Properties. Approved development will offer comprehensive medical services, agglomerating 15 house sites with at-grade parking. Strategically co-located with Logan Hospital.

Logan Central Implementation Plan
Comprehensive urban renewal plan for Logan Central including mixed-use developments, improved transport connectivity, commercial precincts, community facilities, and civic developments. Aims to revitalize central Logan as a key regional hub with modern infrastructure, public spaces, and government services. Part of broader Logan Plan 2025 strategy to accommodate population growth to 500,000 by 2036.

Employment
Employment drivers in Woodridge are experiencing difficulties, placing it among the bottom 20% of areas assessed across Australia
Woodridge has a balanced workforce with representation from both white and blue collar jobs. Manufacturing and industrial sectors are strongly represented in the area.
As of September 2025, Woodridge's unemployment rate is 13.5%. This rate has seen an estimated growth of 9.8% over the past year. There are currently 5,141 residents employed in Woodridge, with an unemployment rate of 9.5%, which is higher than Greater Brisbane's rate of 4.0%. Workforce participation in Woodridge lags behind Greater Brisbane at 46.3% compared to 64.5%.
The dominant employment sectors among Woodridge residents include health care & social assistance, manufacturing, and transport, postal & warehousing. Manufacturing is particularly notable with employment levels at 2.0 times the regional average. However, professional & technical jobs are under-represented in Woodridge, making up only 3.4% of the workforce compared to 8.9% in Greater Brisbane. Over the year to September 2025, employment in Woodridge increased by 9.8%, while the labour force grew by 2.4%. This resulted in a decrease in the unemployment rate by 5.8 percentage points. In comparison, Greater Brisbane recorded employment growth of 3.8% and a fall in unemployment of 0.5 percentage points. State-level data as of 25-Nov shows Queensland's employment contracted by 0.01%, with an unemployment rate of 4.2%. Nationally, the unemployment rate is 4.3%. Jobs and Skills Australia's national employment forecasts from May-25 suggest that over five years, national employment is expected to expand by 6.6% and by 13.7% over ten years. Applying these projections to Woodridge's employment mix indicates local employment should increase by 5.8% over five years and 12.5% over ten years.
Frequently Asked Questions - Employment
Income
Income metrics place the area in the bottom 10% of locations nationally according to AreaSearch analysis
Woodridge SA2 had a median taxpayer income of $40,532 and an average of $43,591 in financial year 2022, according to postcode level ATO data aggregated by AreaSearch. This was below the national average, contrasting with Greater Brisbane's median income of $55,645 and average income of $70,520 during the same period. Based on Wage Price Index growth of 13.99% from financial year 2022 to September 2025, current estimates would be approximately $46,202 (median) and $49,689 (average). According to the 2021 Census, household, family and personal incomes in Woodridge all fell between the 4th and 4th percentiles nationally. The income bracket of $800 - 1,499 captured 33.3% of the community (4,632 individuals), differing from patterns across regional levels where $1,500 - 2,999 dominated with 33.3%. Housing affordability pressures were severe, with only 78.1% of income remaining, ranking at the 4th percentile.
Frequently Asked Questions - Income
Housing
Woodridge displays a diverse mix of dwelling types, with a higher proportion of rental properties than the broader region
Woodridge's dwelling structure, as per the latest Census, consisted of 60.2% houses and 39.8% other dwellings (semi-detached, apartments, 'other' dwellings). Brisbane metro had a higher proportion of houses at 77.9%, with 22.2% being other dwellings. Home ownership in Woodridge was lower than Brisbane metro, standing at 18.2%. The remaining dwellings were either mortgaged (19.5%) or rented (62.3%). The median monthly mortgage repayment in Woodridge was $1,200, significantly below the Brisbane metro average of $1,638 and the national average of $1,863. The median weekly rent figure in Woodridge was recorded at $280, substantially lower than Brisbane metro's $320 and the national figure of $375.
Frequently Asked Questions - Housing
Household Composition
Woodridge features high concentrations of group households and lone person households, with a lower-than-average median household size
Family households account for 63.3% of all households, consisting of 24.5% couples with children, 15.8% couples without children, and 21.3% single parent families. Non-family households constitute the remaining 36.7%, with lone person households at 30.8% and group households making up 5.8%. The median household size is 2.7 people, which is smaller than the Greater Brisbane average of 2.8.
Frequently Asked Questions - Households
Local Schools & Education
Woodridge faces educational challenges, with performance metrics placing it in the bottom quartile of areas assessed nationally
The area's university qualification rate is 12.7%, significantly lower than Greater Brisbane's average of 30.5%. Bachelor degrees are the most common at 8.9%, followed by postgraduate qualifications (2.9%) and graduate diplomas (0.9%). Vocational credentials are prevalent, with 36.6% of residents aged 15+ holding them, including advanced diplomas (8.9%) and certificates (27.7%). Educational participation is high, with 35.9% currently enrolled in formal education: 12.8% in primary, 11.3% in secondary, and 3.6% in tertiary education.
Educational participation is notably high, with 35.9% of residents currently enrolled in formal education. This includes 12.8% in primary education, 11.3% in secondary education, and 3.6% pursuing tertiary education.
Frequently Asked Questions - Education
Schools Detail
Nearby Services & Amenities
Transport
Transport servicing is good compared to other areas nationally based on assessment of service frequency, route connectivity and accessibility
Woodridge has 64 active public transport stops. These include both train and bus services. There are 24 different routes operating in total.
Each week, these routes collectively facilitate 2,087 passenger trips. The average distance from a resident's location to the nearest transport stop is 168 meters. Daily service frequency averages 298 trips across all routes, translating to approximately 32 weekly trips per individual stop.
Frequently Asked Questions - Transport
Transport Stops Detail
Health
Health performance in Woodridge is well below average with considerably higher than average prevalence of common health conditions and to an even higher degree among older age cohorts
Woodridge faces significant health challenges with higher-than-average prevalence of common conditions, particularly among older age groups. Approximately 47% (~6,482 people) have private health cover, compared to Greater Brisbane's 49.5% and the national average of 55.3%. Mental health issues affect 9.8% of residents, while asthma impacts 8.5%.
Conversely, 66.5% report no medical ailments, slightly lower than Greater Brisbane's 68.5%. The area has 15.1% (2,093 people) aged 65 and over, with health outcomes requiring more attention in this demographic.
Frequently Asked Questions - Health
Cultural Diversity
Woodridge is among the most culturally diverse areas in the country based on AreaSearch assessment of a range of language and cultural background related metrics
Woodridge has a high level of cultural diversity, with 38.1% of its population speaking a language other than English at home and 43.4% born overseas. Christianity is the main religion in Woodridge, making up 48.0% of people there, which is higher than the Greater Brisbane average. Islam is overrepresented in Woodridge, comprising 14.1% of its population compared to the regional average of 7.6%.
In terms of ancestry, the top three groups are Other at 27.8%, English at 19.7%, and Australian at 18.2%. Notably, Samoan (3.7%), Maori (2.8%), and New Zealand (1.3%) ethnicities are also overrepresented in Woodridge compared to regional averages of 2.4%, 2.2%, and 1.4% respectively.
Frequently Asked Questions - Diversity
Age
Woodridge's young demographic places it in the bottom 15% of areas nationwide
Woodridge's median age is 33 years, which is younger than Greater Brisbane's average of 36 years and significantly lower than the national average of 38 years. Compared to Greater Brisbane, Woodridge has a higher percentage of residents aged 5-14 (15.4%) but fewer residents aged 35-44 (12.8%). According to post-2021 Census data, the 75-84 age group has increased from 4.8% to 5.6% of Woodridge's population, while the 45-54 cohort has declined from 11.3% to 10.6%. Demographic modeling indicates that Woodridge's age profile will change significantly by 2041. The 85+ cohort is projected to grow by 131%, adding 345 residents to reach a total of 610. Residents aged 65 and older are expected to represent 66% of the population growth, while declines are projected for the 5-14 and 0-4 age cohorts.
