Chart Color Schemes
This analysis uses ABS Statistical Areas Level 2 (SA2) boundaries, which can materially differ from Suburbs and Localities (SAL) even when sharing similar names.
SA2 boundaries are defined by the Australian Bureau of Statistics and are designed to represent communities for statistical reporting (e.g., census and ERP).
Suburbs and Localities (SAL) represent commonly-used suburb/locality names (postal-style areas) and may use different geographic boundaries. For comprehensive analysis, consider reviewing both boundary types if available.
est. as @ -- *
ABS ERP | -- people | --
2021 Census | -- people
Sales Activity
Curious about local property values? Filter the chart to assess the volume and appreciation (including resales) trends and regional comparisons, or scroll to the map below view this information at an individual property level.
Find a Recent Sale
Sales Detail
Population
An assessment of population growth drivers in Tarragindi reveals an overall ranking slightly below national averages considering recent, and medium term trends
Tarragindi's population was around 11,616 as of November 2025. This showed an increase of 672 people from the 2021 Census figure of 10,944. The growth was inferred from ABS's estimated resident population of 11,593 in June 2024 and additional validated new addresses since the Census date. This resulted in a population density of 2,553 persons per square kilometer, placing Tarragindi in the upper quartile nationally according to AreaSearch assessments. The area's 6.1% growth since the census was within 2.8 percentage points of the national average (8.9%). Overseas migration contributed approximately 60.6% of overall population gains recently.
AreaSearch uses ABS/Geoscience Australia projections for each SA2 area, released in 2024 with a base year of 2022. For areas not covered by this data and years post-2032, Queensland State Government's SA2 area projections are adopted, released in 2023 based on 2021 data. Note that these state projections do not provide age category splits; thus, AreaSearch applies proportional growth weightings aligned with ABS Greater Capital Region projections for each age cohort. Considering projected demographic shifts, lower quartile growth of Australian statistical areas is anticipated. Tarragindi is expected to grow by 350 persons to reach a total population of 12,964 by 2041, reflecting an increase of 2.8% over the 17-year period based on the latest annual ERP population numbers.
Frequently Asked Questions - Population
Development
Recent residential development output has been above average within Tarragindi when compared nationally
Tarragindi averaged around 63 new dwelling approvals annually over the past five financial years, totalling 317 homes. As of FY26, 21 approvals have been recorded. Between FY21 and FY25, an average of 1.6 people moved to the area per dwelling built. However, this increased to 4.7 people per dwelling over the past two financial years, suggesting growing popularity and potential undersupply. New homes are being built at an average expected construction cost value of $721,000, indicating a focus on the premium market.
In FY26, $3.0 million in commercial approvals have been registered, showing limited commercial development focus compared to residential. Compared to Greater Brisbane, Tarragindi has moderately higher development activity, at 31.0% above the regional average per person over the five-year period. New building activity comprises 67.0% standalone homes and 33.0% townhouses or apartments, expanding medium-density options and creating a mix of opportunities across price brackets. This shows a significant change from the current housing mix, which is currently 95.0% houses.
The location has approximately 237 people per dwelling approval, indicating a low density market. Population forecasts estimate Tarragindi will gain 327 residents by 2041. At current development rates, new housing supply should comfortably meet demand, providing good conditions for buyers and potentially supporting growth beyond current population projections.
Frequently Asked Questions - Development
Infrastructure
Tarragindi has very high levels of nearby infrastructure activity, ranking in the top 20% nationally
Changes to local infrastructure significantly impact an area's performance. AreaSearch has identified 22 projects that may affect this region. Notable initiatives include Cross River Rail - Moorooka Station Upgrade, European Train Control System (ETCS), Greenslopes Private Hospital Master Plan Redevelopment, and Parkside Yeronga. The following list details those likely to be most relevant.
Professional plan users can use the search below to filter and access additional projects.
INFRASTRUCTURE SEARCH
 Denotes AI-based impression for illustrative purposes only, not to be taken as definitive under any circumstances. Please follow links and conduct other investigations from the project's source for actual imagery. Developers and project owners wishing us to use original imagery please Contact Us and we will do so.
Frequently Asked Questions - Infrastructure
Cross River Rail
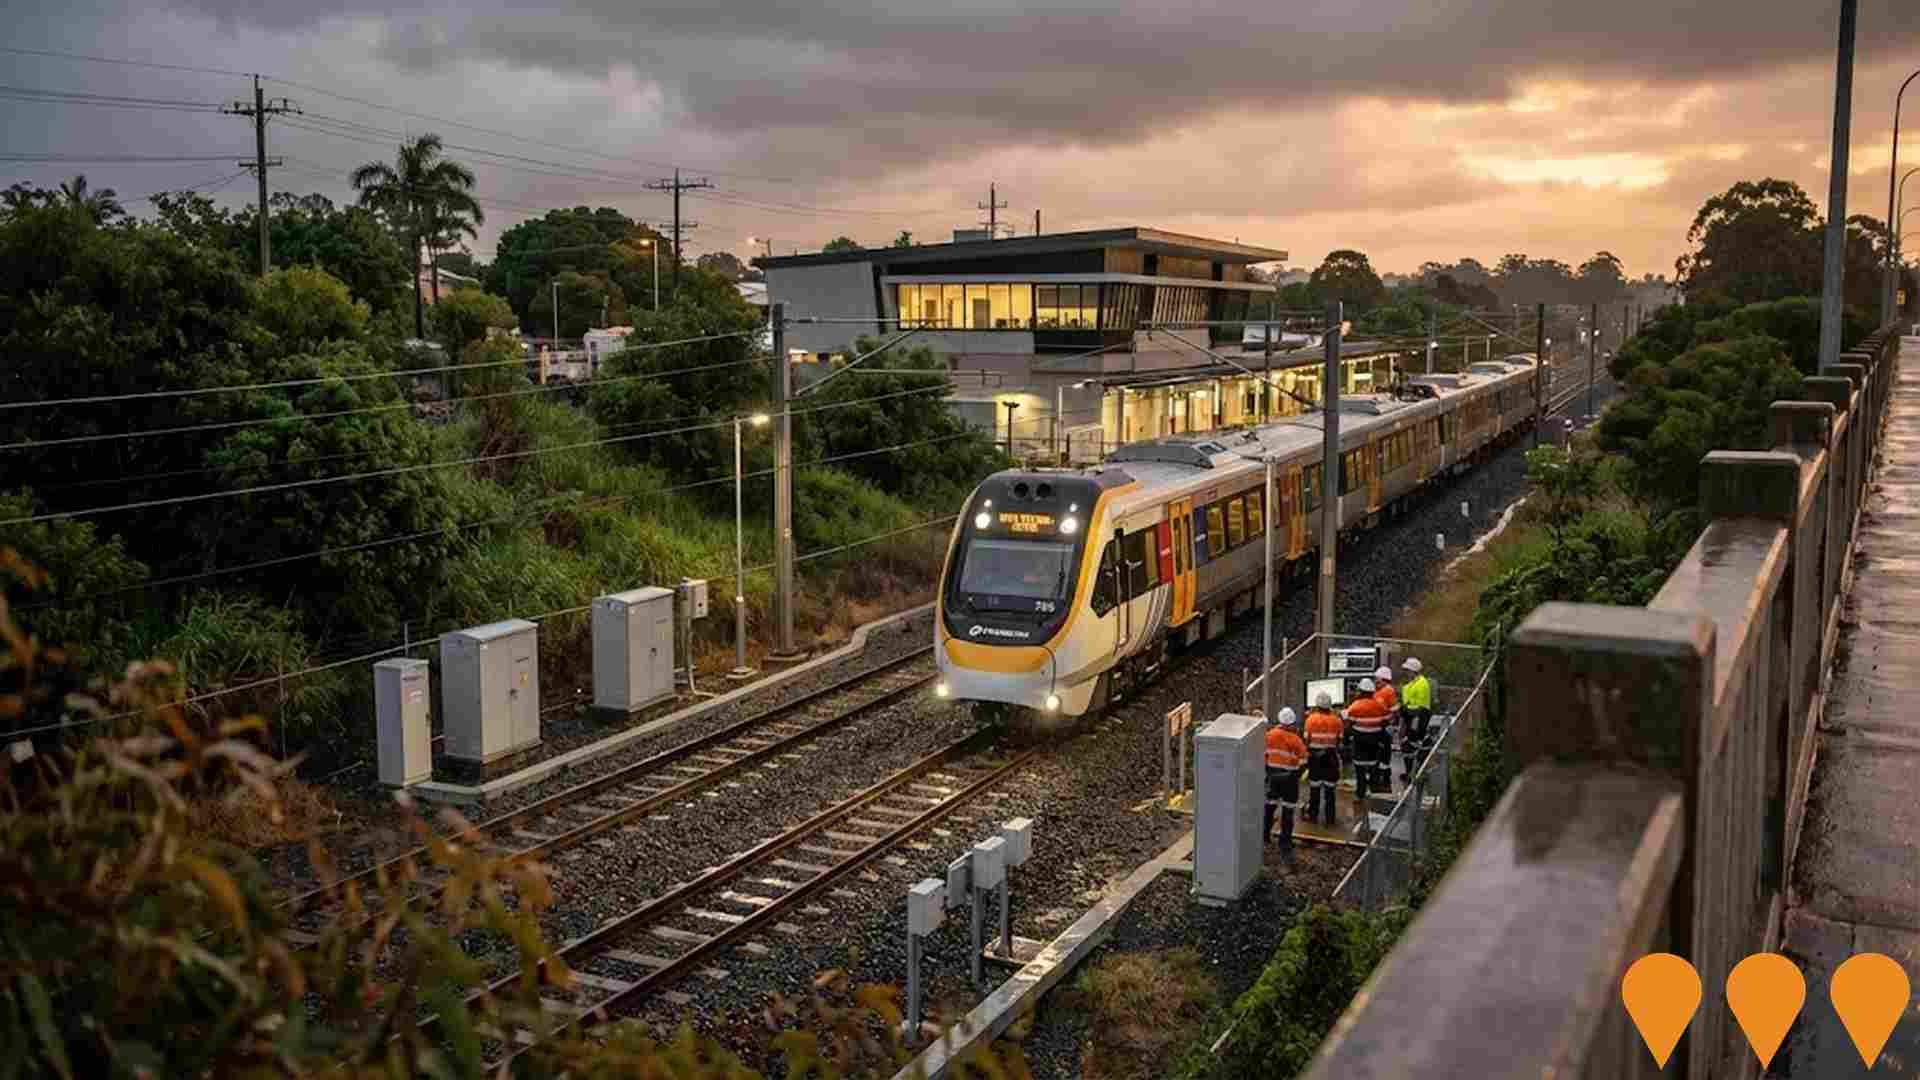
Queensland's largest public transport infrastructure project: a new 10.2 km rail line with 5.9 km twin tunnels under the Brisbane CBD and Brisbane River, four new underground stations (Boggo Road, Woolloongabba, Albert Street, Roma Street), upgrade of Exhibition station, rebuild of Dutton Park station, and extensive integration works connecting the new tunnels to the existing Queensland Rail network including ETCS Level 2 signalling rollout and southside surface station handovers.

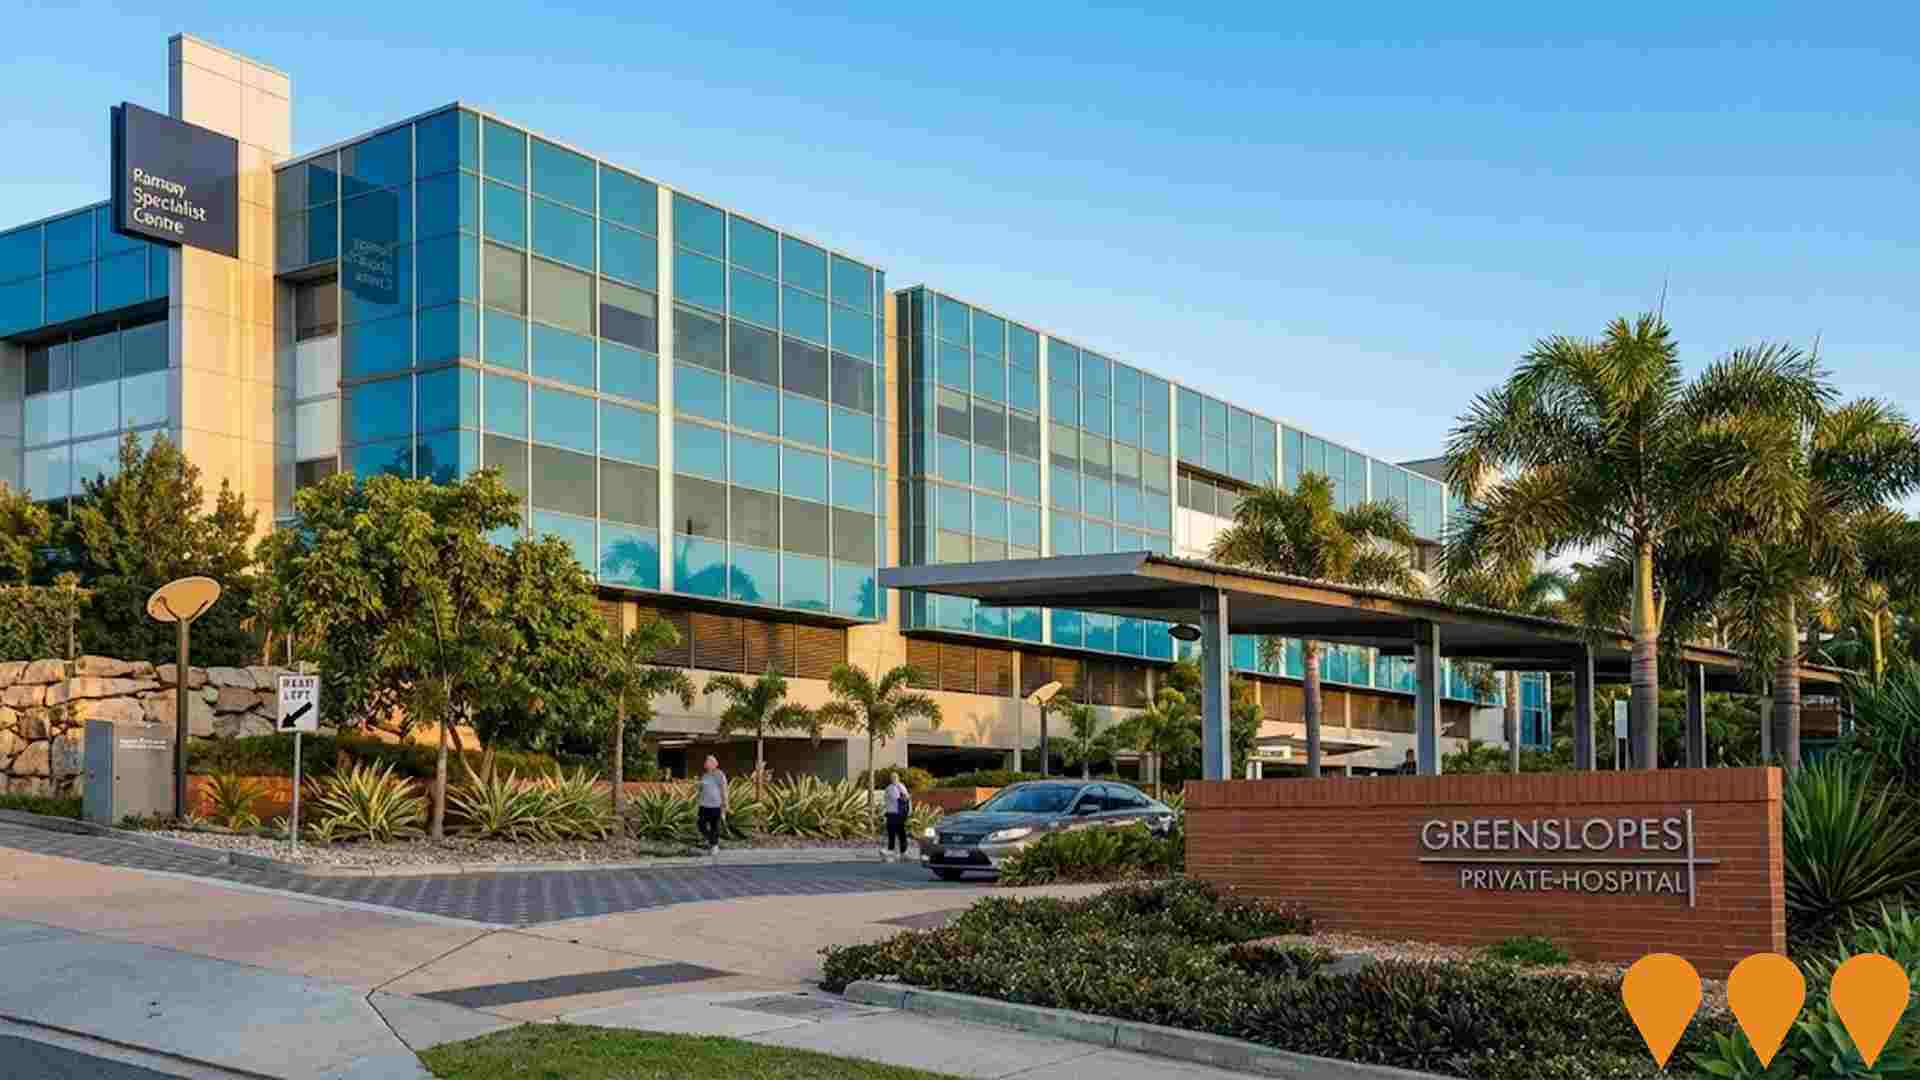
Greenslopes Private Hospital Master Plan Redevelopment
Long term multi stage campus wide redevelopment of Greenslopes Private Hospital, Ramsay Health Care's flagship tertiary teaching hospital in Brisbane. The master plan program includes a new clinical services and infill building, additional operating theatres, expanded intensive care and day surgery capacity, refurbished emergency department and new inpatient wards, delivered through a series of major expansion projects including the recently completed $70m plus infill and theatre expansion stages.
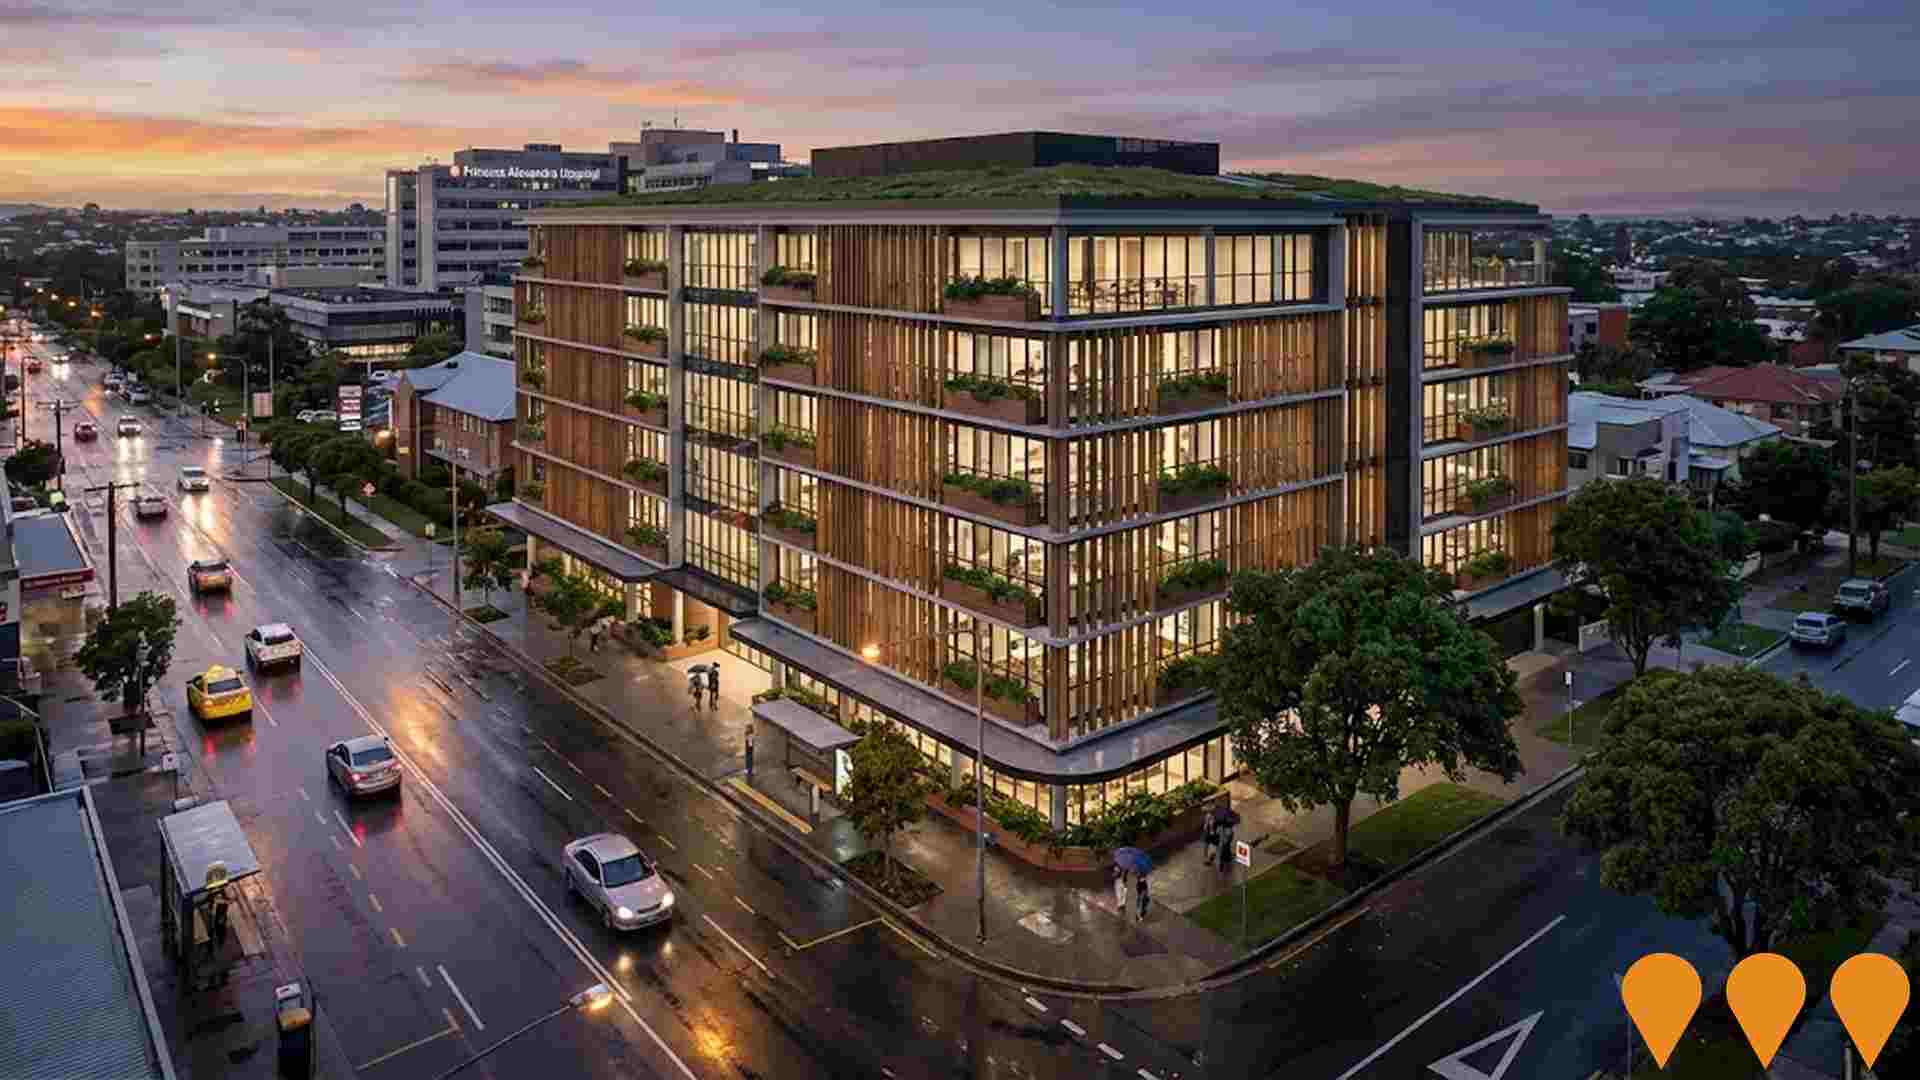
Annerley Health Hub
A 6 to 7 storey private hospital and health hub next to the Princess Alexandra Hospital precinct. Around 7,500 to 7,800 sqm NLA for health care services including general practice, diagnostic imaging, pharmacy, pathology, radiology, day surgery, and allied health, with approx. 200 parking spaces and streetscape upgrades. Ministerial Infrastructure Designation approved 14 Aug 2024.
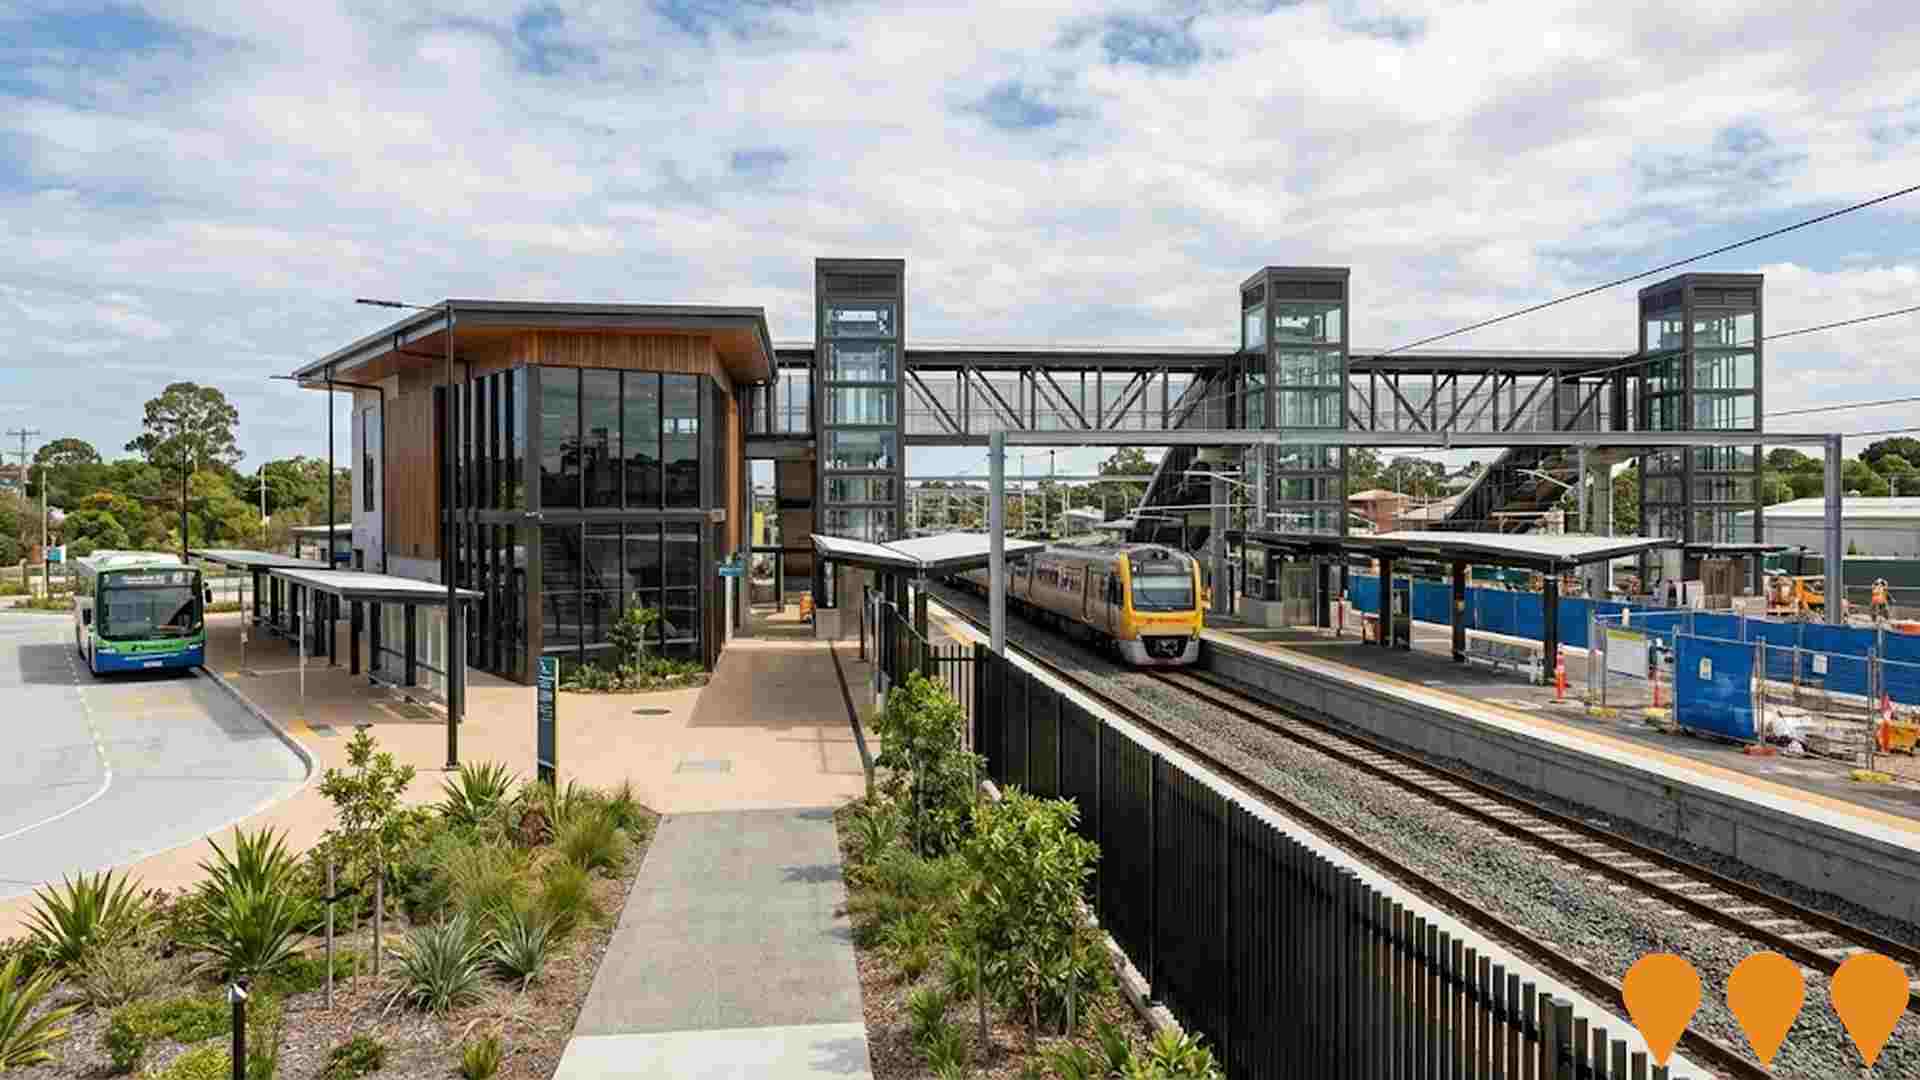
Cross River Rail - Moorooka Station Upgrade
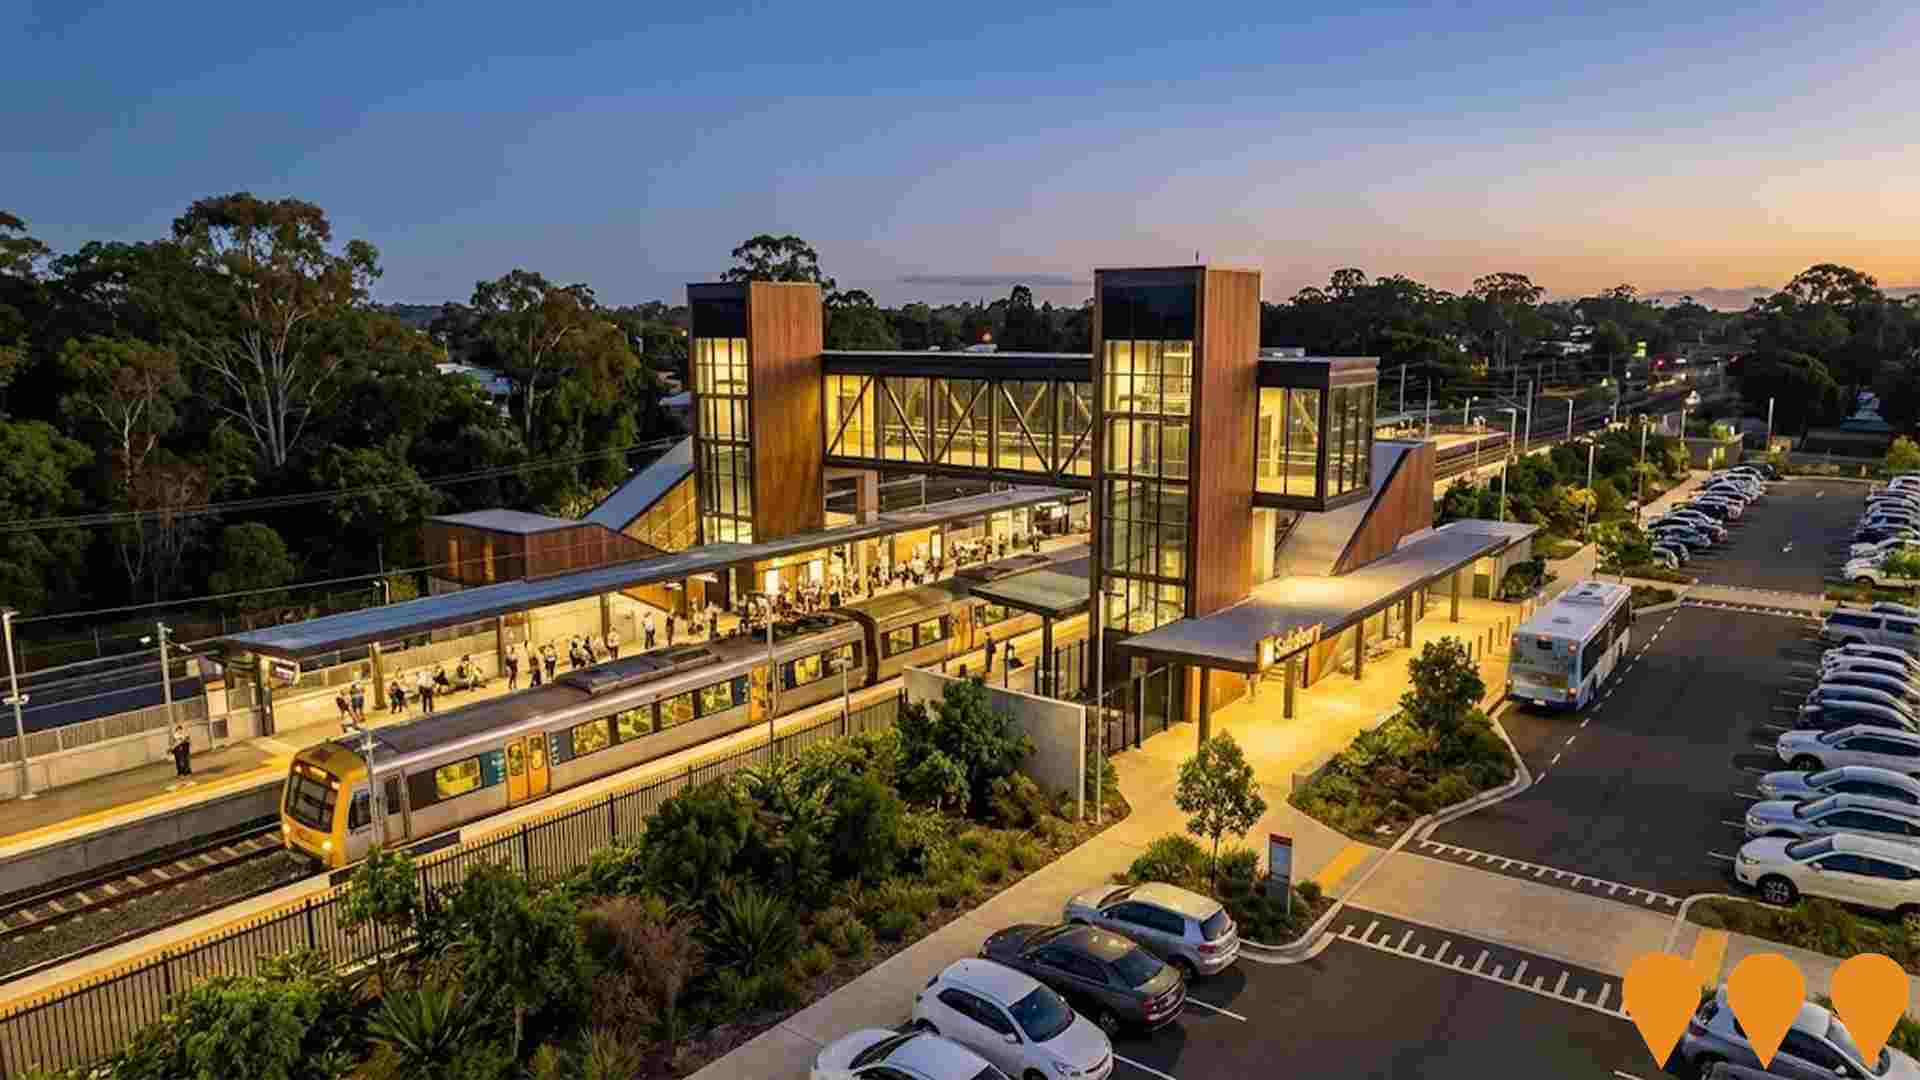
Major upgrade of Moorooka station as part of the $7.848 billion Cross River Rail project. The station is being rebuilt to improve accessibility and functionality, including an additional (third) platform, a new station building, a new overpass with three lifts, accessible car parking, new bus bay facilities, canopies, and secure bicycle storage. Early works are underway, with major construction expected to commence in 2026.
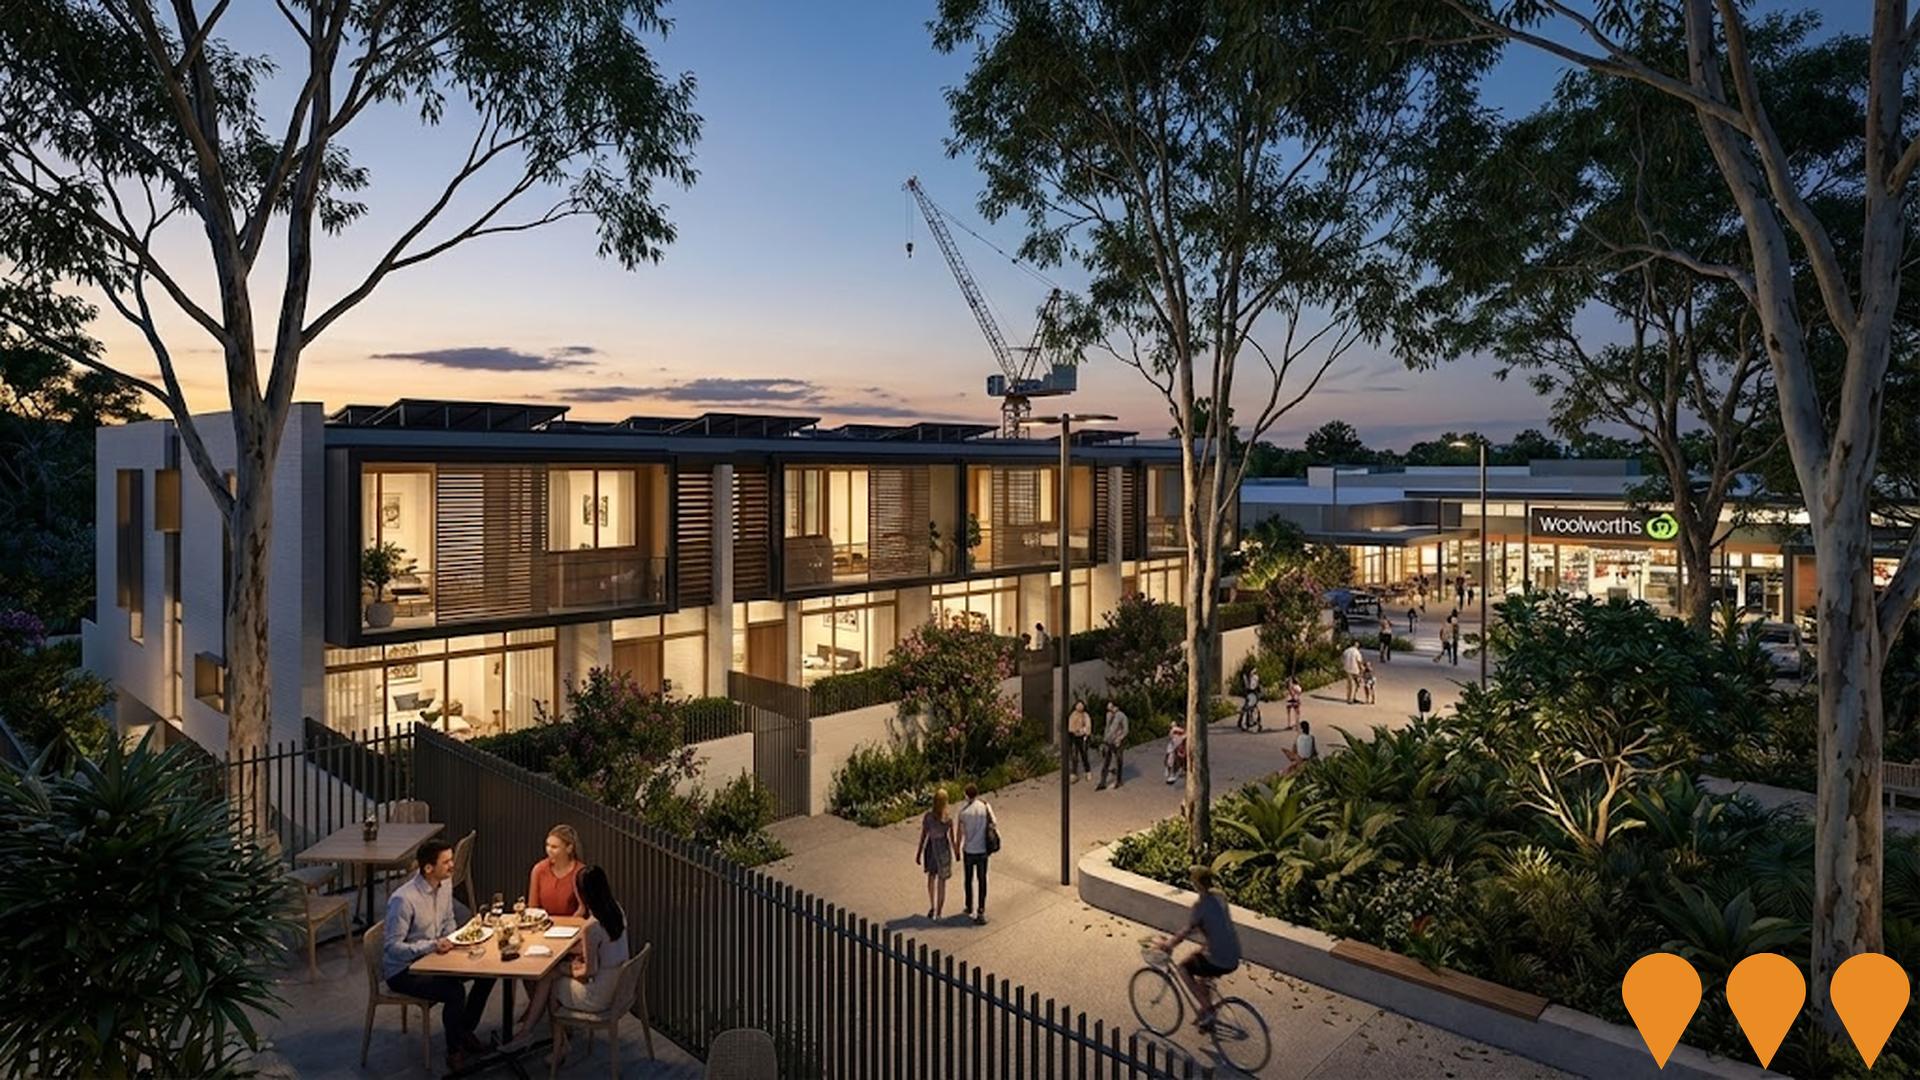
Yeerongpilly Green
An $850 million master-planned transit-oriented urban village on a 14-hectare former Animal Research Institute site in Yeerongpilly, 7km from Brisbane CBD. The mixed-use development includes approximately 1,200 dwellings, a retail precinct anchored by Woolworths (opened August 2023), commercial spaces, dining and entertainment venues, heritage building restoration, excellent public transport connectivity to Yeerongpilly Station, and 1.8 hectares of parkland. As of 2025, construction is ongoing with retail village complete, initial townhouses delivered, and further residential stages (including proposed high-rise towers) in progress. Expected to generate ~6,600 construction jobs and ~1,000 ongoing jobs.
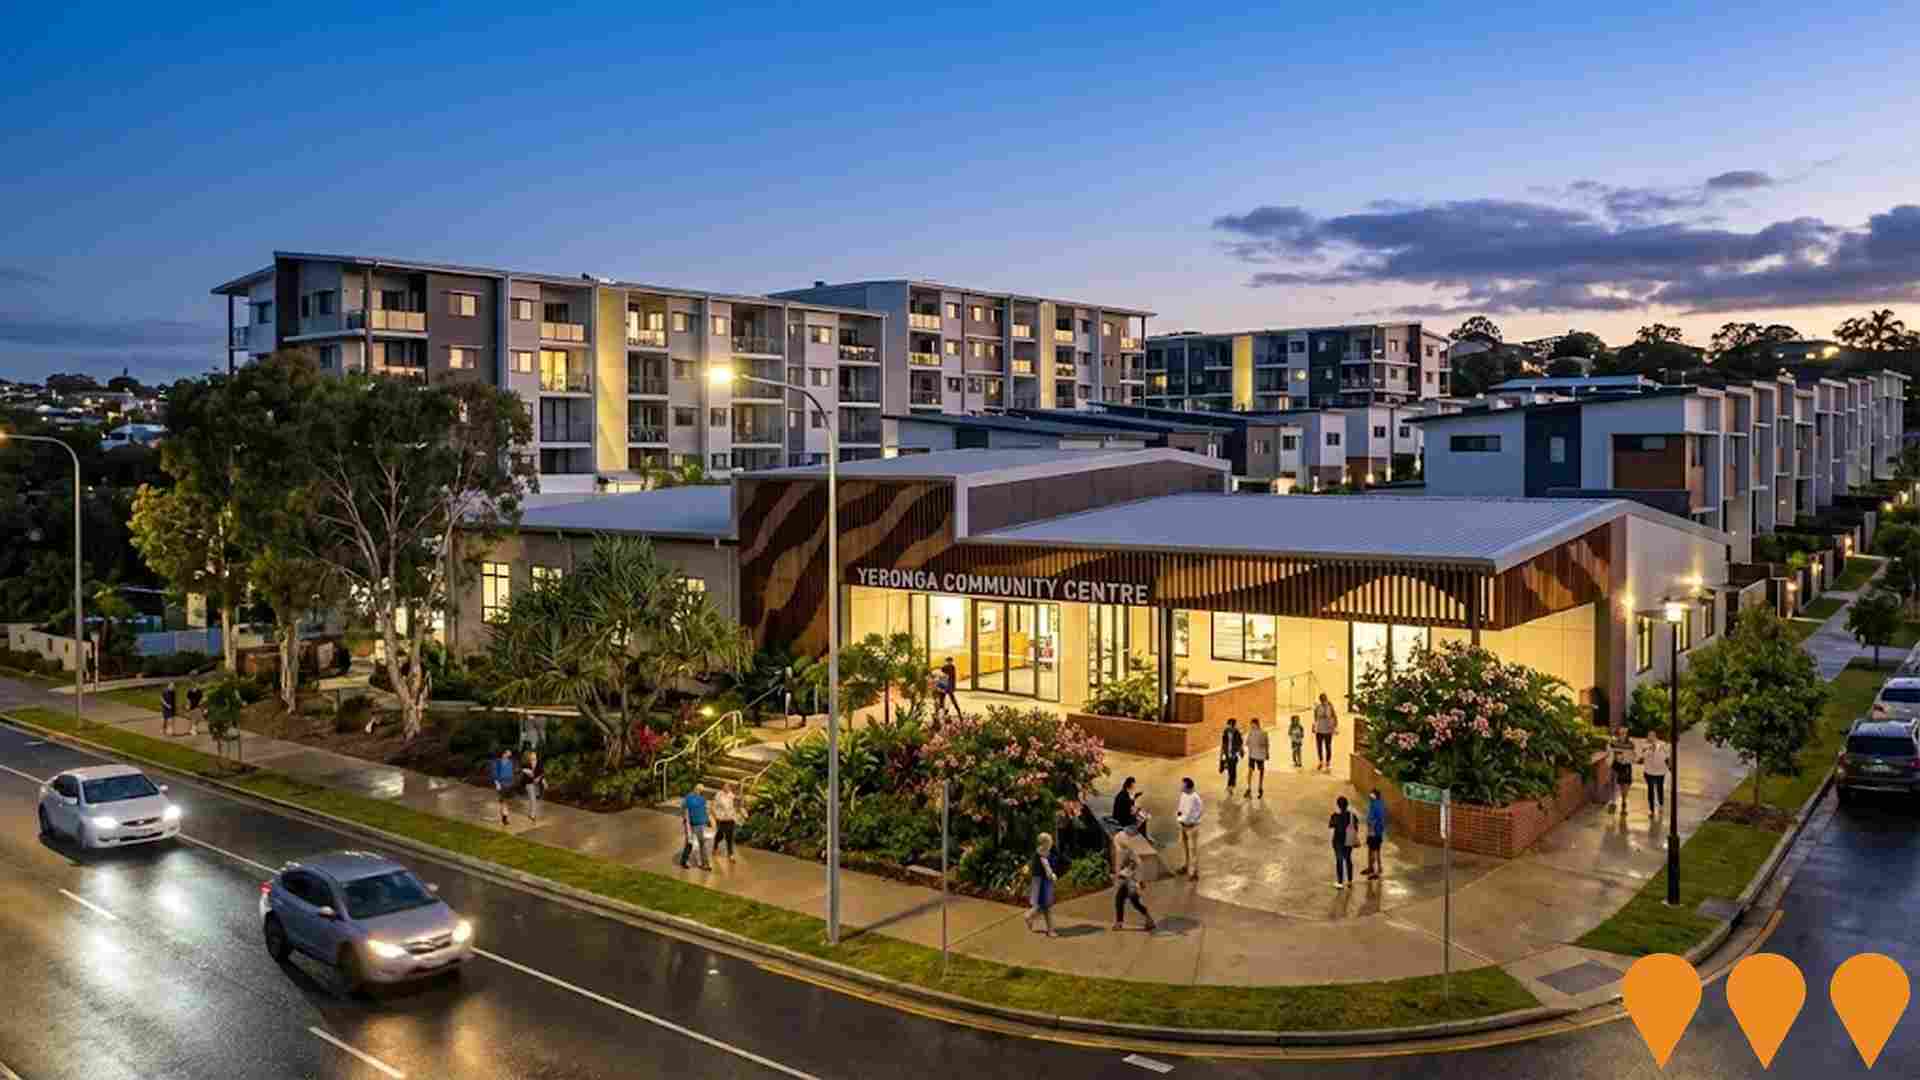
Parkside Yeronga
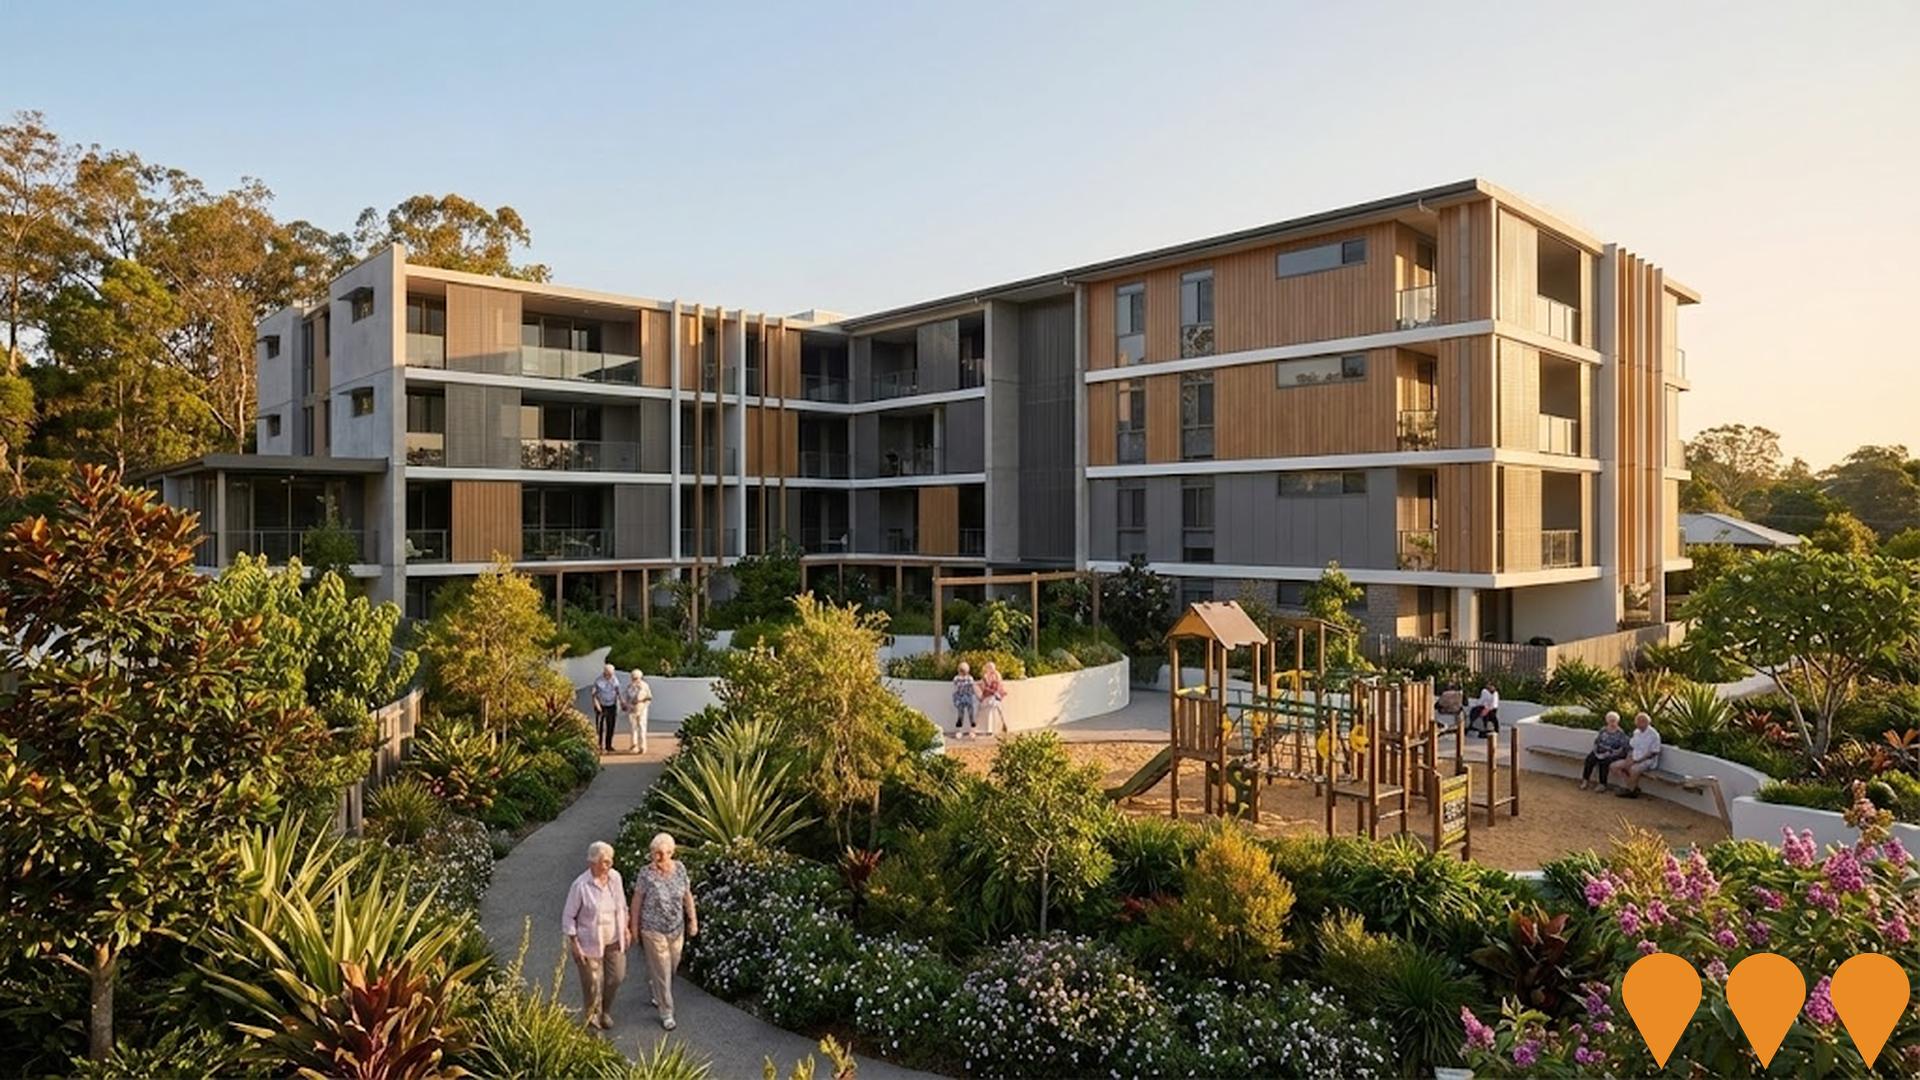
Mixed-use urban renewal of the former Yeronga TAFE site (3.3 ha) delivering 281 residences (169 independent living retirement apartments by RetireAustralia, 75 social/affordable dwellings by Brisbane Housing Company, and 37 townhomes by JGL Properties), a new community centre, small-scale retail/commercial spaces, and over 4,000 sqm of public open space. Construction is advanced, with first settlements commencing from mid-2025 and staged completions through 2026.
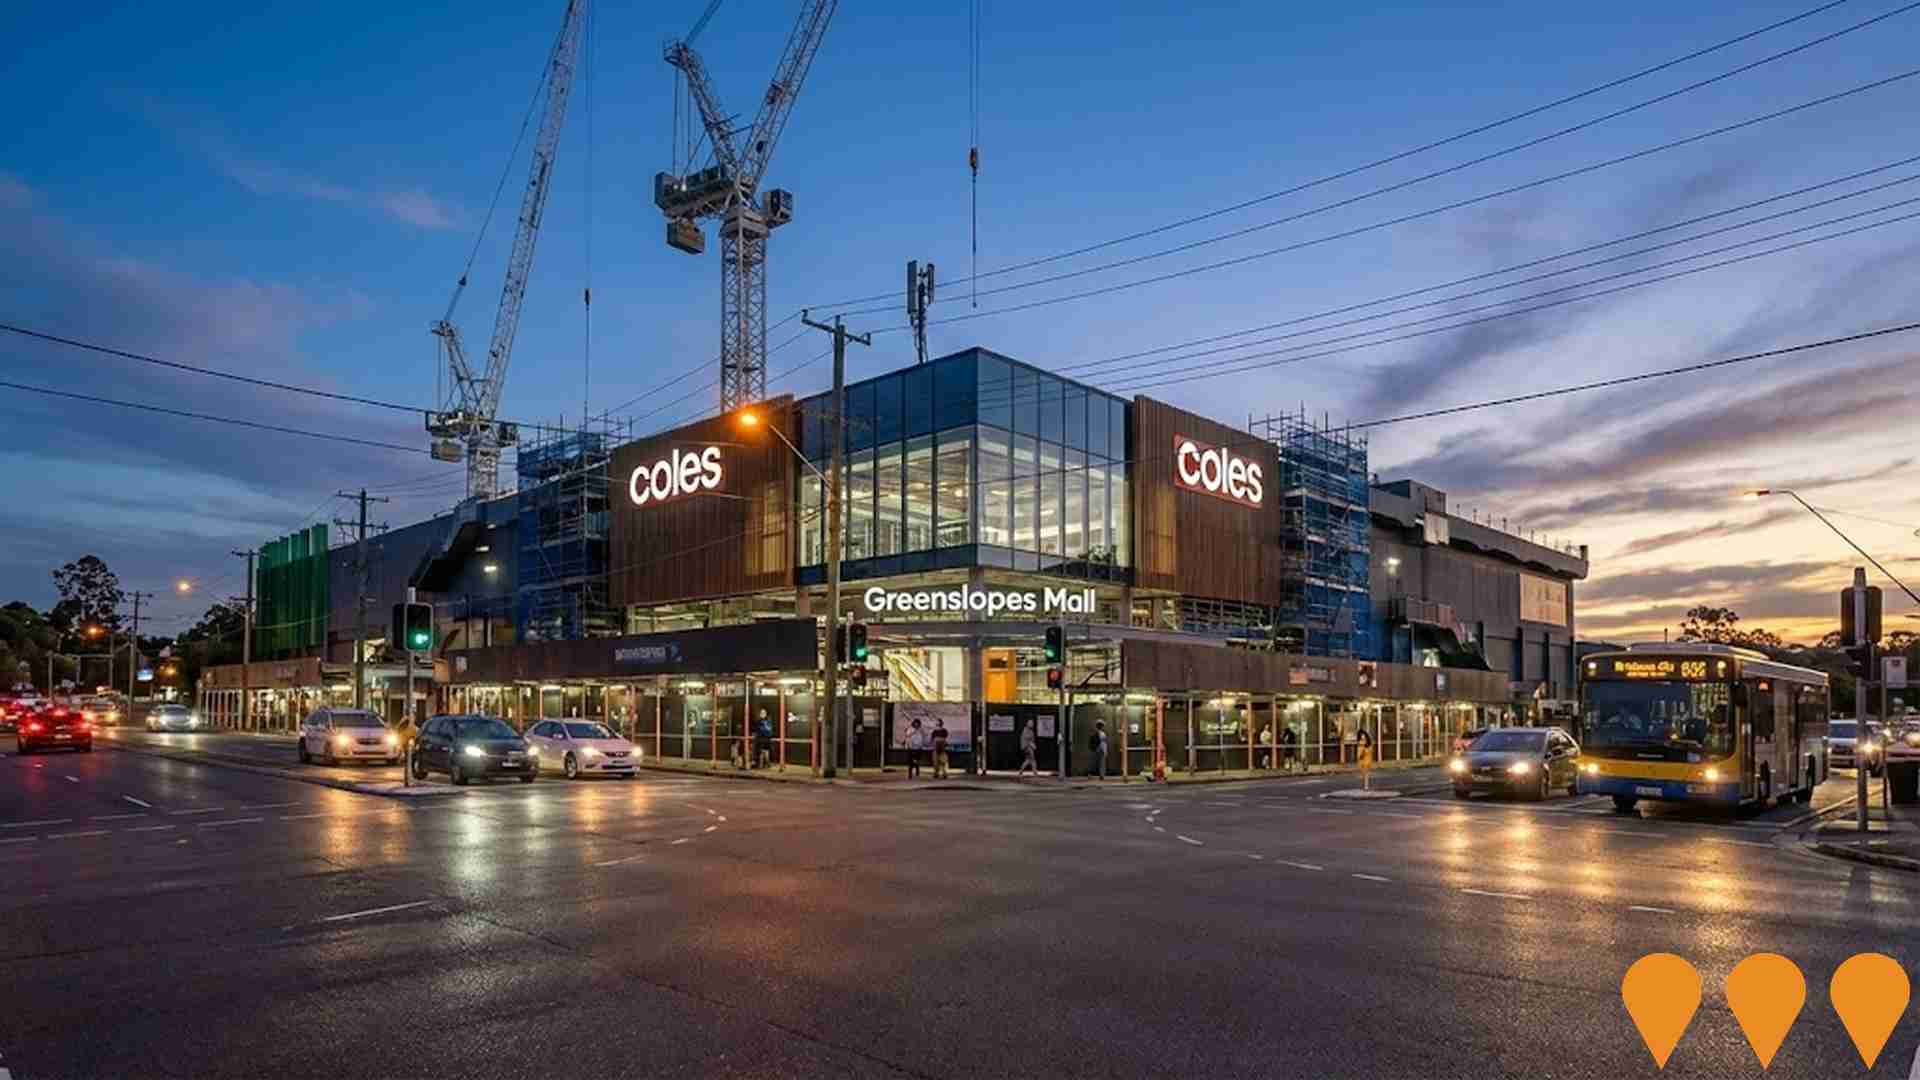
Greenslopes Mall Expansion and Refurbishment
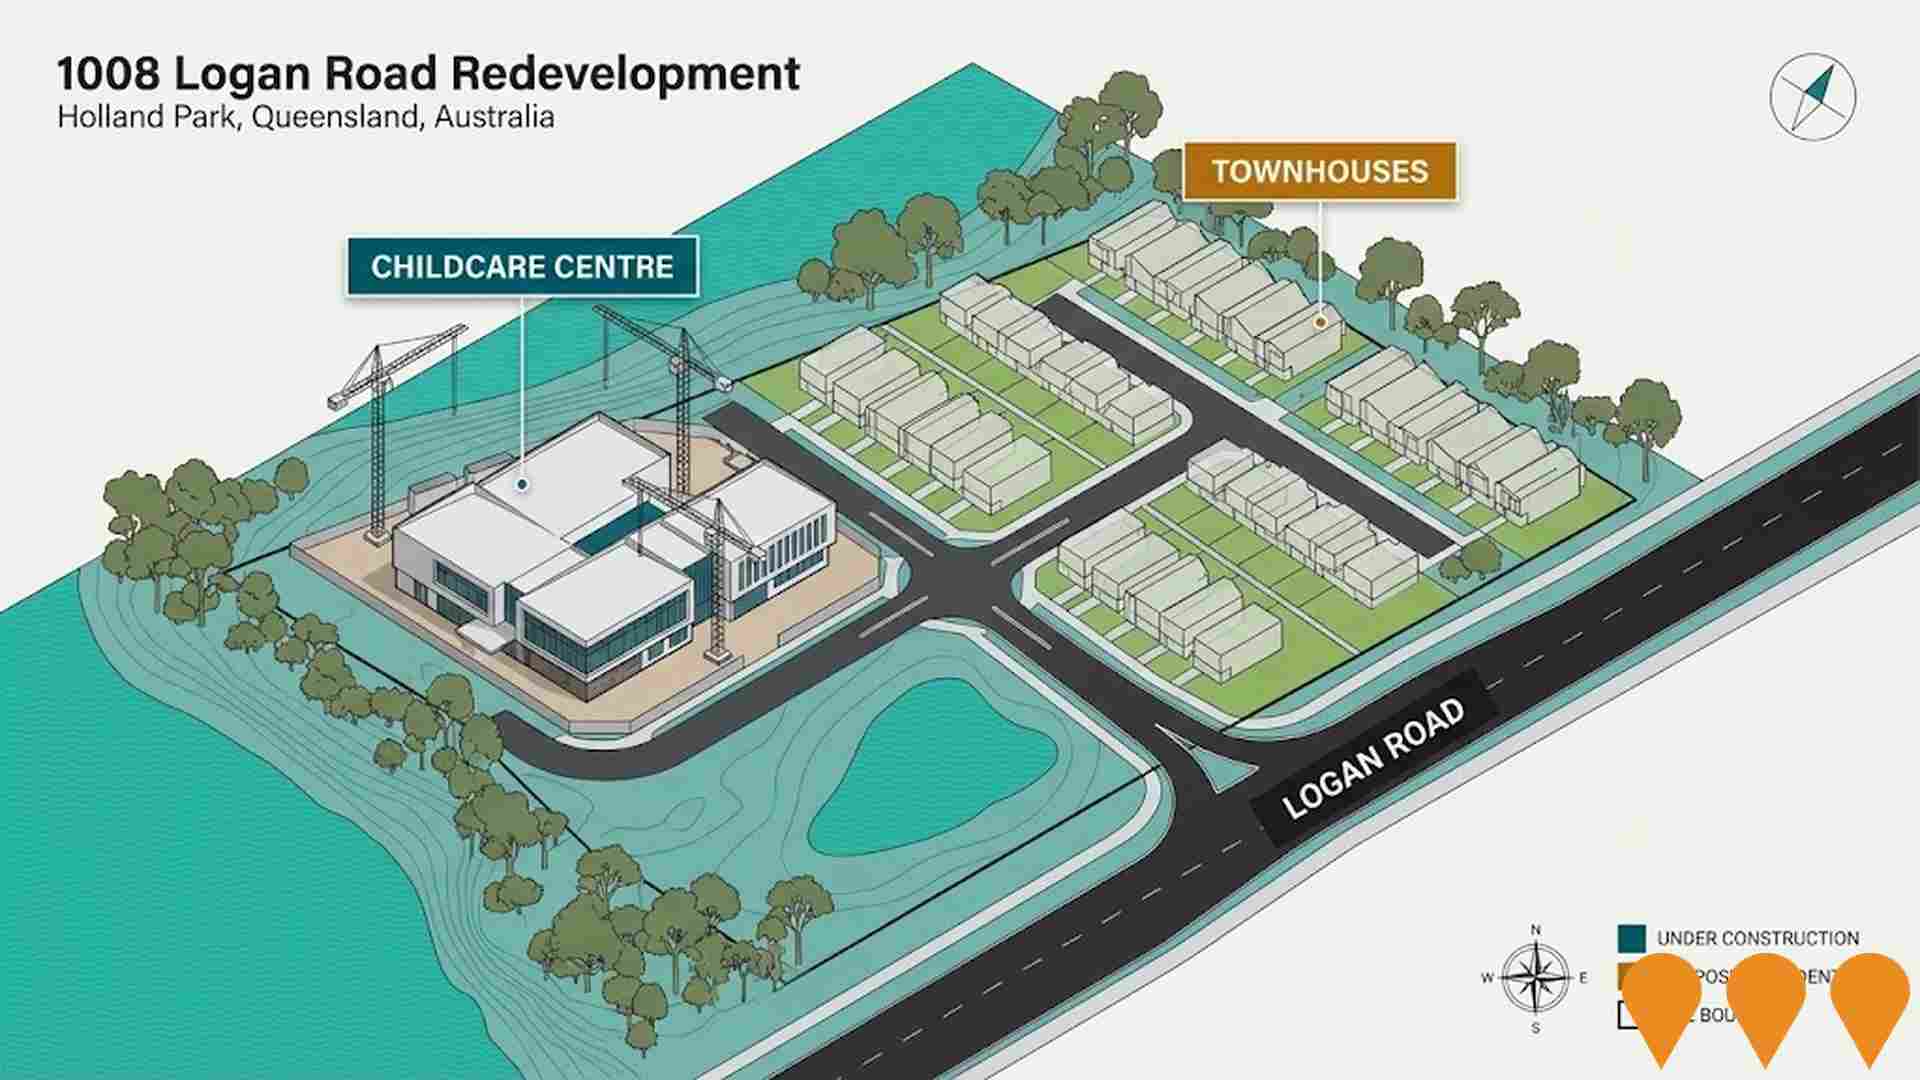
Major program to refurbish and modernise Greenslopes Mall and to better connect it with new development around Logan Road and Plimsoll Street. The inner city centre currently provides around 9,600sqm of retail floorspace anchored by Coles and a mix of convenience and service tenants, including medical, pharmacy and food outlets, on a full block site bounded by Lottie Street, Sackville Street, Plimsoll Street and Logan Road. The centre forms the heart of the Greenslopes Mall district centre and is expected to be upgraded in stages alongside adjoining mixed use projects such as the proposed six storey health, office and gym building at 730 742 Logan Road and a childcare centre above the mall, with works aimed at improving the retail mix, internal layouts, public realm, parking access and pedestrian links to surrounding residential streets. [sources: original project record :contentReference[oaicite:0]{index=0}; category and subcategory mapping :contentReference[oaicite:1]{index=1}]
Beaudesert Road Shopping Centre Extensions
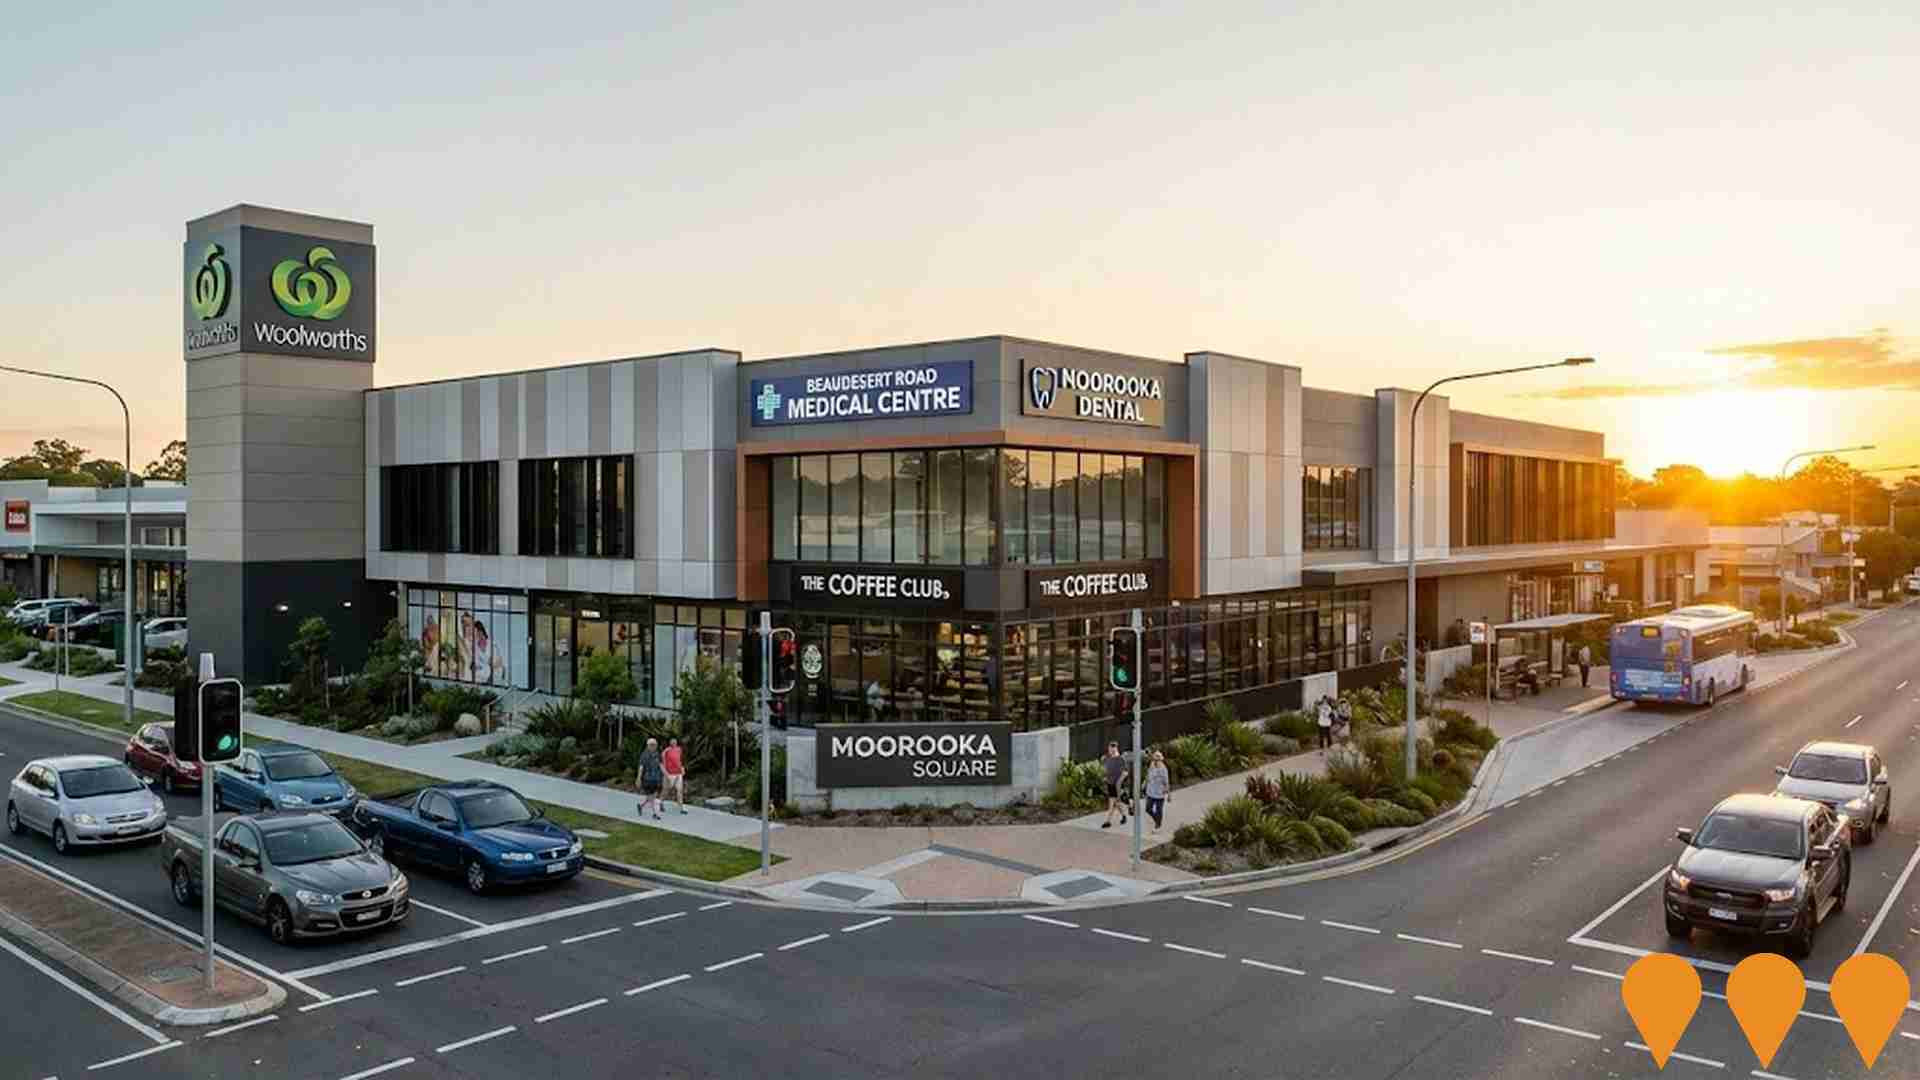
Two-stage shopping centre extension above existing car parking area, providing a medical centre, dentist, and retail tenancies adjacent to Woolworths Supermarket. Stage 1 adds 864 sqm of additional gross floor area with 230 car parking spaces across ground and first floors. The development includes direct-to-boot car parking facilities, new lift access from car park, landscaping, and improved street activation along Beaudesert Road and Durack Street. Stage 2 will add further parking and access improvements via Lyon Street.
Employment
AreaSearch analysis reveals Tarragindi significantly outperforming the majority of regions assessed nationwide
Tarragindi has a highly educated workforce with strong professional services representation and an unemployment rate of 2.4%. Over the past year, it maintained relative employment stability.
As of September 2025, 6762 residents are employed while the unemployment rate is 1.6% lower than Greater Brisbane's rate of 4.0%. Workforce participation in Tarragindi stands at 73.3%, surpassing Greater Brisbane's 64.5%. Key industries include health care & social assistance, professional & technical services, and education & training. Notably, professional & technical services employ 1.6 times the regional average.
Conversely, transport, postal & warehousing employs only 2.8% of local workers, below Greater Brisbane's 5.6%. Over the year to September 2025, employment increased by 0.2%, while labour force grew by 0.6%, leading to a rise in unemployment rate by 0.3 percentage points. In contrast, Greater Brisbane saw employment rise by 3.8% and unemployment fall by 0.5%. Statewide, Queensland's employment contracted by 0.01% (losing 1210 jobs) with an unemployment rate of 4.2%, closely mirroring the national rate of 4.3%. National employment forecasts from May-25 project a 6.6% increase over five years and 13.7% over ten years. Applying these projections to Tarragindi's employment mix suggests local employment should grow by 7.3% over five years and 14.8% over ten years, based on simple weighting extrapolation for illustrative purposes.
Frequently Asked Questions - Employment
Income
The economic profile demonstrates exceptional strength, placing the area among the top 10% nationally based on comprehensive AreaSearch income analysis
Tarragindi SA2 had a median taxpayer income of $67,439 and an average of $89,798 in financial year 2022. This was significantly higher than Greater Brisbane's median income of $55,645 and average income of $70,520 during the same period. By September 2025, estimated incomes were approximately $76,874 (median) and $102,361 (average), based on a 13.99% growth in wages since financial year 2022. Census data shows that Tarragindi's household, family, and personal incomes all ranked highly nationally, between the 89th and 96th percentiles. The income bracket of $4000+ captured 31.9% of Tarragindi's population (3,705 individuals), while in the broader area, the dominant band was $1,500 - 2,999 with 33.3%. Economic strength was evident with 48.9% of households earning high weekly incomes exceeding $3,000, supporting increased consumer spending. After housing costs, residents retained 87.9% of their income, indicating strong purchasing power. The area's SEIFA income ranking placed it in the 9th decile.
Frequently Asked Questions - Income
Housing
Tarragindi is characterized by a predominantly suburban housing profile, with above-average rates of outright home ownership
Tarragindi's dwelling structure, as per the latest Census, was 95.1% houses and 5.0% other dwellings (semi-detached, apartments, 'other' dwellings), compared to Brisbane metro's 77.8% houses and 22.2% other dwellings. Home ownership in Tarragindi stood at 33.2%, with mortgaged dwellings at 46.4% and rented ones at 20.4%. The median monthly mortgage repayment was $2,453, higher than Brisbane metro's average of $2,100. Median weekly rent in Tarragindi was $450, compared to Brisbane metro's $388. Nationally, Tarragindi's mortgage repayments were significantly higher than the Australian average of $1,863, and rents were substantially above the national figure of $375.
Frequently Asked Questions - Housing
Household Composition
Tarragindi features high concentrations of family households and group households, with a higher-than-average median household size
Family households account for 79.1% of all households, including 44.6% couples with children, 23.3% couples without children, and 9.5% single parent families. Non-family households make up the remaining 20.9%, consisting of 16.7% lone person households and 4.2% group households. The median household size is 2.9 people, which is larger than the Greater Brisbane average of 2.6.
Frequently Asked Questions - Households
Local Schools & Education
Tarragindi demonstrates exceptional educational outcomes, ranking among the top 5% of areas nationally based on AreaSearch's comprehensive analysis of qualification and performance metrics
Tarragindi's educational attainment is notably higher than broader benchmarks. Among residents aged 15+, 48.8% hold university qualifications, compared to 25.7% in Queensland (QLD) and 30.4% nationally. Bachelor degrees are the most common at 31.3%, followed by postgraduate qualifications at 12.0% and graduate diplomas at 5.5%. Vocational pathways account for 24.5% of qualifications, with advanced diplomas at 9.7% and certificates at 14.8%.
Educational participation is high, with 33.4% of residents currently enrolled in formal education. This includes 11.9% in primary education, 9.2% in secondary education, and 7.3% pursuing tertiary education.
Frequently Asked Questions - Education
Schools Detail
Nearby Services & Amenities
Transport
Transport servicing is moderate compared to other areas nationally based on assessment of service frequency, route connectivity and accessibility
Transport analysis shows 84 active transport stops operating within Tarragindi, composed of a mix of buses. These stops are serviced by 7 individual routes, collectively providing 828 weekly passenger trips. Transport accessibility is rated excellent, with residents typically located 147 meters from the nearest stop.
Service frequency averages 118 trips per day across all routes, equating to approximately 9 weekly trips per individual stop.
Frequently Asked Questions - Transport
Transport Stops Detail
Health
Tarragindi's residents are extremely healthy with younger cohorts in particular seeing very low prevalence of common health conditions
Analysis shows Tarragindi's health metrics indicate strong performance overall, with younger cohorts experiencing low prevalence rates for common conditions. Private health cover is exceptionally high at approximately 67% of the total population (7,747 people), compared to Greater Brisbane's 57.3% and Australia's national average of 55.3%. The most prevalent medical conditions are asthma and mental health issues, affecting 7.8% and 7.8% of residents respectively.
73.5% of residents report no medical ailments, compared to Greater Brisbane's 72.3%. As of the latest data (2016), 13.2% of Tarragindi's population is aged 65 and over (1,536 people). While health outcomes among seniors are above average, they require more attention than the broader population.
Frequently Asked Questions - Health
Cultural Diversity
In terms of cultural diversity, Tarragindi records figures broadly comparable to the national average, as found in AreaSearch's assessment of a number of language and cultural background related metrics
Tarragindi's population, as of the 2016 Census, was predominantly Australian-born, with 81.5%. The majority were citizens, at 92.6%, and spoke English only at home, at 86.6%. Christianity was the primary religion, followed by 51.4% of people.
This figure is higher than the Greater Brisbane average of 44.4%. In terms of ancestry, the top groups were English (26.1%), Australian (25.0%), and Irish (11.2%). Notably, Welsh ancestry was overrepresented in Tarragindi at 0.7%, compared to 0.5% regionally. Similarly, Greek ancestry stood at 1.8%, higher than the regional average of 1.1%. Russian ancestry also saw a slight divergence, with 0.4% in Tarragindi against the same figure regionally.
Frequently Asked Questions - Diversity
Age
Tarragindi's population is slightly younger than the national pattern
Tarragindi's median age is nearly 37 years, close to Greater Brisbane's average of 36 and Australia's median of 38. Compared to Greater Brisbane, Tarragindi has a higher proportion of residents aged 45-54 (16.0%) but fewer residents aged 25-34 (10.2%). Between the 2021 Census and now, the population aged 15-24 has increased from 12.2% to 14.2%, while the 35-44 age group has decreased from 16.6% to 15.4%. The 5-14 age group has also declined, from 16.2% to 15.1%. By 2041, demographic modeling projects significant changes in Tarragindi's age profile. The 85+ cohort is expected to grow by 89%, adding 206 residents to reach 439. Residents aged 65 and above will drive 57% of population growth, reflecting aging trends. Meanwhile, the 0-4 and 25-34 age groups are projected to experience population declines.
