Chart Color Schemes
This analysis uses ABS Statistical Areas Level 2 (SA2) boundaries, which can materially differ from Suburbs and Localities (SAL) even when sharing similar names.
SA2 boundaries are defined by the Australian Bureau of Statistics and are designed to represent communities for statistical reporting (e.g., census and ERP).
Suburbs and Localities (SAL) represent commonly-used suburb/locality names (postal-style areas) and may use different geographic boundaries. For comprehensive analysis, consider reviewing both boundary types if available.
est. as @ -- *
ABS ERP | -- people | --
2021 Census | -- people
Sales Activity
Curious about local property values? Filter the chart to assess the volume and appreciation (including resales) trends and regional comparisons, or scroll to the map below view this information at an individual property level.
Find a Recent Sale
Sales Detail
Population
Woolloongabba lies within the top 10% of areas nationally in terms of population growth performance according to AreaSearch analysis of short and medium-term trends
Woolloongabba's population is around 10,296 as of Nov 2025. This reflects an increase of 1,699 people since the 2021 Census, which reported a population of 8,597 people. The change is inferred from the estimated resident population of 10,068 from the ABS in June 2024 and an additional 504 validated new addresses since the Census date. This level of population equates to a density ratio of 4,272 persons per square kilometer, placing Woolloongabba in the top 10% of national locations assessed by AreaSearch. The area's 19.8% growth since the 2021 census exceeded the SA3 area (8.8%) and the national average, marking it as a growth leader in the region. Population growth for Woolloongabba was primarily driven by overseas migration contributing approximately 67.0% of overall population gains during recent periods.
AreaSearch adopts ABS/Geoscience Australia projections for each SA2 area, released in 2024 with 2022 as the base year. For areas not covered and years post-2032, Queensland State Government's SA2 area projections are adopted, released in 2023 based on 2021 data. Considering projected demographic shifts, exceptional growth is predicted over the period with Woolloongabba expected to increase by 7,751 persons to 2041 based on the latest annual ERP population numbers, reflecting a gain of 73.1% in total over the 17 years.
Frequently Asked Questions - Population
Development
Residential development activity is slightly higher than average within Woolloongabba when compared nationally
Woolloongabba recorded approximately 160 residential properties granted approval annually. Between FY21-FY25804 homes were approved, with a further 84 approved in FY26 so far. Over these five years, an average of 2.9 people moved to the area per new home constructed.
New homes had an average construction cost value of $140,000, which is under regional levels, suggesting more accessible housing choices for buyers. In FY26, commercial approvals totalled $90.8 million, indicating strong commercial development momentum. Compared to Greater Brisbane, Woolloongabba exhibits 182.0% higher construction activity per person. Recent construction comprises 6.0% standalone homes and 94.0% townhouses or apartments, reflecting a shift from the area's existing housing composition of 30.0% houses. This trend indicates decreasing availability of developable sites and changing lifestyles. With around 2888 people per dwelling approval, Woolloongabba reflects a highly mature market. By 2041, Woolloongabba is expected to grow by 7523 residents.
If current development rates continue, housing supply may not keep pace with population growth, potentially increasing buyer competition and supporting stronger price growth.
Frequently Asked Questions - Development
Infrastructure
Woolloongabba has very high levels of nearby infrastructure activity, ranking in the top 10% nationally
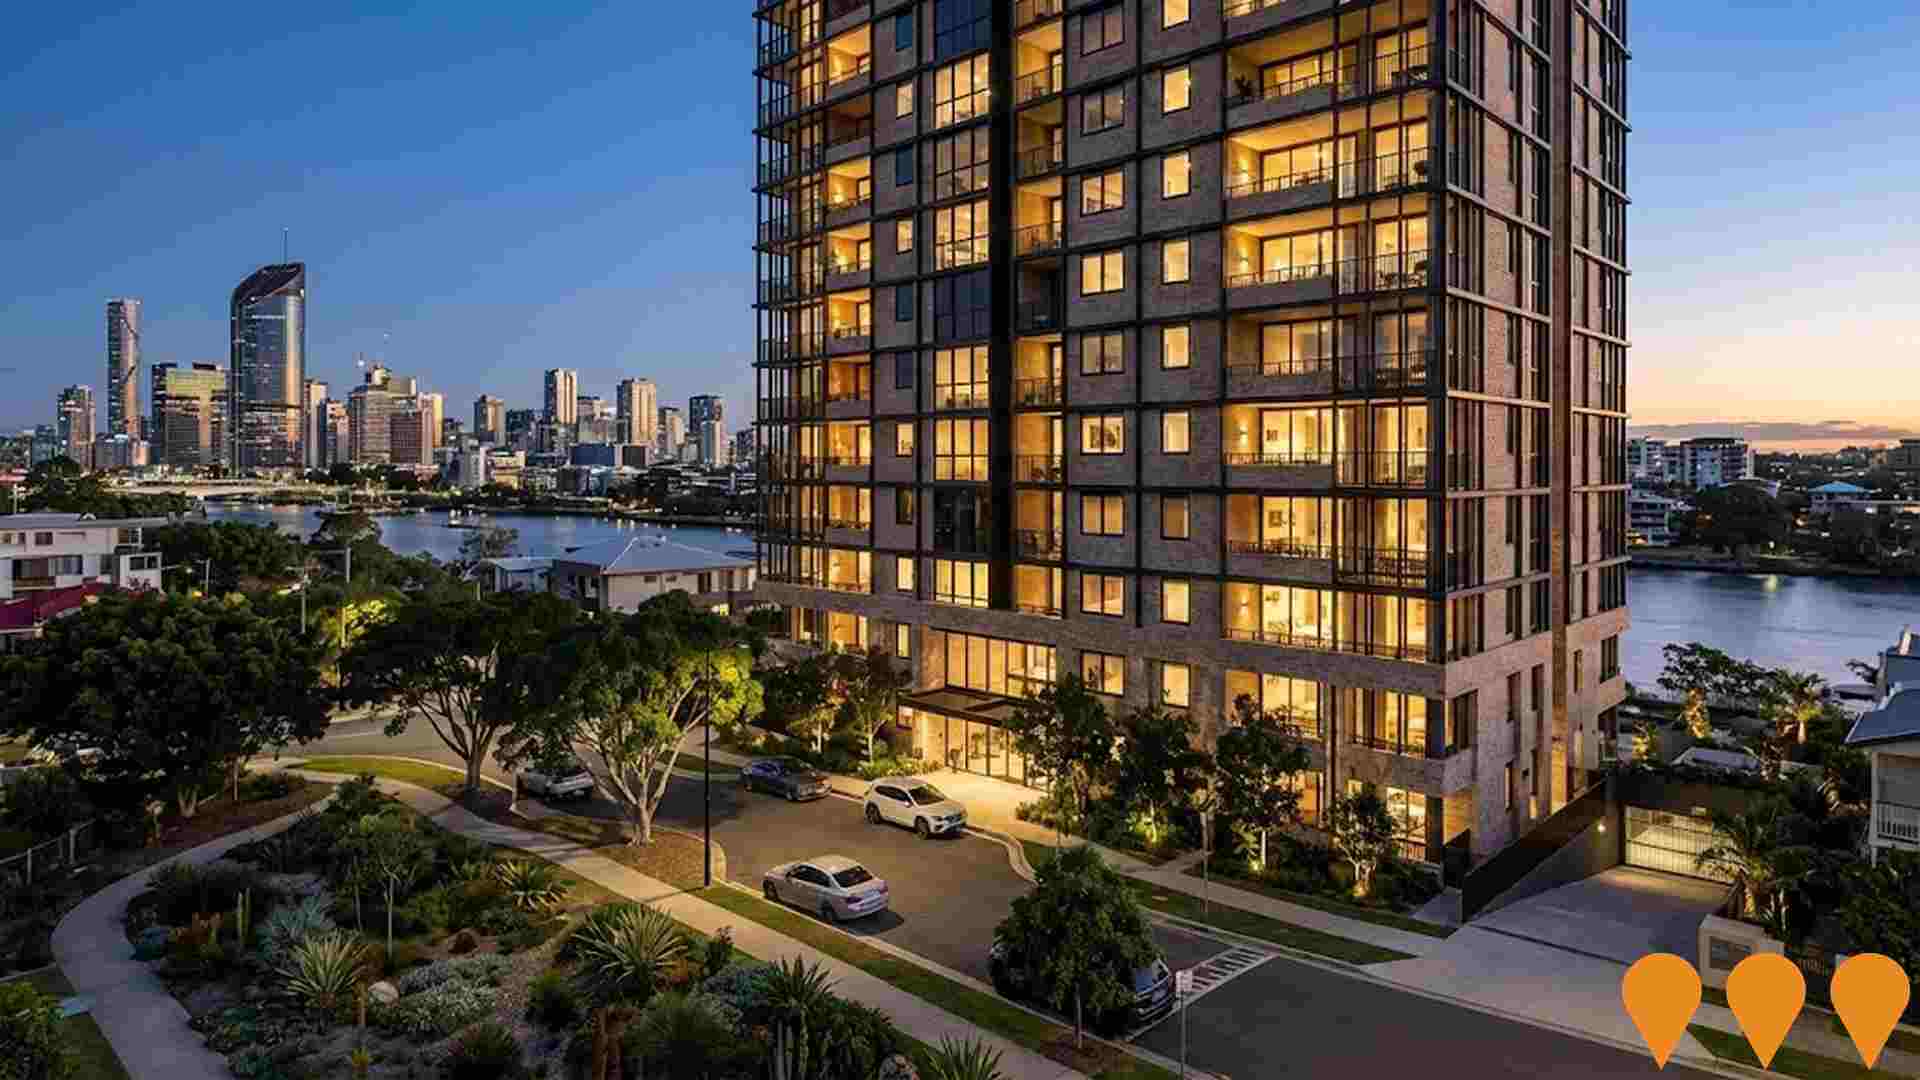
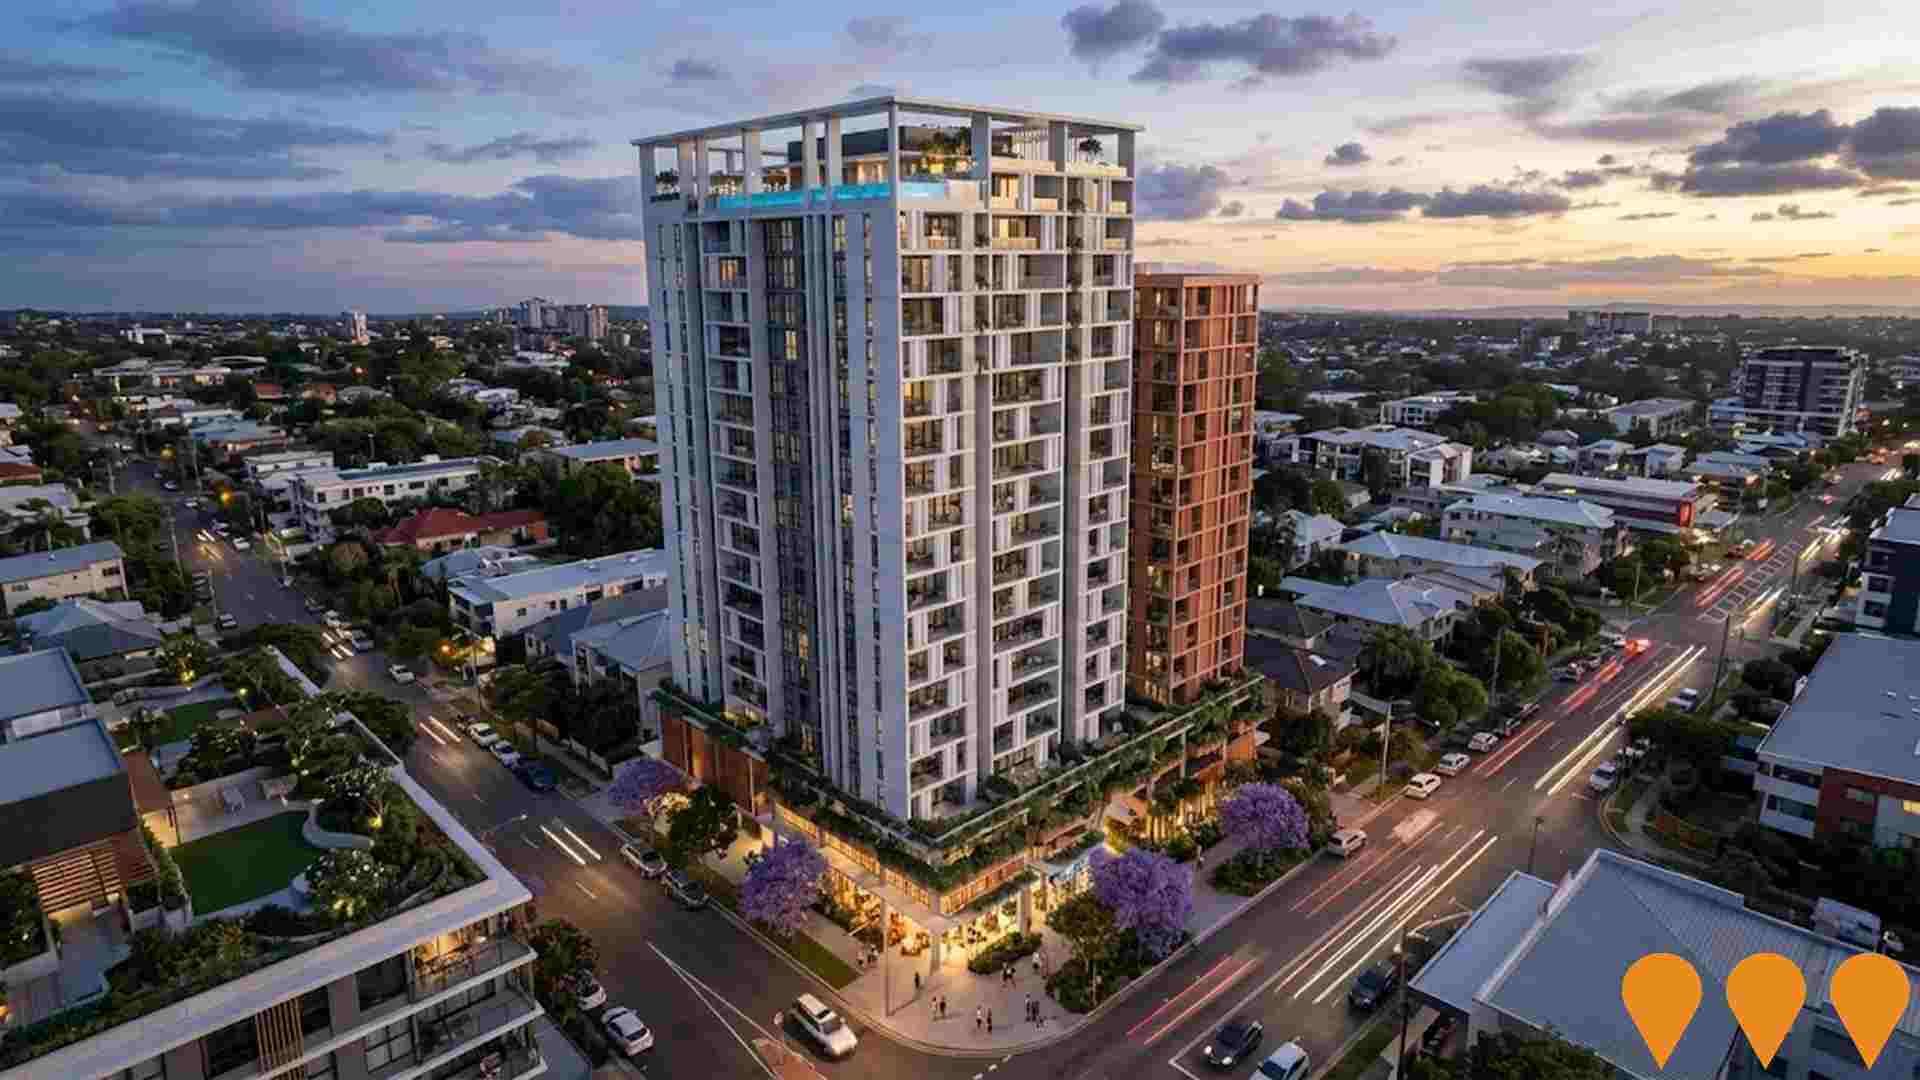
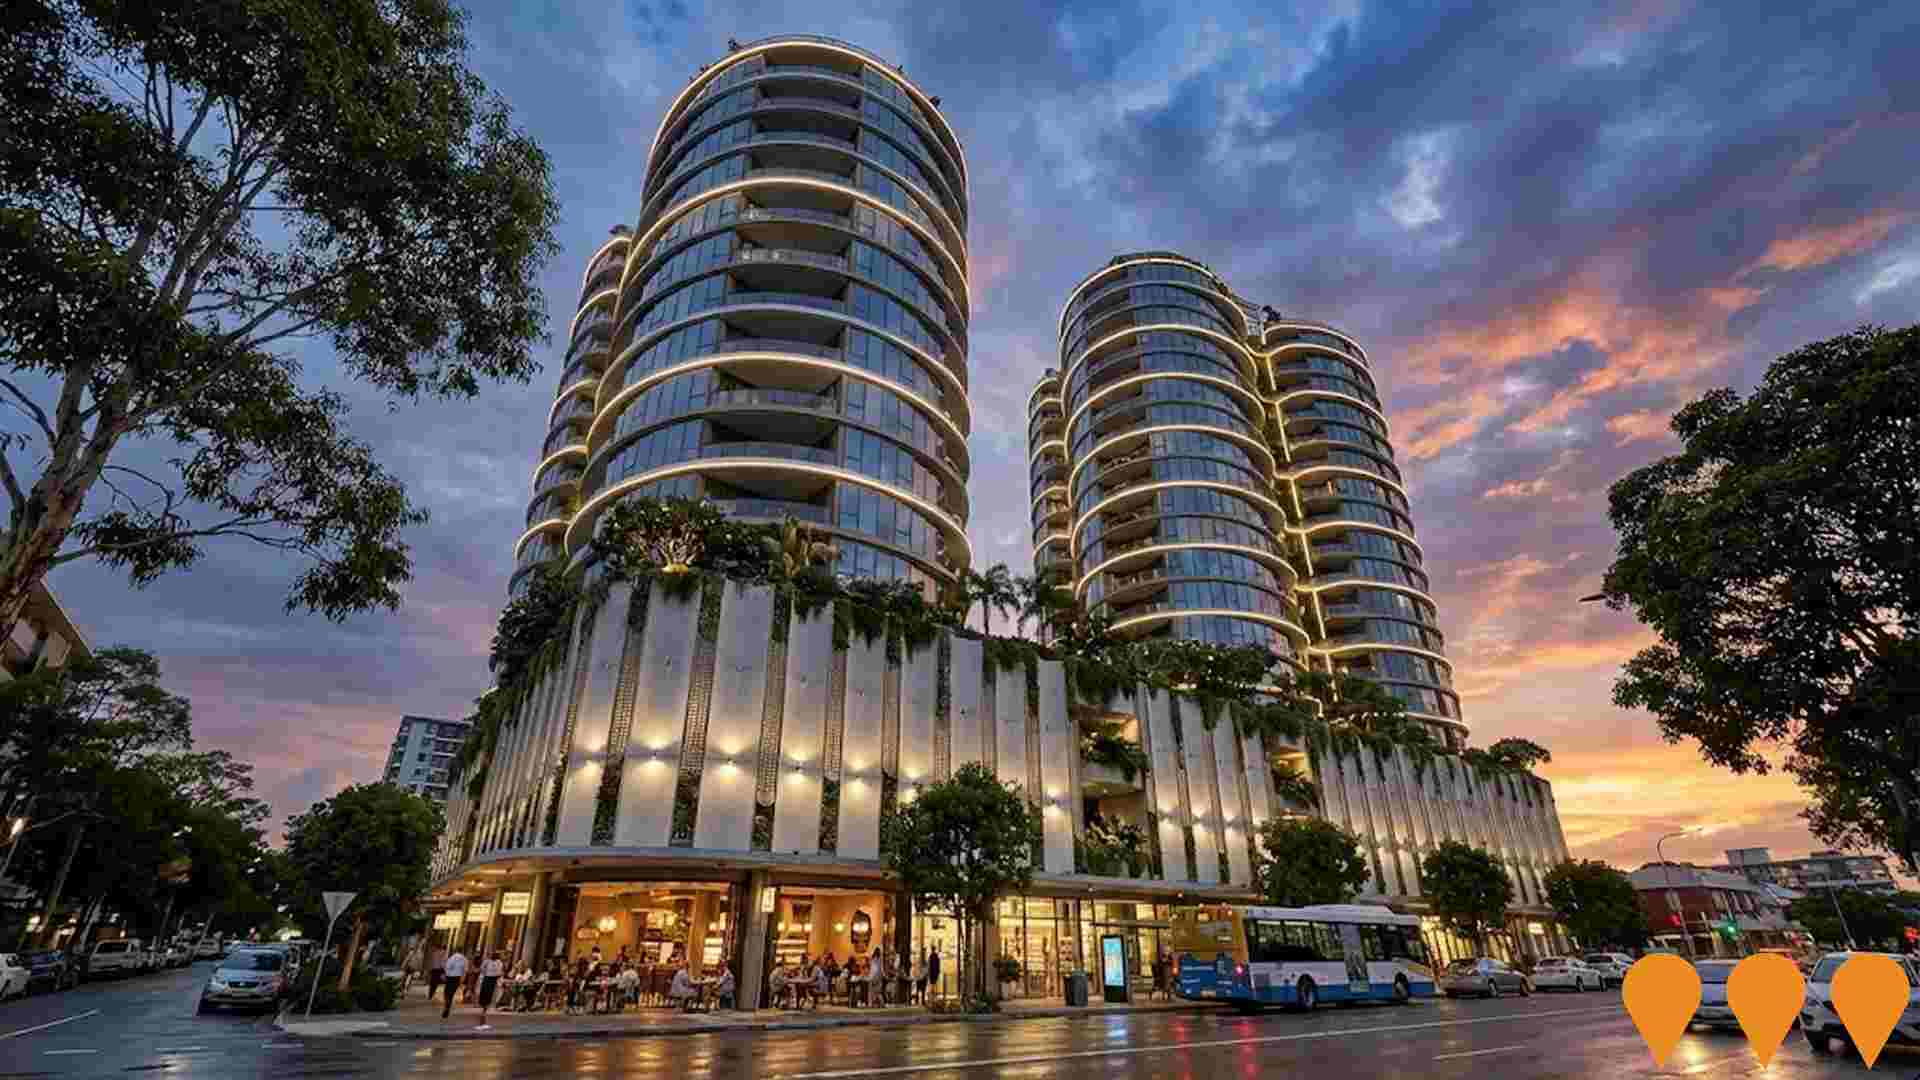
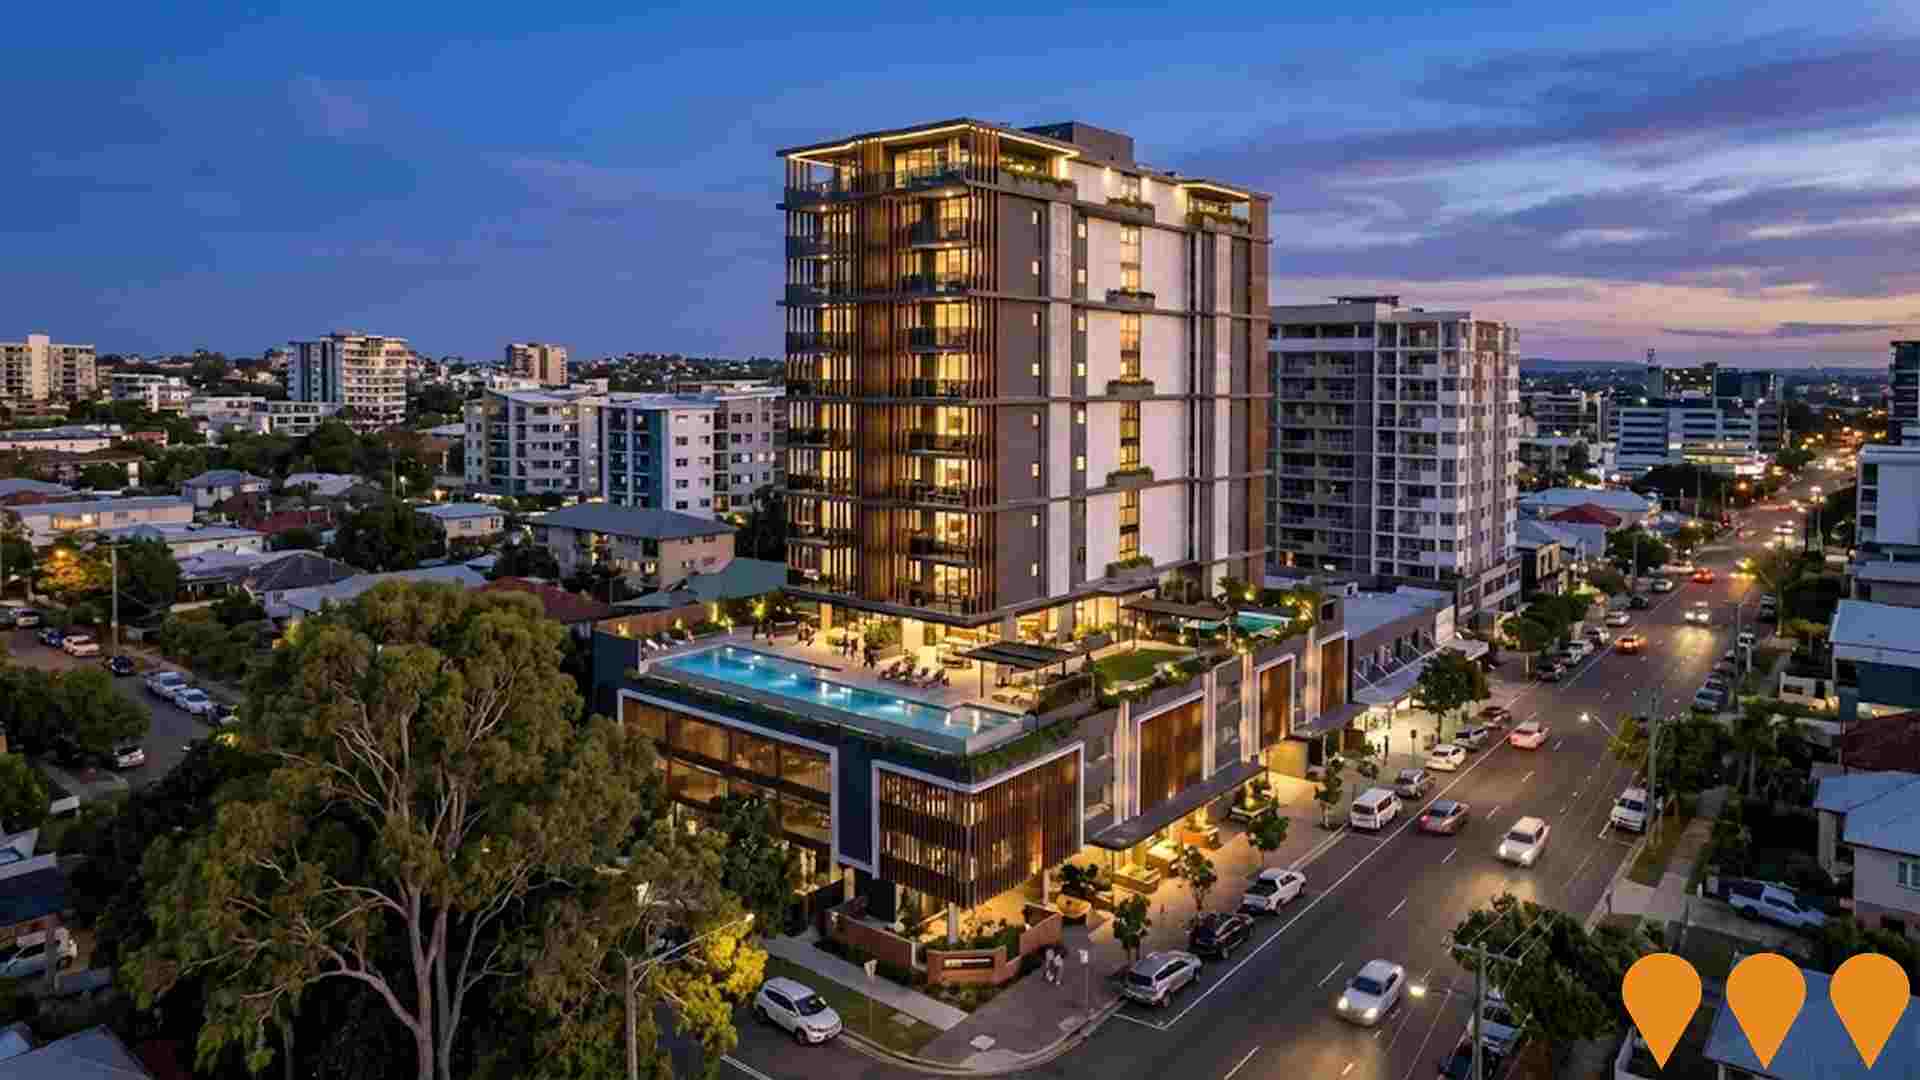
Infrastructure changes significantly influence an area's performance. AreaSearch has identified 55 projects likely impacting the area. Notable ones include Cross River Rail - Woolloongabba Station, Silk Lane Development, The Carter by Mosaic, and Murcia Residences. The following list details those most relevant.
Professional plan users can use the search below to filter and access additional projects.
INFRASTRUCTURE SEARCH
 Denotes AI-based impression for illustrative purposes only, not to be taken as definitive under any circumstances. Please follow links and conduct other investigations from the project's source for actual imagery. Developers and project owners wishing us to use original imagery please Contact Us and we will do so.
Frequently Asked Questions - Infrastructure
Cross River Rail
Queensland's largest public transport infrastructure project: a new 10.2 km rail line with 5.9 km twin tunnels under the Brisbane CBD and Brisbane River, four new underground stations (Boggo Road, Woolloongabba, Albert Street, Roma Street), upgrade of Exhibition station, rebuild of Dutton Park station, and extensive integration works connecting the new tunnels to the existing Queensland Rail network including ETCS Level 2 signalling rollout and southside surface station handovers.

Cross River Rail - Woolloongabba Station
New underground rail station at Woolloongabba forming part of the 10.2 km Cross River Rail project. The station will provide four platforms, high-frequency Turn-Up-and-Go services, and direct connections to The Gabba stadium and surrounding precinct. Construction is well advanced with structural works largely complete, architectural fit-out ongoing, and glazed entrance canopies being installed. Station is on track for opening in 2026 as part of the full Cross River Rail network.

Princess Alexandra Hospital Expansion
A $350 million expansion project at Princess Alexandra Hospital in Brisbane, part of the Queensland Government's Capacity Expansion Program. The project will add 249 beds (219 acute inpatient and 30 ICU), 13 new cancer treatment bays, and reconfigured specialist treatment spaces. The major component is a vertical expansion of five new floors (four clinical, one plant) on top of the existing Emergency Department. Construction is underway, with the project expected to be operational in the second half of 2026.

Gabba Entertainment Precinct (formerly The Gabba Stadium Redevelopment)
The Gabba Entertainment Precinct is a major urban renewal project in Woolloongabba. The Queensland Government is seeking private sector partners to deliver a transformative 9-hectare precinct that includes the site of the existing Gabba Stadium. The project is comprised of a **new 17,000-seat indoor arena** (Gabba West site, pre-2032) and the subsequent redevelopment of the Gabba East site (post-2032) into a **mixed-use precinct** with housing, retail, commercial, hospitality, and public spaces. The existing Gabba Stadium will be decommissioned after the 2032 Olympic and Paralympic Games. The project is now in the Request for Expression of Interest (EOI) stage, which opened on October 9, 2025, and closes on January 12, 2026. This precinct is located within the Woolloongabba Priority Development Area (PDA) and is designed to leverage connectivity to the new Cross River Rail station.

Gabba Heart Precinct
$1.5 billion four-tower mixed-use redevelopment in the Gabba Heart Precinct, adjoining the new Cross River Rail Woolloongabba station. Comprises three build-to-rent apartment towers delivering 1,387 dwellings and one 230-room 5-star hotel (with serviced apartments). Includes retail podiums, a new high street along Logan Road, public realm upgrades, active travel connections, and improvements to Jurgens Park.

Stones Corner Village Redevelopment
Approved mixed-use redevelopment of Stones Corner Village by Stockwell, comprising two residential towers (approx. 14 and 16 storeys) with about 209 apartments above a retail and commercial podium, retaining and upgrading the supermarket-anchored centre and activating the Logan Road frontage.

Stones Corner Suburban Renewal Precinct
Brisbane City Council's first Suburban Renewal Precinct, transforming Stones Corner into a vibrant transit-oriented urban village with medium to high-density housing (up to ~2000 additional dwellings by 2046), enhanced retail/commercial opportunities, improved public spaces, streetscapes, cycling/pedestrian links, and green areas around the Eastern Busway and Logan Road corridor. Draft plan released October 2024, consultation closed November 2024; as of late 2025 the plan is under review with Queensland Government and community feedback incorporated.

Brisbane Metro - Woolloongabba Station
New $450 million Woolloongabba Brisbane Metro Station to enhance transport integration and connectivity in the area, funded by Federal Government, Queensland Government, and Brisbane City Council.

Employment
Woolloongabba has seen below average employment performance when compared to national benchmarks
Woolloongabba has a highly educated workforce with strong professional services representation. Its unemployment rate is 5.6%.
Over the past year, there's been relative employment stability. As of September 2025, 6,639 residents are employed, with an unemployment rate of 6.6% compared to Greater Brisbane's 4.0%. Workforce participation is at 69.5%, slightly higher than Greater Brisbane's 64.5%. Key employment industries include health care & social assistance, accommodation & food, and professional & technical services.
The area specializes in accommodation & food, with an employment share of 1.9 times the regional level. However, construction is under-represented at 4.7% compared to Greater Brisbane's 9.0%. There are 1.9 workers for every resident, indicating Woolloongabba functions as an employment hub attracting workers from surrounding areas. Between September 2024 and September 2025, employment levels increased by 0.2%, labour force grew by 0.9%, leading to a rise in unemployment rate by 0.7 percentage points. In contrast, Greater Brisbane saw employment growth of 3.8% and labour force growth of 3.3%, with a drop in unemployment rate by 0.5 percentage points. As of 25-Nov-25, Queensland's employment contracted by 0.01% (losing 1,210 jobs), with the state unemployment rate at 4.2%. Jobs and Skills Australia forecasts national employment to expand by 6.6% over five years and 14.7% over ten years. Applying these projections to Woolloongabba's employment mix suggests local employment should increase by 7.2% over five years and 14.7% over ten years, based on a simple weighting extrapolation for illustrative purposes.
Frequently Asked Questions - Employment
Income
Income levels align closely with national averages, indicating typical economic conditions for Australian communities according to AreaSearch analysis
AreaSearch's aggregation of latest postcode level ATO data released for financial year 2022 shows Woolloongabba SA2 had a median income among taxpayers of $51,610 and an average level of $65,779. These figures are approximately national averages, with Greater Brisbane levels being $55,645 and $70,520 respectively. Based on Wage Price Index growth of 13.99% since financial year 2022, current estimates for Woolloongabba would be approximately $58,830 (median) and $74,981 (average) as of September 2025. Census data reveals incomes in Woolloongabba cluster around the 59th percentile nationally. Income brackets indicate that 34.7% of locals (3,572 people) fall into the $1,500 - 2,999 category. High housing costs consume 21.4% of income, but strong earnings place disposable income at the 50th percentile. Woolloongabba's SEIFA income ranking places it in the 8th decile.
Frequently Asked Questions - Income
Housing
Woolloongabba features a more urban dwelling mix with significant apartment living, with a higher proportion of rental properties than the broader region
Woolloongabba's dwelling structure, as per the latest Census, comprised 30.1% houses and 70.0% other dwellings (semi-detached, apartments, 'other' dwellings). Brisbane metro had 47.7% houses and 52.3% other dwellings. Home ownership in Woolloongabba was 10.2%, with mortgaged dwellings at 17.2% and rented ones at 72.6%. The median monthly mortgage repayment was $2,000, below Brisbane metro's $2,100. Median weekly rent was $440, compared to Brisbane metro's $390. Nationally, Woolloongabba's mortgage repayments were higher at $1,863 and rents substantially above the national figure of $375.
Frequently Asked Questions - Housing
Household Composition
Woolloongabba features high concentrations of group households and lone person households, with a lower-than-average median household size
Family households account for 47.8% of all households, including 13.3% couples with children, 26.5% couples without children, and 5.5% single parent families. Non-family households constitute the remaining 52.2%, with lone person households at 32.5% and group households making up 19.6%. The median household size is 2.1 people, which is smaller than the Greater Brisbane average of 2.3.
Frequently Asked Questions - Households
Local Schools & Education
Woolloongabba shows strong educational performance, ranking in the upper quartile nationally when assessed across multiple qualification and achievement indicators
Woolloongabba's educational attainment is notably higher than broader averages. Among residents aged 15 and above, 51.1% possess university qualifications, compared to Queensland's 25.7% and Australia's 30.4%. University graduates make up the largest group at 34.8%, followed by postgraduate degree holders (12.8%) and those with graduate diplomas (3.5%). Vocational pathways account for 22.8% of qualifications, with advanced diplomas at 9.4% and certificates at 13.4%.
Educational participation is high, with 39.9% of residents currently enrolled in formal education. This includes 25.1% in tertiary education, 4.0% in primary education, and 3.0% pursuing secondary education.
Frequently Asked Questions - Education
Schools Detail
Nearby Services & Amenities
Transport
Transport servicing is high compared to other areas nationally based on assessment of service frequency, route connectivity and accessibility
Woolloongabba has 40 active public transport stops, with a mix of train and bus services. These stops are served by 140 individual routes, offering a total of 16,589 weekly passenger trips. The accessibility of transport is rated as excellent, with residents typically located 164 meters from the nearest stop.
On average, there are 2,369 trips per day across all routes, which equates to approximately 414 weekly trips per individual stop.
Frequently Asked Questions - Transport
Transport Stops Detail
Health
Woolloongabba's residents are extremely healthy with younger cohorts in particular seeing very low prevalence of common health conditions
Analysis shows strong health metrics throughout Woolloongabba, particularly for younger cohorts with low prevalence of common conditions. Private health cover stands at approximately 52%, or ~5,395 people, compared to Greater Brisbane's 61.3%.
Mental health issues and asthma are most common, affecting 11.0% and 7.7% respectively, while 74.3% report no medical ailments, compared to 71.8% in Greater Brisbane. Residents aged 65 and over comprise 7.4%, or 764 people, lower than Greater Brisbane's 12.4%. Health outcomes among seniors require more attention than the broader population.
Frequently Asked Questions - Health
Cultural Diversity
Woolloongabba is among the most culturally diverse areas in the country based on AreaSearch assessment of a range of language and cultural background related metrics
Woolloongabba has high cultural diversity, with 34.5% speaking a language other than English at home and 42.9% born overseas. Christianity is the main religion, comprising 31.9%. Buddhism is overrepresented at 3.7%, compared to Greater Brisbane's 2.5%.
The top three ancestry groups are English (21.0%), Australian (16.2%), and Other (12.6%). Notably, Russian (0.8%) Korean (1.6%) and Spanish (0.8%) ethnicities are overrepresented in Woolloongabba compared to regional averages of 0.5%, 0.6%, and 0.5% respectively.
Frequently Asked Questions - Diversity
Age
Woolloongabba hosts a very young demographic, ranking in the bottom 10% of areas nationwide
Woolloongabba's median age is 29, lower than Greater Brisbane's figure of 36 and Australia's median of 38. The age profile indicates that the 25-34 year-olds are most prominent (34.6%), while those aged 5-14 are comparatively fewer (4.8%) compared to Greater Brisbane. This concentration of 25-34 year-olds is significantly higher than the national figure of 14.5%. Post-2021 Census data shows that the 25-34 age group grew from 32.3% to 34.6%, while the 35-44 cohort increased from 12.7% to 14.7%. Conversely, the 15-24 age group declined from 25.3% to 21.1%. By 2041, Woolloongabba's age composition is projected to shift notably, with the 25-34 age cohort expected to rise substantially by 1,991 people (56%), from 3,562 to 5,554.


