Chart Color Schemes
This analysis uses ABS Statistical Areas Level 2 (SA2) boundaries, which can materially differ from Suburbs and Localities (SAL) even when sharing similar names.
SA2 boundaries are defined by the Australian Bureau of Statistics and are designed to represent communities for statistical reporting (e.g., census and ERP).
Suburbs and Localities (SAL) represent commonly-used suburb/locality names (postal-style areas) and may use different geographic boundaries. For comprehensive analysis, consider reviewing both boundary types if available.
est. as @ -- *
ABS ERP | -- people | --
2021 Census | -- people
Sales Activity
Curious about local property values? Filter the chart to assess the volume and appreciation (including resales) trends and regional comparisons, or scroll to the map below view this information at an individual property level.
Find a Recent Sale
Sales Detail
Population
Brisbane City lies within the top 10% of areas nationally in terms of population growth performance according to AreaSearch analysis of short and medium-term trends
Brisbane City's population was 18,102 as of November 2025, according to AreaSearch's analysis. This figure represents a growth of 4,792 people, a 36.0% increase since the 2021 Census which reported a population of 13,310. The change was inferred from an estimated resident population of 16,884 in June 2024 and an additional 1,410 validated new addresses since the Census date. This results in a population density ratio of 7,638 persons per square kilometer, placing Brisbane City in the top 10% of national locations assessed by AreaSearch. The city's growth rate exceeded both the national average (8.9%) and the state average, making it a regional growth leader. Overseas migration contributed approximately 92.7% of overall population gains during recent periods, with all drivers including natural growth and interstate migration being positive factors.
AreaSearch adopts ABS/Geoscience Australia projections for each SA2 area released in 2024 using 2022 as the base year. For areas not covered by this data and years post-2032, Queensland State Government's SA2 area projections released in 2023 based on 2021 data are used. These state projections do not provide age category splits, so AreaSearch applies proportional growth weightings aligned with ABS Greater Capital Region projections for each age cohort released in 2023 using 2022 data as the base year. Future population projections indicate exceptional growth, placing Brisbane City in the top 10 percent of Australian statistical areas. The area is expected to increase by 14,600 persons to 2041 based on the latest annual ERP population numbers, reflecting a total gain of 73.9% over the 17 years.
Frequently Asked Questions - Population
Development
The level of residential development activity in Brisbane City was found to be higher than 90% of real estate markets across the country
Brisbane City averaged approximately 481 new dwelling approvals annually. Between FY21 and FY25, it approved a total of 2,406 homes, with one more approved so far in FY26. Over the past five financial years, an average of 1.6 new residents per year arrived for each new home approved.
This indicates balanced supply and demand dynamics, contributing to market stability. The average expected construction cost value of new dwellings over this period was $608,000, suggesting developers targeted the premium market segment with higher-end properties. In FY26, commercial approvals totaled $1,175.5 million, reflecting high local commercial activity. Compared to Greater Brisbane, Brisbane City has 116.0% more building activity per person, offering buyers ample choice and indicating strong developer confidence in the area. Recent building activity comprises exclusively townhouses or apartments, fostering denser development that caters to downsizers, investors, and entry-level buyers. Brisbane City's population growth is evident with around 24 people per dwelling approval.
Future projections estimate an additional 13,382 residents by 2041 (based on the latest AreaSearch quarterly estimate). Current development levels appear aligned with future requirements, maintaining stable market conditions without significant price pressures.
Frequently Asked Questions - Development
Infrastructure
Brisbane City has strong levels of nearby infrastructure activity, ranking in the top 40% nationally
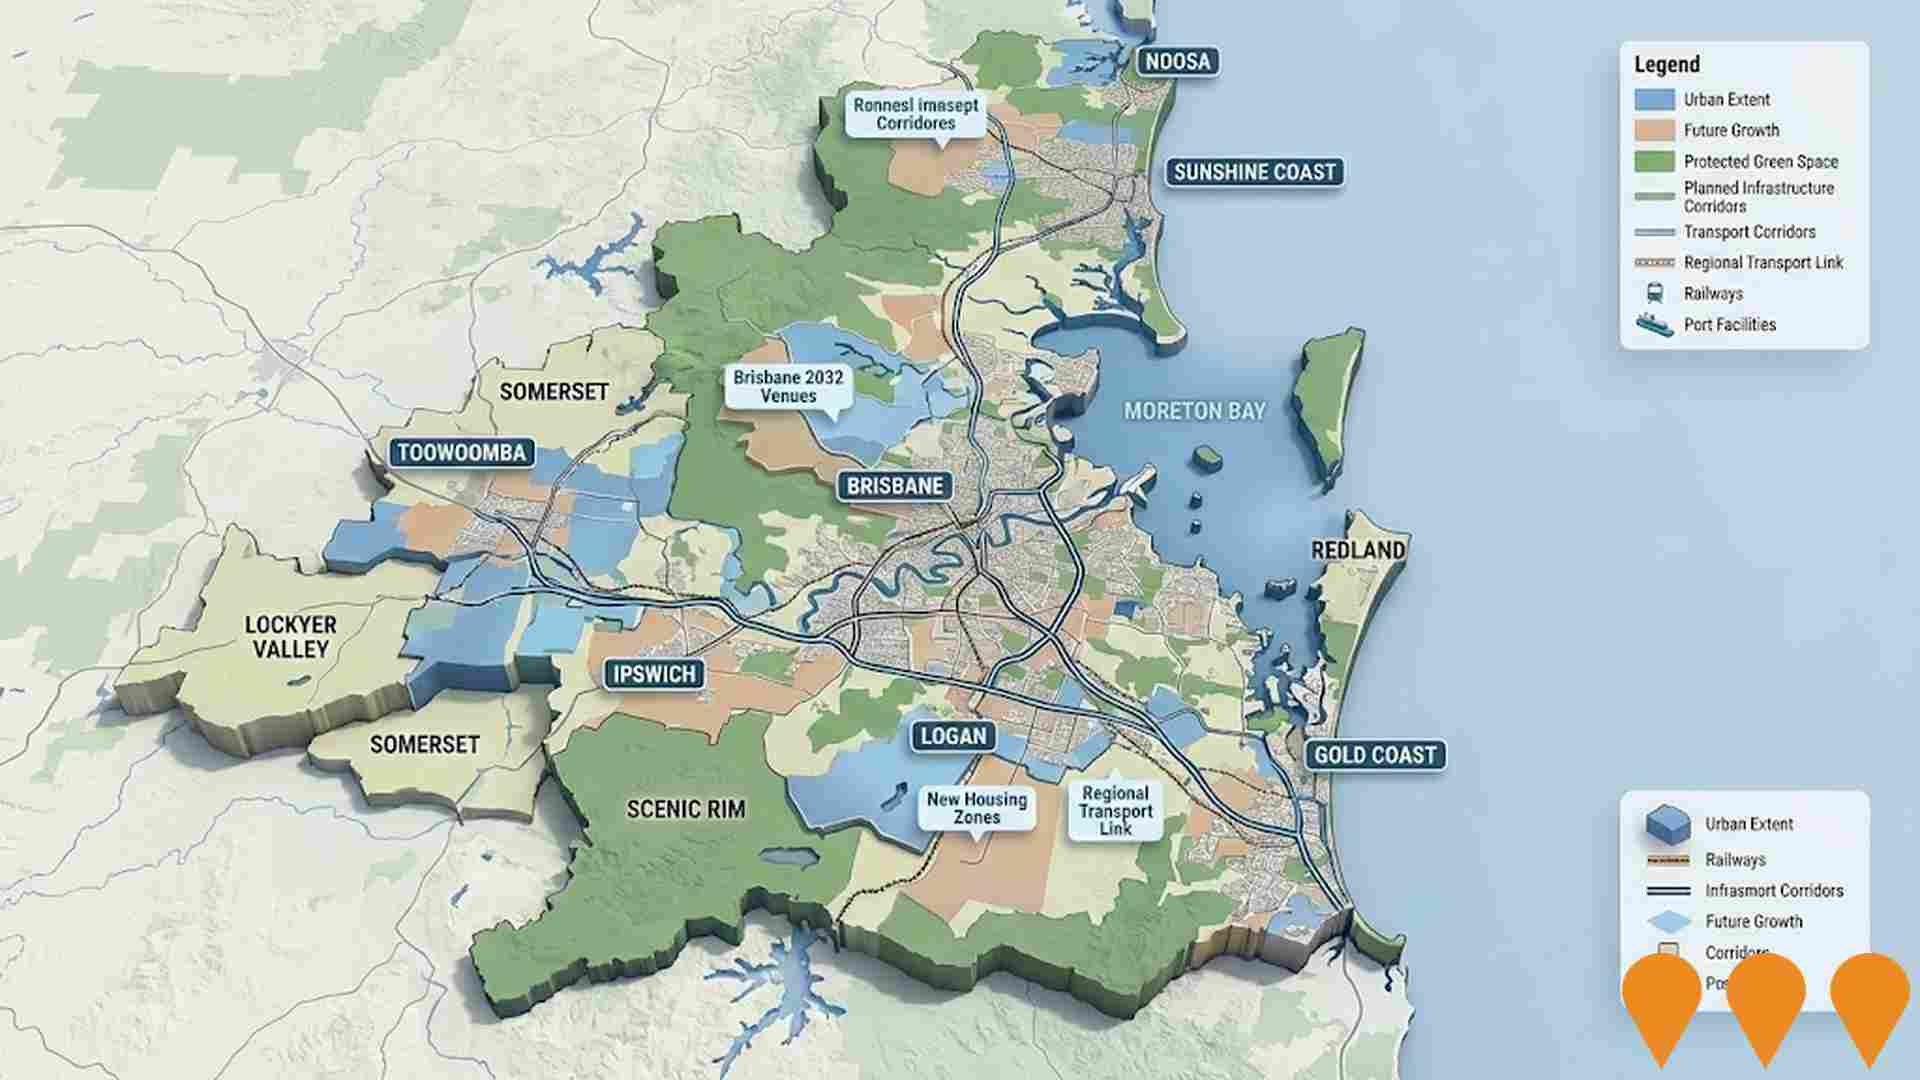
Changes to local infrastructure significantly influence an area's performance. AreaSearch has identified 112 projects likely impacting the area. Notable projects include Queen's Wharf Brisbane, Waterfront Brisbane, Cross River Rail, and Howard Smith Wharves. The following details projects likely most relevant.
Professional plan users can use the search below to filter and access additional projects.
INFRASTRUCTURE SEARCH
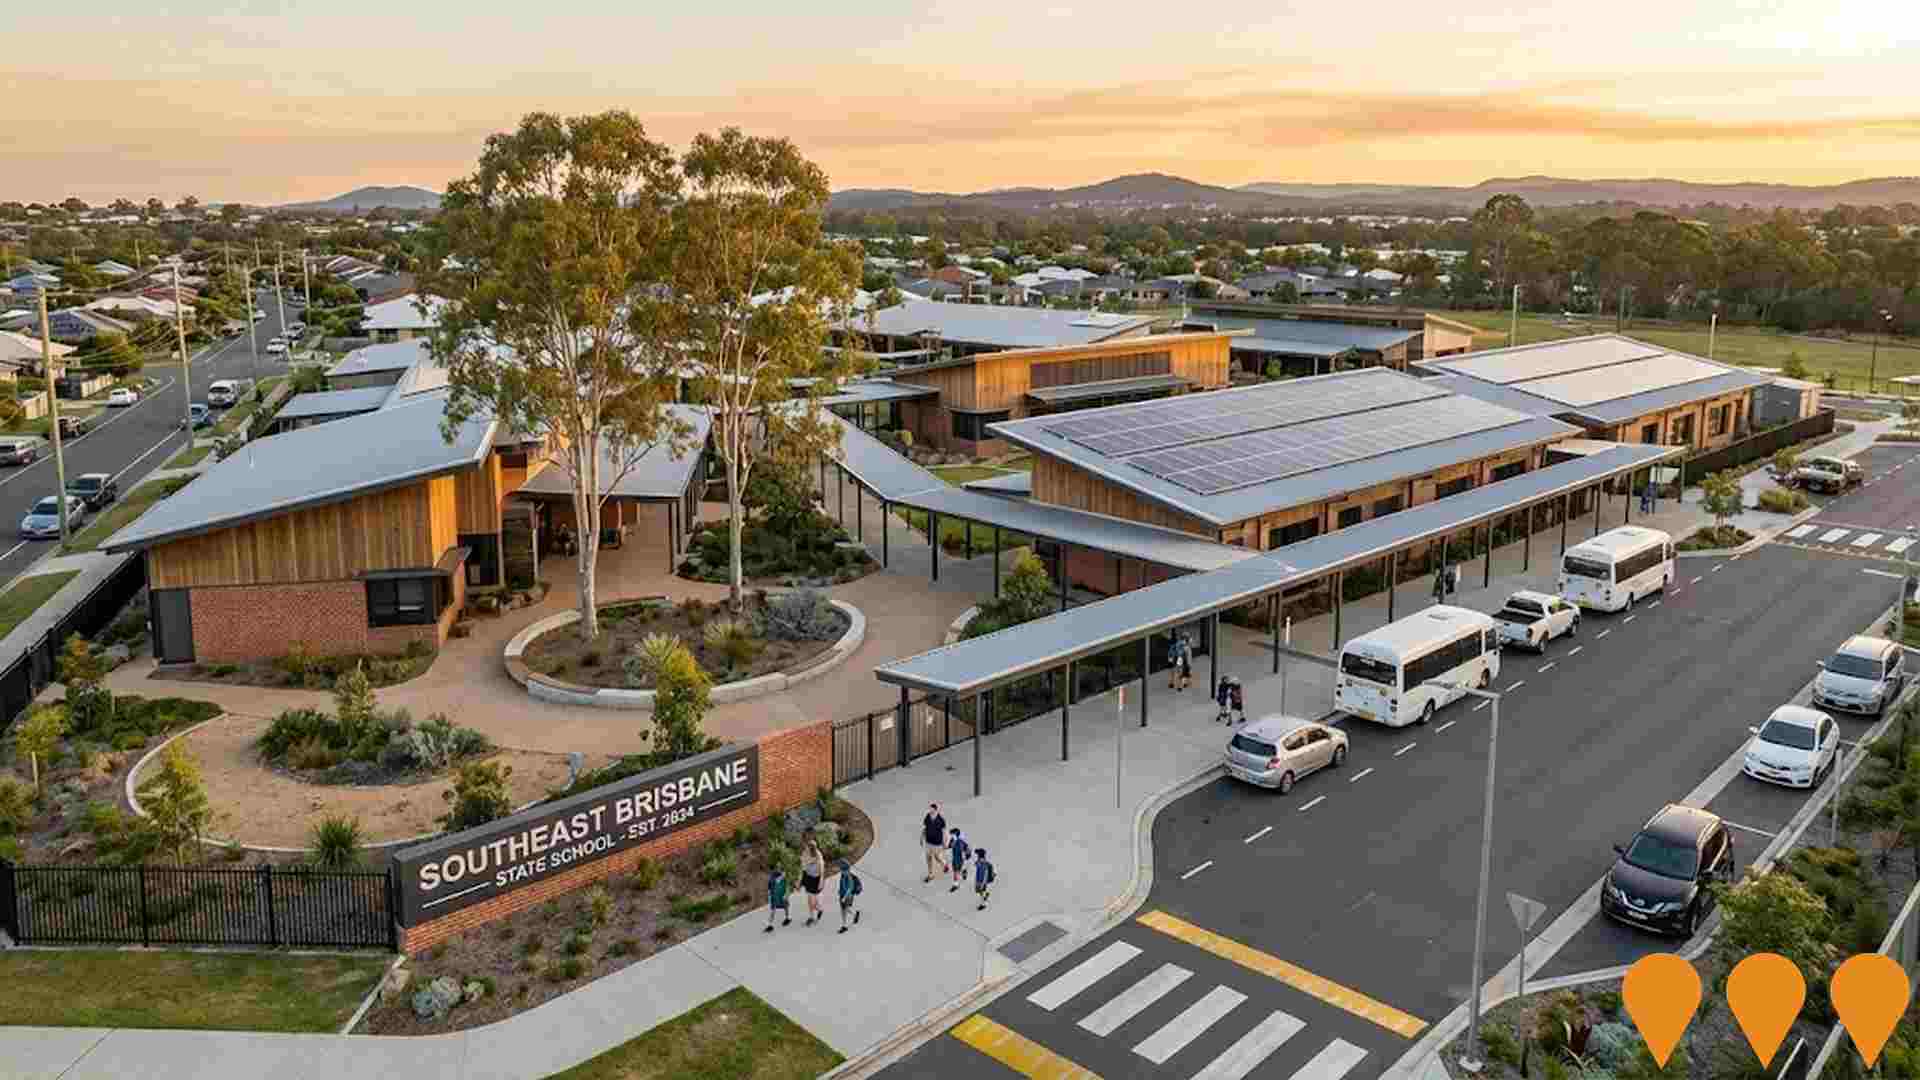
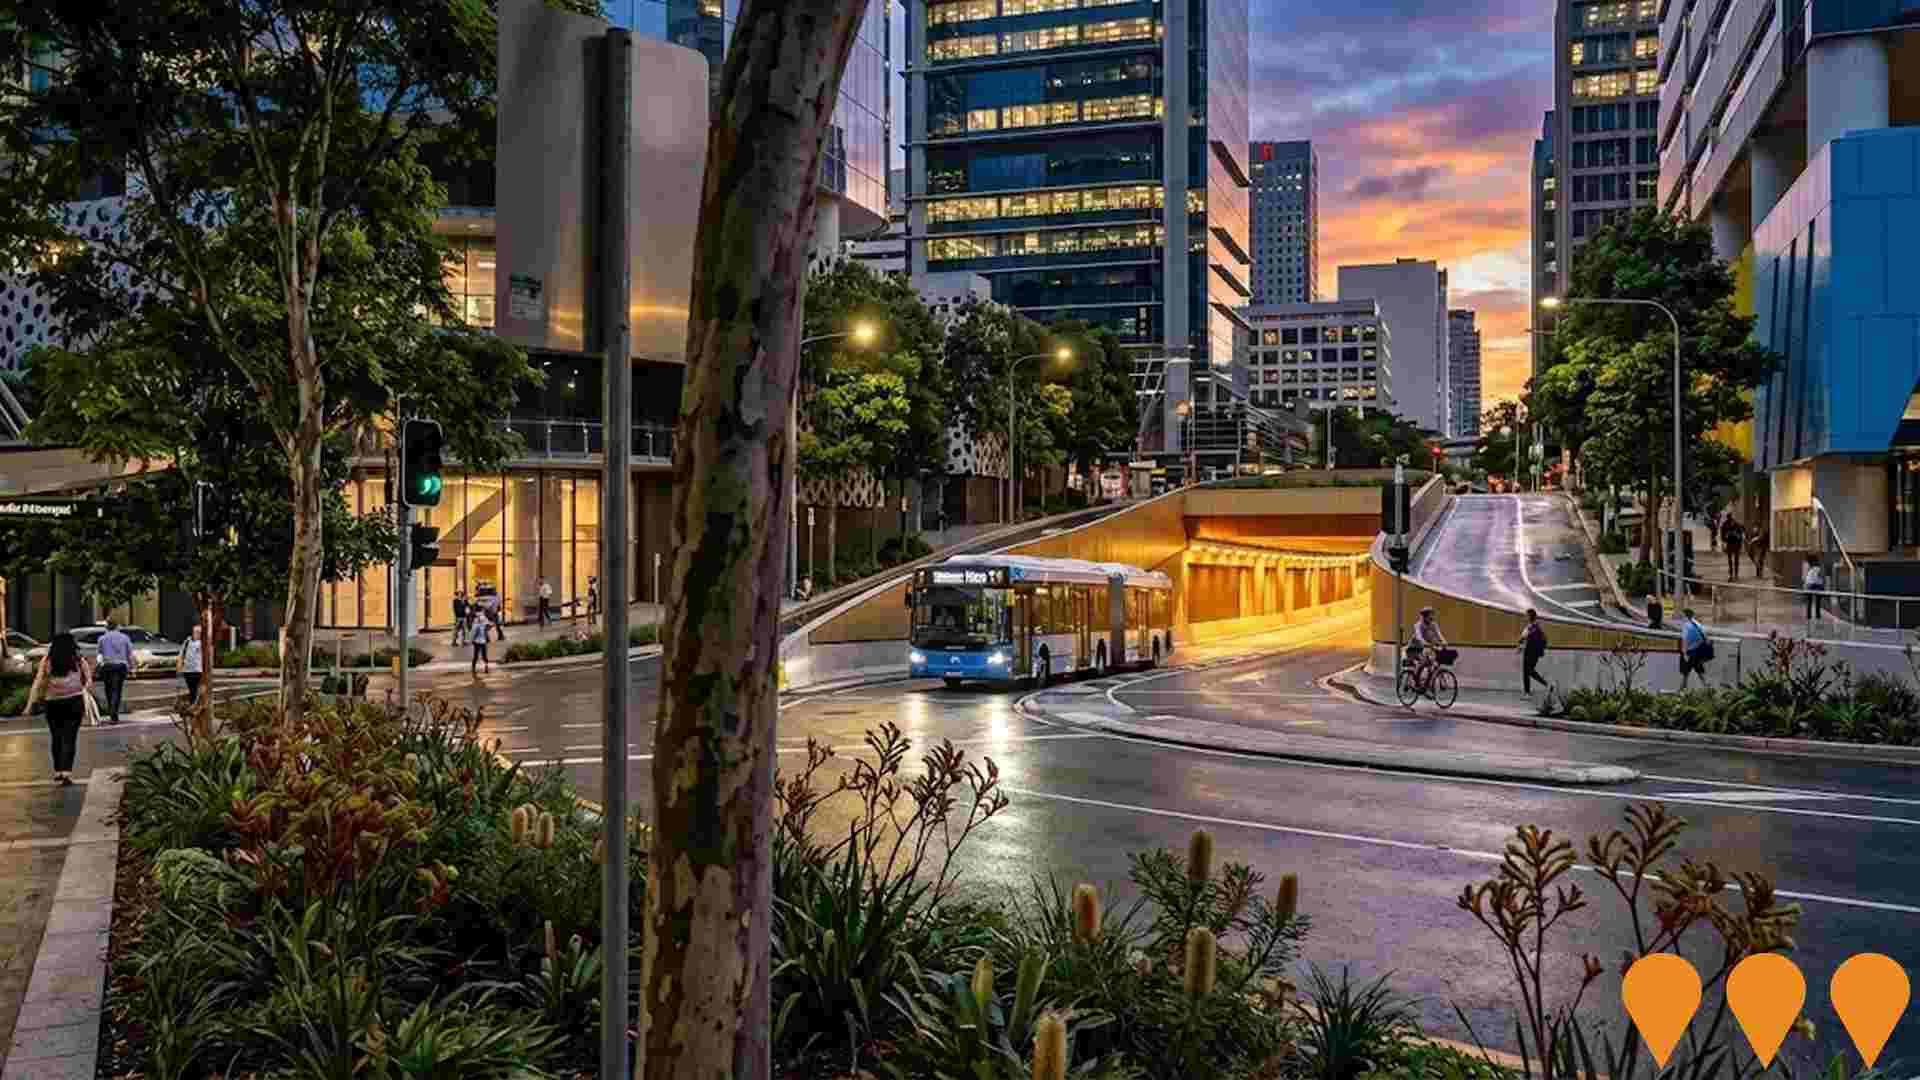
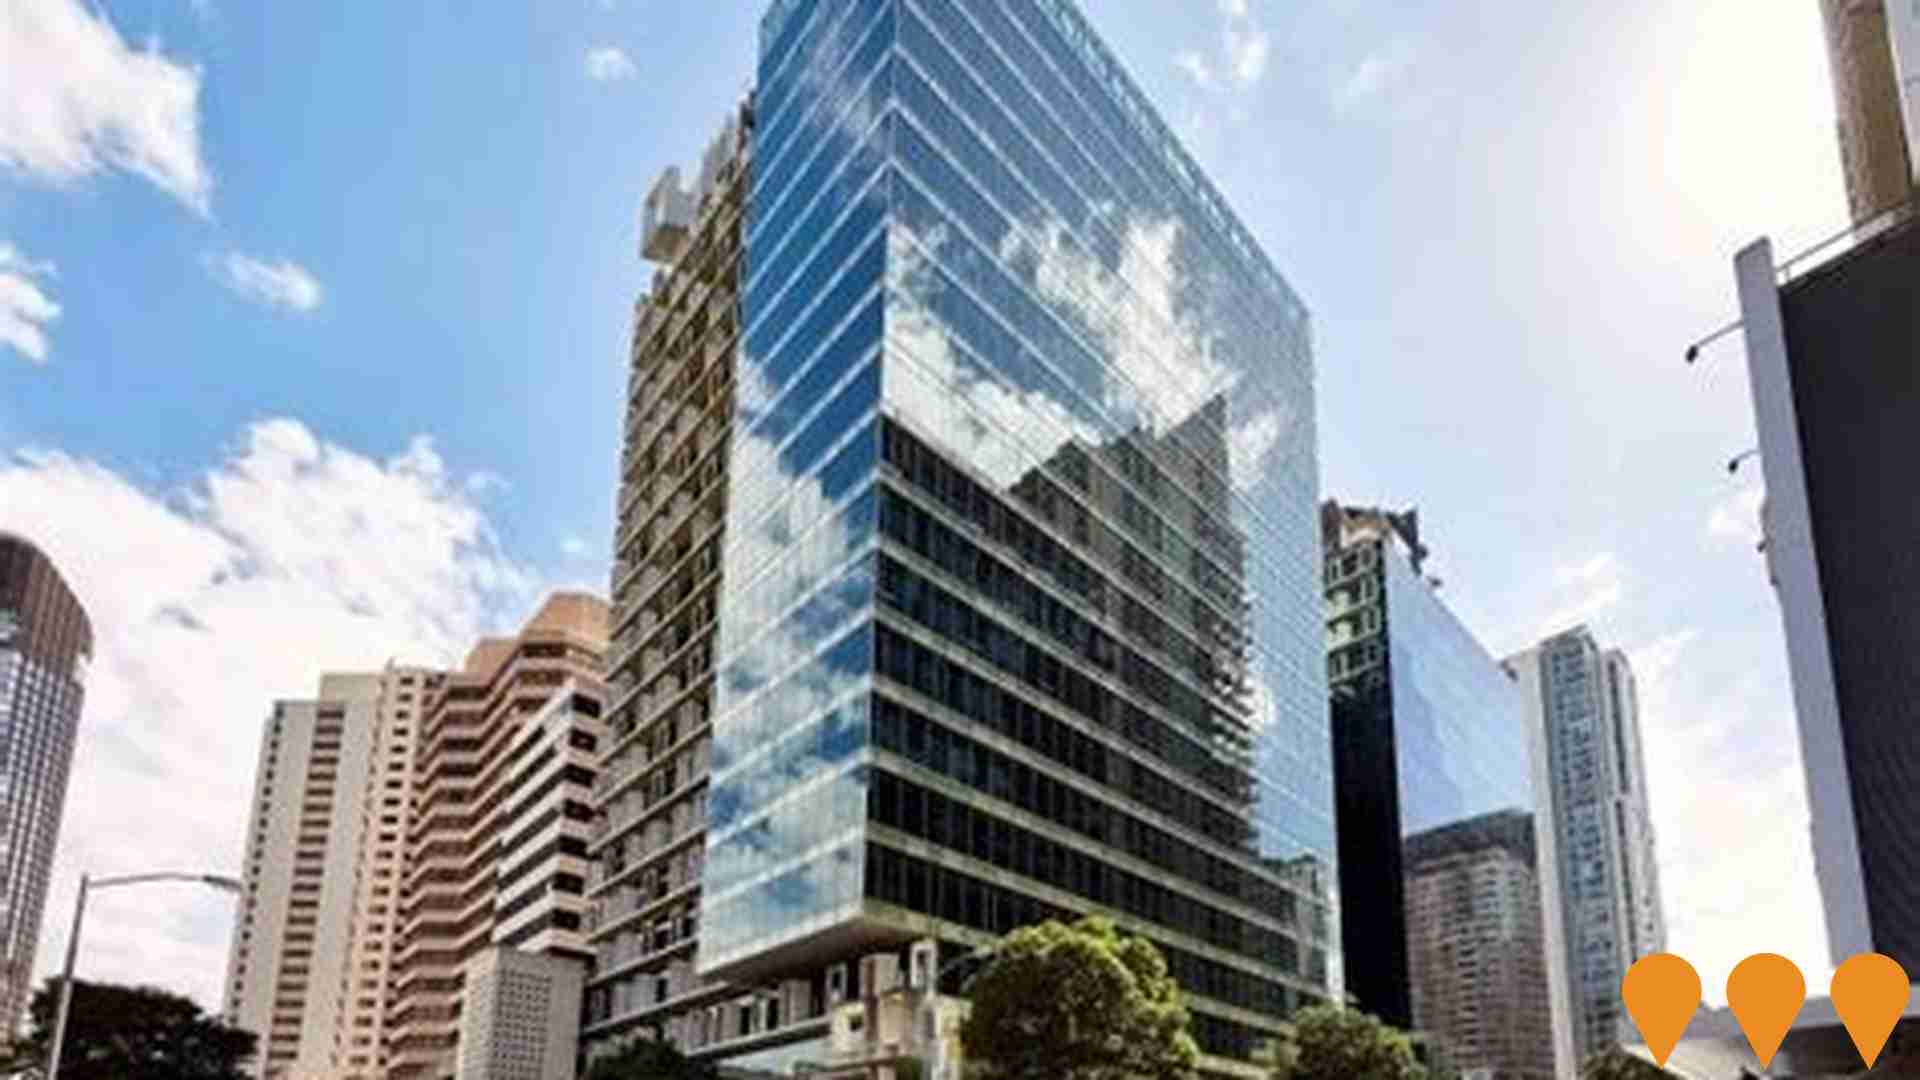
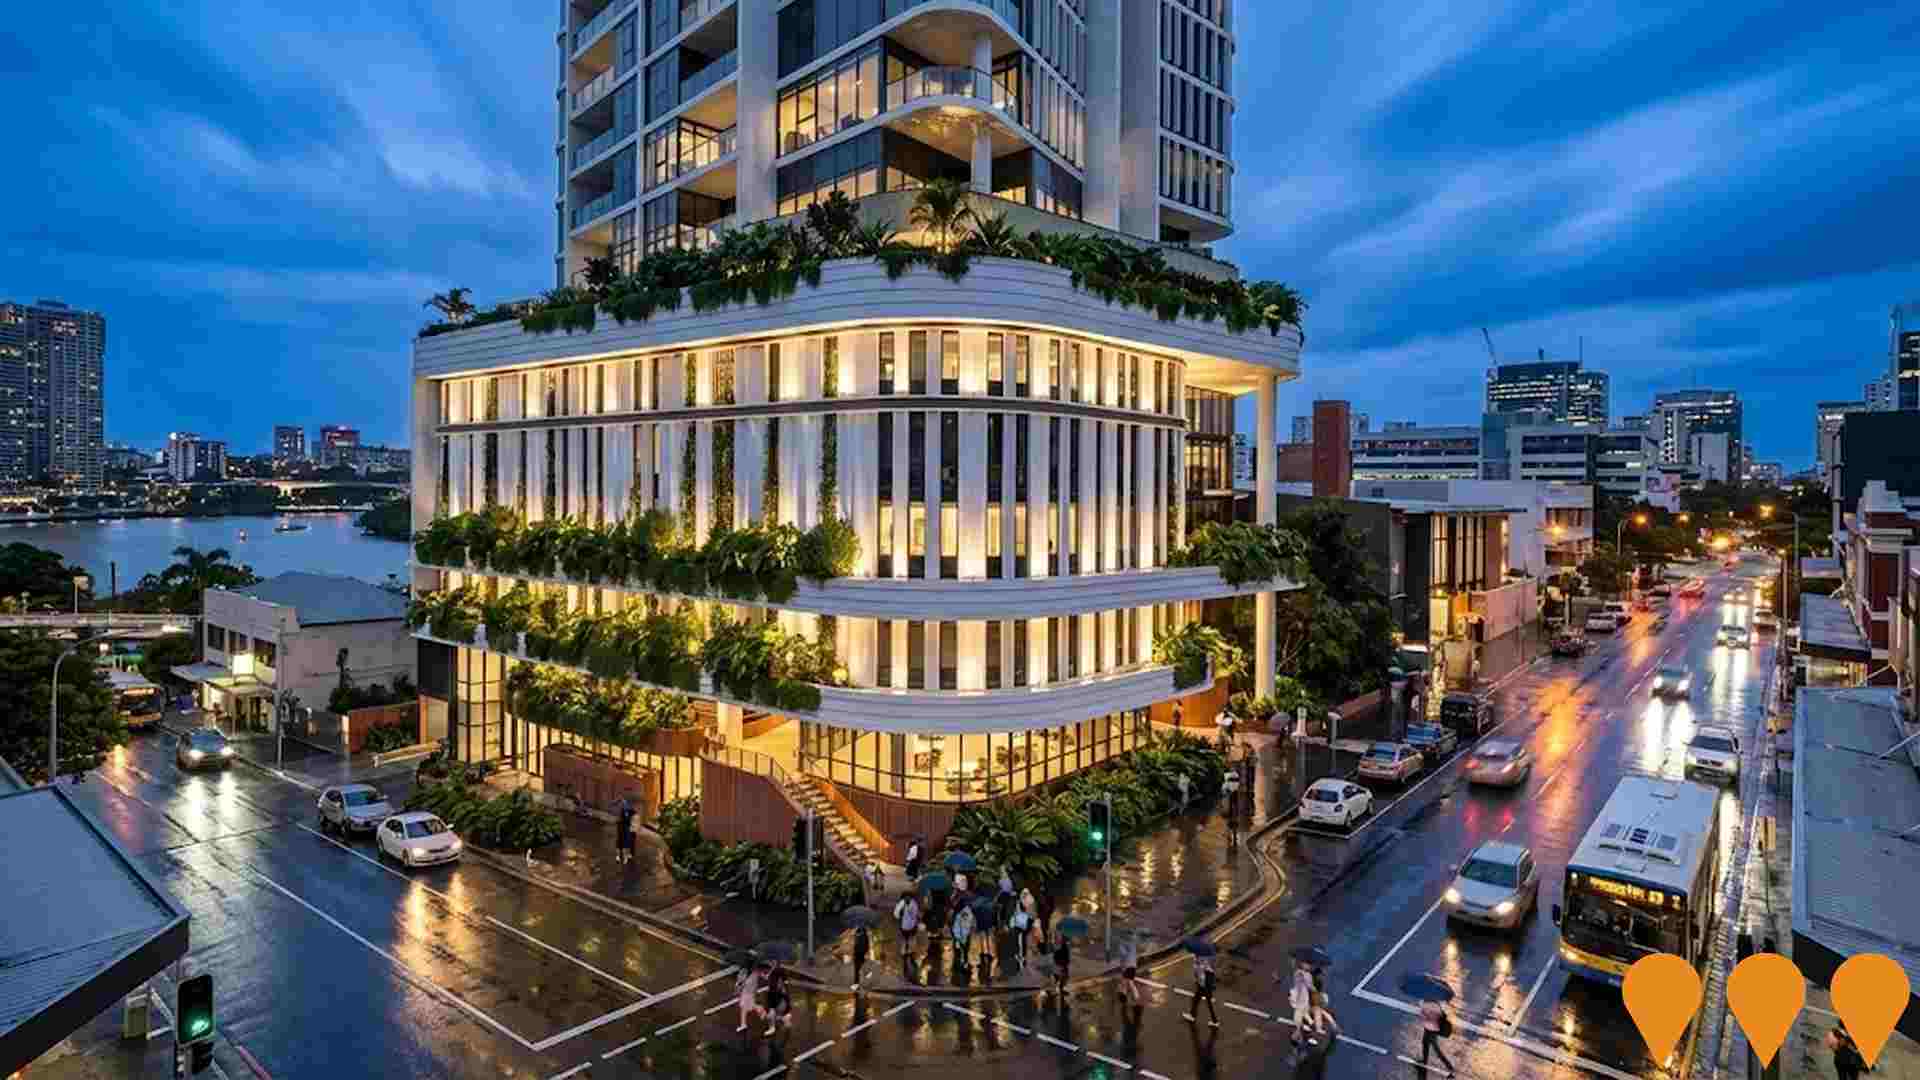
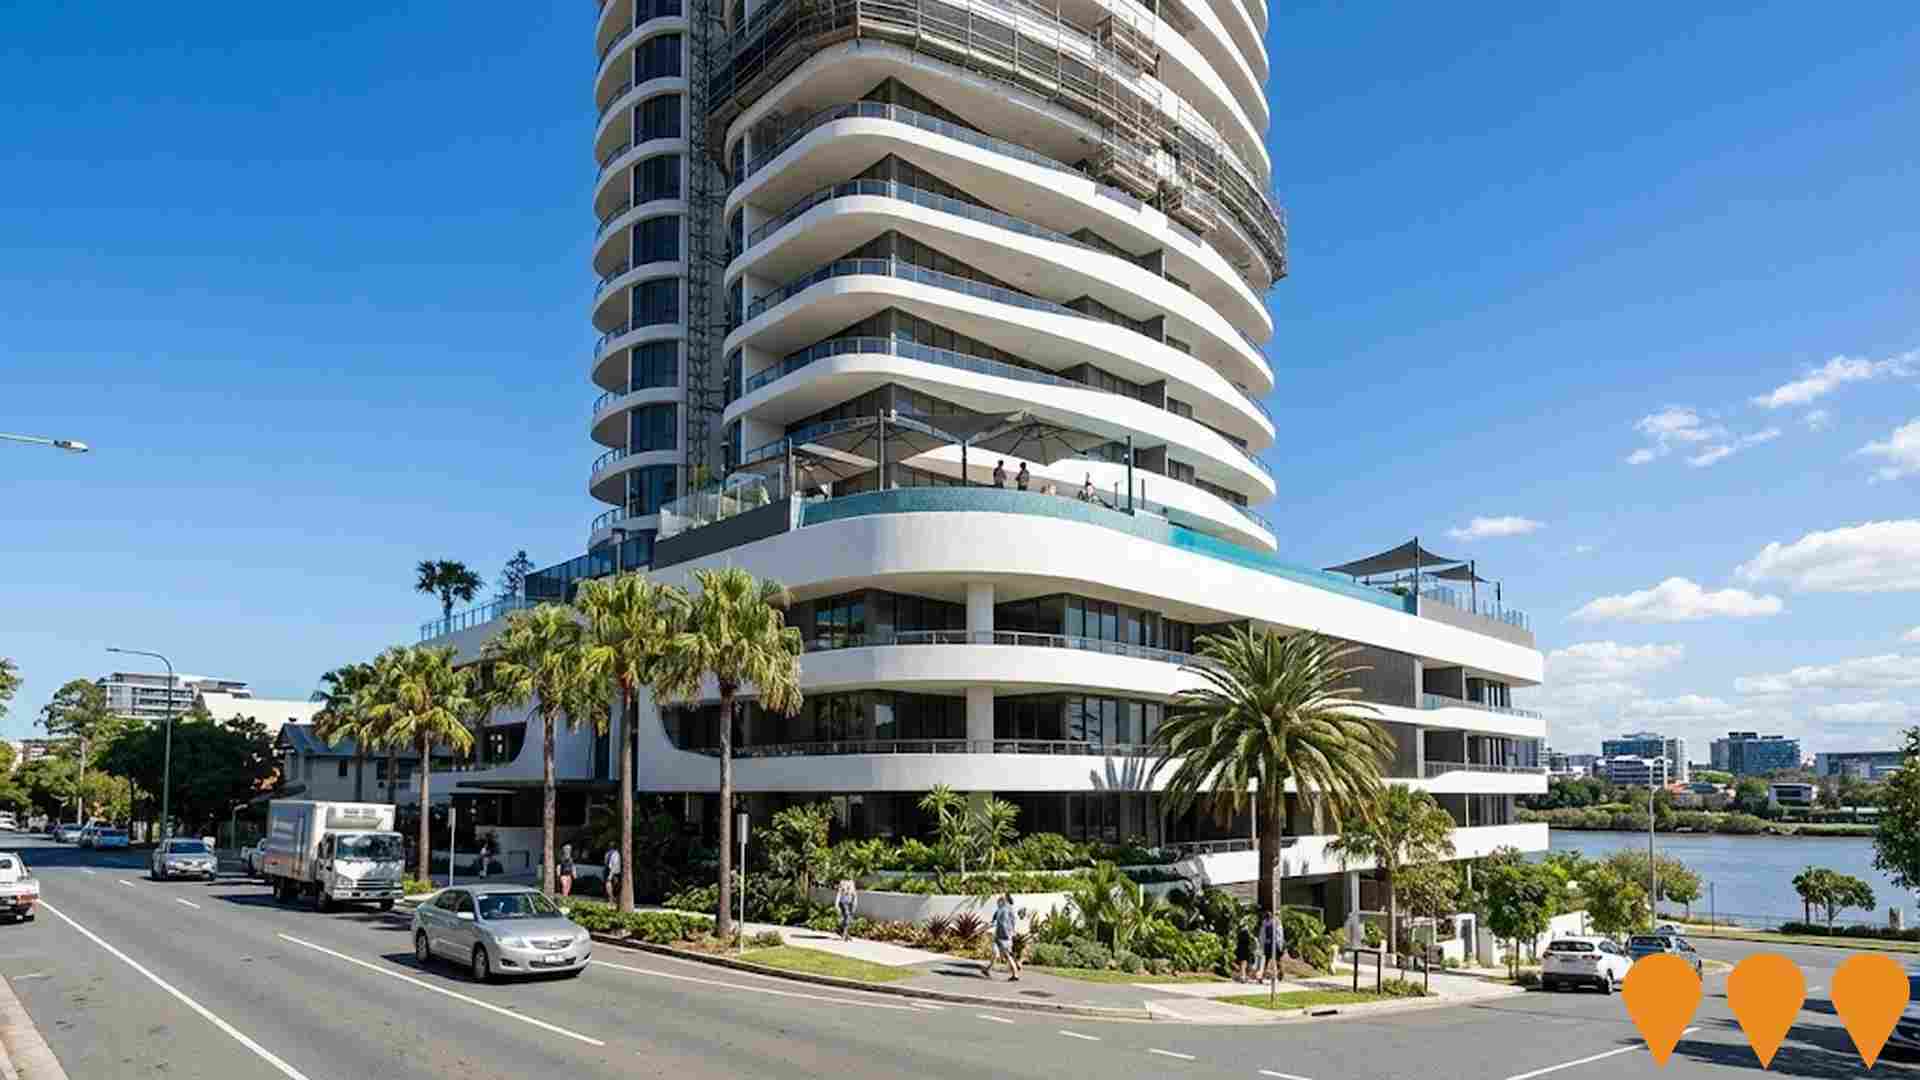
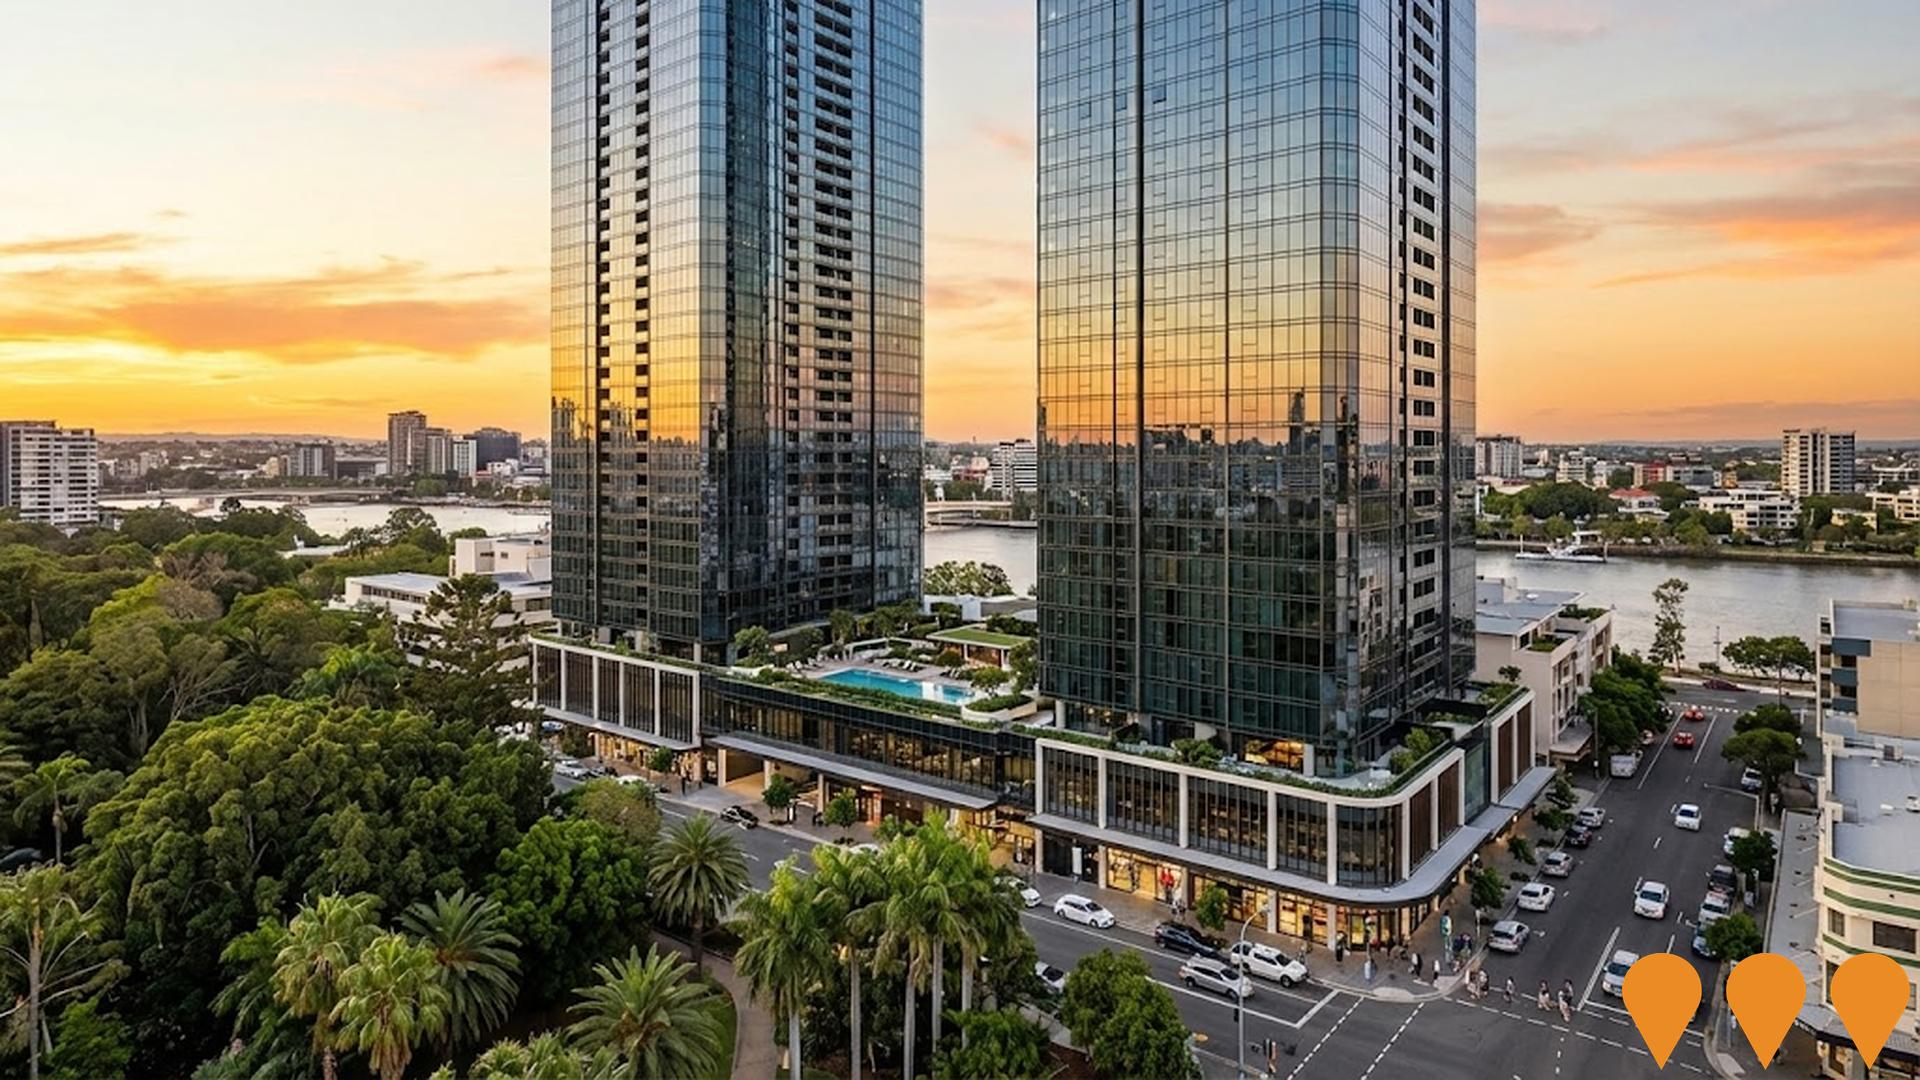
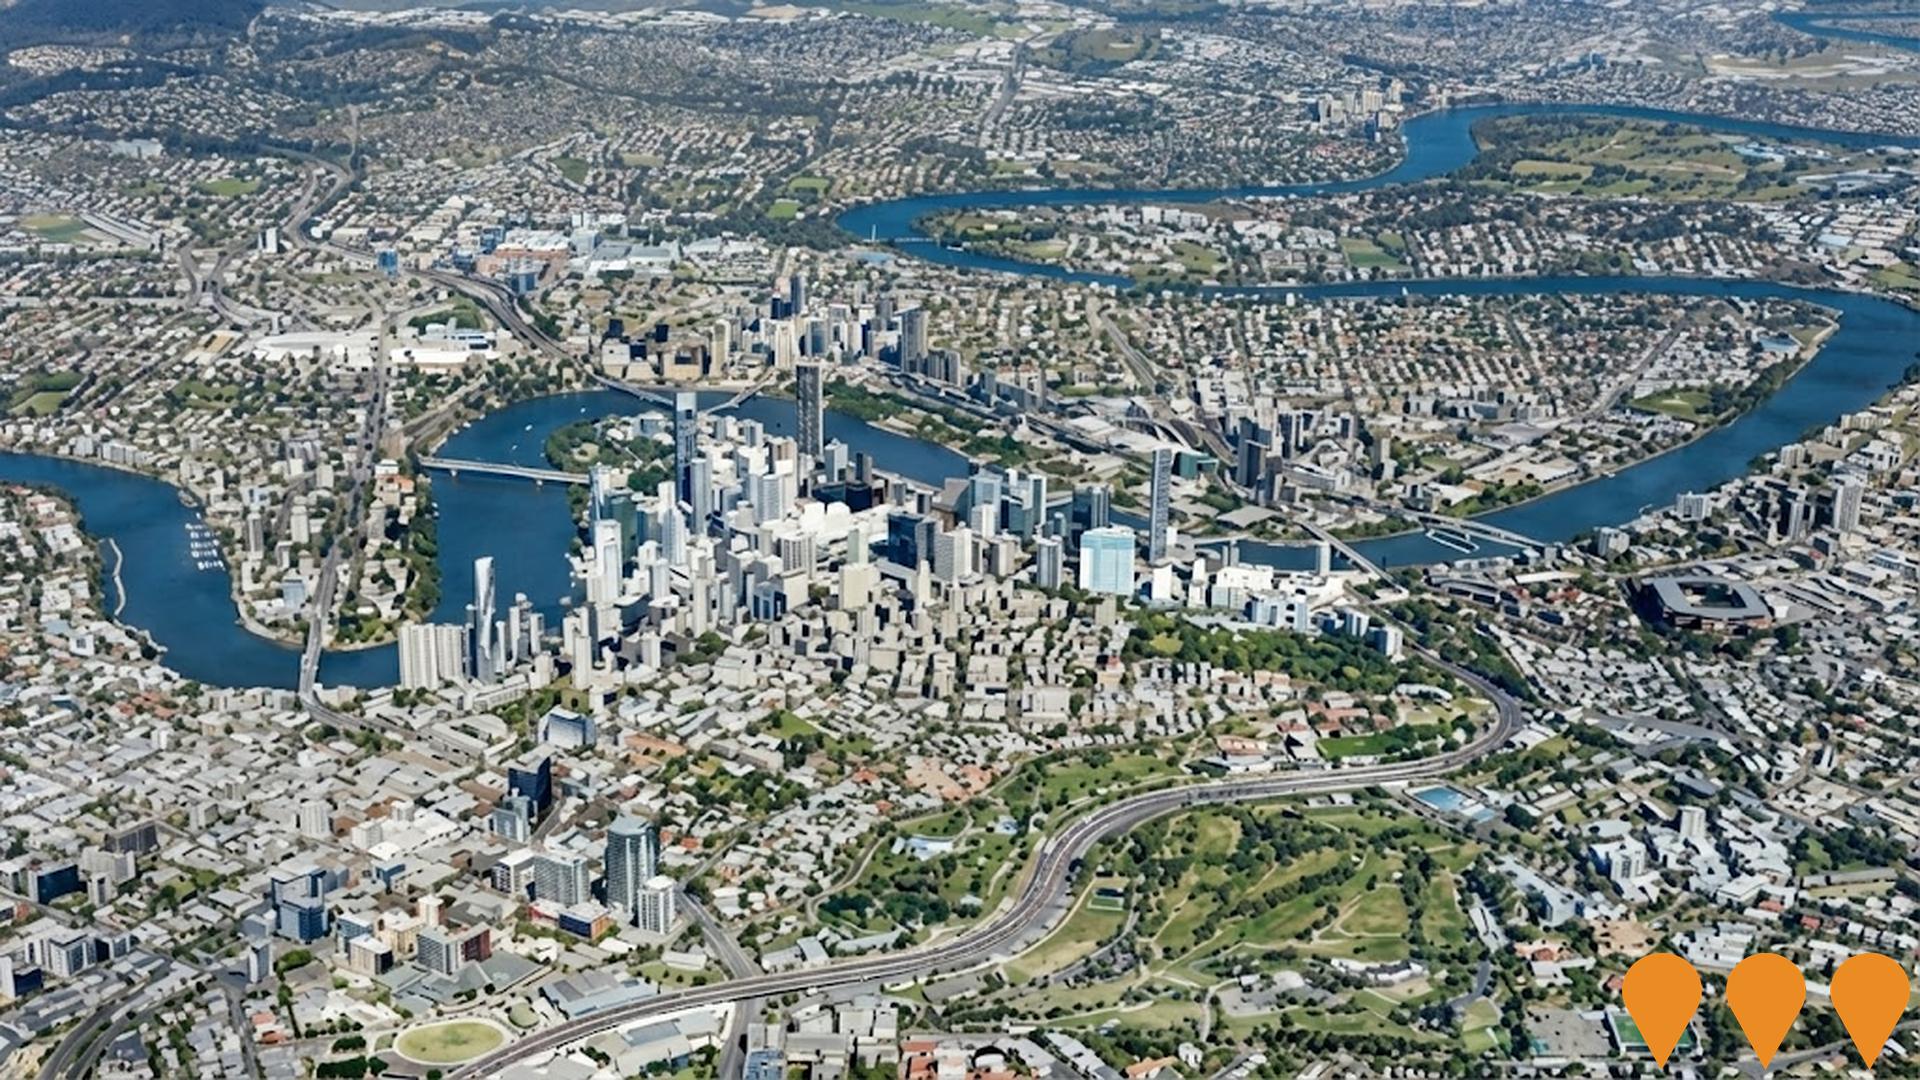
 Denotes AI-based impression for illustrative purposes only, not to be taken as definitive under any circumstances. Please follow links and conduct other investigations from the project's source for actual imagery. Developers and project owners wishing us to use original imagery please Contact Us and we will do so.
Frequently Asked Questions - Infrastructure
Queen's Wharf Brisbane
A $3.6 billion world-class integrated resort precinct by Destination Brisbane Consortium (The Star Entertainment Group, Chow Tai Fook Enterprises, Far East Consortium). Includes The Star Brisbane casino and entertainment complex, four new luxury hotels (The Star Grand, The Star Residences, Dorsett and Rosewood), 1,000+ premium apartments (Tower 1 complete and selling, Towers 2-4 under construction), 50+ new bars and restaurants (many now open), Sky Deck public observation platform, Neville Bonner Bridge to South Bank, and major public realm upgrades with restored heritage buildings. Staged openings continue throughout 2025 with full completion expected 2026.

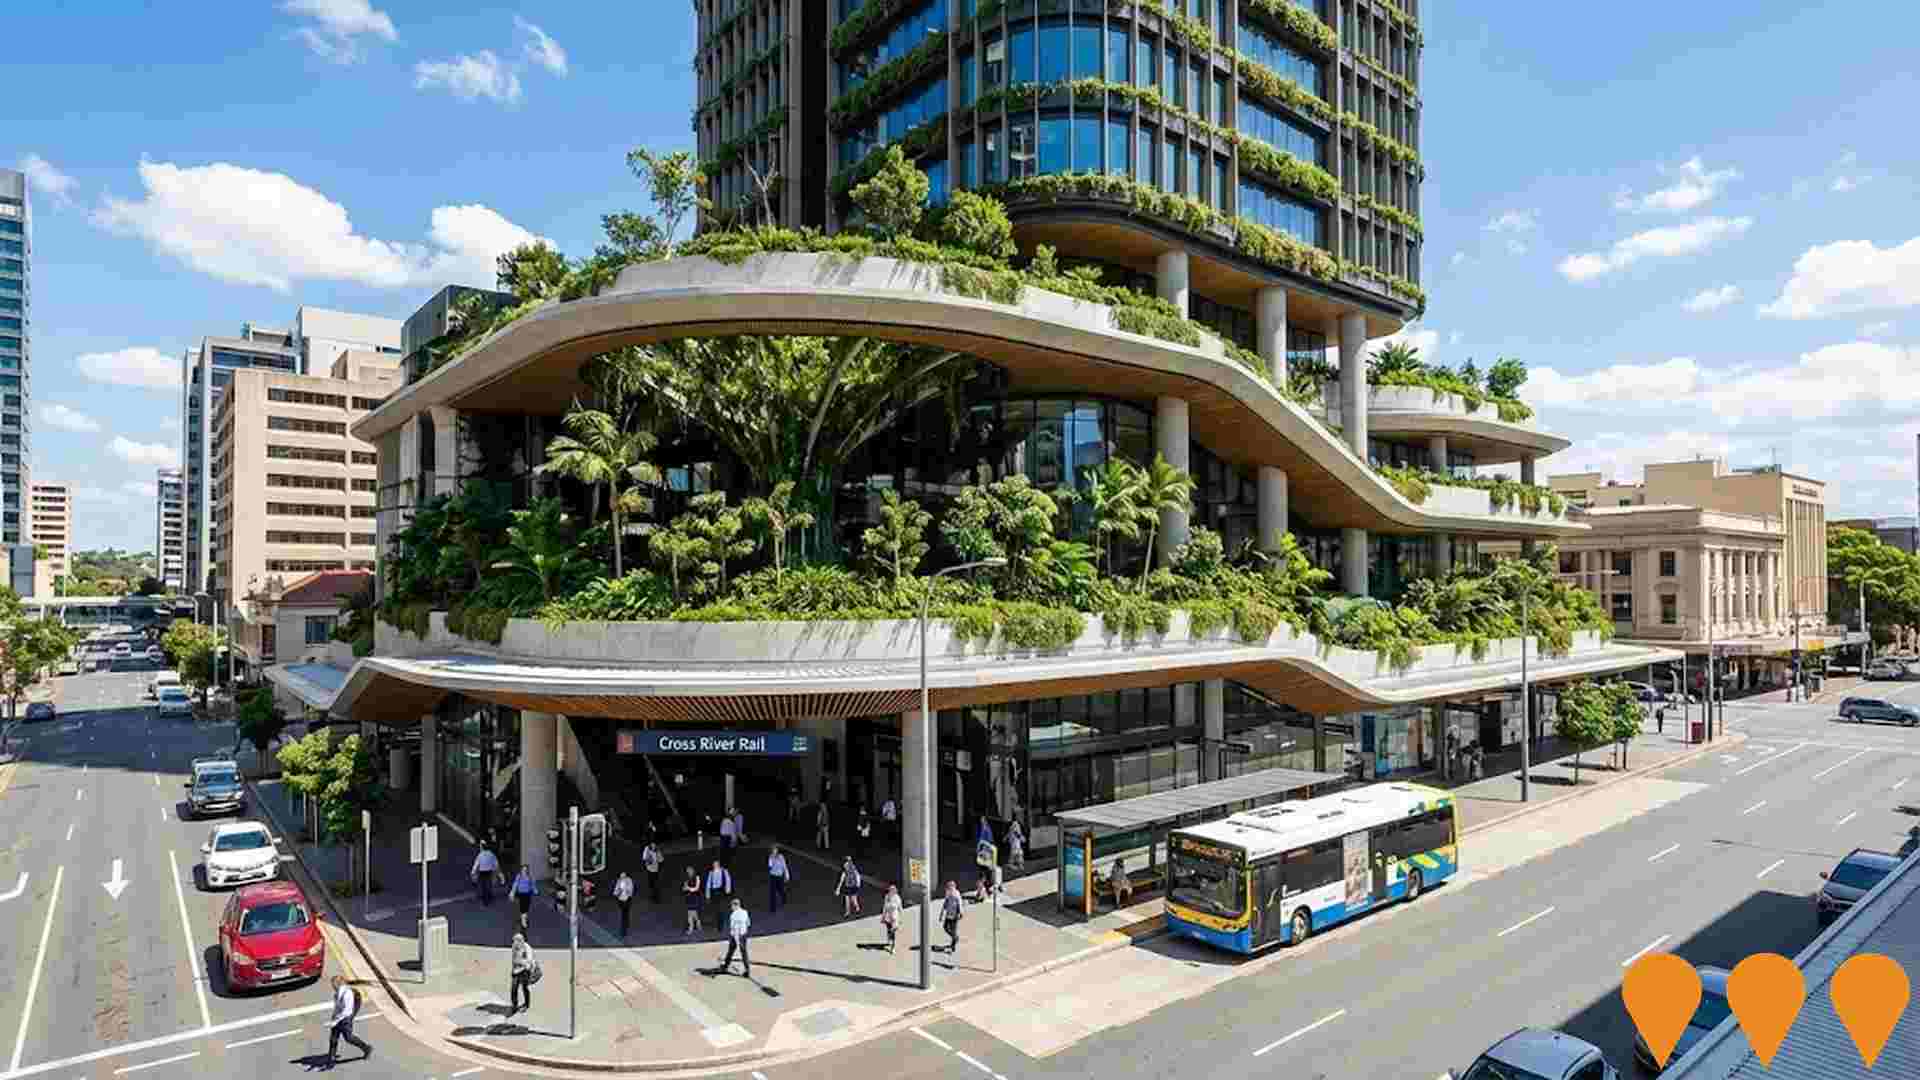
Cross River Rail
Cross River Rail is a 10.2 km north-south rail project in Brisbane, including 5.9 km of twin tunnels under the Brisbane River and CBD. It features four new underground stations (Boggo Road, Woolloongabba, Albert Street, Roma Street), a new above-ground station at Exhibition, upgrades/rebuilds to existing stations including seven between Dutton Park and Salisbury, three new Gold Coast line stations (Pimpama - opened Oct 2025, Merrimac, Hope Island), new train stabling facilities, and a new signalling system. The project has experienced significant cost escalation (latest public figures indicate an outturn cost approaching or exceeding A$19 billion when including broader enabling works) with passenger services now expected in 2029. Queensland's largest infrastructure project unlocking rail capacity bottlenecks across Southeast Queensland.
South East Queensland Infrastructure Plan and Supplement (SEQIP & SEQIS)
The South East Queensland Infrastructure Plan (SEQIP) and its accompanying Infrastructure Supplement (SEQIS) provide the strategic framework for infrastructure coordination across the SEQ region to 2046. The SEQIS specifically identifies priority infrastructure initiatives to support housing supply, economic growth and the delivery of the Brisbane 2032 Olympic and Paralympic Games, including transport, social infrastructure, and catalytic development projects.
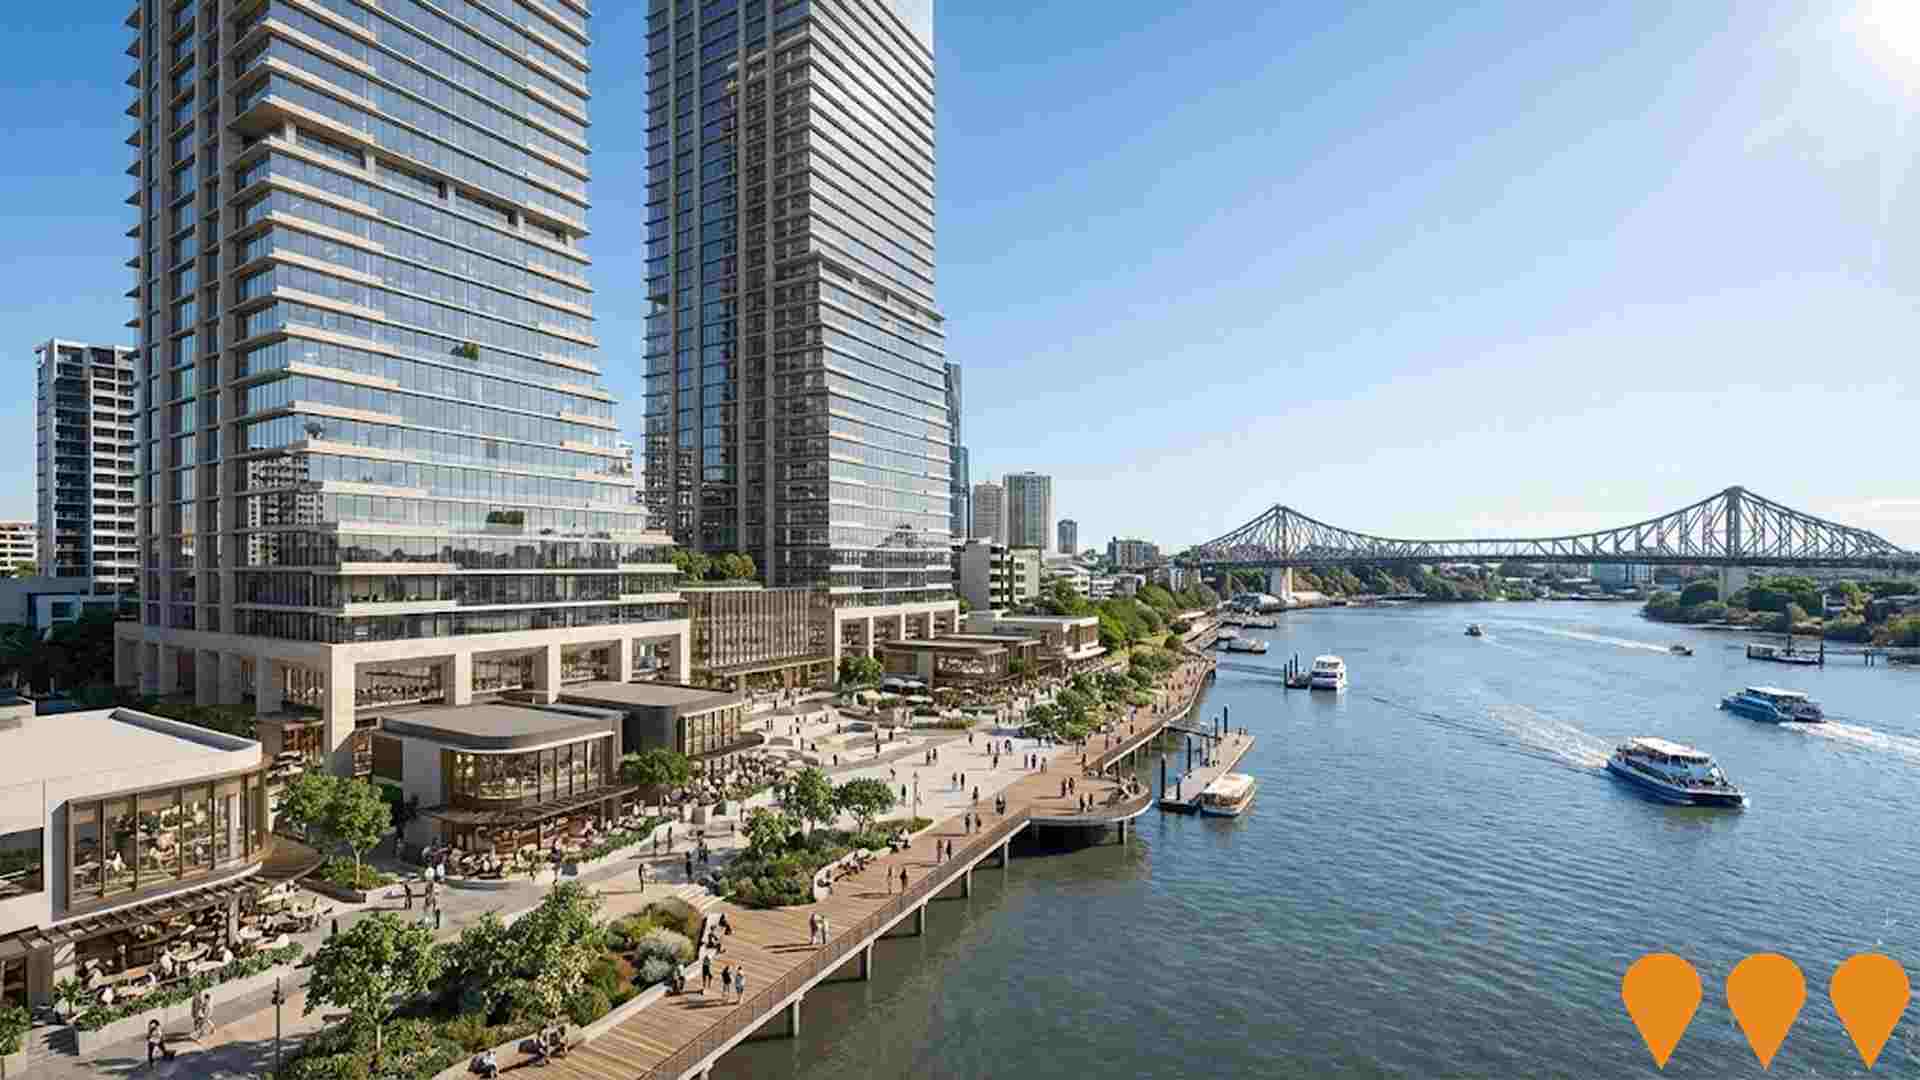
Waterfront Brisbane
Major mixed-use redevelopment of the Eagle Street Pier and Waterfront Place precinct by Dexus. Delivers two premium-grade office towers (46 and 49 levels), 14,000 sqm of retail and dining, a new 15-metre-wide Riverwalk, over 9,000 sqm of public open space including waterfront terraces and a large civic plaza, and improved pedestrian connections between the Brisbane CBD and the river.
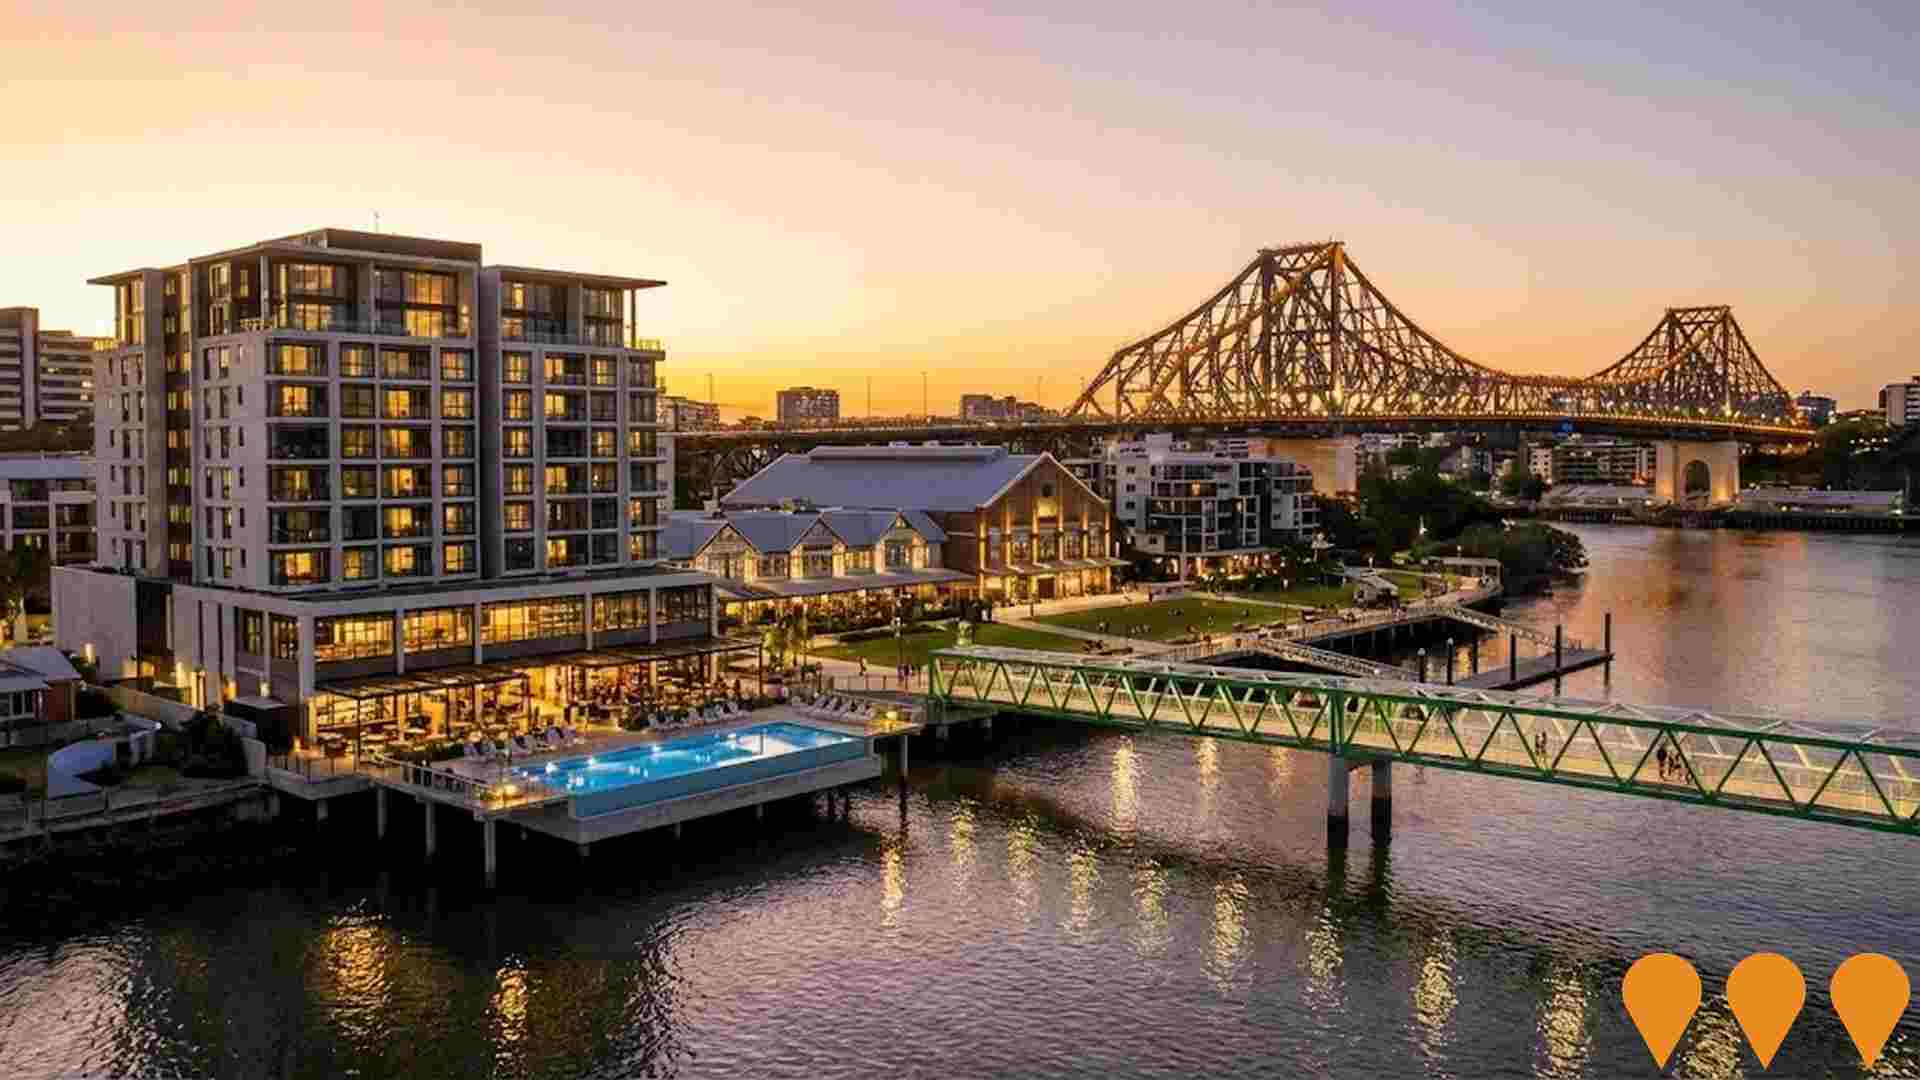
Howard Smith Wharves
Award-winning riverside lifestyle and entertainment precinct under the Story Bridge. Original phase completed 2018. Current expansion includes a new 5-star 77-room boutique hotel with overwater pool deck, day spa, 400-seat music hall, additional restaurants and bars, upgraded public realm and enhanced active transport connections. Development application approved by Brisbane City Council in late 2024, targeting completion in 2027-2028 well ahead of the 2032 Brisbane Olympic and Paralympic Games.
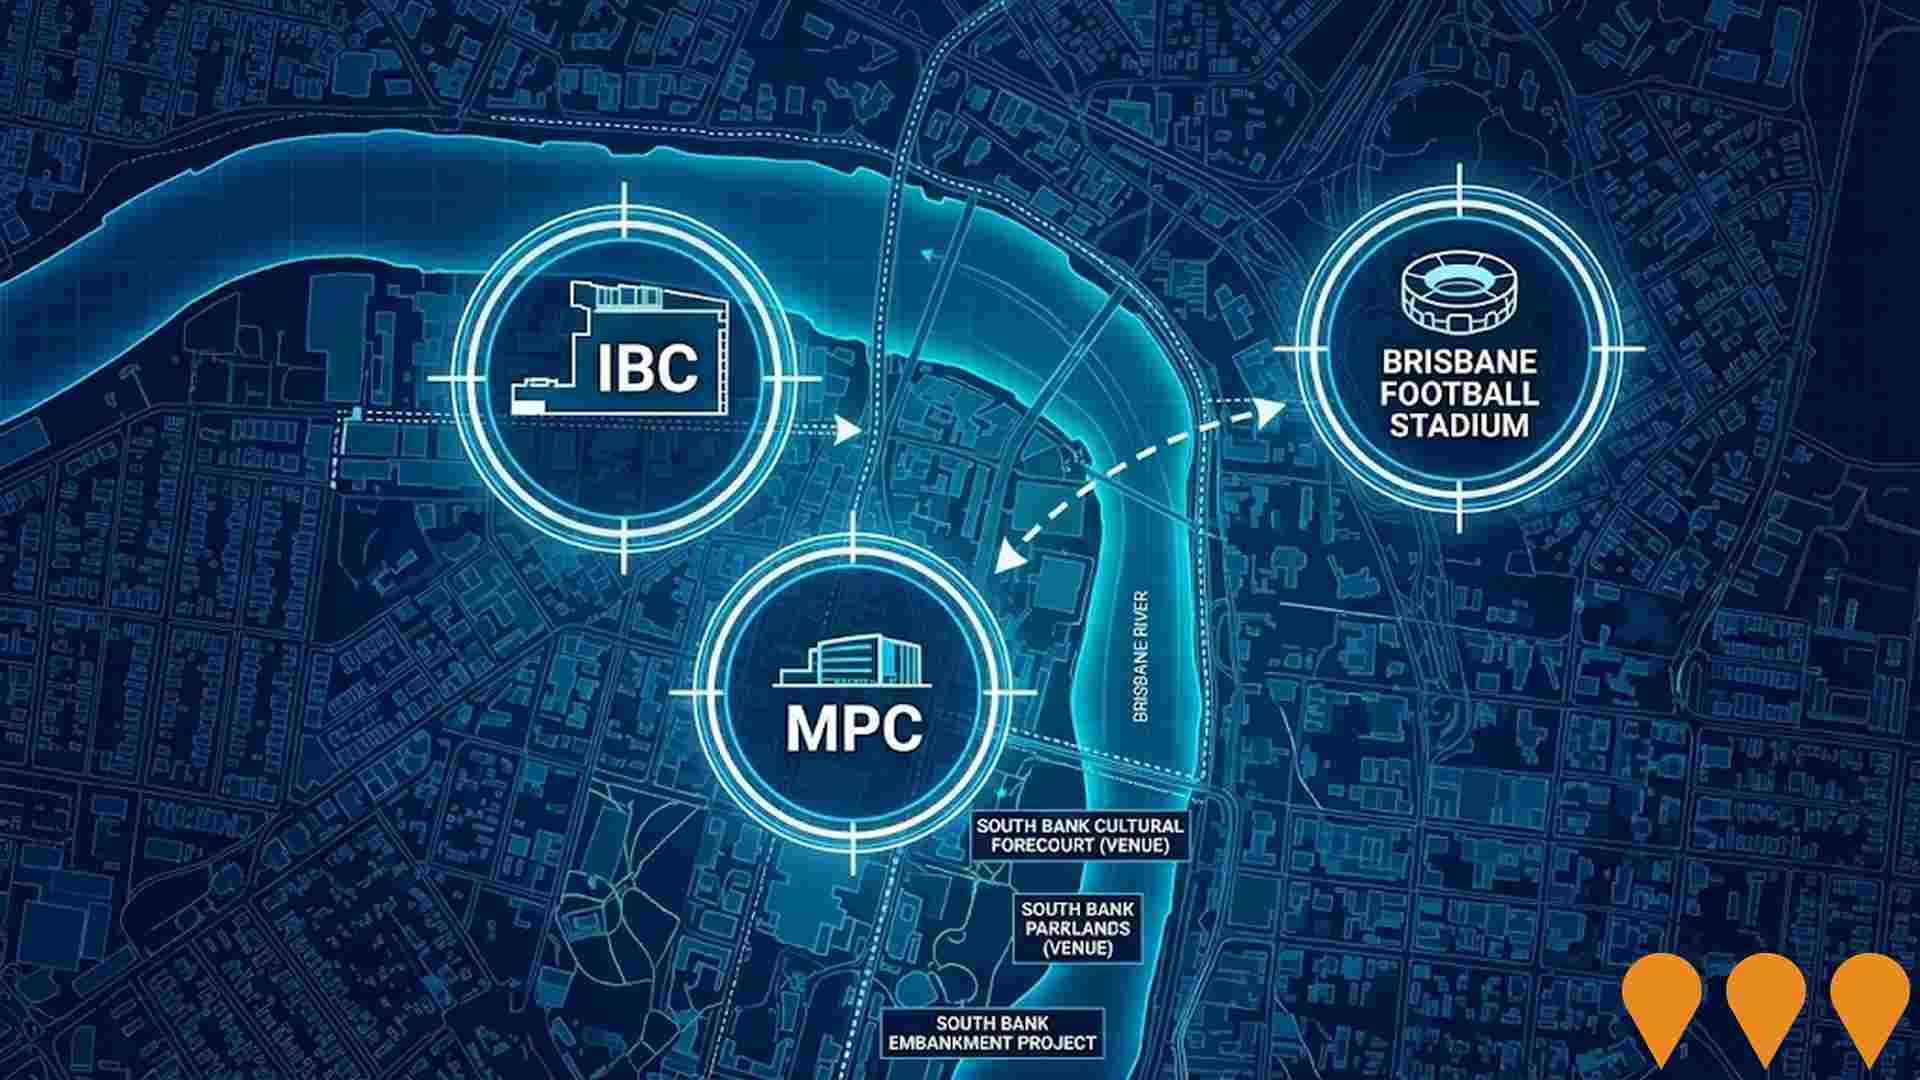
Brisbane 2032 Olympic/Paralympic International Broadcast Centre / Main Media Centre (IBC/MMC)
The International Broadcast Centre and Main Media Centre (IBC/MMC) is a critical non-competition venue for the Brisbane 2032 Olympic and Paralympic Games. It will house broadcasting and media operations for global coverage. The original 60,000sqm proposal for Montague Road, West End was cancelled in May 2025. As of December 2025, the Queensland Government and Brisbane 2032 organisers are still evaluating alternative locations, with no new site officially confirmed. The venue is required to be operational by mid-2032 with legacy use for film, TV and creative industries.
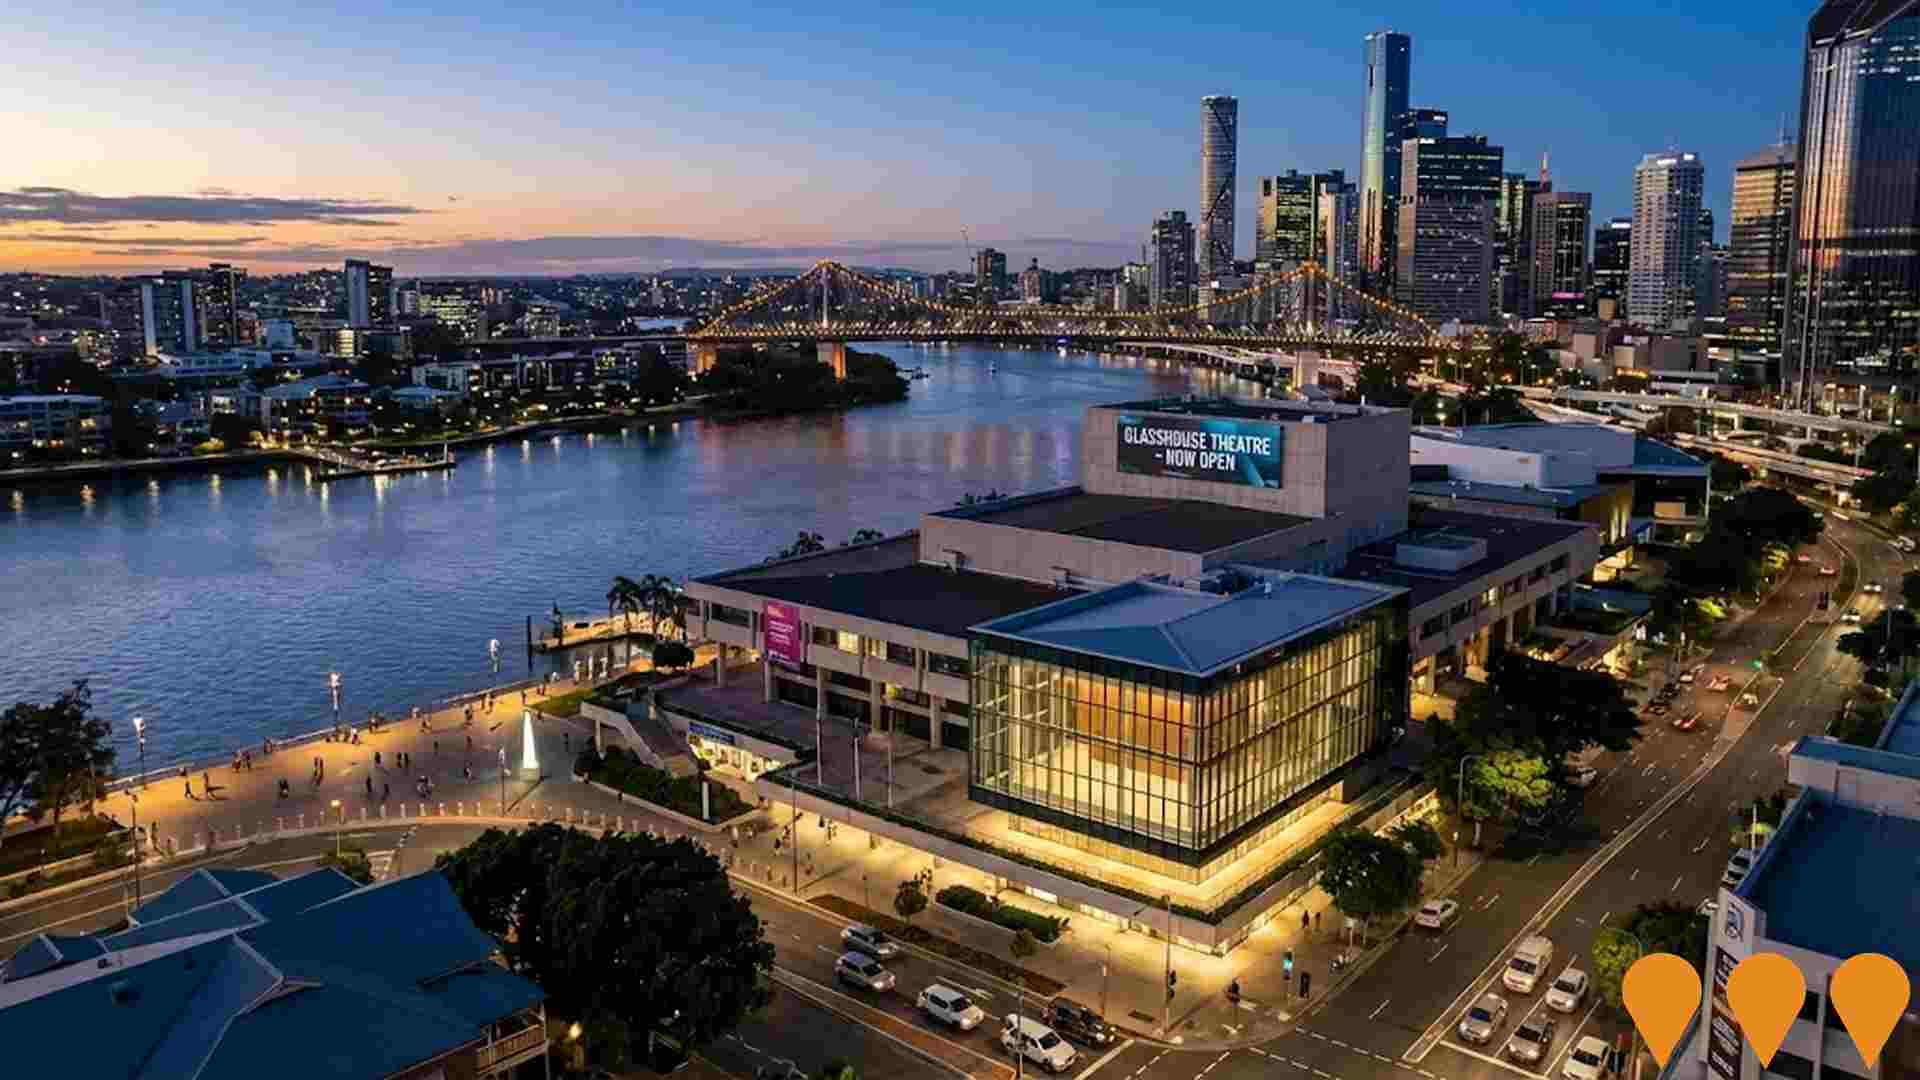
Glasshouse Theatre at QPAC
New 1,500-seat (862 fixed + up to 638 retractable) state-of-the-art lyric theatre at Queensland Performing Arts Centre (QPAC), forming part of the South Bank Cultural Precinct. Designed for ballet, opera, musicals, and drama, it will be Queensland's largest dedicated lyric theatre when complete.
Bridges for Brisbane Program
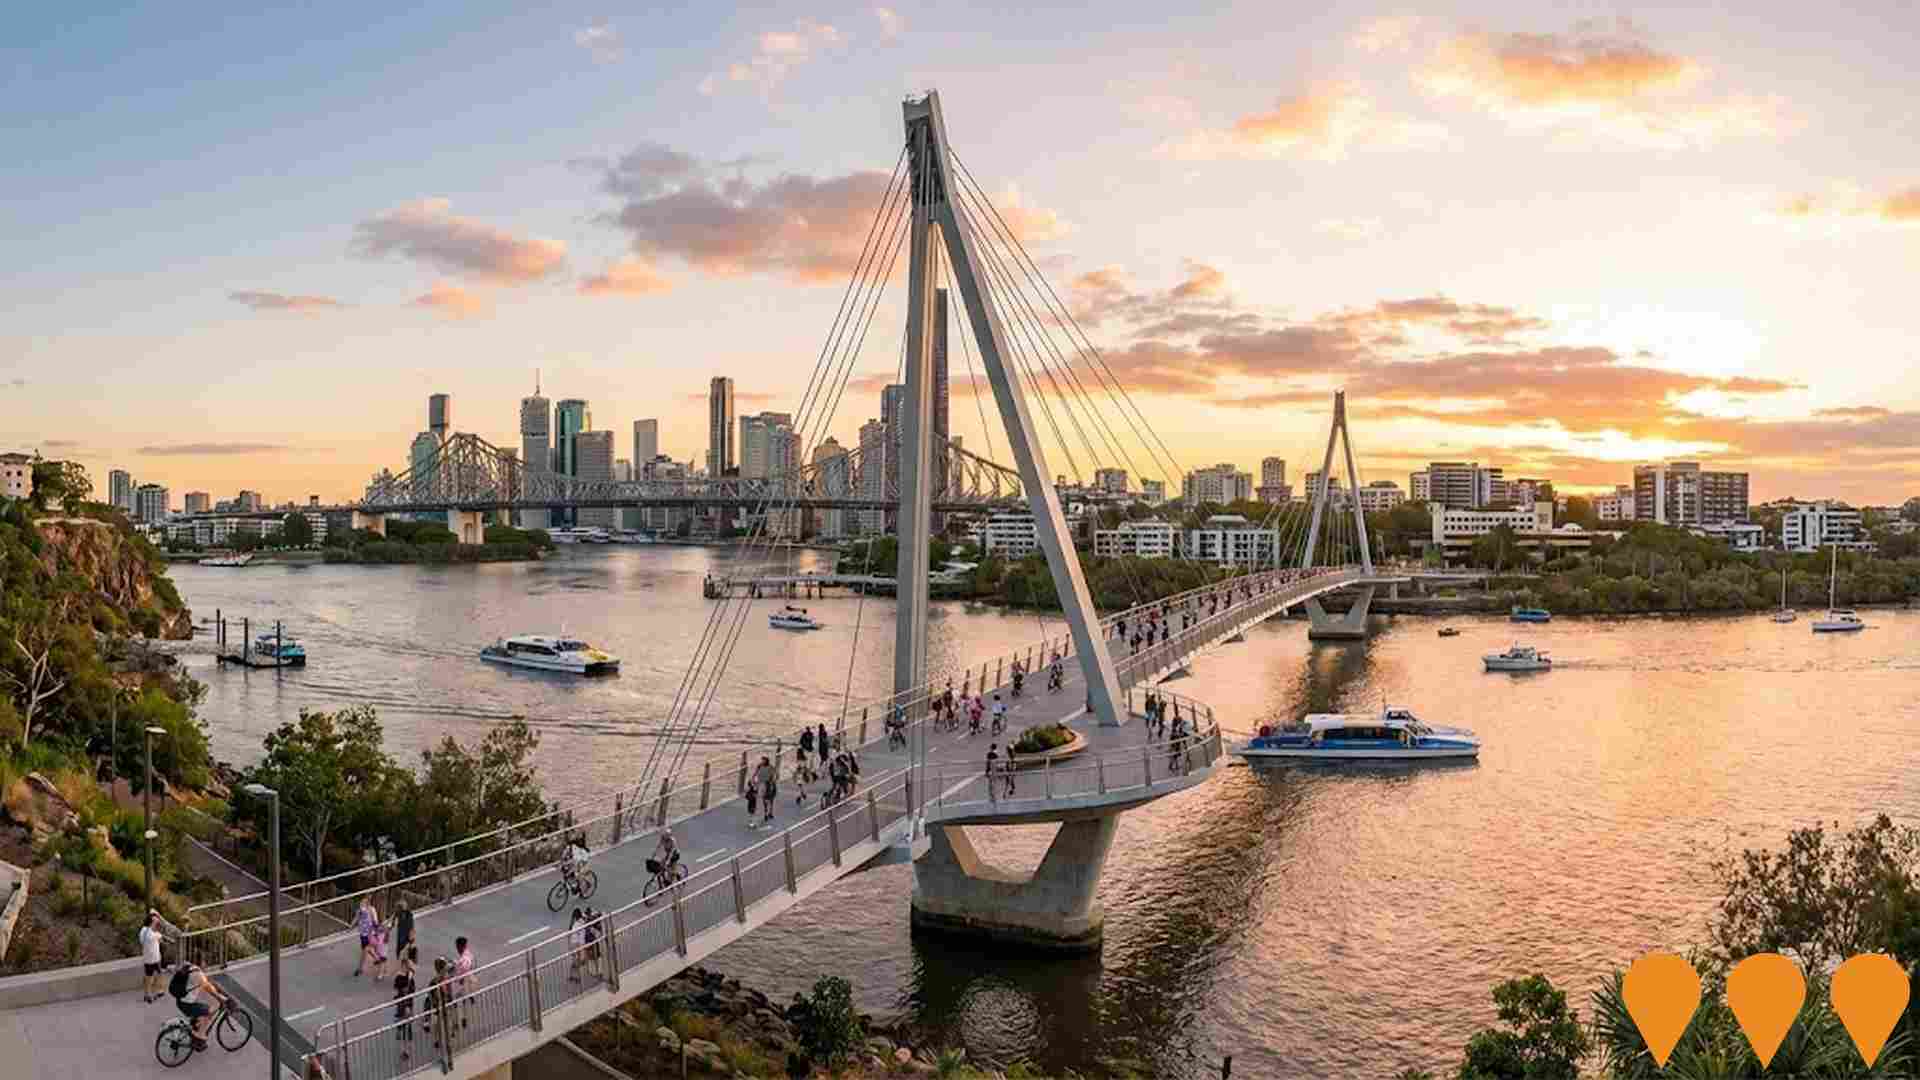
The Bridges for Brisbane Program (formerly known as the Green Bridges Program) is delivering new active transport (pedestrian and cyclist) bridges across the Brisbane River to improve connectivity, reduce congestion, and promote sustainable travel. As of November 2025: Breakfast Creek / Yowoggera Bridge opened February 2024; Kangaroo Point Bridge opened December 2024; Toowong to West End Bridge remains on hold pending additional funding; St Lucia to West End and Bellbowrie bridges have been cancelled. Total Council investment up to $550 million.
Employment
AreaSearch analysis indicates Brisbane City maintains employment conditions that align with national benchmarks
Brisbane City has a highly educated workforce with strong representation in professional services. Its unemployment rate was 4.3% as of the past year, with an estimated employment growth of 2.0%.
As of September 2025, 11,630 residents were employed, and the unemployment rate was 0.3% higher than Greater Brisbane's rate of 4.0%. Workforce participation was fairly standard at 67.5%, compared to Greater Brisbane's 64.5%. Employment among residents is concentrated in professional & technical services (21.8%), accommodation & food services (19.4%), and health care & social assistance (13.7%). Notably, employment levels in accommodation & food services are at 2.5 times the regional average, while health care & social assistance has a limited presence with 10.2% employment compared to 16.1% regionally.
The area functions as an employment hub with 11.0 workers for every resident, hosting more jobs than residents and attracting workers from surrounding areas. Over the past year, employment increased by 2.0%, while the labour force grew by 1.7%, causing the unemployment rate to fall by 0.3 percentage points. In contrast, Greater Brisbane saw employment rise by 3.8%, with a labour force growth of 3.3% and a decrease in unemployment by 0.5 percentage points. State-level data from 25-Nov shows Queensland's employment contracted by 0.01% (losing 1,210 jobs), with the state unemployment rate at 4.2%, broadly in line with the national rate of 4.3%. Jobs and Skills Australia's national employment forecasts from May-25 project a 6.6% expansion over five years and 13.7% over ten years. Applying these projections to Brisbane City's employment mix suggests local employment should increase by 6.8% over five years and 13.8% over ten years, based on simple weighting extrapolation for illustrative purposes.
Frequently Asked Questions - Employment
Income
Income levels align closely with national averages, indicating typical economic conditions for Australian communities according to AreaSearch analysis
Brisbane City SA2 has a high national income level, according to AreaSearch's aggregation of latest ATO data for financial year 2022. Its median taxpayer income is $49,753 and average income stands at $83,490, compared to Greater Brisbane's figures of $55,645 and $70,520 respectively. Based on Wage Price Index growth of 13.99% since financial year 2022, current estimates for September 2025 would be approximately $56,713 (median) and $95,170 (average). Census data shows household, family, and personal incomes in Brisbane City cluster around the 62nd percentile nationally. Income brackets indicate that 32.6% of residents earn between $1,500 - 2,999 weekly (5,901 residents), consistent with broader trends across the broader area showing 33.3% in the same category. High housing costs consume 20.7% of income, but strong earnings place disposable income at the 50th percentile and the area's SEIFA income ranking places it in the 8th decile.
Frequently Asked Questions - Income
Housing
Brisbane City features a more urban dwelling mix with significant apartment living, with a higher proportion of rental properties than the broader region
In Brisbane City, as per the latest Census evaluation, dwelling structures consisted of 6.2% houses and 93.9% other dwellings (semi-detached, apartments, 'other' dwellings). In comparison, Brisbane metro had 12.9% houses and 87.2% other dwellings. Home ownership in Brisbane City was at 16.5%, with the rest of dwellings either mortgaged (16.6%) or rented (66.9%). The median monthly mortgage repayment was $2,000, aligning with Brisbane metro's average, while the median weekly rent figure was $460, compared to Brisbane metro's $2,000 and $440 respectively. Nationally, Brisbane City's mortgage repayments were higher than the Australian average of $1,863, with rents substantially above the national figure of $375.
Frequently Asked Questions - Housing
Household Composition
Brisbane City features high concentrations of group households and lone person households, with a lower-than-average median household size
Family households account for 45.0% of all households, including 9.0% couples with children, 29.7% couples without children, and 4.6% single parent families. Non-family households constitute the remaining 55.0%, with lone person households at 41.7% and group households comprising 13.2%. The median household size is 1.8 people, which is smaller than the Greater Brisbane average of 1.9.
Frequently Asked Questions - Households
Local Schools & Education
Educational attainment in Brisbane City aligns closely with national averages, showing typical qualification patterns and performance metrics
Brisbane City residents aged 15 and above have a higher educational attainment than the Queensland (QLD) and Australian averages. Specifically, 53.0% of Brisbane City residents hold university qualifications compared to 25.7% in QLD and 30.4% in Australia. This high level of educational attainment positions the area favourably for knowledge-based opportunities. Among these residents, bachelor degrees are the most common at 33.9%, followed by postgraduate qualifications (15.8%) and graduate diplomas (3.3%).
Vocational pathways account for 22.7% of qualifications, with advanced diplomas making up 11.0% and certificates accounting for 11.7%. Educational participation is notably high in Brisbane City, with 39.6% of residents currently enrolled in formal education. This includes 24.4% in tertiary education, 2.3% in secondary education, and 2.1% pursuing primary education.
Frequently Asked Questions - Education
Schools Detail
Nearby Services & Amenities
Transport
Transport servicing is high compared to other areas nationally based on assessment of service frequency, route connectivity and accessibility
Brisbane City has 159 active public transport stops. These include ferry, train, and bus services. There are 409 individual routes operating from these stops, which collectively provide 47,938 weekly passenger trips.
Residents have excellent transport accessibility, with an average distance of 82 meters to the nearest stop. On average, there are 6,848 trips per day across all routes, equating to approximately 301 weekly trips per individual stop.
Frequently Asked Questions - Transport
Transport Stops Detail
Health
Brisbane City's residents boast exceedingly positive health performance metrics with very low prevalence of common health conditions across all age groups
Brisbane City shows excellent health outcomes with very low prevalence of common health conditions across all age groups. The rate of private health cover is exceptionally high at approximately 61% of the total population (11,096 people), compared to 64.3% across Greater Brisbane and the national average of 55.3%. Mental health issues and asthma are the most common medical conditions in the area, affecting 8.0% and 5.9% of residents respectively.
A total of 79.4% of residents declare themselves completely clear of medical ailments, compared to 75.5% across Greater Brisbane. The area has 9.7% of residents aged 65 and over (1,759 people). Health outcomes among seniors are particularly strong, broadly in line with the general population's health profile.
Frequently Asked Questions - Health
Cultural Diversity
Brisbane City is among the most culturally diverse areas in the country based on AreaSearch assessment of a range of language and cultural background related metrics
Brisbane City has a high level of cultural diversity, with 41.5% of its population speaking a language other than English at home and 54.3% born overseas. Christianity is the main religion in Brisbane City, making up 33.5% of people. However, Buddhism is overrepresented compared to Greater Brisbane, comprising 5.8% versus 3.9%.
The top three ancestry groups are English (20.4%), Other (15.8%), and Australian (13.6%). Korean (3.3%) and Spanish (0.9%) are notably overrepresented in Brisbane City compared to the regional averages of 1.3% and 1.0%, respectively. Additionally, Chinese people make up 12.4% of Brisbane City's population, higher than the regional average of 7.7%.
Frequently Asked Questions - Diversity
Age
Brisbane City hosts a very young demographic, ranking in the bottom 10% of areas nationwide
Brisbane City has a median age of 31 years, which is younger than the Greater Brisbane average of 36 and substantially under the Australian median of 38. Compared to Greater Brisbane, Brisbane City has a higher percentage of residents aged 25-34 (30.8%) but fewer residents aged 5-14 (2.3%). This concentration of 25-34 year-olds is well above the national average of 14.5%. According to data from the post-2021 Census, the percentage of Brisbane City's population aged 25 to 34 has grown from 29.8% to 30.8%, while the percentages for the 45 to 54 age group have declined from 10.4% to 9.2% and the 35 to 44 age group have dropped from 14.8% to 13.6%. By 2041, demographic modeling suggests that Brisbane City's age profile will change significantly. The 25 to 34 age cohort is projected to grow steadily, with an increase of 2,699 people (48%) from 5,579 to 8,279.
