Chart Color Schemes
This analysis uses ABS Statistical Areas Level 2 (SA2) boundaries, which can materially differ from Suburbs and Localities (SAL) even when sharing similar names.
SA2 boundaries are defined by the Australian Bureau of Statistics and are designed to represent communities for statistical reporting (e.g., census and ERP).
Suburbs and Localities (SAL) represent commonly-used suburb/locality names (postal-style areas) and may use different geographic boundaries. For comprehensive analysis, consider reviewing both boundary types if available.
est. as @ -- *
ABS ERP | -- people | --
2021 Census | -- people
Sales Activity
Curious about local property values? Filter the chart to assess the volume and appreciation (including resales) trends and regional comparisons, or scroll to the map below view this information at an individual property level.
Find a Recent Sale
Sales Detail
Population
Algester has seen population growth performance typically on par with national averages when looking at short and medium term trends
Algester's population was around 10,050 as of November 2025. This figure reflects an increase of 1,030 people since the 2021 Census, which reported a population of 9,020. The change is inferred from the estimated resident population of 9,975 in June 2024 and an additional 146 validated new addresses since the Census date. This results in a density ratio of 2,723 persons per square kilometer, placing Algester in the upper quartile relative to national locations assessed by AreaSearch. Algester's growth rate of 11.4% since the 2021 census exceeded the national average (8.9%), indicating it as a growth leader in its region. Overseas migration contributed approximately 68.9% of overall population gains during recent periods, though all drivers including natural growth and interstate migration were positive factors.
AreaSearch adopts ABS/Geoscience Australia projections for each SA2 area, released in 2024 with 2022 as the base year. For areas not covered by this data or years post-2032, Queensland State Government's SA2 area projections are adopted, released in 2023 and based on 2021 data. These state projections do not provide age category splits; hence proportional growth weightings are applied in line with the ABS Greater Capital Region projections for each age cohort, released in 2023 based on 2022 data. Future population trends suggest a increase just below the median of statistical areas across the nation, with Algester expected to increase by 1,338 persons to 2041 based on the latest annual ERP population numbers, reflecting an overall increase of 12.6% over the 17 years.
Frequently Asked Questions - Population
Development
Recent residential development output has been above average within Algester when compared nationally
Algester has received approximately 48 dwelling approvals annually over the past five financial years, totalling 241 homes. As of FY-26, 9 approvals have been recorded. On average, each home built between FY-21 and FY-25 accommodates around 3.8 new residents per year. This has led to a significant demand exceeding supply, typically resulting in price growth and increased buyer competition.
The average construction cost of new homes is $317,000. In the current financial year, Algester has seen $3.3 million in commercial approvals, indicating its primarily residential nature. Compared to Greater Brisbane, Algester has roughly half the rate of new dwelling approvals per person and ranks in the 49th percentile nationally, offering limited choices for buyers and supporting demand for existing properties.
Recent construction consists of 71.0% detached dwellings and 29.0% townhouses or apartments, maintaining Algester's traditional suburban character focused on family homes. With approximately 333 people per approval, Algester reflects a market transition. According to the latest AreaSearch quarterly estimate, Algester is projected to grow by 1,263 residents by 2041. At current development rates, new housing supply should comfortably meet demand, providing favourable conditions for buyers and potentially supporting growth beyond current population projections.
Frequently Asked Questions - Development
Infrastructure
Algester has very high levels of nearby infrastructure activity, ranking in the top 20% nationally
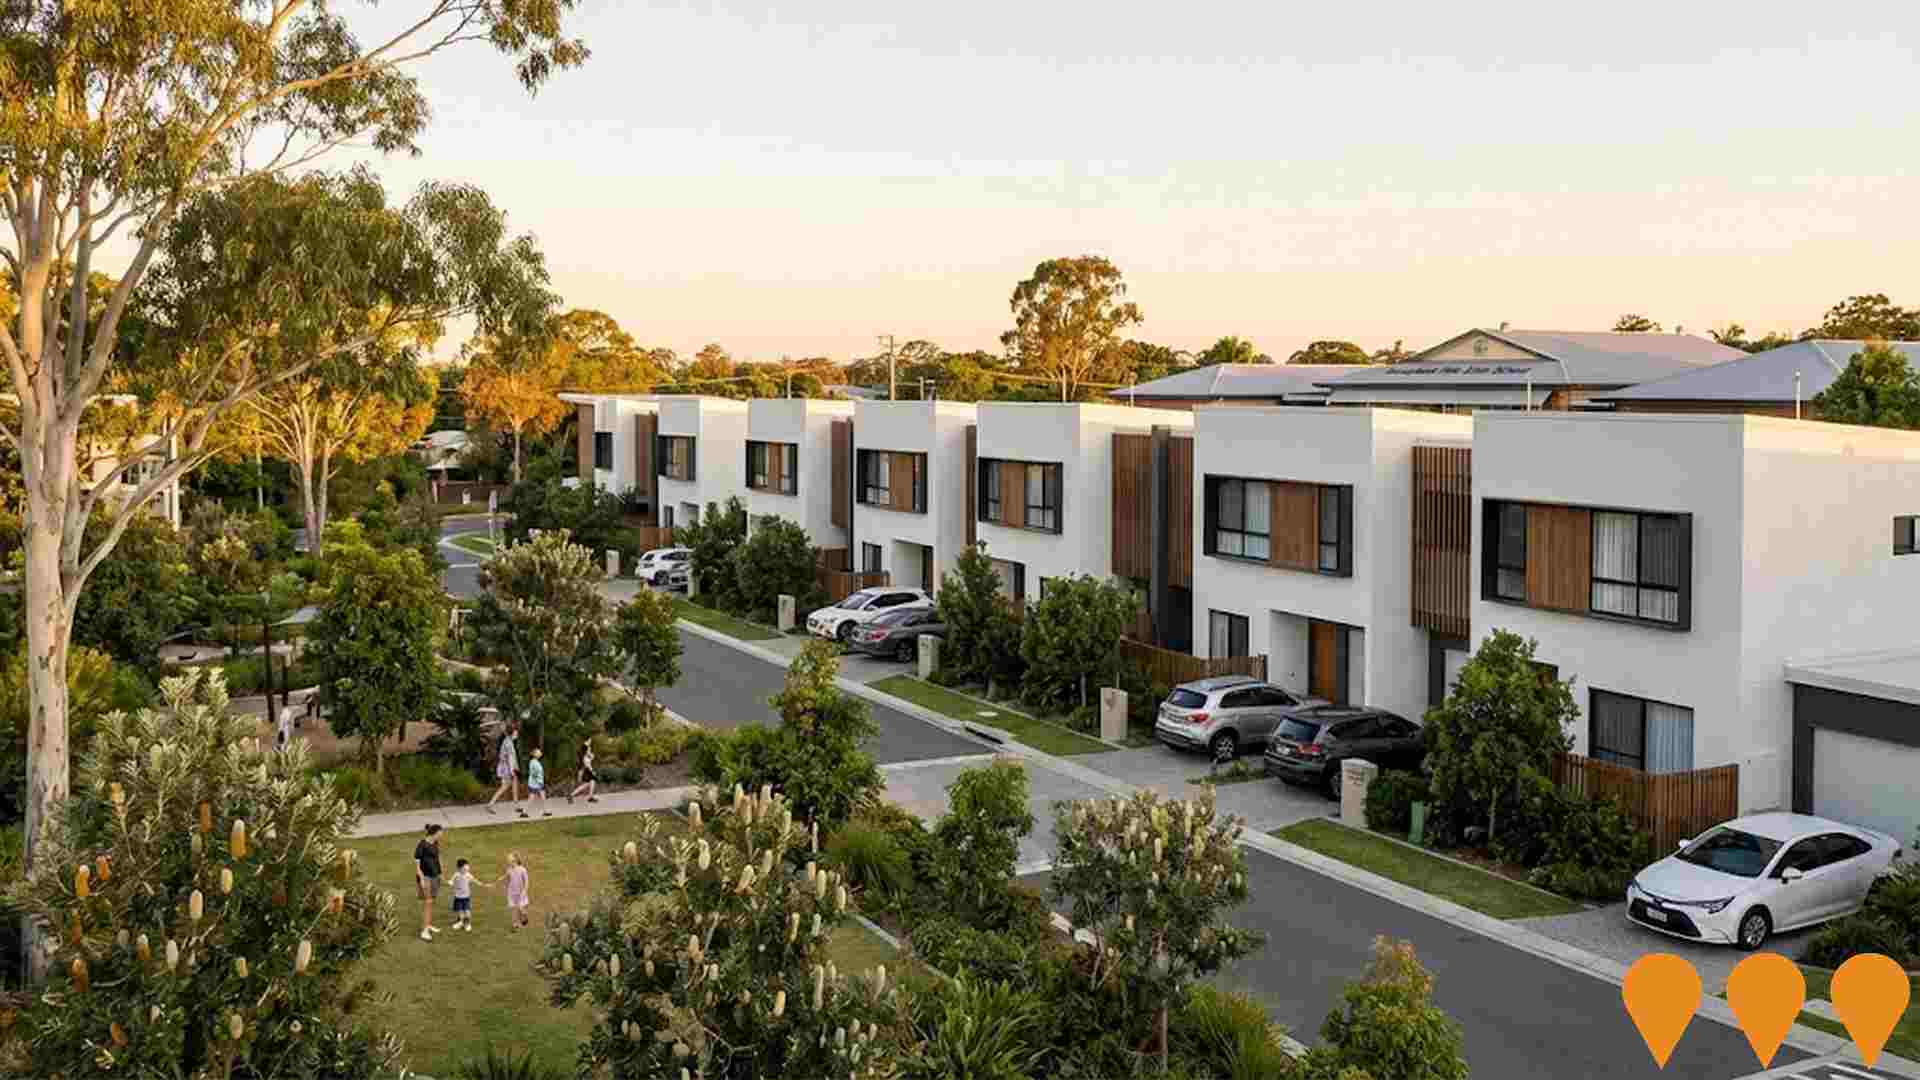
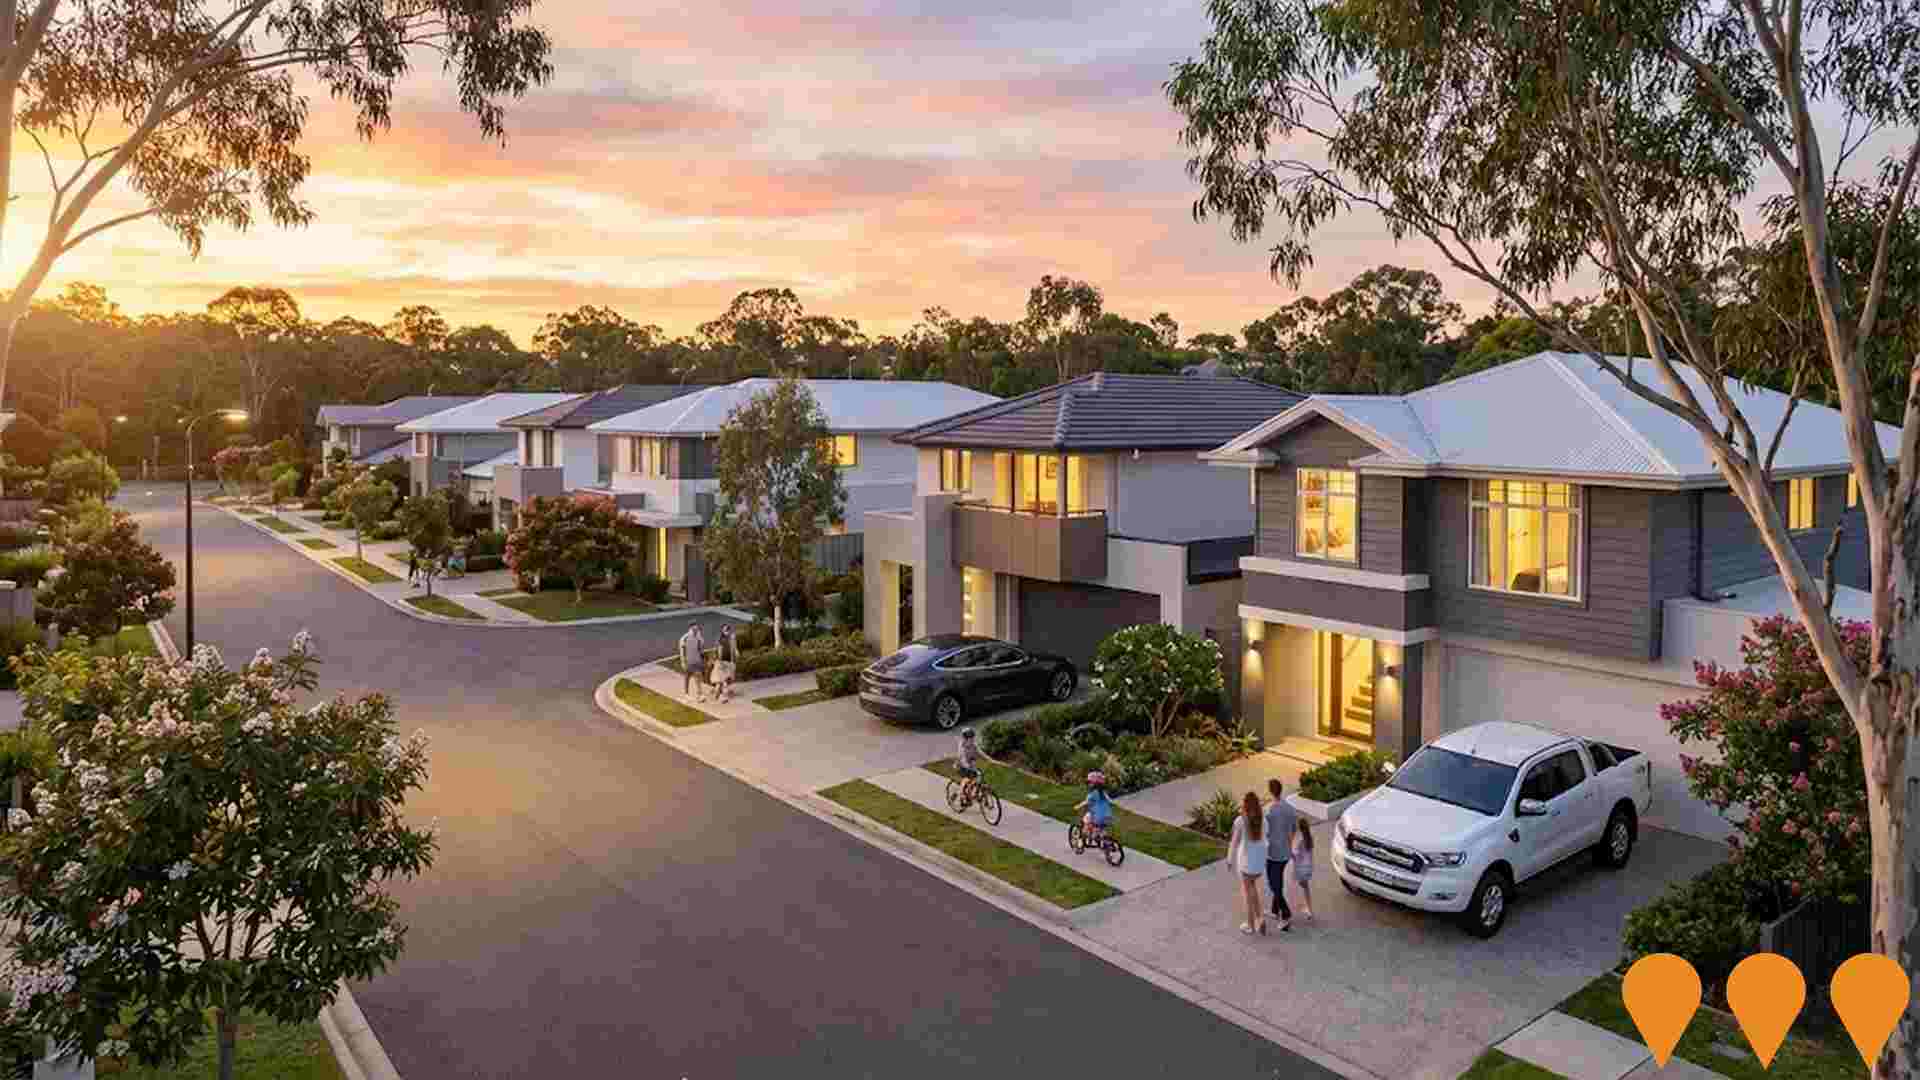
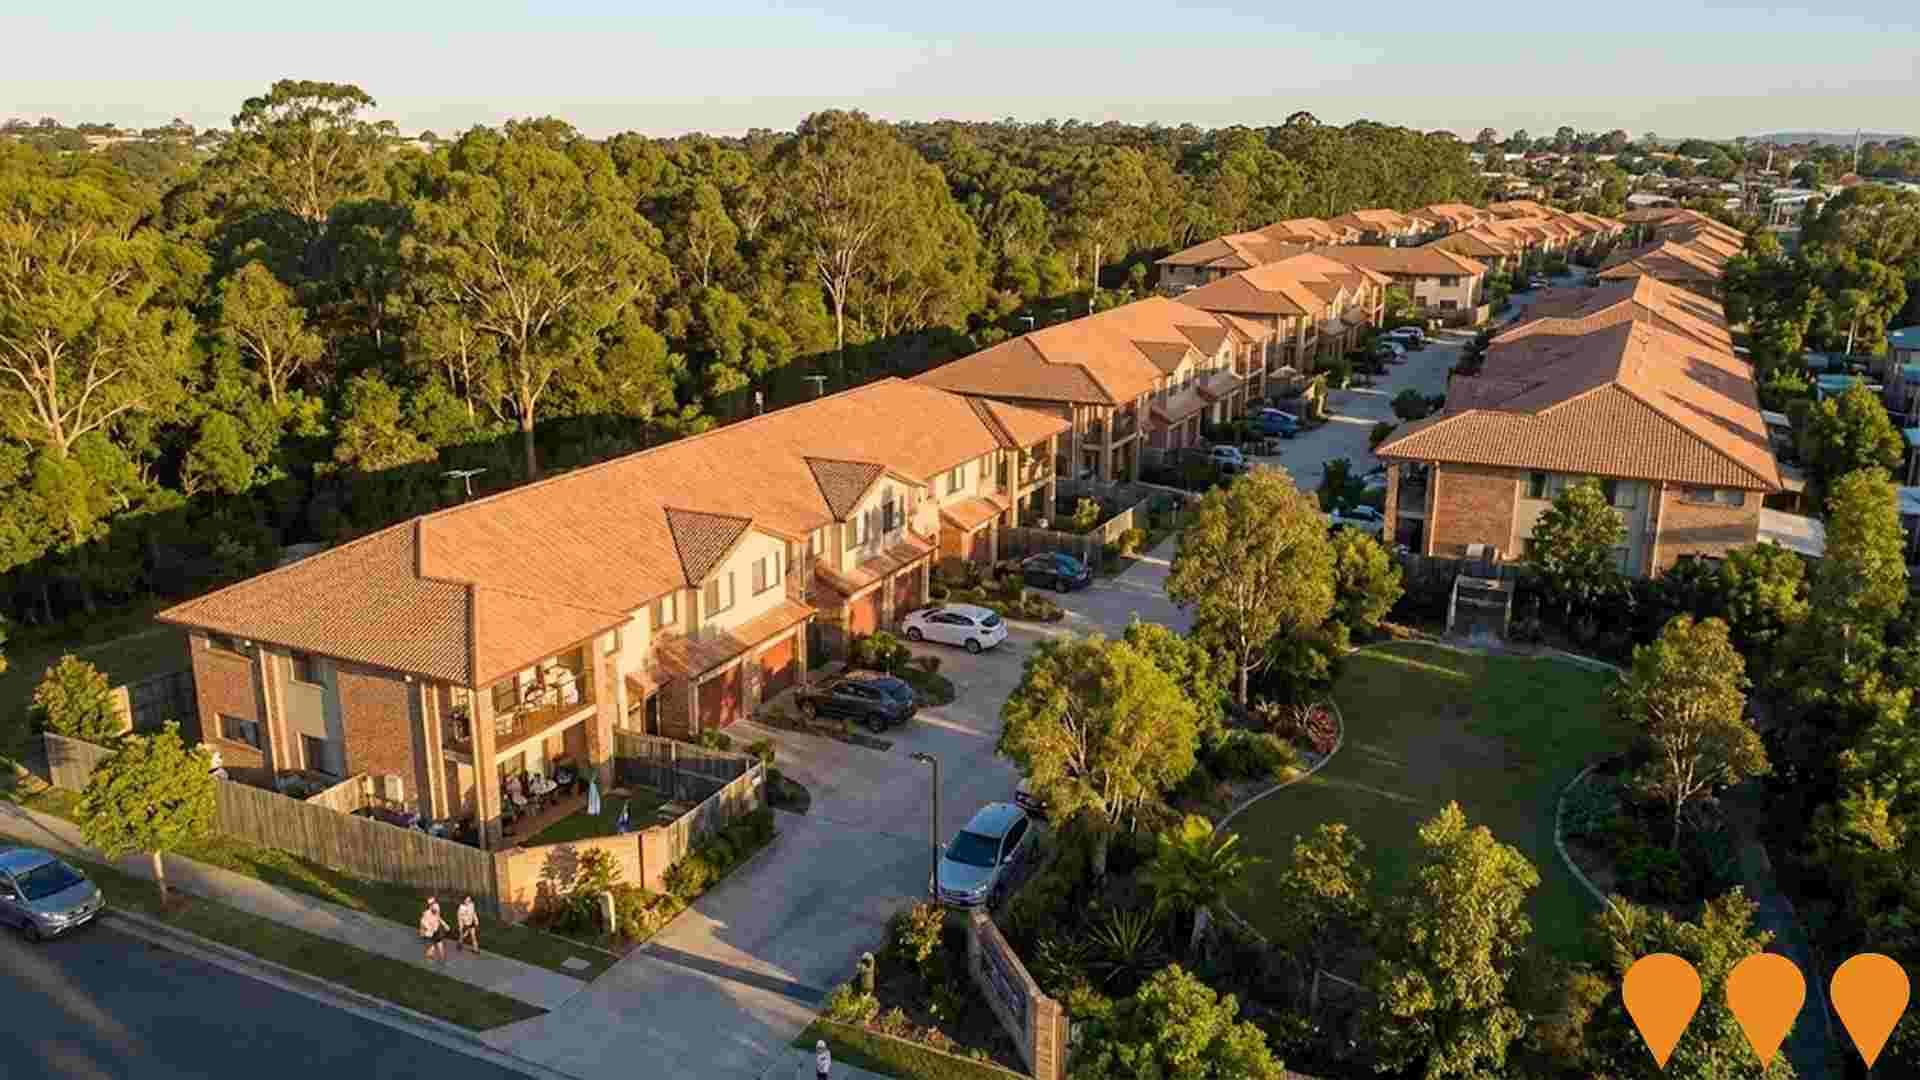
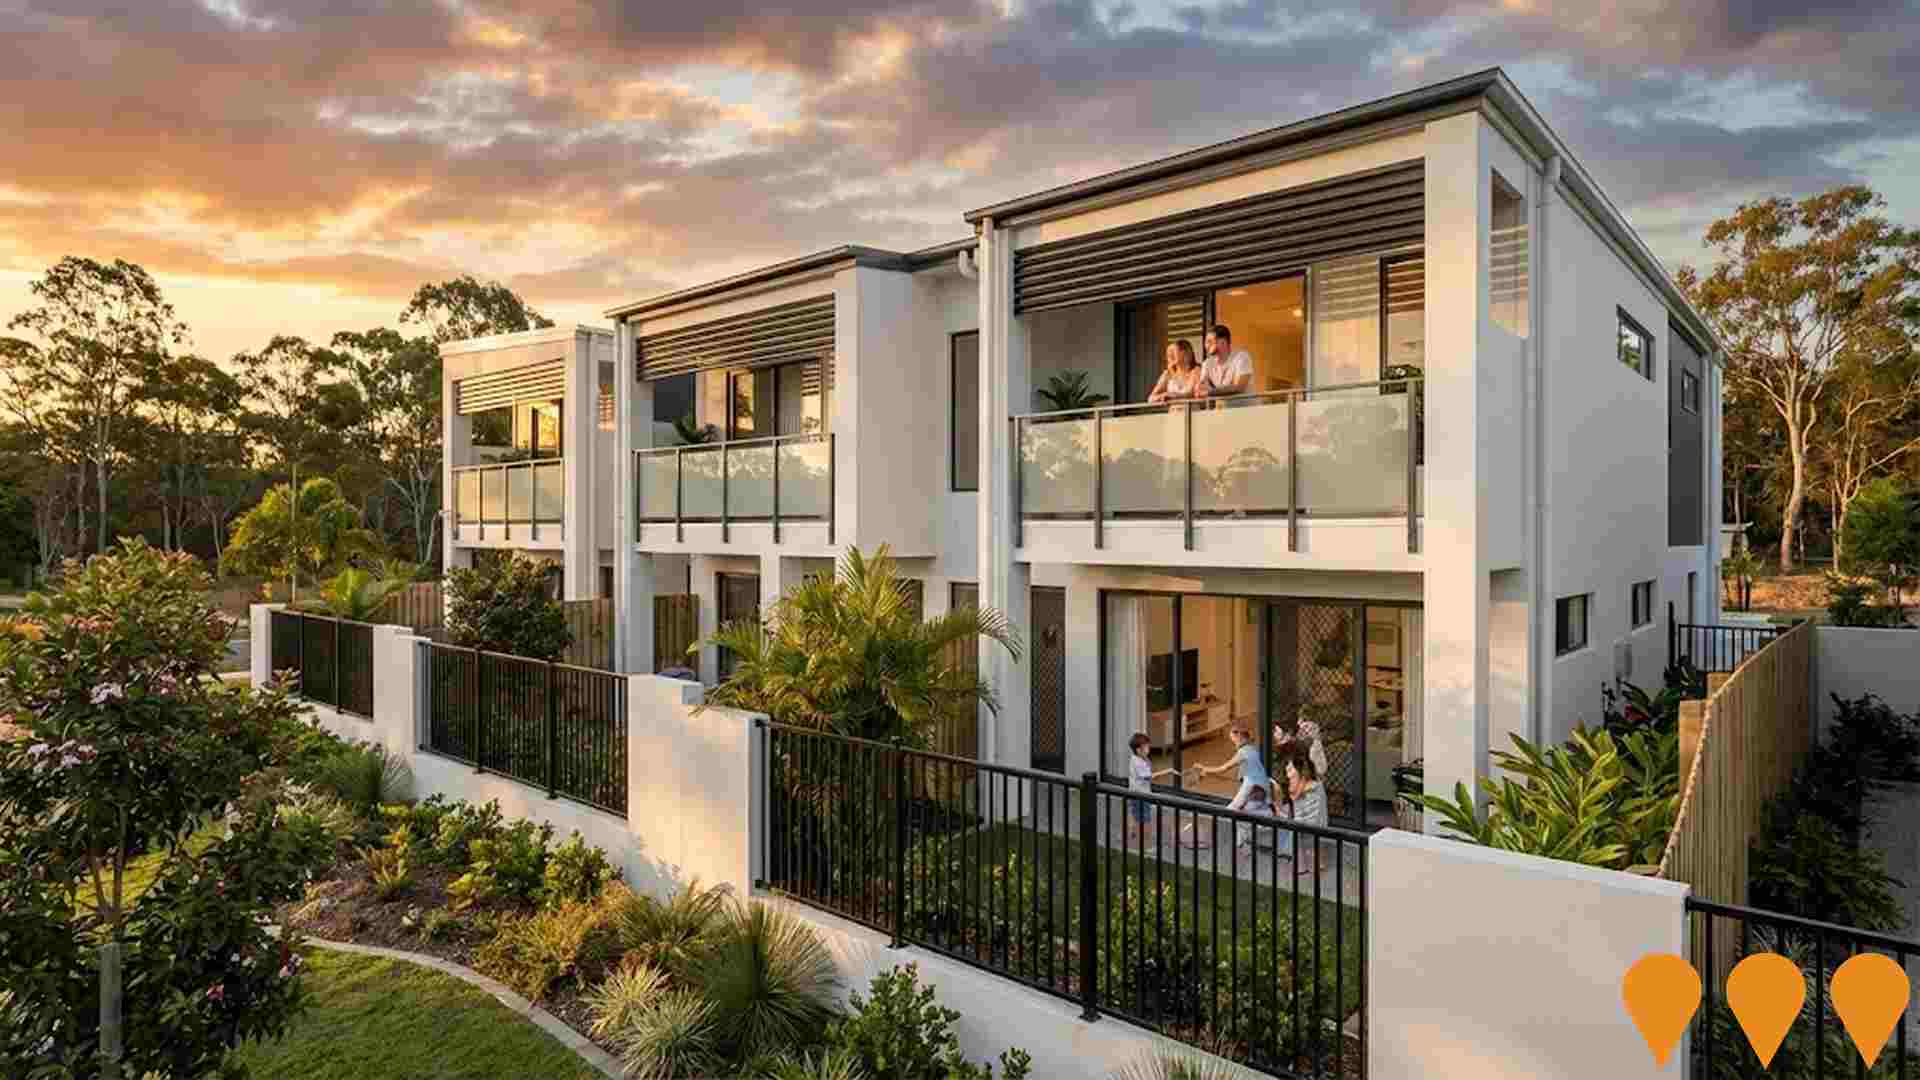
Infrastructure changes significantly influence an area's performance. AreaSearch has identified 15 projects likely impacting the area. Notable ones include Rhythm Court Calamvale, 61 Doulton Street Apartment Development, Parc Calamvale House and Land Development, and 54 Benhiam Street Townhouse Development. The following list details those most relevant.
Professional plan users can use the search below to filter and access additional projects.
INFRASTRUCTURE SEARCH
 Denotes AI-based impression for illustrative purposes only, not to be taken as definitive under any circumstances. Please follow links and conduct other investigations from the project's source for actual imagery. Developers and project owners wishing us to use original imagery please Contact Us and we will do so.
Frequently Asked Questions - Infrastructure
Logan Plan
The Logan Plan is Logan City Council's new city-wide planning scheme replacing the existing 2015 scheme. It will guide future growth, housing diversity, employment, and infrastructure across the entire City of Logan to 2046. The draft Logan Plan completed State Interest Review in June 2025 and underwent public consultation from 1 September to 31 October 2025. Council is now reviewing submissions with adoption and commencement targeted for mid-2026.
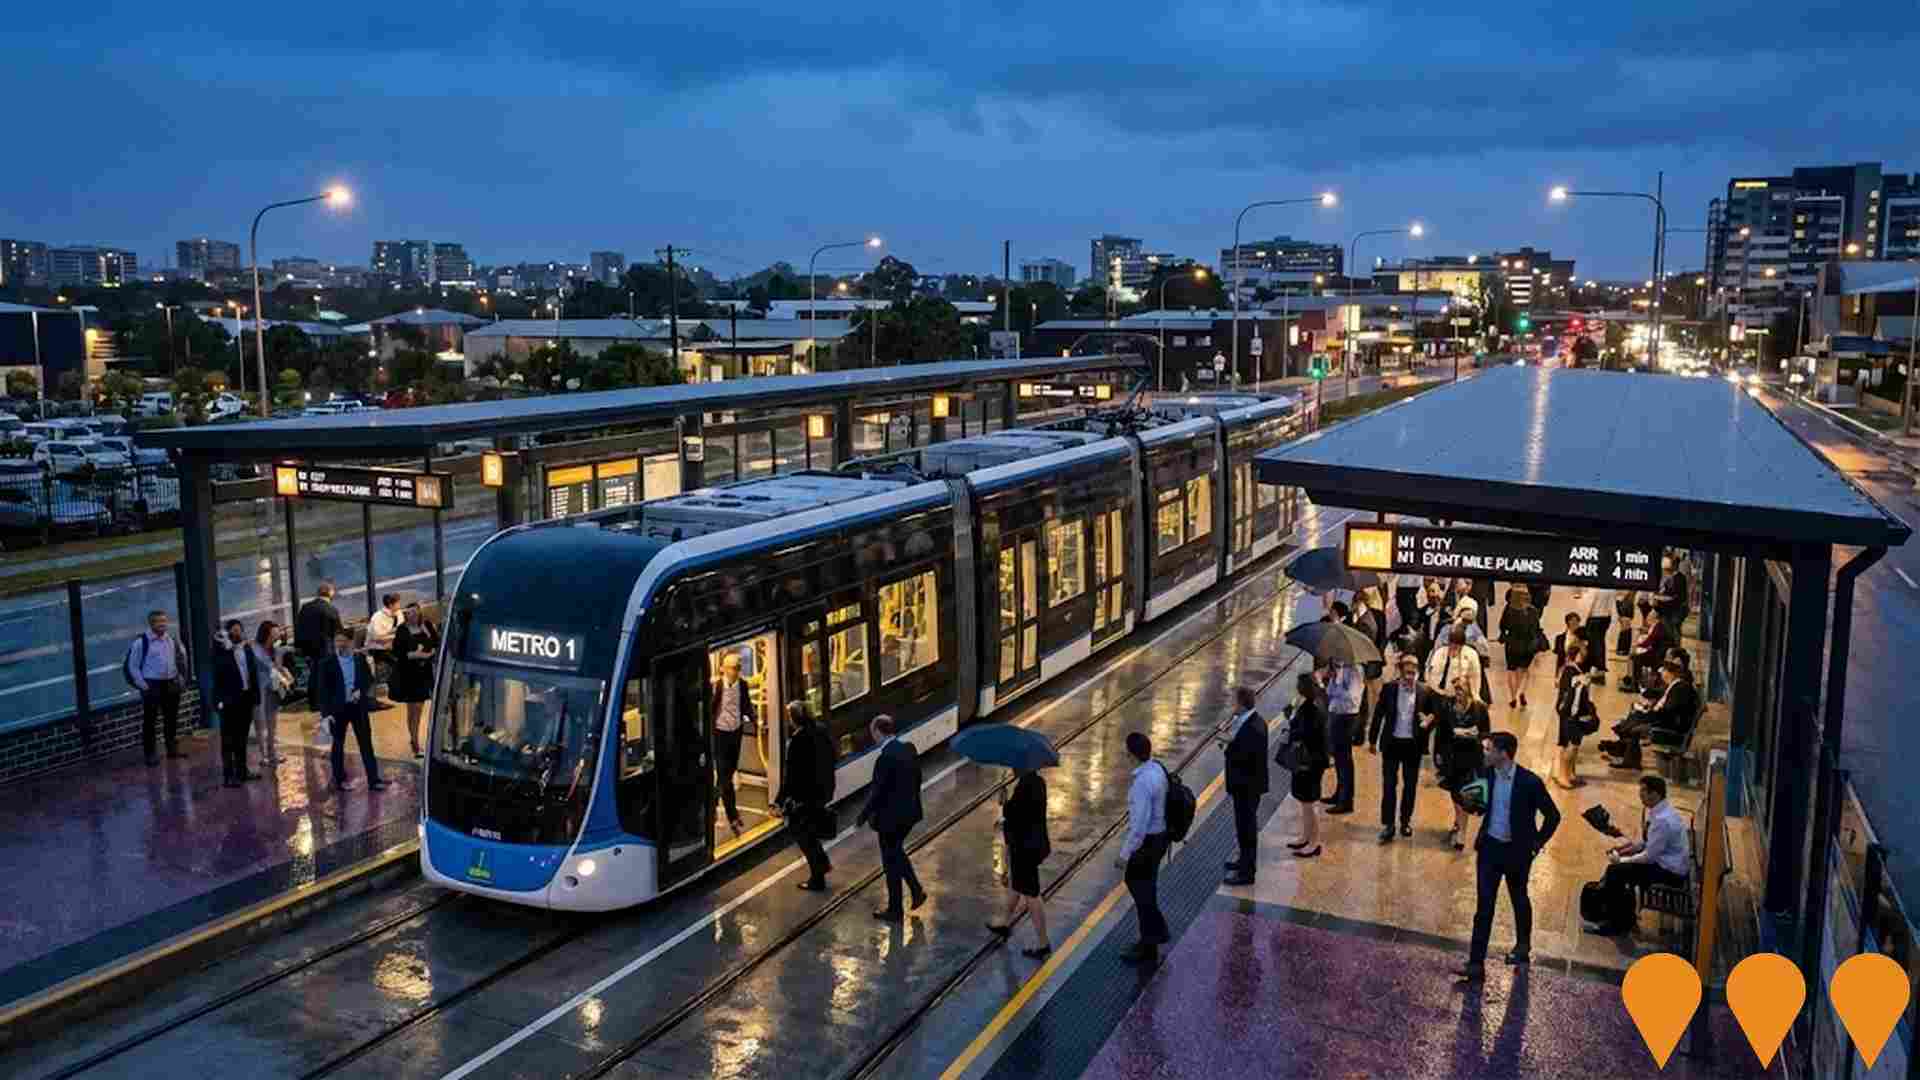
Brisbane Metro Project - M1 Route
The Brisbane Metro M1 route is a high-frequency bus rapid transit service along a 21km existing busway corridor, connecting Eight Mile Plains to Roma Street via 11 stations. It is part of the larger Brisbane Metro project, which features a new Adelaide Street tunnel, upgraded stations, and a fleet of 60 electric bi-articulated metro vehicles with a 150-passenger capacity. The M1 service operates 24 hours on weekends and every 5 minutes during peak weekdays. The M1 service launched in June 2025, and major construction is now complete.
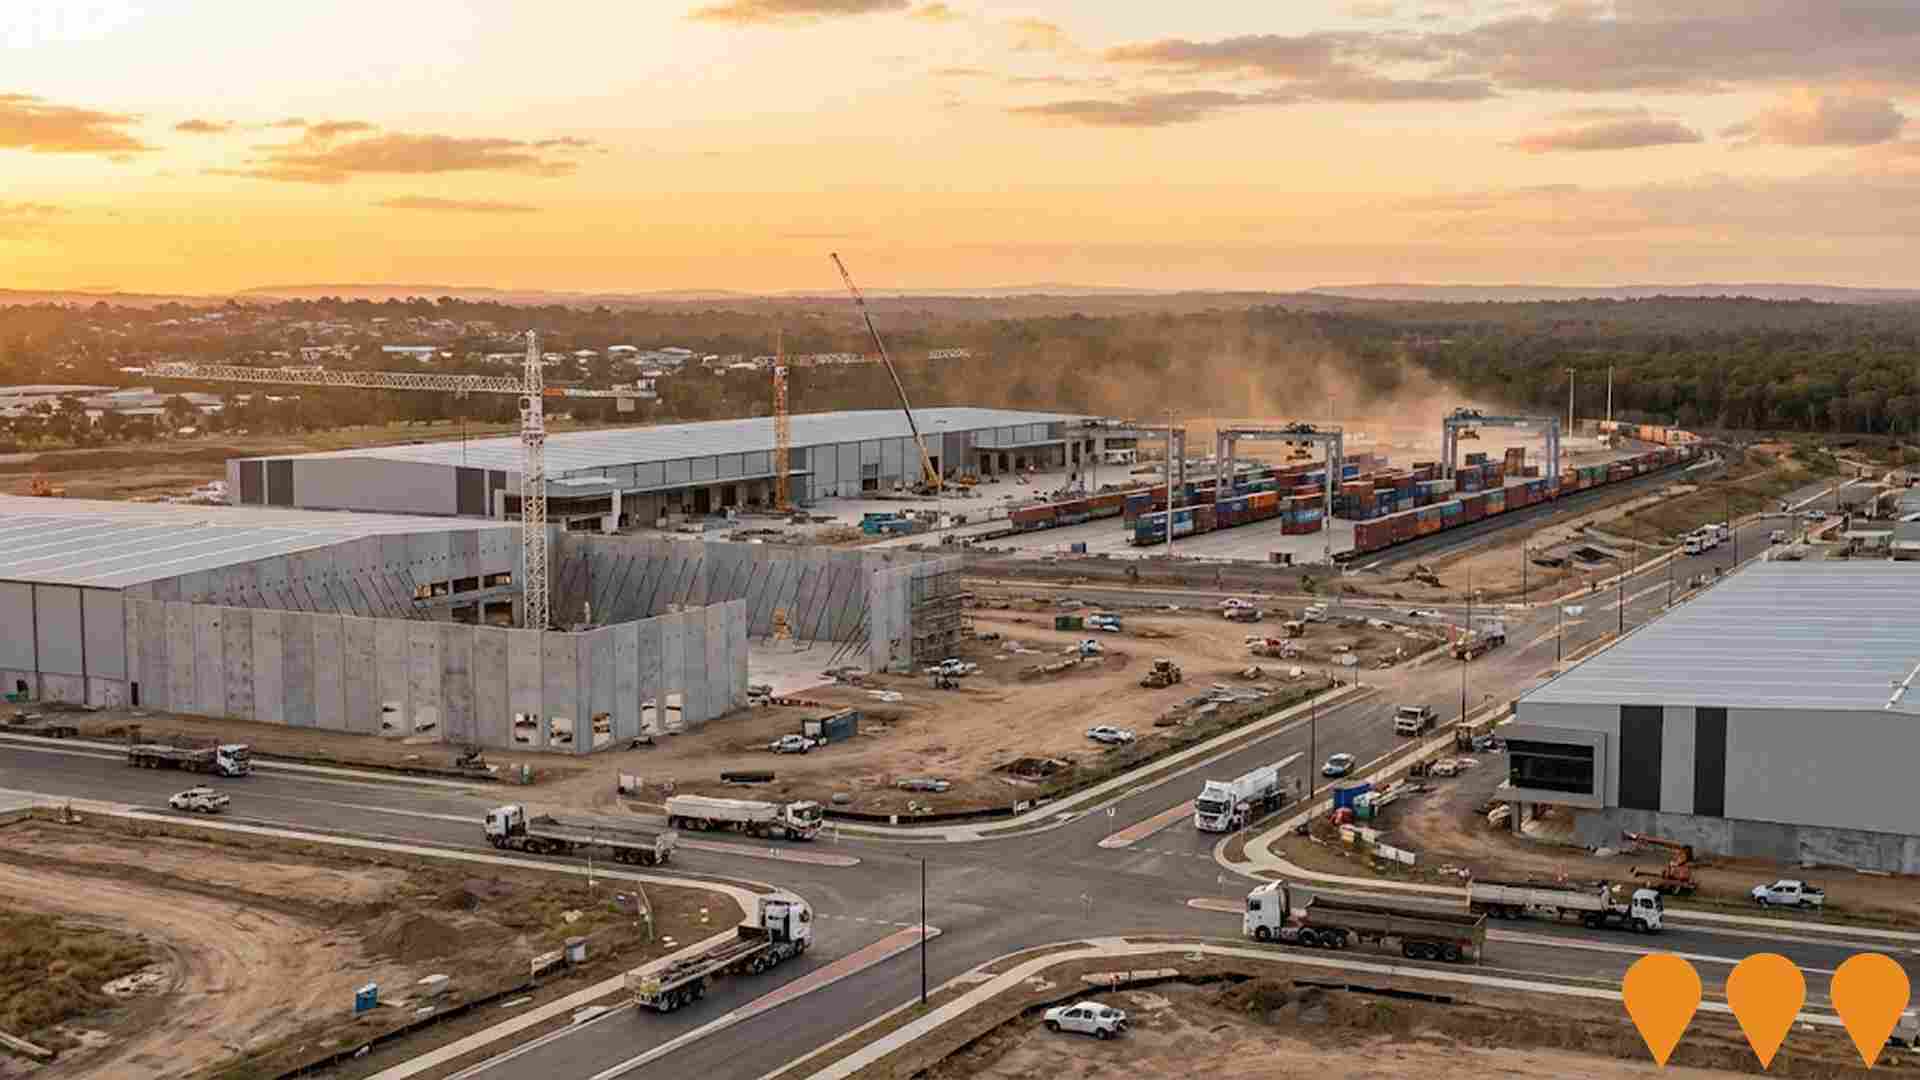
Oxley Wedge Industrial Precinct
Large-scale industrial precinct development within the Oxley Wedge area, delivering new warehousing and freight facilities adjacent to the Acacia Ridge intermodal terminal, with development now underway by primary developers.
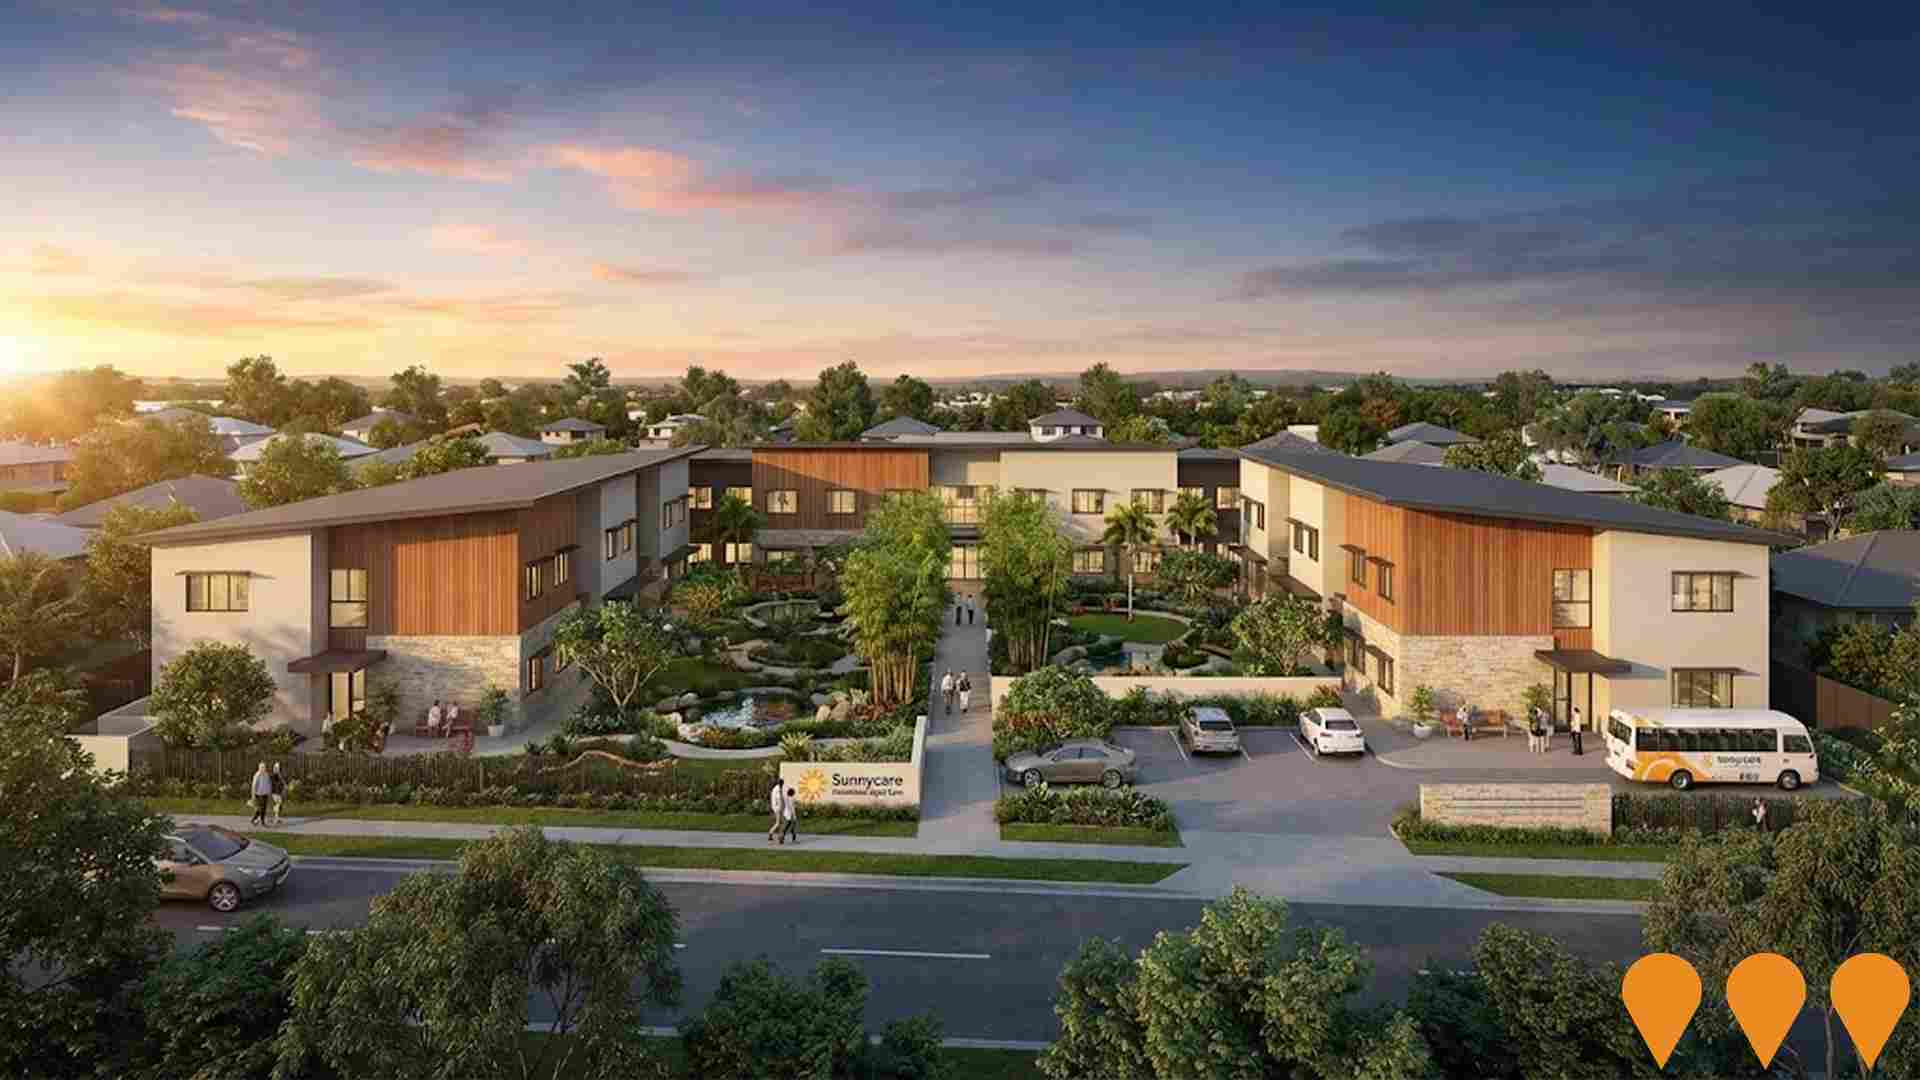
Sunnycare Residential Aged Care Facility
70-bed residential aged care facility providing 24/7 high-care nursing, private rooms with ensuites, communal areas, and designed with traditional Chinese quadrangle courtyards.
Browns Plains to South East Busway Connectivity
Corridor program to improve public transport travel between Browns Plains and the South East Busway, focusing on bus priority, station and interchange upgrades, and safer walking and cycling links. A key dependency-the South East Busway extension from Eight Mile Plains to Springwood including the new Rochedale station and park n ride-opened to passengers on 12 May 2025. Further corridor works to lift bus priority and reliability between Browns Plains and Springwood remain in planning and subject to funding and staged delivery.
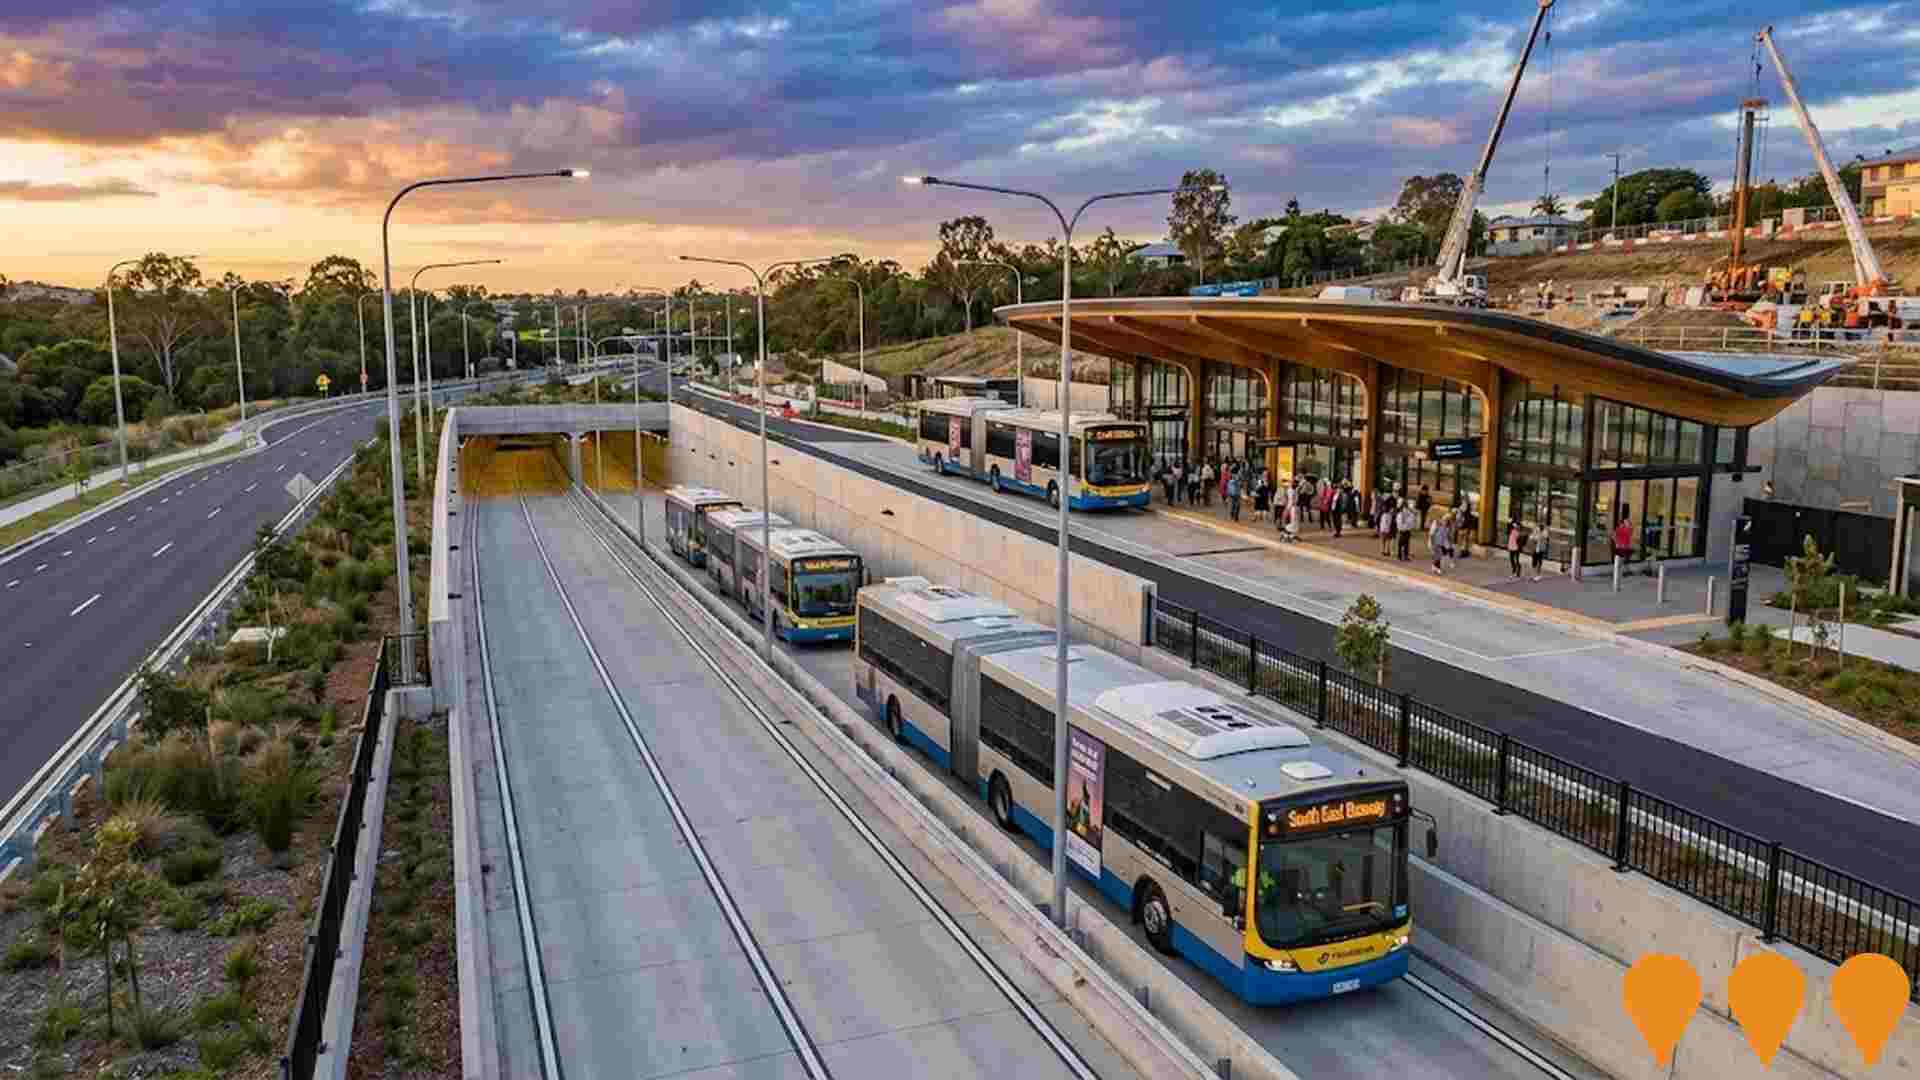
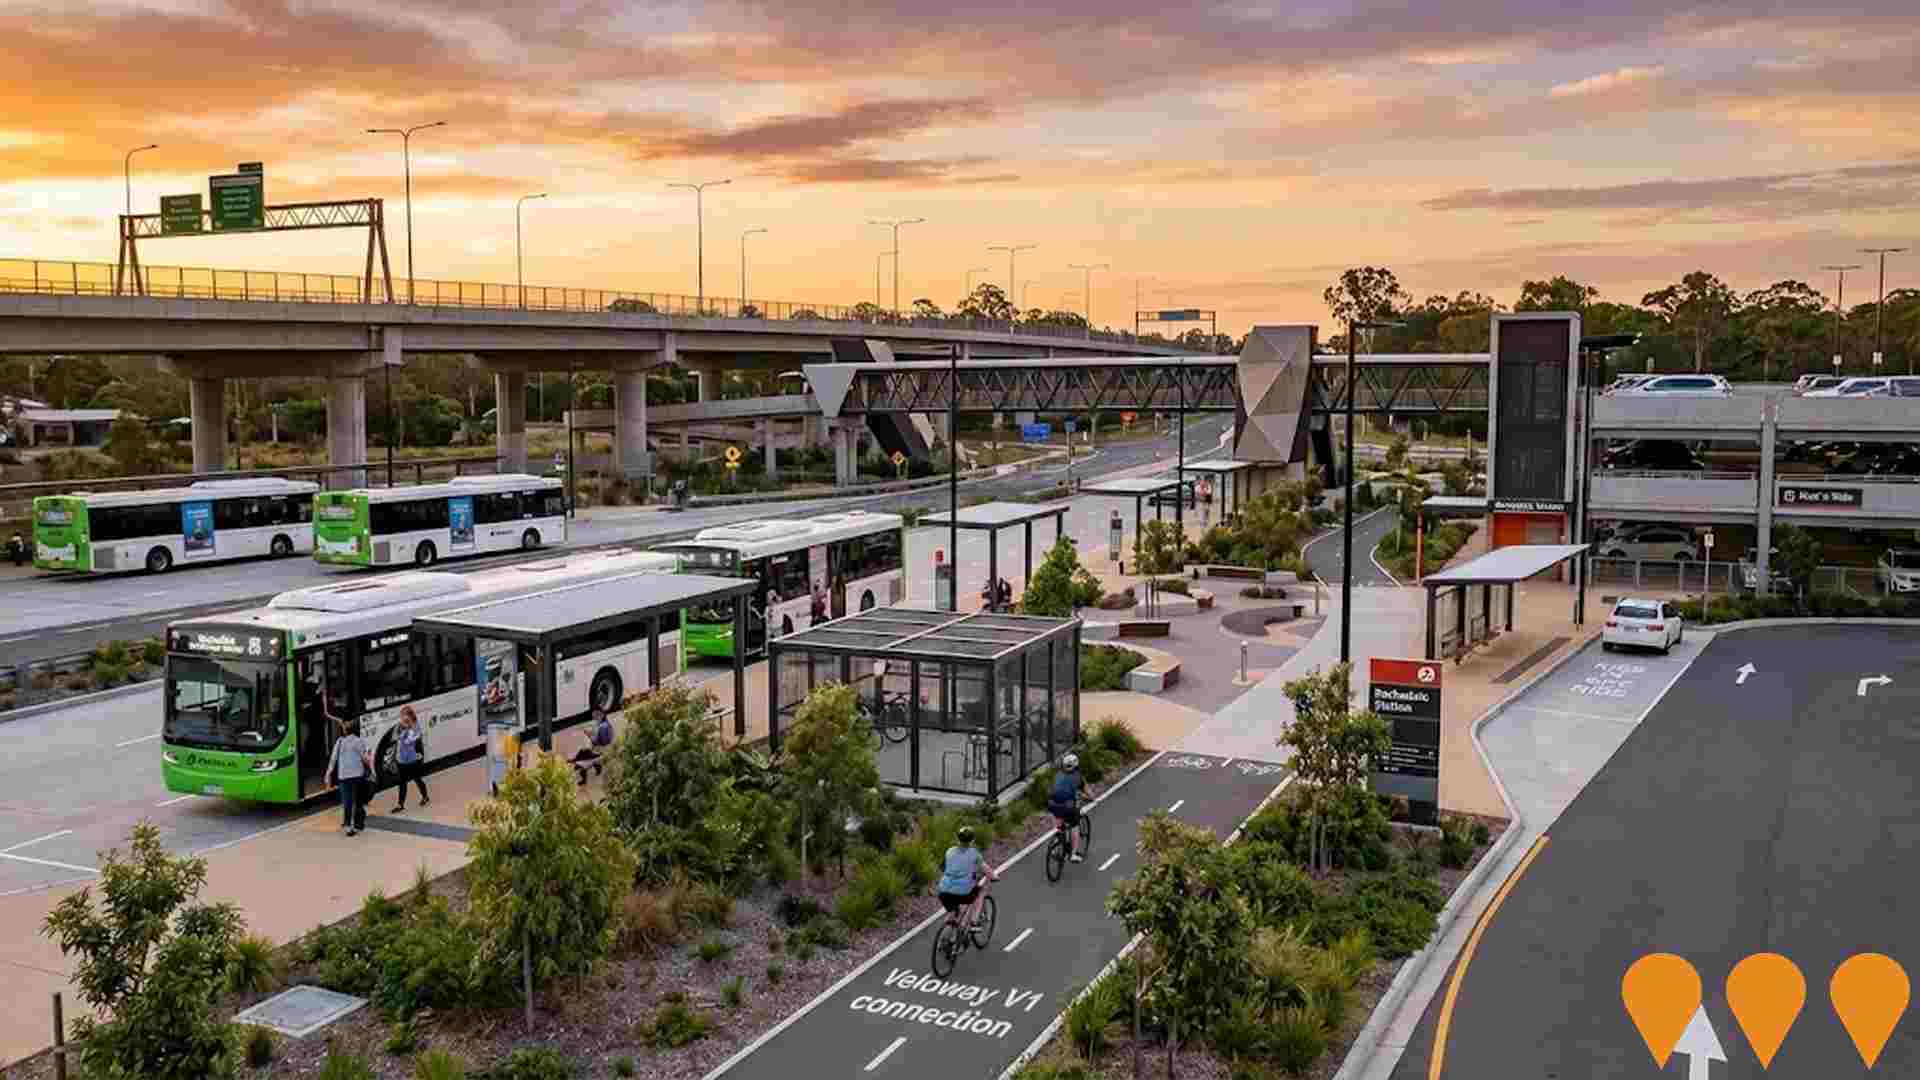
Rochedale Bus Station and Park 'n' Ride
New bus station opened May 2025 as part of South East Busway extension from Eight Mile Plains to Springwood. Features park 'n' ride facilities with capacity for 485 vehicles (including 9 accessible spaces), positioned between Eight Mile Plains and Springwood stations. Includes kiss 'n' ride bays, pedestrian bridge and entry plaza, undercover storage for 30 bicycles, platform facilities, bus interchange, and pedestrian/cyclist access with connection to Veloway V1. Buses operate every 5 minutes during peak periods.
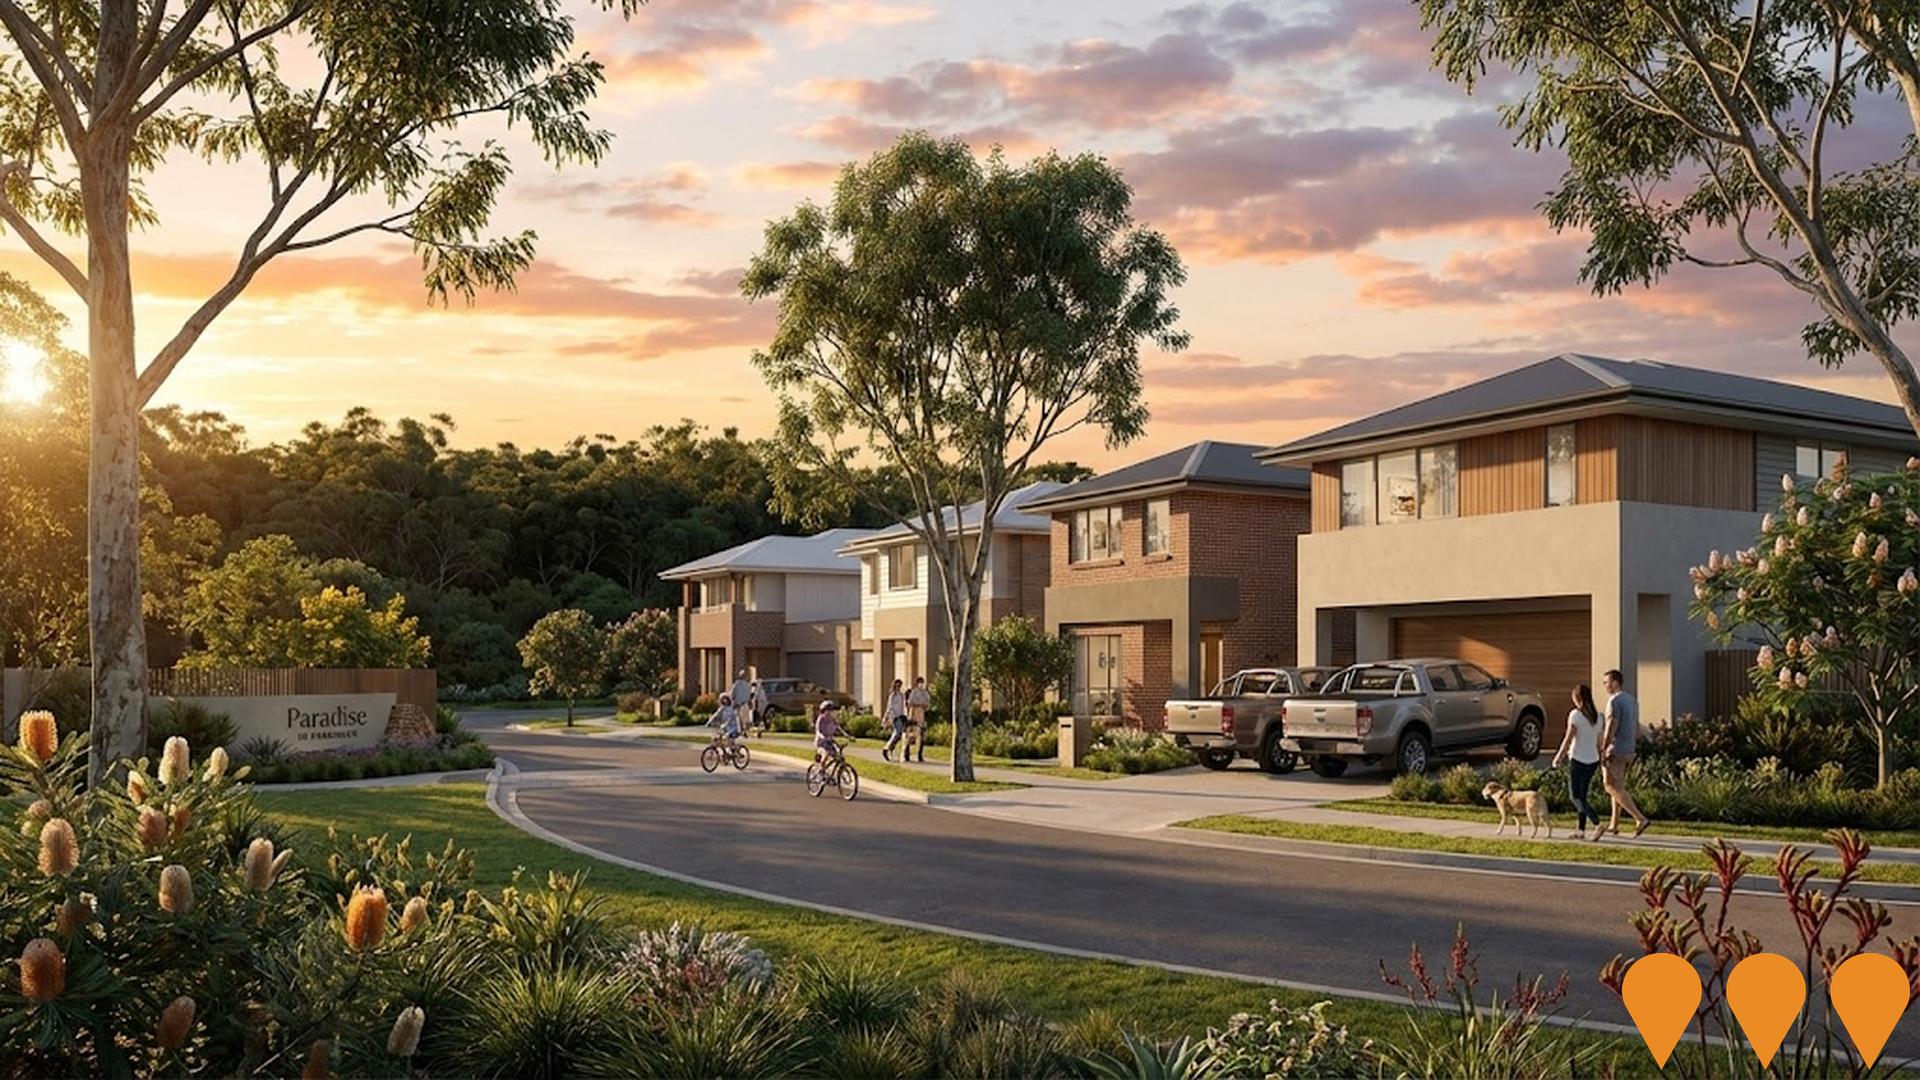
Paradise in Parkinson
Paradise in Parkinson is a residential land estate offering 118 residential lots across multiple stages (1, 2, 3, and 1B). The development features flat sites ranging from 400 square meters to 752 square meters, designed for house and land packages. Located in the exclusive Stretton College catchment, the estate emphasizes natural beauty, sustainability, and connectivity through leafy reserves and green corridors. The development offers easy access to urban amenities including schools, shopping centers, and public transport, positioned approximately 25 minutes from Brisbane CBD.
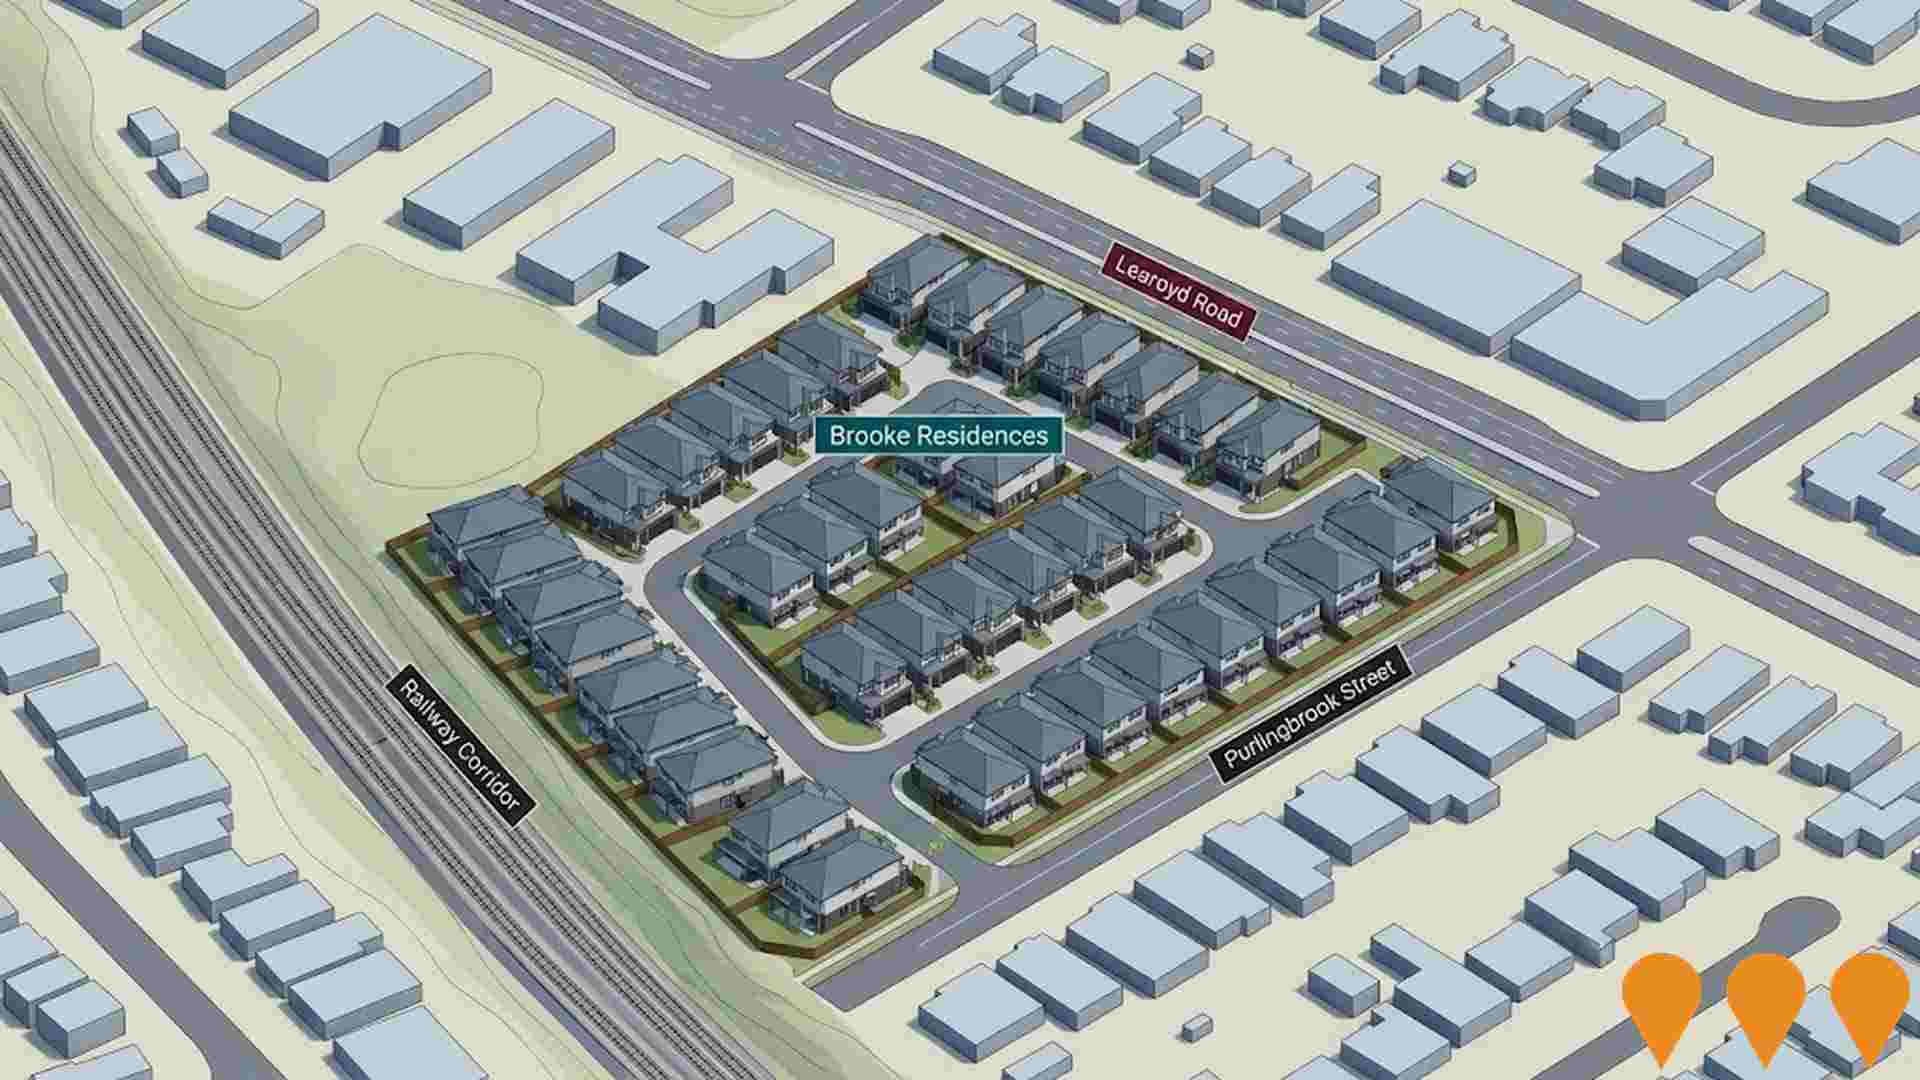
Brooke Residences - Algester
Rebranded and delivered as Brooke Residences, this project comprises 45 four bedroom townhouses with large private courtyards and double garages. The scheme originated across 82, 88 and 94 Learoyd Road and is now addressed from 20 Purlingbrook Street. Brisbane City Council granted development approval and the community has since been completed and occupied. Developed by Visie Properties, with sales handled by GAP Development Sales.
Employment
AreaSearch analysis reveals Algester recording weaker employment conditions than most comparable areas nationwide
Algester has an educated workforce with significant representation in essential services sectors. Its unemployment rate was 6.1% as of September 2025, showing relative employment stability over the past year compared to Greater Brisbane's 4.0%.
A total of 4,882 residents were employed by September 2025, with an unemployment rate 2.1% higher than Greater Brisbane's and workforce participation similar at 64.5%. Employment is concentrated in health care & social assistance, retail trade, and construction. Algester has a strong specialization in transport, postal & warehousing, with employment share 1.3 times the regional level. Conversely, professional & technical services have lower representation at 7.0% compared to the regional average of 8.9%.
The area's predominantly residential nature suggests limited local employment opportunities, as indicated by Census data on working population versus resident population. Between September 2024 and September 2025, Algester's labour force increased by 0.8%, while employment remained stable at 0%, leading to a rise in unemployment of 0.7 percentage points. In contrast, Greater Brisbane saw employment growth of 3.8% and labour force growth of 3.3%, with unemployment falling by 0.5 percentage points. Statewide, Queensland's employment contracted by 0.01% between November 2024 and November 2025, losing 1,210 jobs, while the state unemployment rate stood at 4.2%, closely aligned with the national rate of 4.3%. National employment forecasts from May-25 project overall growth of 6.6% over five years and 13.7% over ten years. Applying these projections to Algester's employment mix suggests local employment should increase by 6.5% over five years and 13.5% over ten years, though these are simple extrapolations for illustrative purposes only and do not account for localized population projections.
Frequently Asked Questions - Employment
Income
The area's income profile falls below national averages based on AreaSearch analysis
Algester SA2 had a median taxpayer income of $51,935 and an average of $60,081 in financial year 2022. This was lower than the national average, with Greater Brisbane having a median income of $55,645 and an average income of $70,520. By September 2025, estimated incomes would be approximately $59,201 (median) and $68,486 (average), based on Wage Price Index growth of 13.99% since financial year 2022. Census data shows Algester's household, family, and personal incomes rank between the 39th and 48th percentiles. The income band of $1,500 - 2,999 captures 38.5% of Algester residents (3,869 individuals), similar to regional levels at 33.3%. Income remaining after housing costs is ranked at the 47th percentile, with only 83.1% left. Algester's SEIFA income ranking places it in the 5th decile.
Frequently Asked Questions - Income
Housing
Algester is characterized by a predominantly suburban housing profile, with above-average rates of outright home ownership
Algester's dwelling structures, as per the latest Census, comprised 81.0% houses and 18.9% other dwellings (semi-detached, apartments, 'other' dwellings). Brisbane metro had 82.0% houses and 18.1% other dwellings. Home ownership in Algester was at 27.5%, with mortgaged dwellings at 41.9% and rented ones at 30.7%. The median monthly mortgage repayment was $1,750, lower than Brisbane metro's $1,872. The median weekly rent figure in Algester was $395, compared to Brisbane metro's $400. Nationally, Algester's mortgage repayments were below the Australian average of $1,863, while rents exceeded the national figure of $375.
Frequently Asked Questions - Housing
Household Composition
Algester features high concentrations of family households and group households, with a lower-than-average median household size
Family households account for 78.1% of all households, including 37.5% couples with children, 25.0% couples without children, and 14.1% single parent families. Non-family households constitute the remaining 21.9%, with lone person households at 18.2% and group households comprising 3.9%. The median household size is 2.8 people, which is smaller than the Greater Brisbane average of 3.0.
Frequently Asked Questions - Households
Local Schools & Education
The educational profile of Algester exceeds national averages, with above-average qualification levels and academic performance metrics
The area's university qualification rate is 28.8%, significantly lower than the SA4 region average of 42.1%. Bachelor degrees are most prevalent at 19.2%, followed by postgraduate qualifications (7.3%) and graduate diplomas (2.3%). Vocational credentials are common, with 34.2% of residents aged 15+ holding them, including advanced diplomas (11.9%) and certificates (22.3%). Educational participation is high at 30.5%, with 11.5% in primary education, 7.3% in secondary education, and 4.6% pursuing tertiary education.
Educational participation is notably high, with 30.5% of residents currently enrolled in formal education. This includes 11.5% in primary education, 7.3% in secondary education, and 4.6% pursuing tertiary education.
Frequently Asked Questions - Education
Schools Detail
Nearby Services & Amenities
Transport
Transport servicing is moderate compared to other areas nationally based on assessment of service frequency, route connectivity and accessibility
Algester has 31 active public transport stops operating within its boundaries. These stops are served by a mix of buses along eight different routes. Together, these routes facilitate 1,001 weekly passenger trips.
The accessibility of transport in Algester is rated as good, with residents typically residing 239 meters from the nearest stop. On average, service frequency stands at 143 trips per day across all routes, resulting in approximately 32 weekly trips per individual stop.
Frequently Asked Questions - Transport
Transport Stops Detail
Health
Algester's residents are healthier than average in comparison to broader Australia with prevalence of common health conditions quite low among the general population though higher than the nation's average across older, at risk cohorts
Algester residents show relatively positive health outcomes, with low prevalence of common conditions among the general population but higher rates in older cohorts at risk compared to national averages. Approximately half (49.7%) of Algester's total population (~4,974 people) has private health cover, lower than the national average of 55.3%.
The most prevalent medical conditions are asthma (7.0% of residents) and arthritis (6.7%), while 72.9% report no medical ailments, compared to Greater Brisbane's 77.2%. Algester has a higher proportion of seniors aged 65 and over at 14.7% (1,473 people), compared to Greater Brisbane's 12.1%, requiring more health attention for this demographic.
Frequently Asked Questions - Health
Cultural Diversity
Algester is among the most culturally diverse areas in the country based on AreaSearch assessment of a range of language and cultural background related metrics
Algester has high cultural diversity with 37.9% speaking a language other than English at home and 42.8% born overseas. Christianity is the main religion, comprising 45.0%. The 'Other' category is slightly overrepresented at 3.1%, compared to Greater Brisbane's 3.8%.
Top ancestry groups are English (19.4%), Australian (17.6%), and Other (14.4%). Samoan is notably higher at 1.6% than the regional average of 1.3%. Korean is marginally lower at 1.7%, compared to the region's 1.9%. Maori representation is slightly higher at 1.7%, compared to the regional average of 1.4%.
Frequently Asked Questions - Diversity
Age
Algester's population is slightly younger than the national pattern
Algester's median age was 36 years in 2021, equal to Greater Brisbane's but younger than Australia's national average of 38 years. The age group of 5-14 years had a strong representation at 15.5%, compared to Greater Brisbane. The 55-64 age cohort was less prevalent at 8.7%. Between 2021 and the present, the 15-24 age group grew from 10.7% to 12.6% of Algester's population. Conversely, the 65-74 age group declined from 9.5% to 7.5%, and the 35-44 age group dropped from 17.2% to 16.1%. By 2041, forecasts indicate significant demographic changes for Algester. The 45-54 age cohort is projected to increase by 366 people (32%), from 1,138 to 1,505. Conversely, population declines are projected for the 0-4 and 35-44 age cohorts.
