Chart Color Schemes
This analysis uses ABS Statistical Areas Level 2 (SA2) boundaries, which can materially differ from Suburbs and Localities (SAL) even when sharing similar names.
SA2 boundaries are defined by the Australian Bureau of Statistics and are designed to represent communities for statistical reporting (e.g., census and ERP).
Suburbs and Localities (SAL) represent commonly-used suburb/locality names (postal-style areas) and may use different geographic boundaries. For comprehensive analysis, consider reviewing both boundary types if available.
est. as @ -- *
ABS ERP | -- people | --
2021 Census | -- people
Sales Activity
Curious about local property values? Filter the chart to assess the volume and appreciation (including resales) trends and regional comparisons, or scroll to the map below view this information at an individual property level.
Find a Recent Sale
Sales Detail
Population
Population growth drivers in Coopers Plains are strong compared to national averages based on AreaSearch's ranking of recent, and medium to long-term trends
Coopers Plains' population, as of November 2025, is approximately 6,295. This figure represents a growth of 591 people since the 2021 Census, which reported a population of 5,704. The increase is inferred from the estimated resident population of 6,269 in June 2024 and an additional 27 validated new addresses since the Census date. This results in a population density ratio of 1,437 persons per square kilometer, higher than the average seen across national locations assessed by AreaSearch. Coopers Plains' growth rate of 10.4% since the 2021 census exceeds both the national average (8.9%) and that of its SA3 area, making it a growth leader in the region. Overseas migration contributed approximately 79.4% of overall population gains during recent periods.
AreaSearch uses ABS/Geoscience Australia projections for each SA2 area, released in 2024 with a base year of 2022. For areas not covered by this data and years post-2032, Queensland State Government's SA2 area projections are adopted, released in 2023 based on 2021 data. However, these state projections do not provide age category splits, so AreaSearch applies proportional growth weightings in line with the ABS Greater Capital Region projections for each age cohort, released in 2023 based on 2022 data. Future population trends indicate a significant increase in Coopers Plains' top quartile of national statistical areas, with an expected expansion by 2,097 persons to 2041 based on the latest annual ERP population numbers, reflecting a gain of 32.9% over the 17-year period.
Frequently Asked Questions - Population
Development
Residential development activity is slightly higher than average within Coopers Plains when compared nationally
Coopers Plains averaged approximately 43 new dwelling approvals annually over recent years. Between Financial Year 21 and Financial Year 25, a total of 217 homes were approved, with an additional 8 approved in Financial Year 26 to date. On average, each dwelling constructed over these five financial years accommodated about 1.6 new residents per year. However, this figure has increased to 6.6 people per dwelling over the past two financial years, indicating a potential shift in demand and supply dynamics.
The average expected construction cost of new homes in Coopers Plains is around $268,000, aligning with regional trends. This financial year has seen $10.8 million in commercial approvals registered, suggesting balanced commercial development activity. Compared to Greater Brisbane, Coopers Plains has 69.0% more new home approvals per capita, offering buyers a wider range of choices. However, building activity has slowed in recent years, with 84.0% of new dwellings being detached homes and only 16.0% townhouses or apartments, maintaining the area's suburban character dominated by family homes.
As of now, Coopers Plains reflects an approval rate of approximately 218 people per dwelling, suggesting a potential shift in its market dynamics. According to AreaSearch's latest quarterly estimate, Coopers Plains is projected to gain around 2,071 residents by 2041. If current development rates persist, housing supply might not keep pace with population growth, potentially intensifying buyer competition and supporting stronger price growth.
Frequently Asked Questions - Development
Infrastructure
Coopers Plains has very high levels of nearby infrastructure activity, ranking in the top 20% nationally
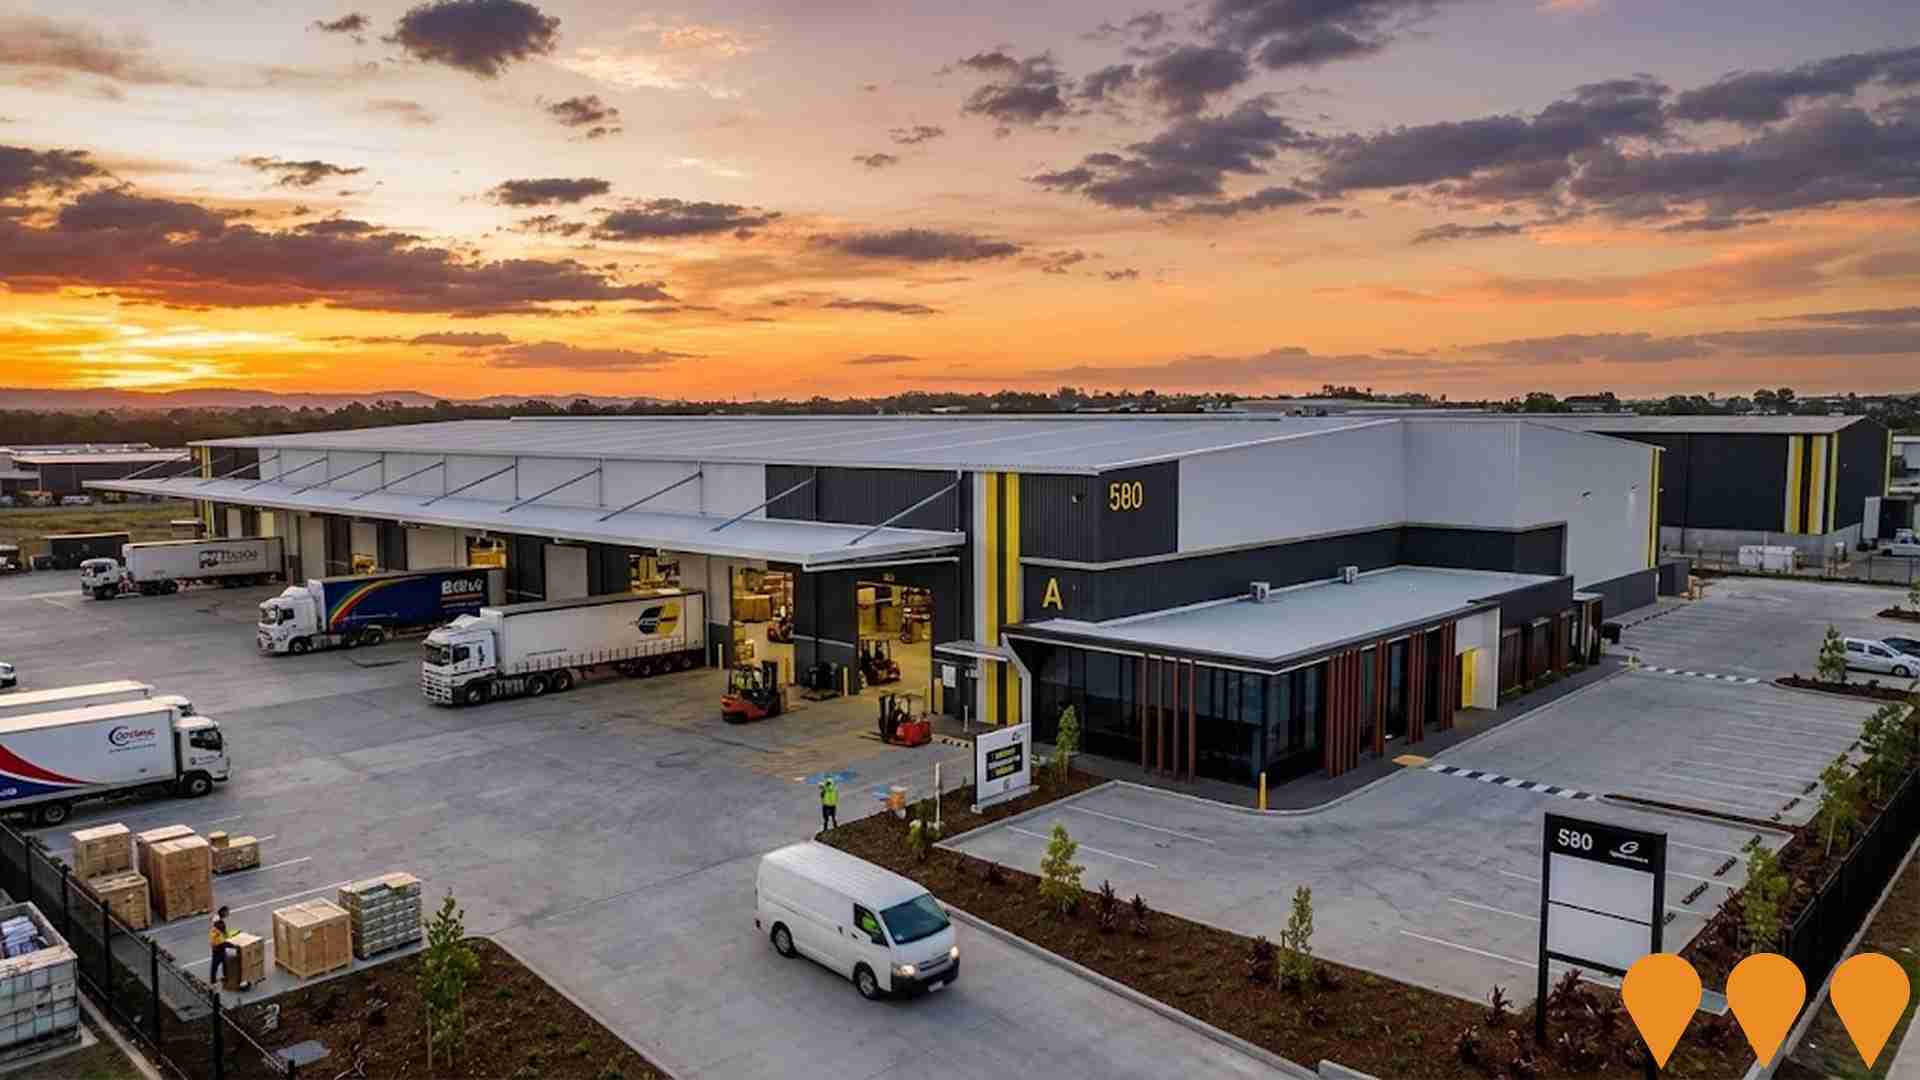
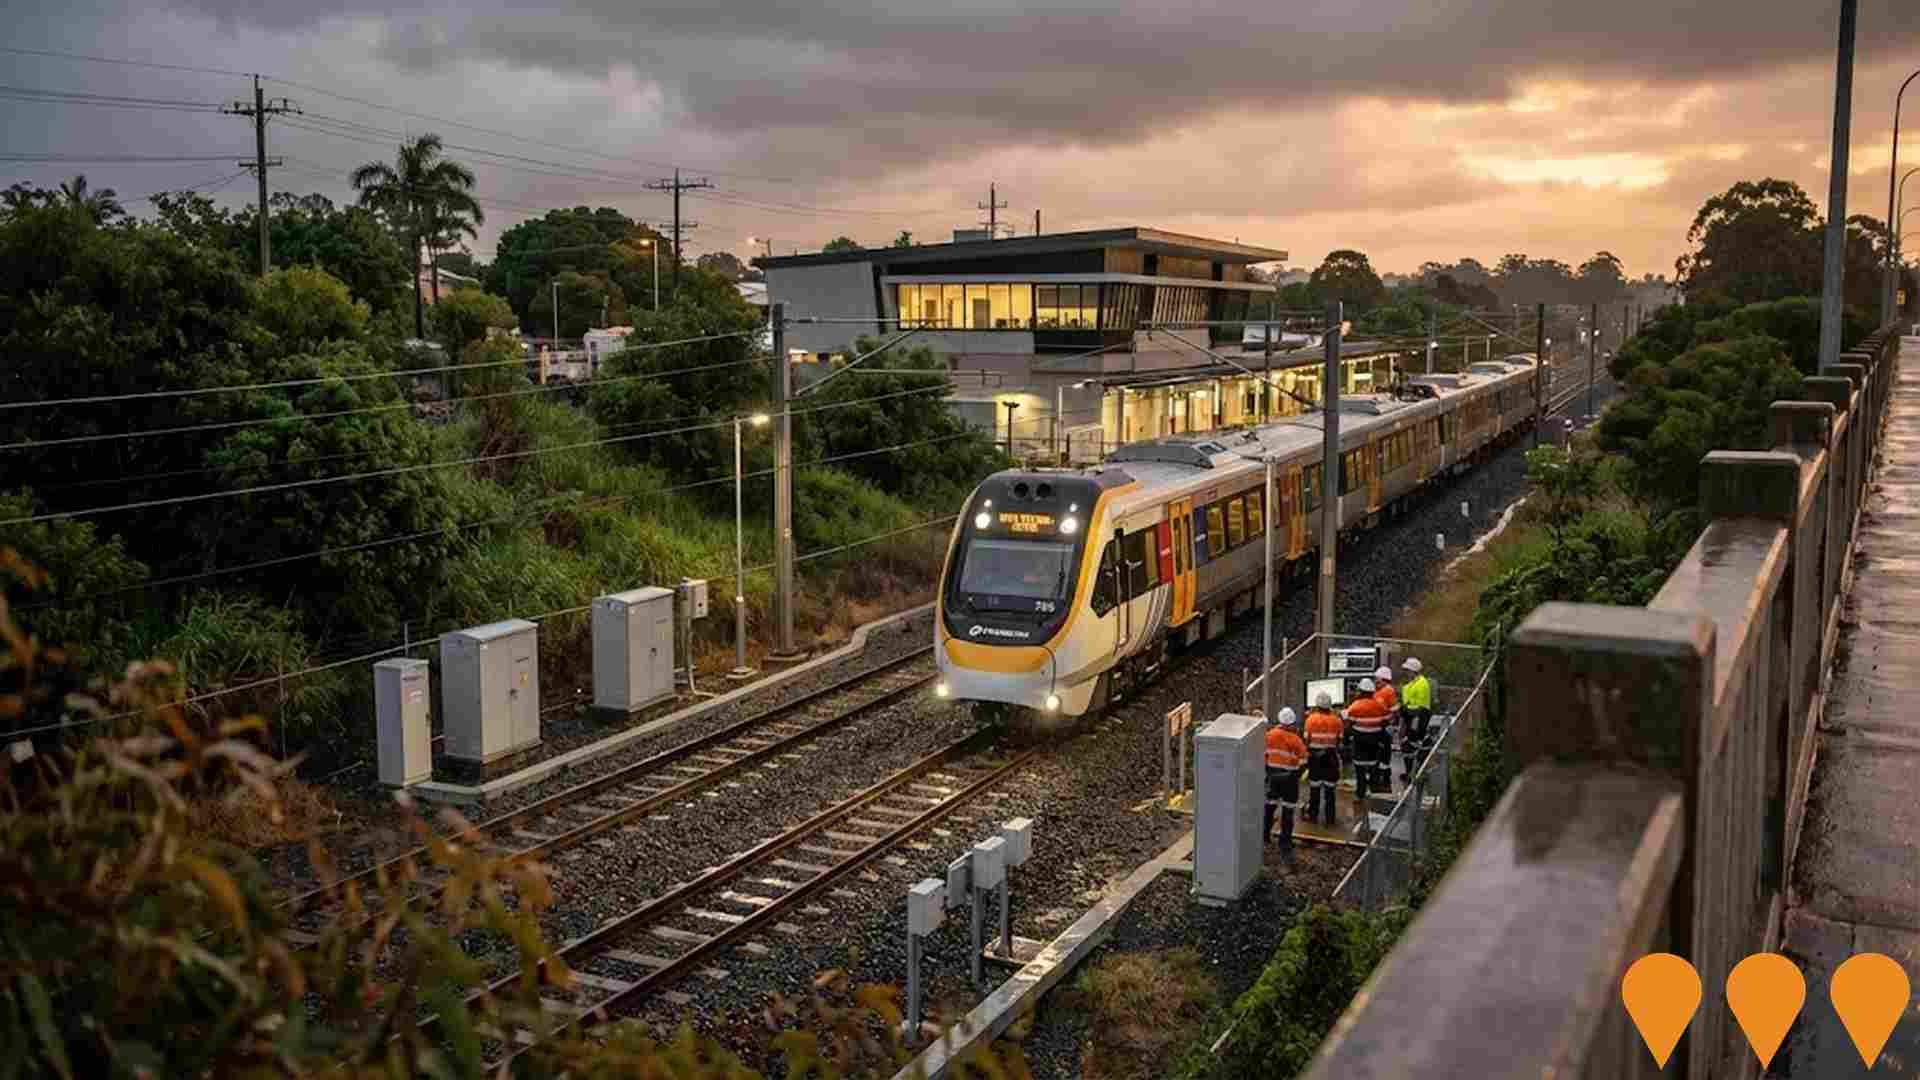
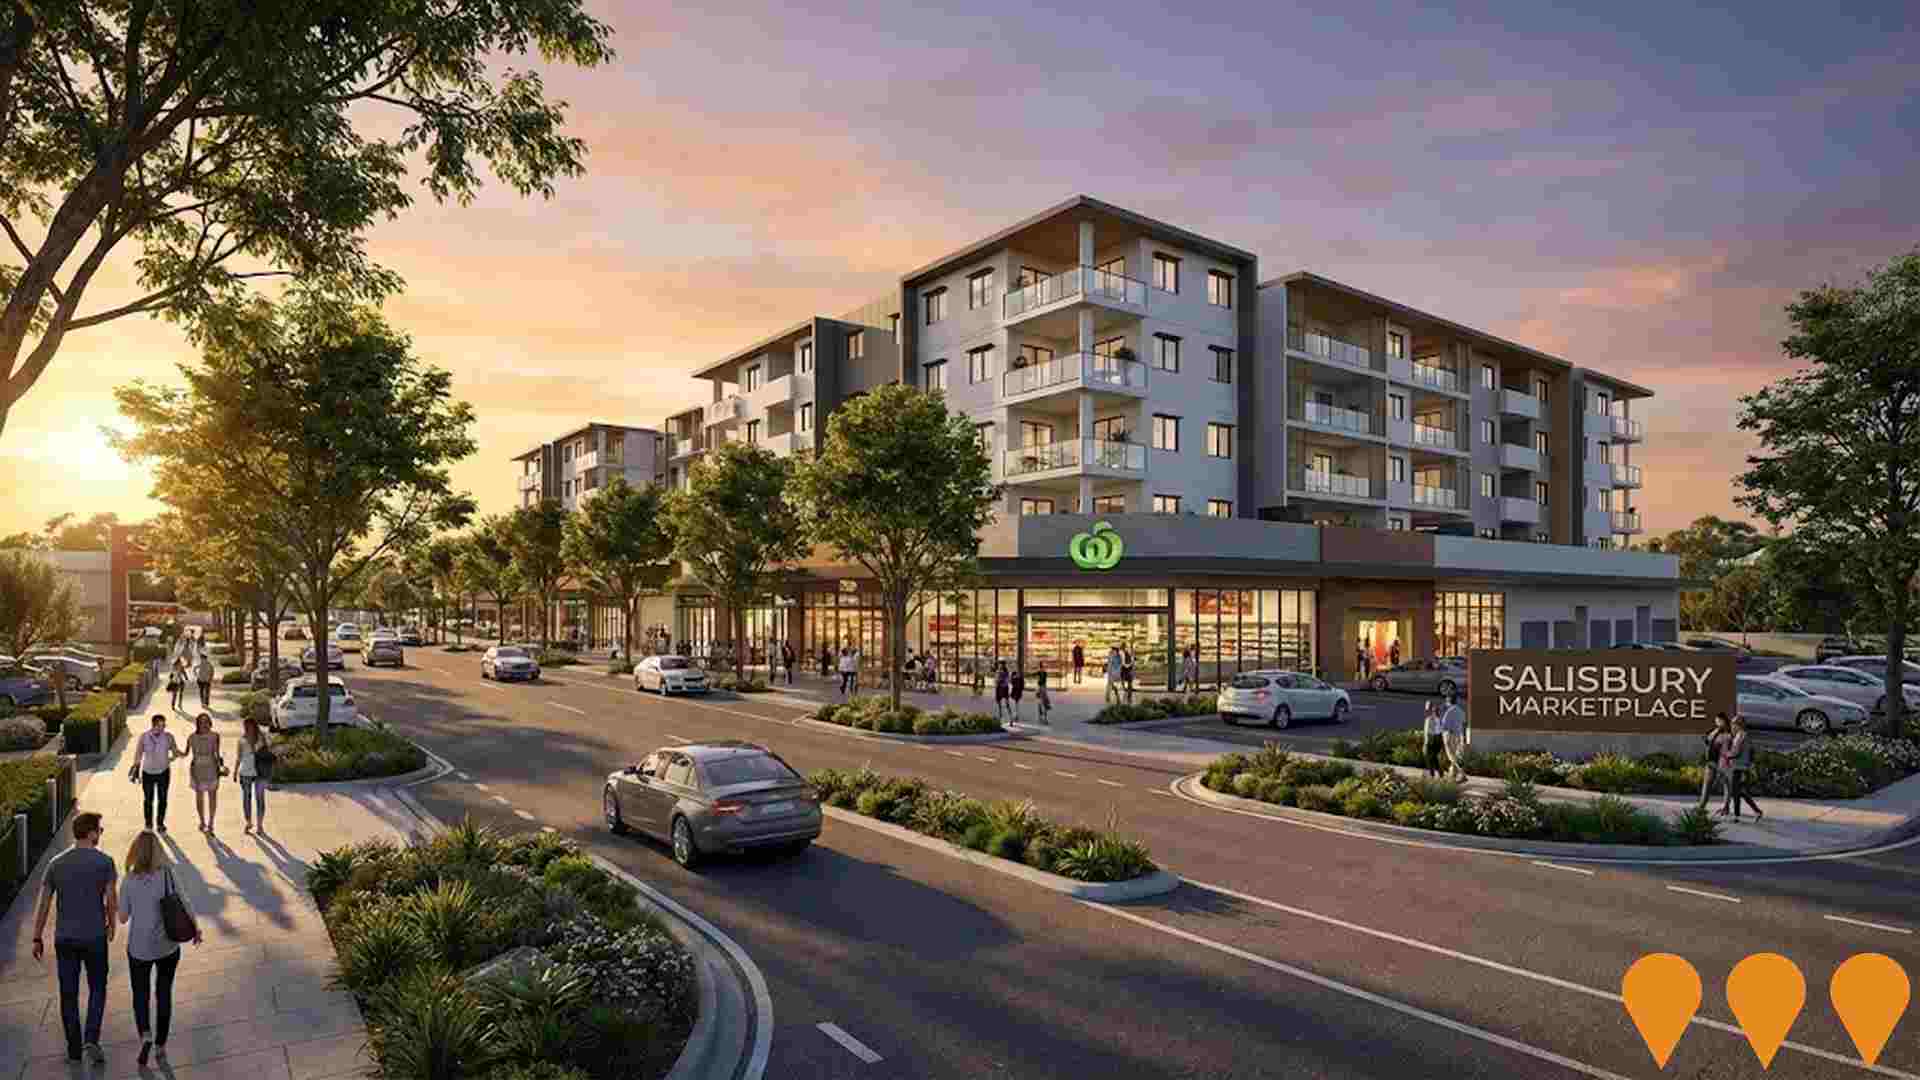
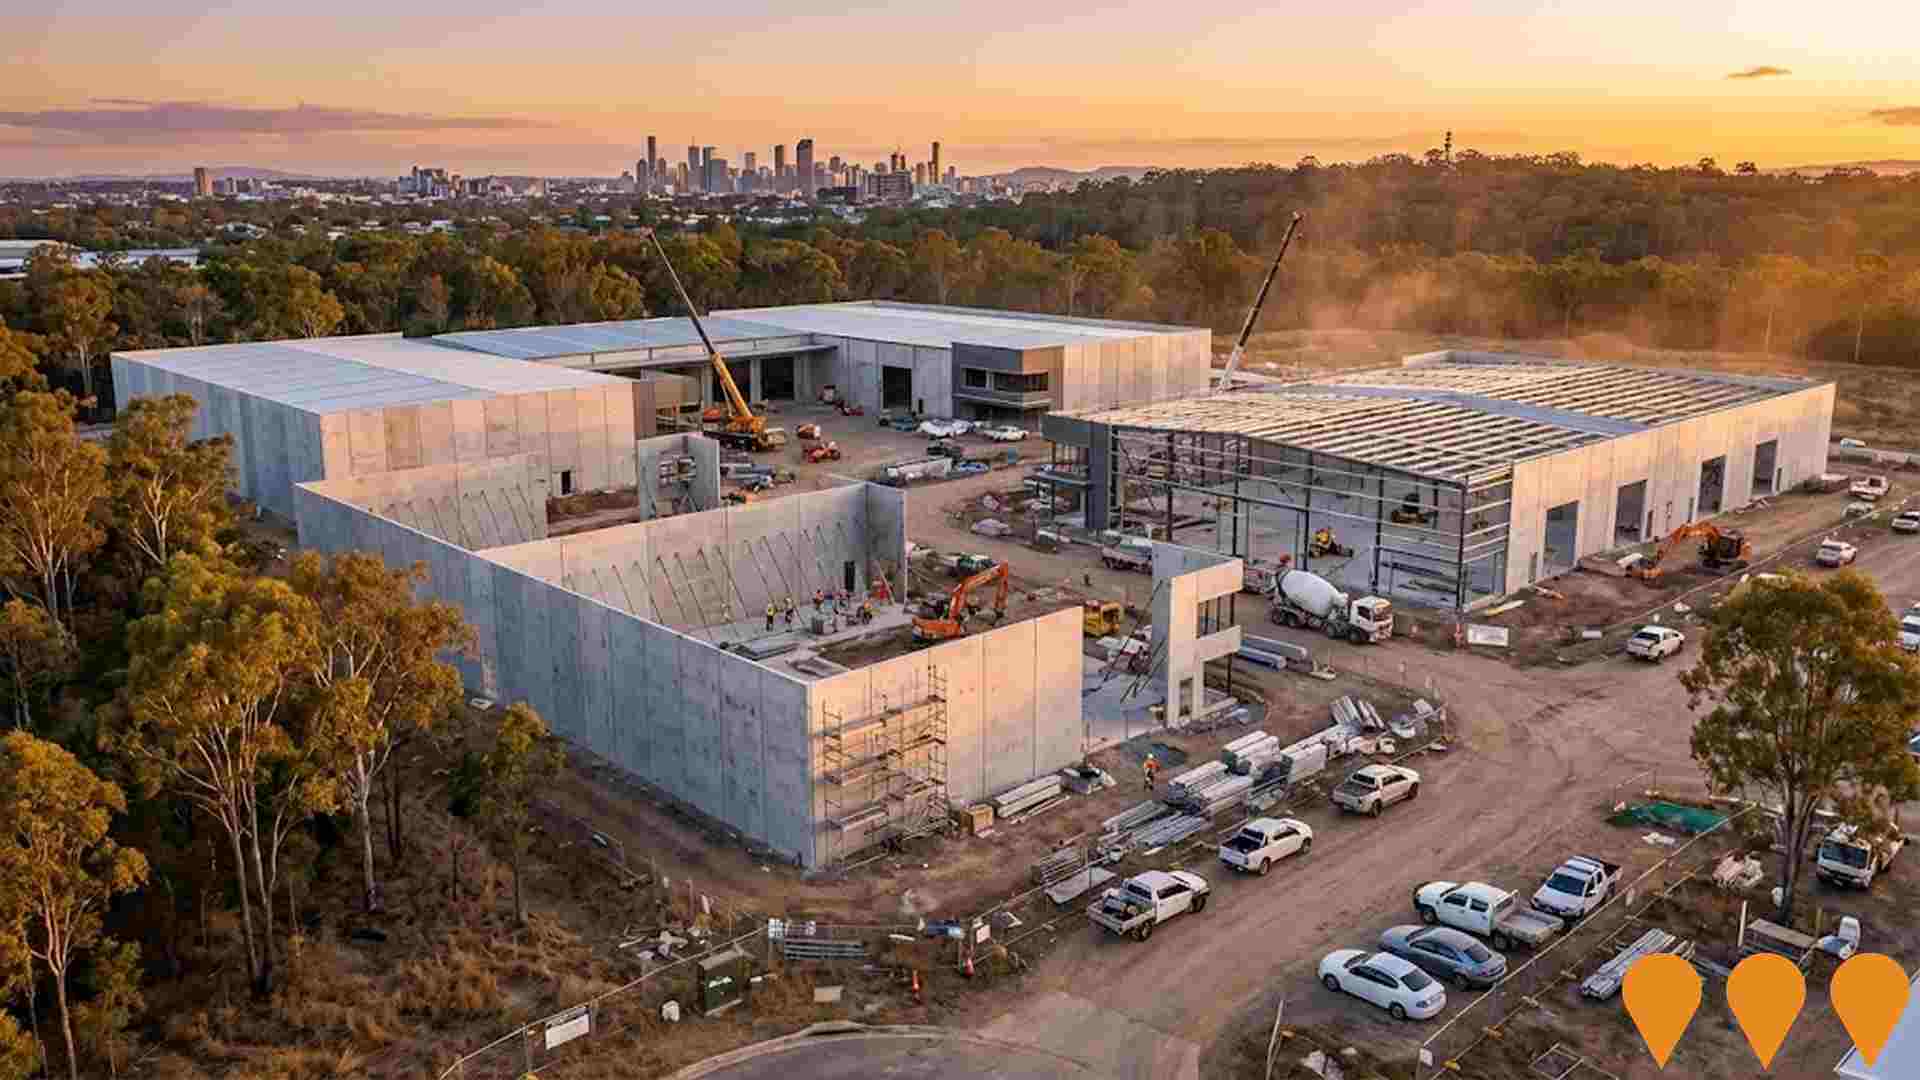
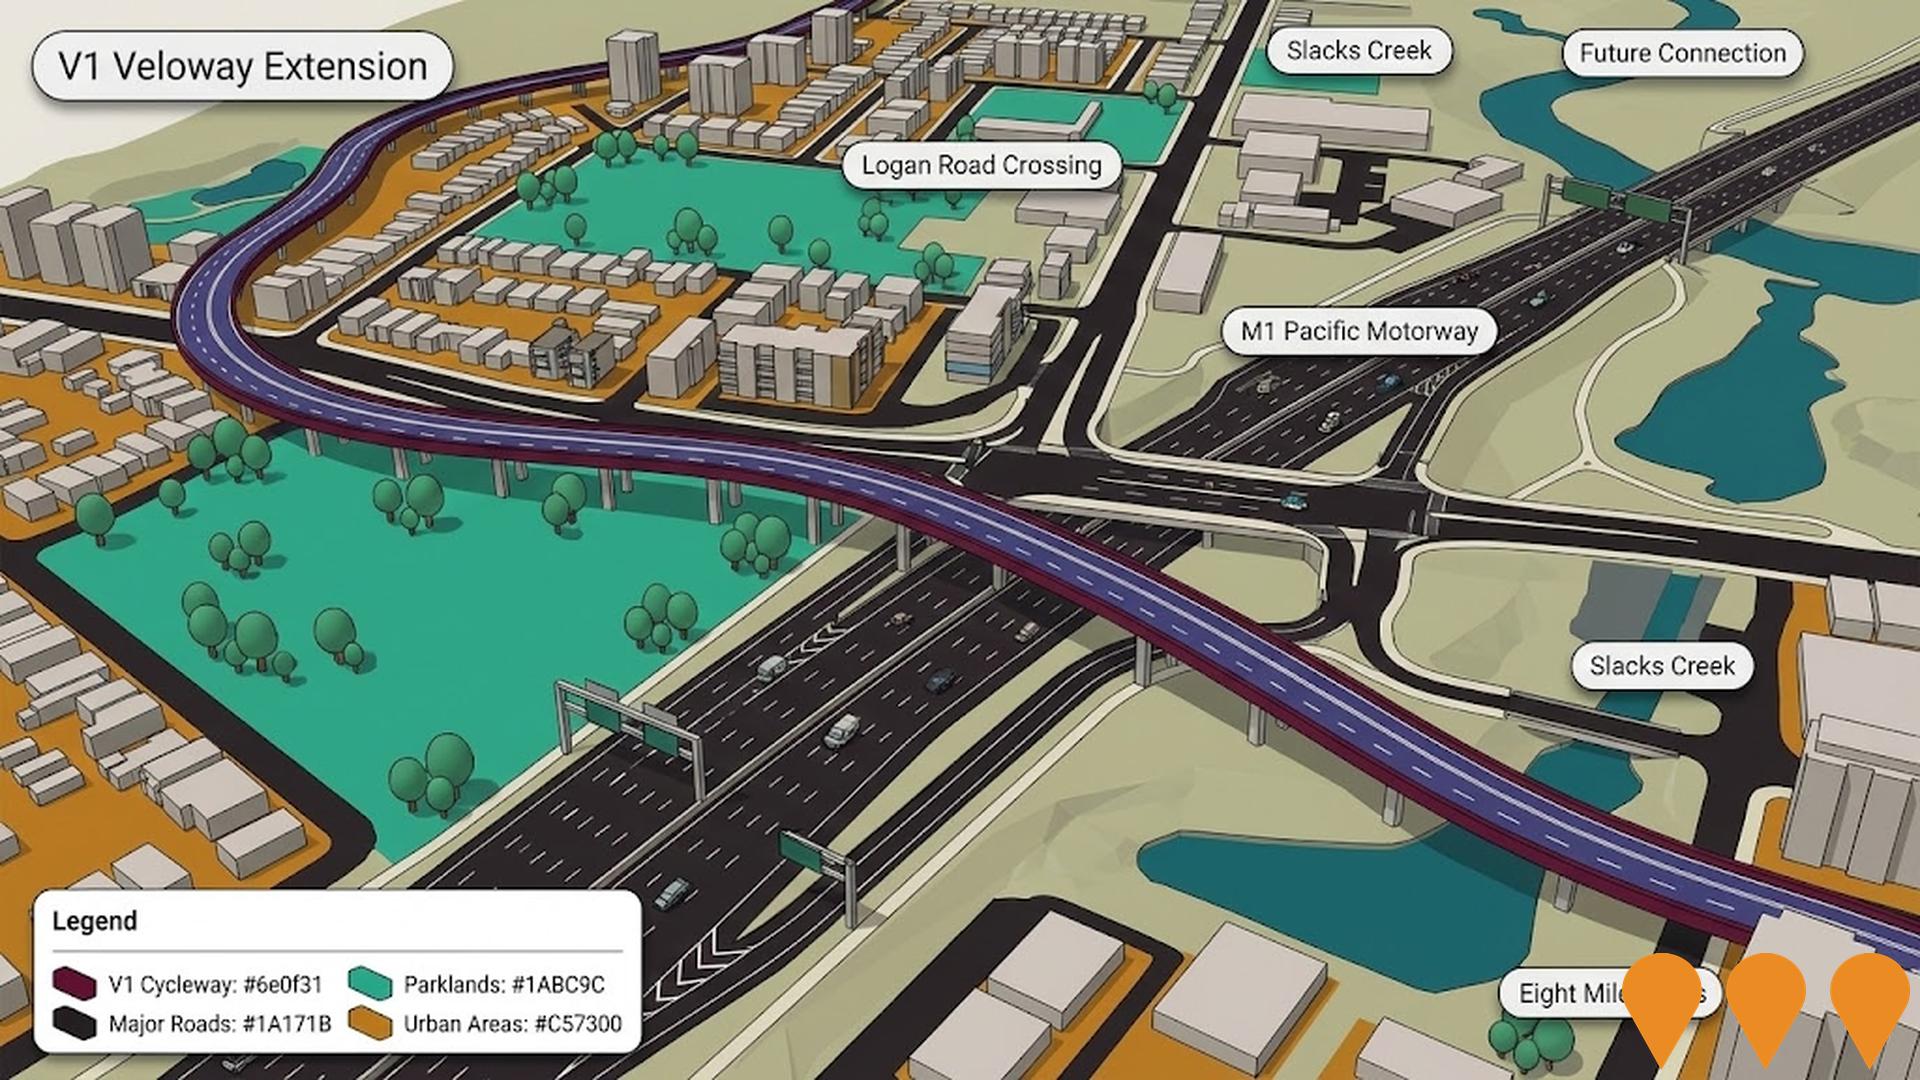
Changes to local infrastructure significantly influence an area's performance. AreaSearch has identified six projects likely impacting the area. Key projects are Henson Road Industrial Estate, Cross River Rail - Salisbury Station Upgrade, Salisbury Marketplace, and Queen Elizabeth II Jubilee Hospital Expansion. The following list details those most relevant:.
Professional plan users can use the search below to filter and access additional projects.
INFRASTRUCTURE SEARCH
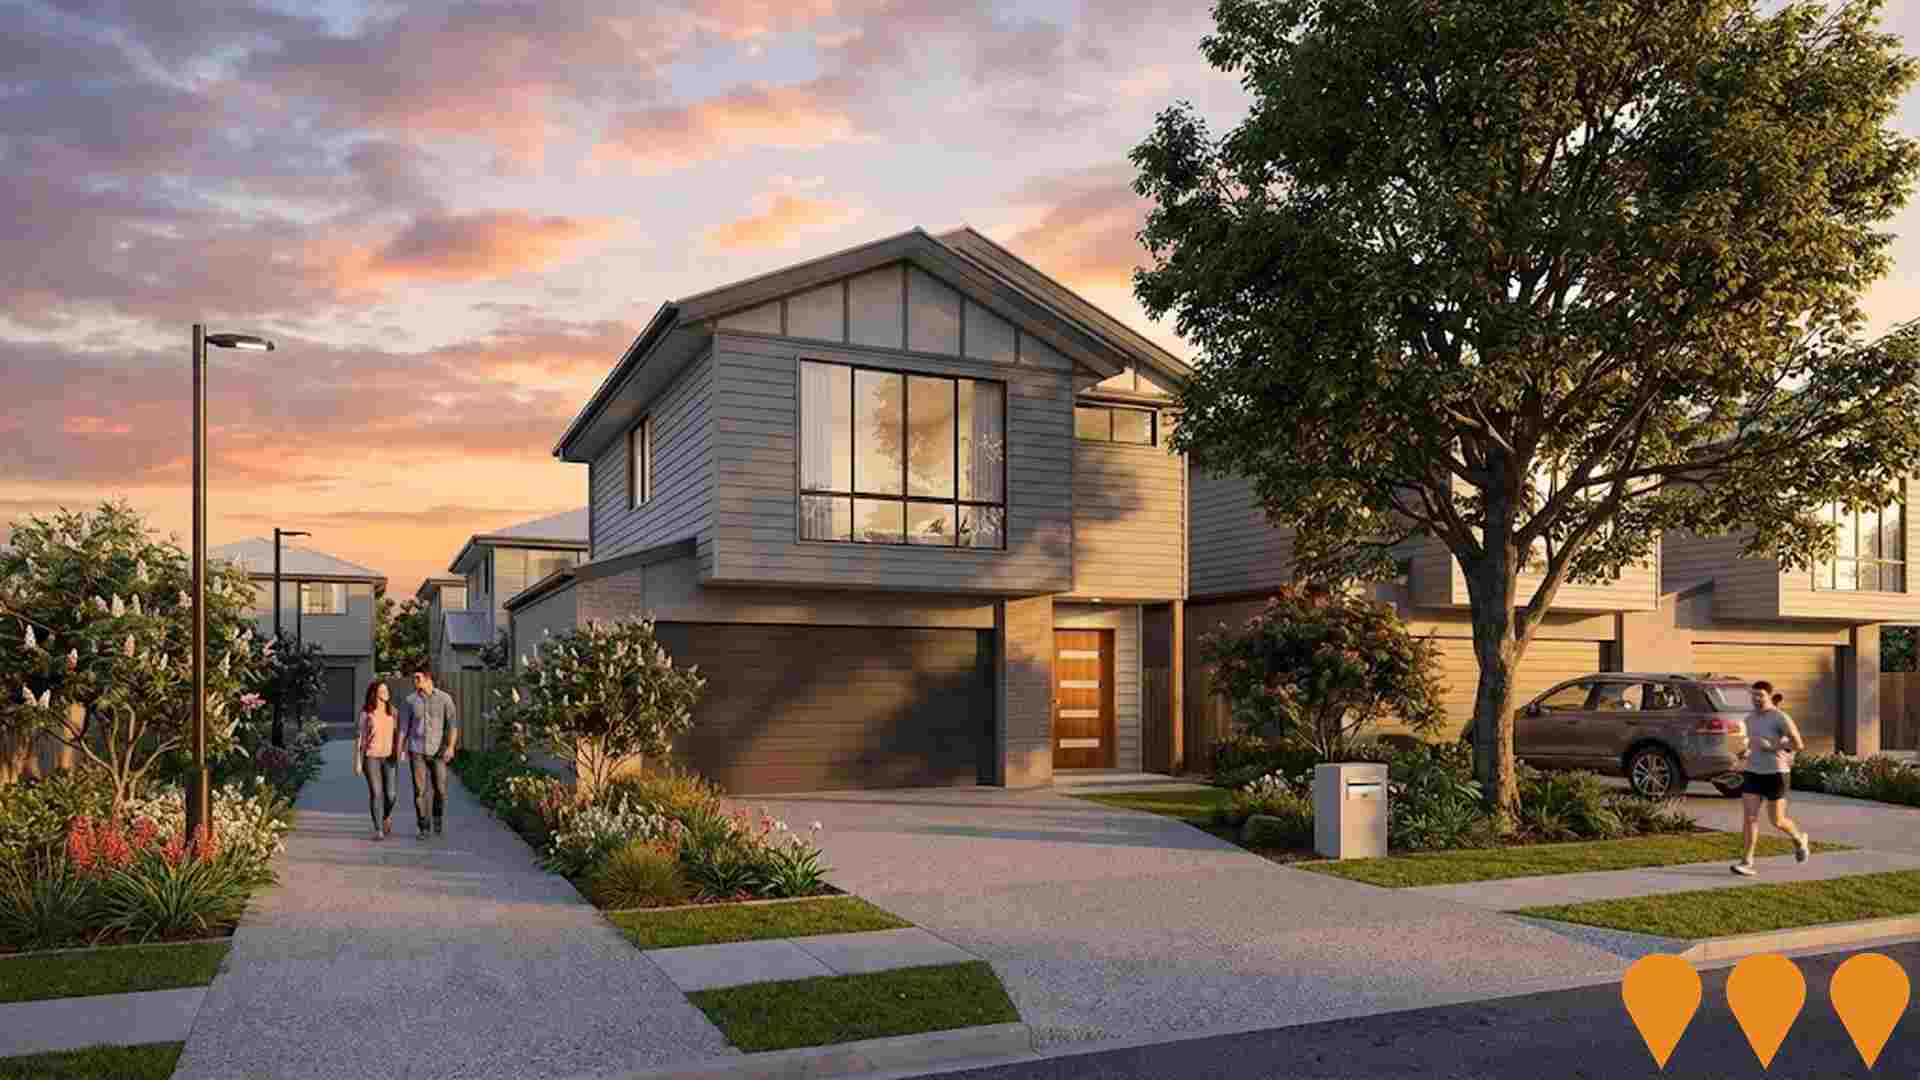
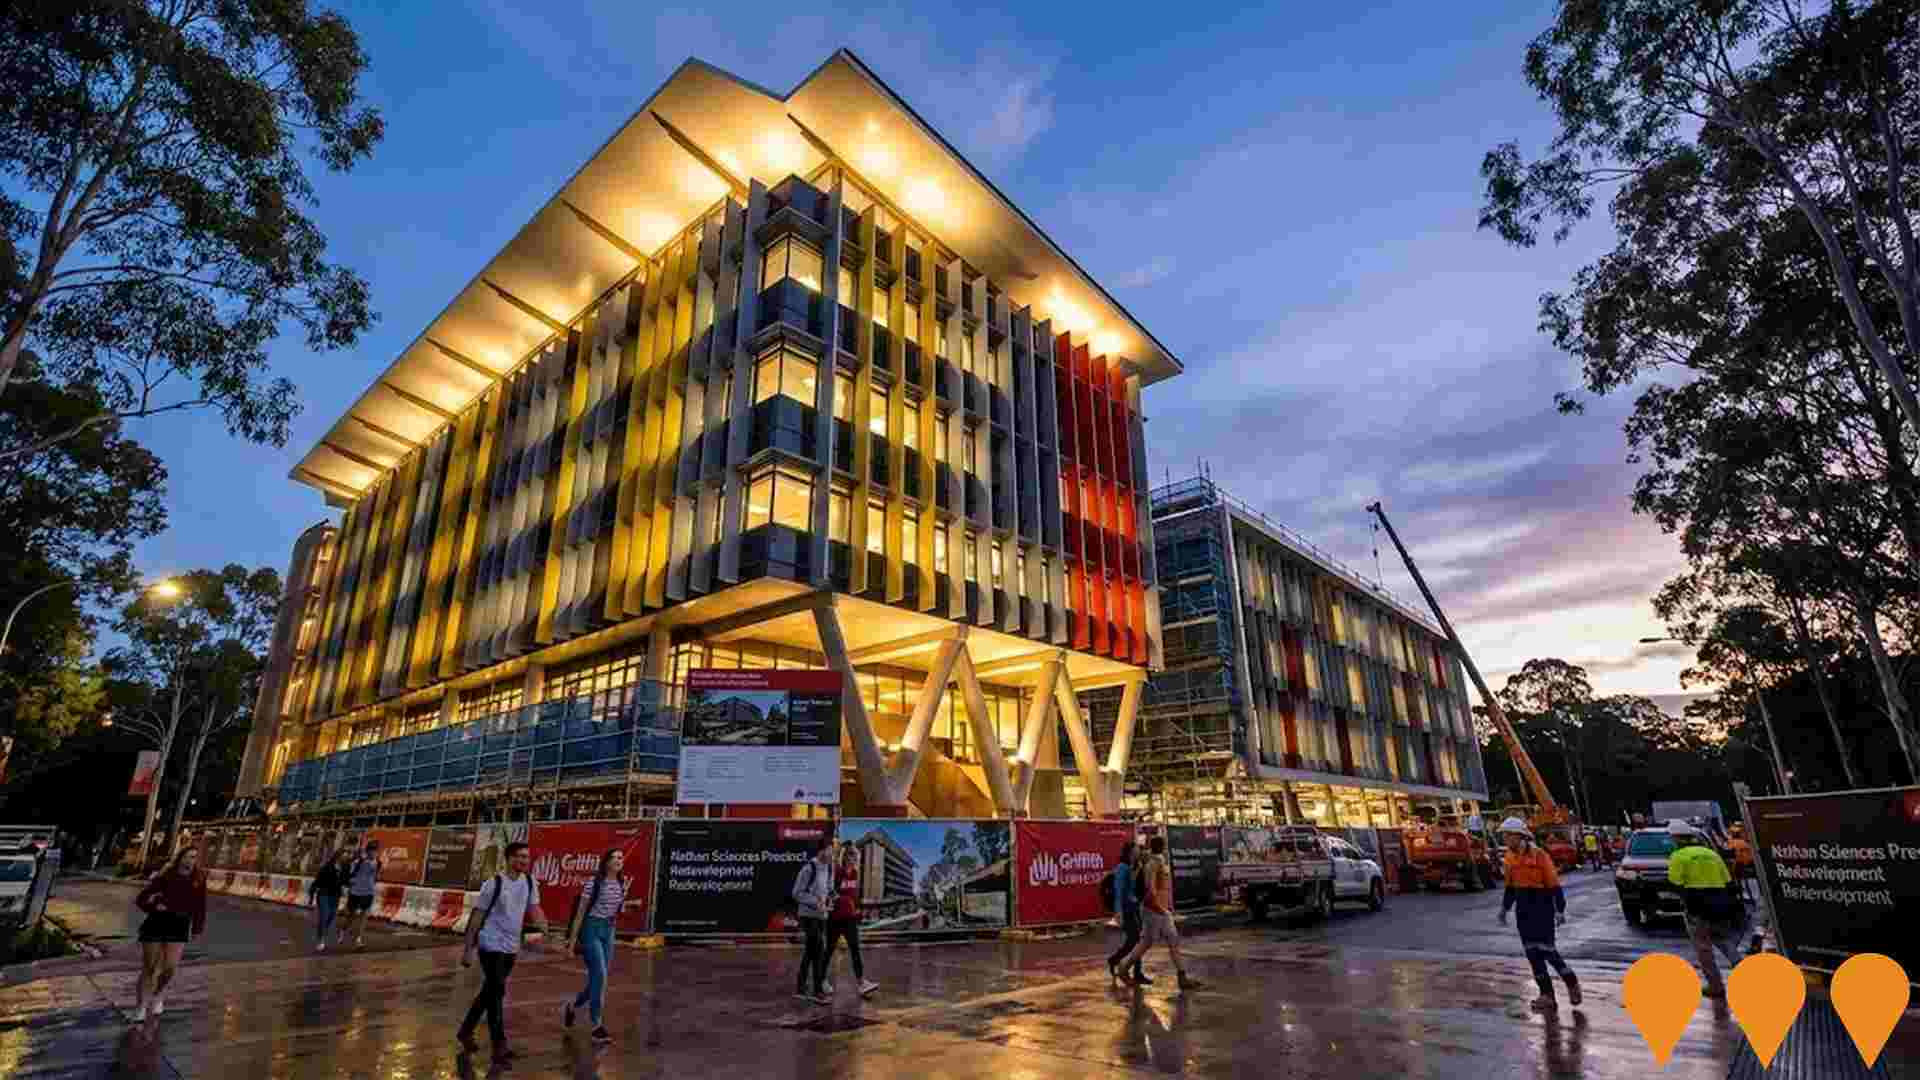
 Denotes AI-based impression for illustrative purposes only, not to be taken as definitive under any circumstances. Please follow links and conduct other investigations from the project's source for actual imagery. Developers and project owners wishing us to use original imagery please Contact Us and we will do so.
Frequently Asked Questions - Infrastructure
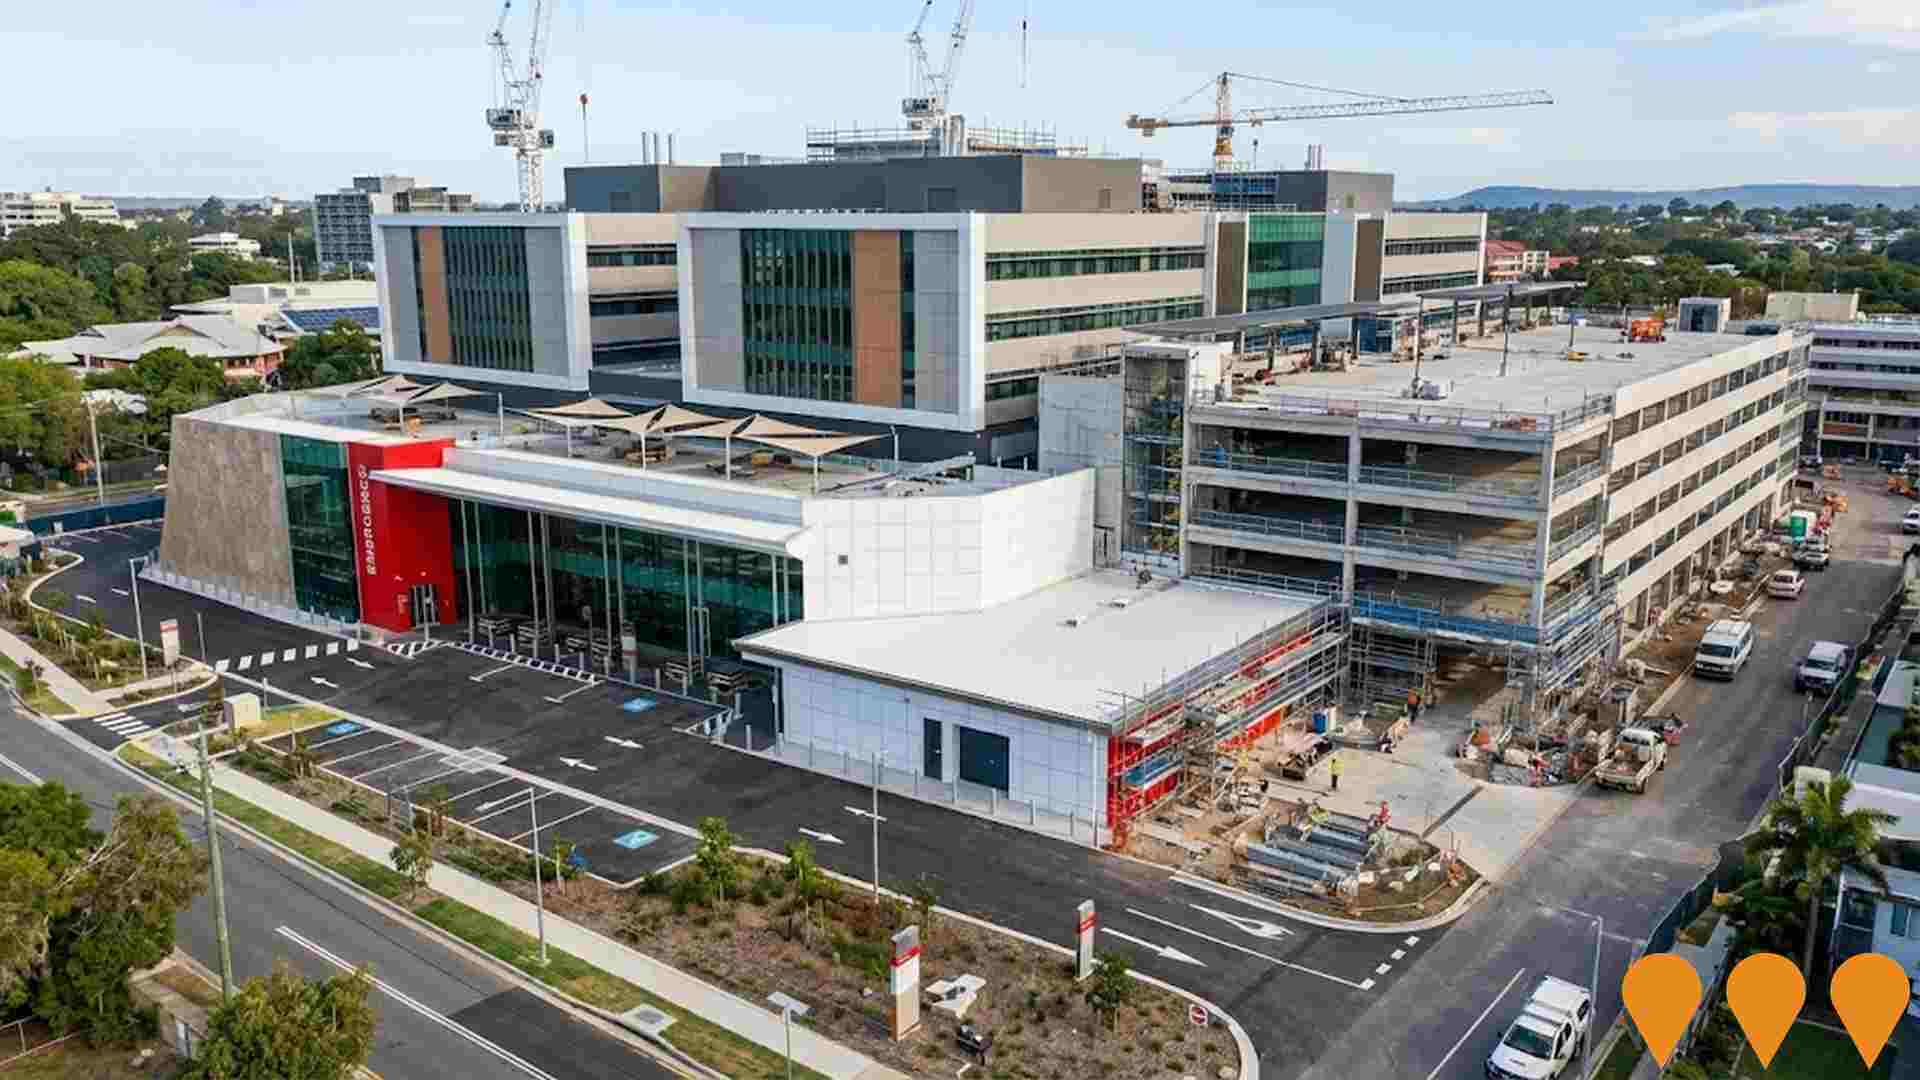
Queen Elizabeth II Jubilee Hospital Expansion
Major expansion of QEII Jubilee Hospital including a new 5-level clinical services building delivering 112 additional inpatient beds, expanded operating theatres, increased intensive care capacity, upgraded support services and a new 8-level multi-storey car park providing 1,379 spaces. Construction commenced late 2024 with practical completion of main works expected in 2027.
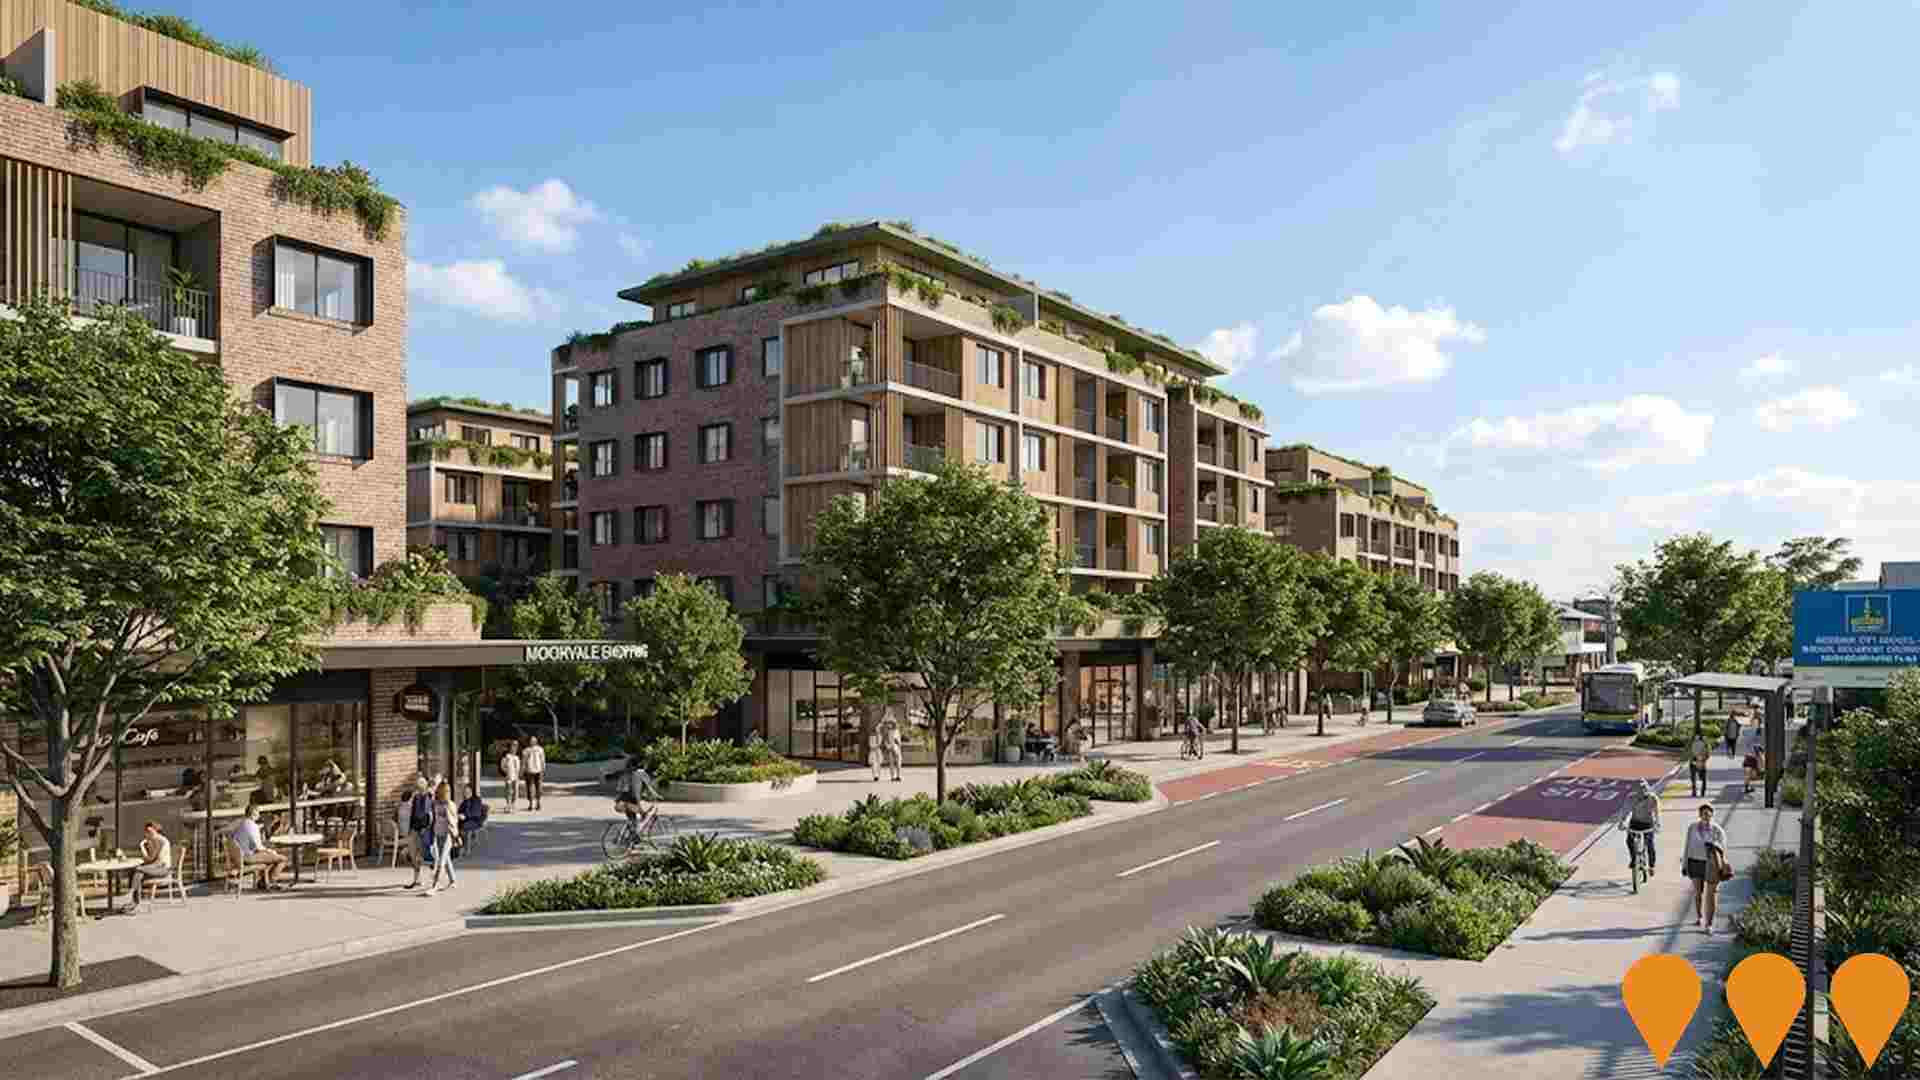
Nathan, Salisbury, Moorooka Neighbourhood Plan
Comprehensive neighbourhood plan adopted by Brisbane City Council in May 2025 and effective from 27 June 2025. Guides future development over 10+ years in Nathan, Salisbury, and Moorooka suburbs. Enables approximately 2,500 new homes and 12,500 new jobs. Key features include transforming the 'Magic Mile' precinct into a major employment and lifestyle hub, upgrading Ipswich Road to six lanes with new western bikeway, enhancing walkability and transport links (including Cross River Rail benefits), protecting character residential areas and heritage, preserving Toohey Forest and creek corridors biodiversity. Includes specific precincts: Magic Mile lifestyle, Moorvale shopping, heritage renewal, and residential renewal encouraging mixed-density housing.
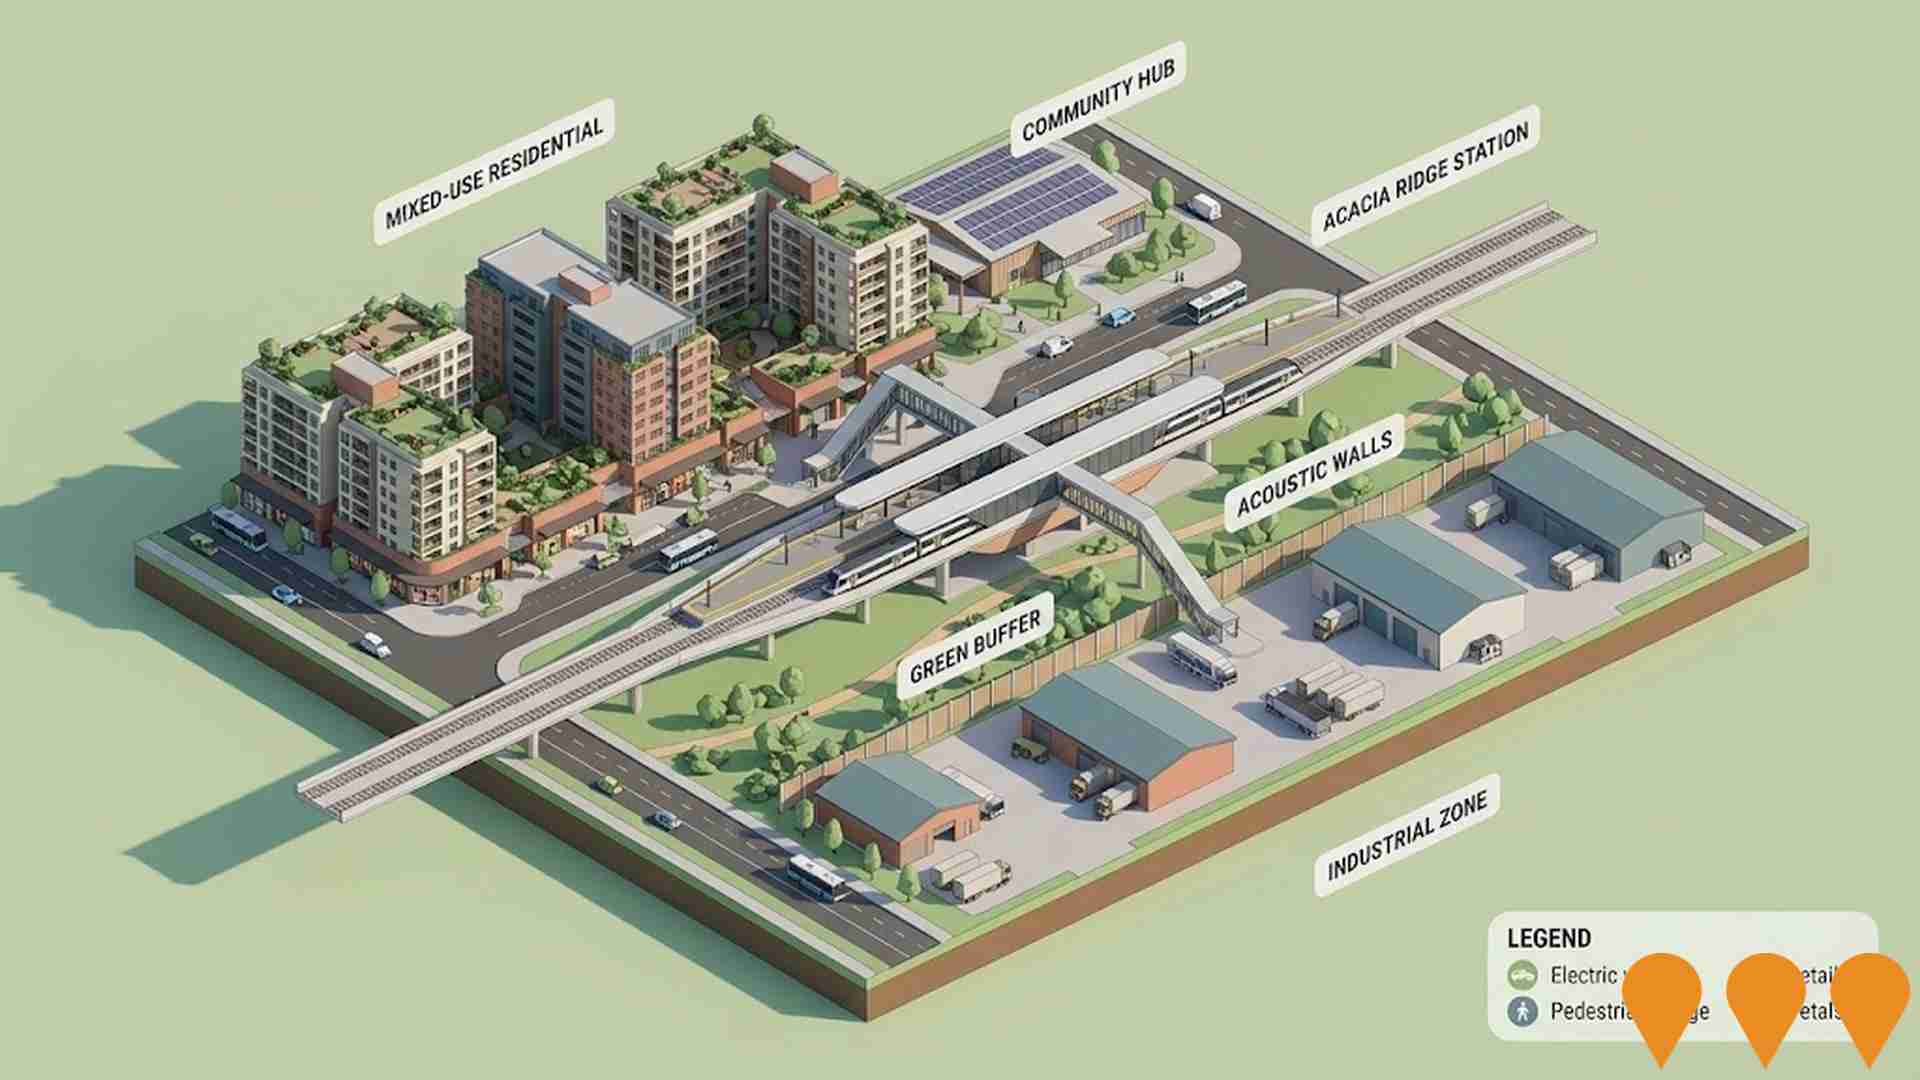
Acacia Ridge Transit Oriented Development (TOD) Precinct
Future mixed-use transit-oriented precinct planned around Acacia Ridge train station, guided by the Acacia Ridge-Archerfield neighbourhood plan. The plan provides for improved housing choice and diversity in well-located and serviced areas, with potential for residential apartments, retail, and community facilities near the station. Development must incorporate measures to mitigate impacts from the adjacent industrial and railway corridor uses.
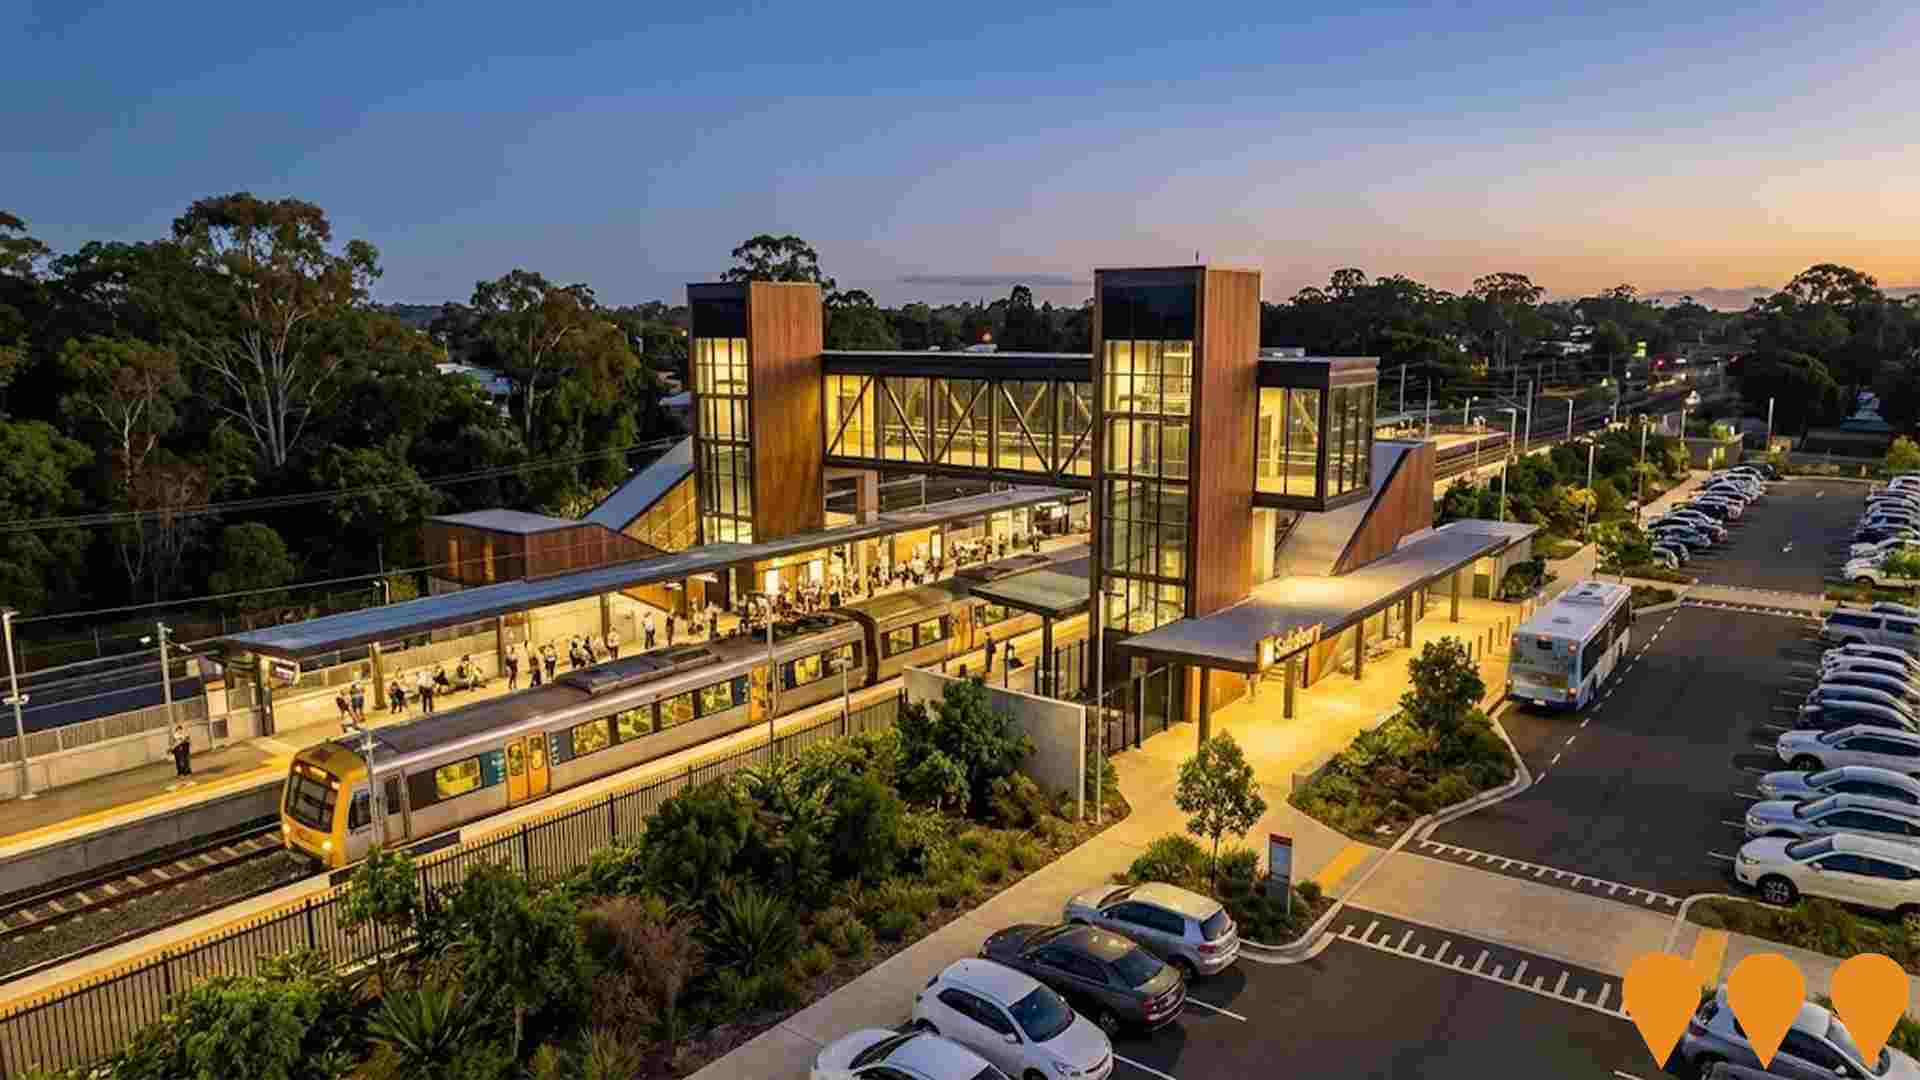
Cross River Rail - Salisbury Station Upgrade
Major upgrade to Salisbury railway station as part of the $7.8 billion Cross River Rail project. The station is being completely rebuilt with accessibility improvements, new platforms, overpasses, passenger lifts, a third platform, enhanced connections to surrounding areas, and modern amenities. Features include new station building, accessible parking bays, kiss'n'ride spaces, platform improvements, bike enclosures, and weather protection canopies. Station is currently closed until 2026 for construction. Part of seven southside stations being rebuilt between Dutton Park and Salisbury.
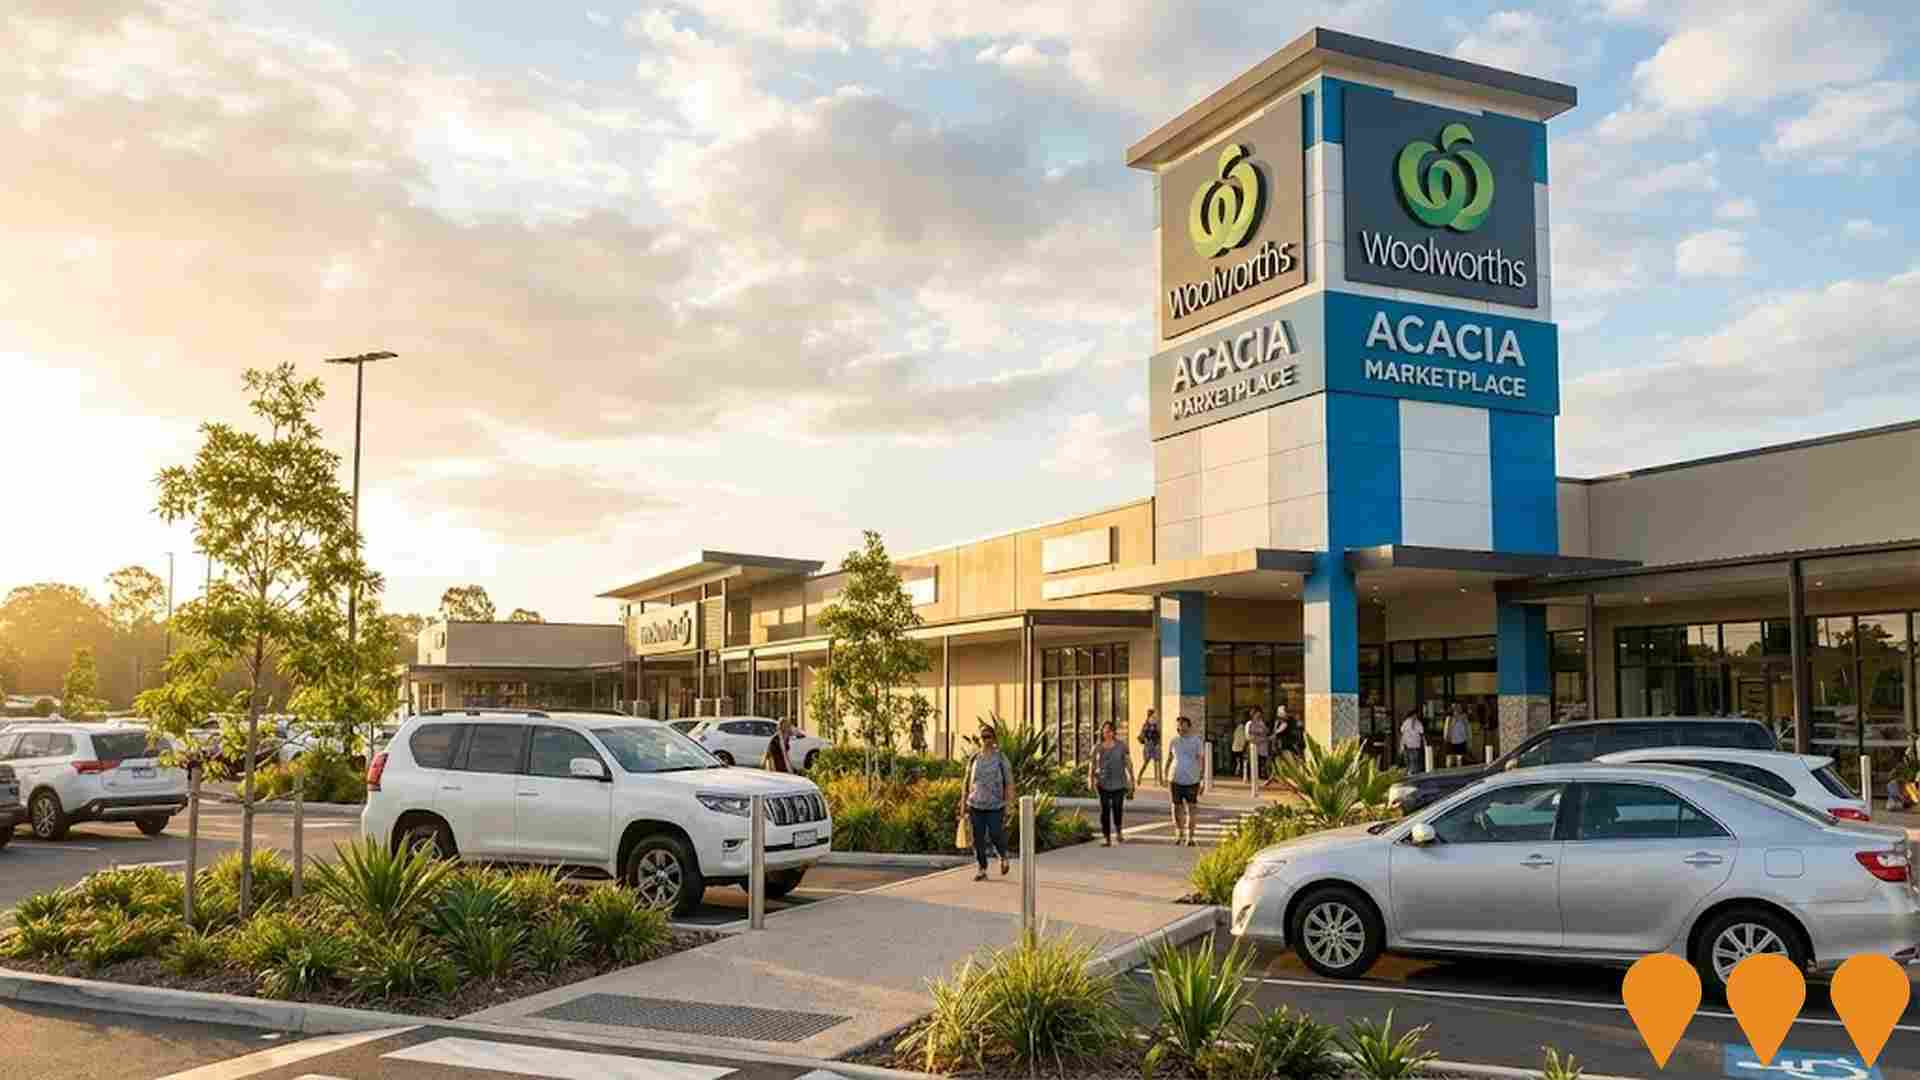
Acacia Marketplace Redevelopment
Redevelopment and staged expansion of Acacia Marketplace shopping centre, which included securing ALDI and KTAS as new tenants and developing purpose-built buildings. The masterplan was compiled to ensure the centre's continued growth. The centre is anchored by Woolworths and has over 28 specialty stores.
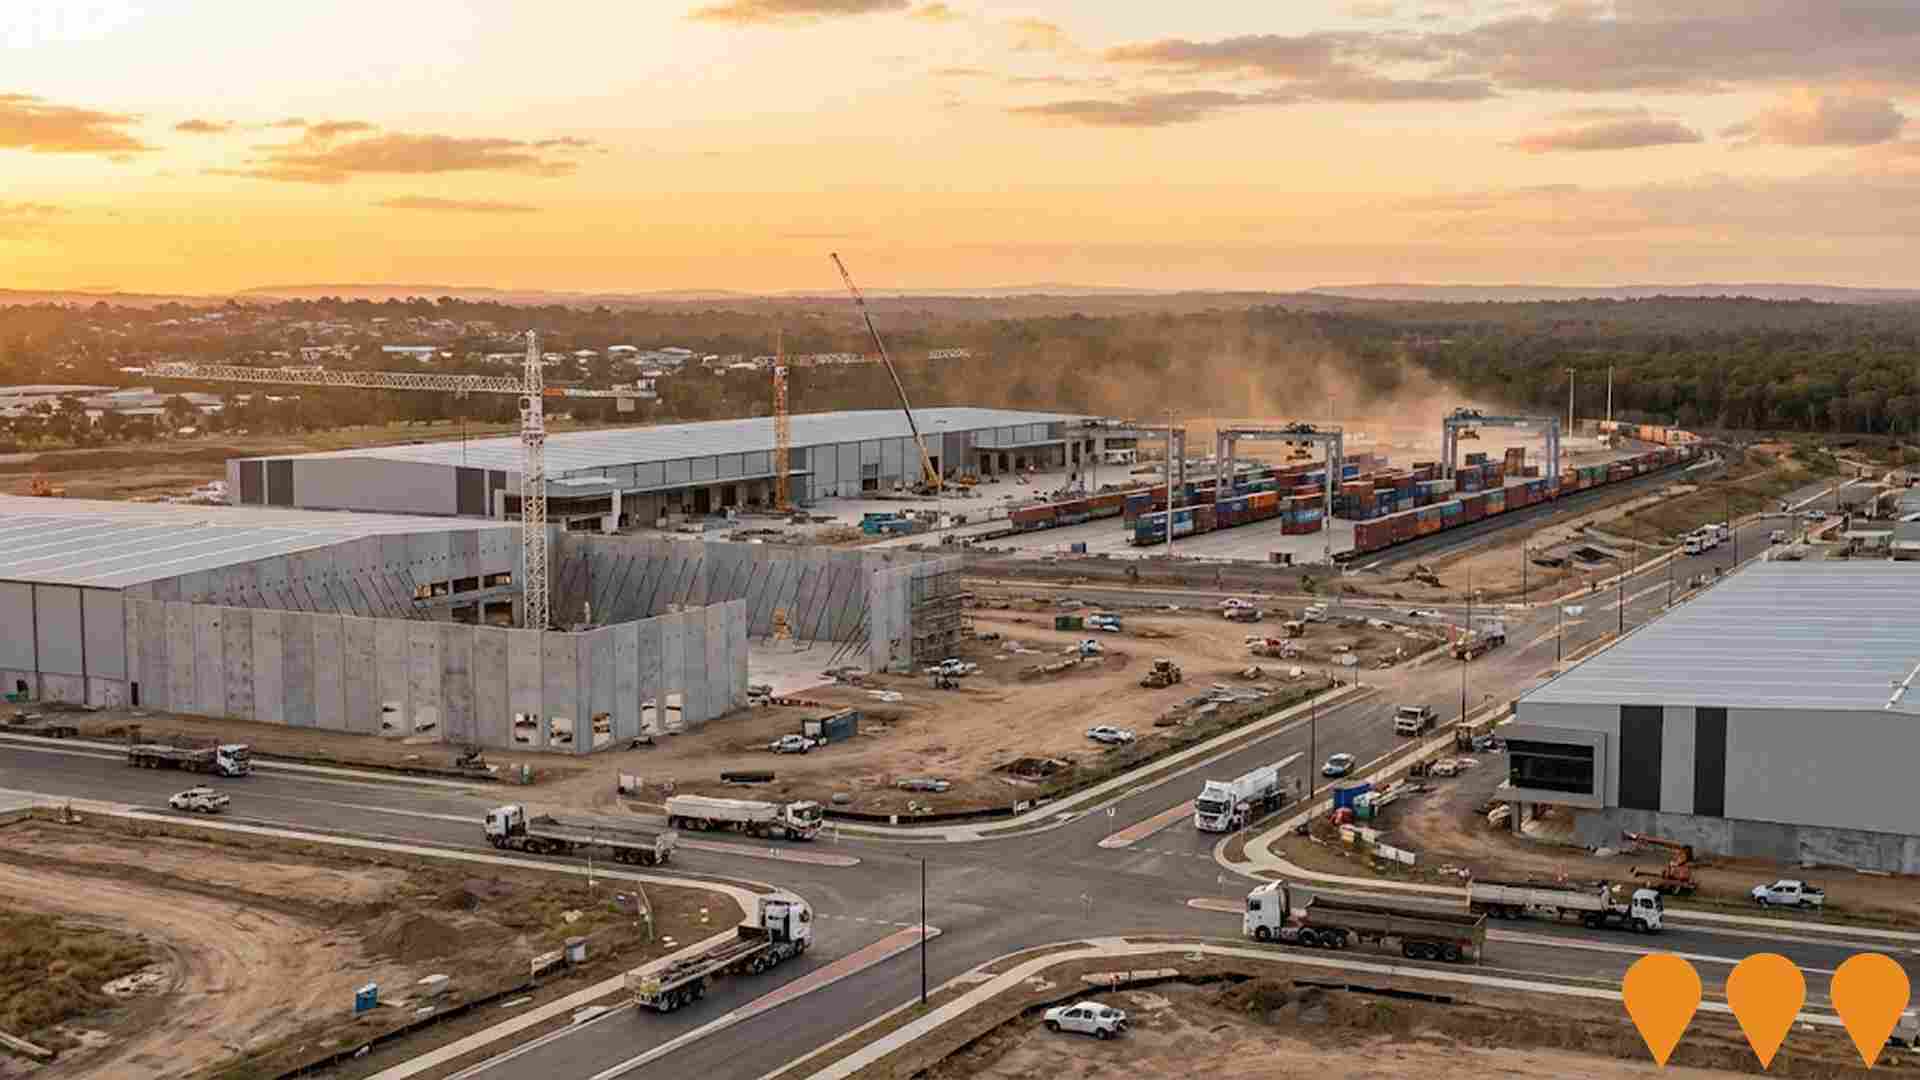
Oxley Wedge Industrial Precinct
Large-scale industrial precinct development within the Oxley Wedge area, delivering new warehousing and freight facilities adjacent to the Acacia Ridge intermodal terminal, with development now underway by primary developers.
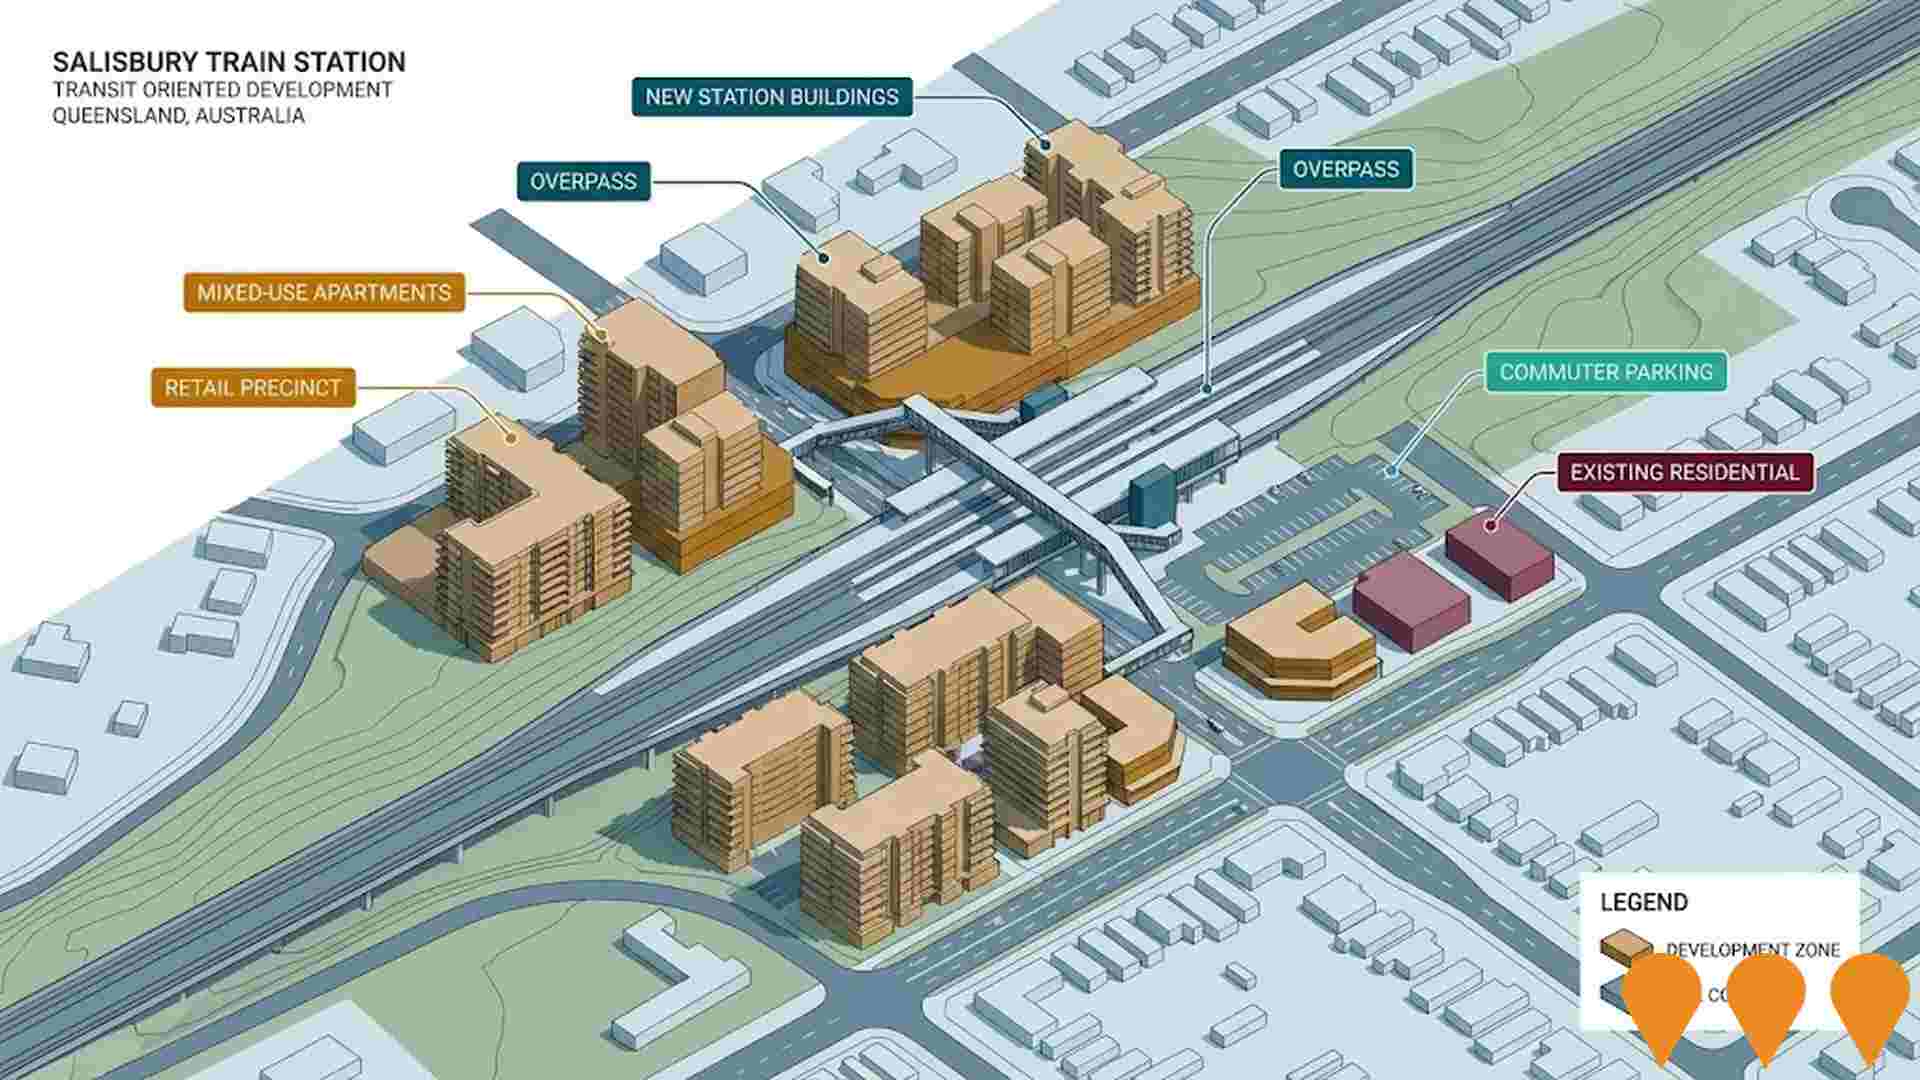
Salisbury Train Station Transit Oriented Development (TOD)
Queensland Government-led planning for medium-density mixed-use precinct around the upgraded Salisbury Station as part of Cross River Rail ripple effects, including apartments, retail, and public realm improvements.
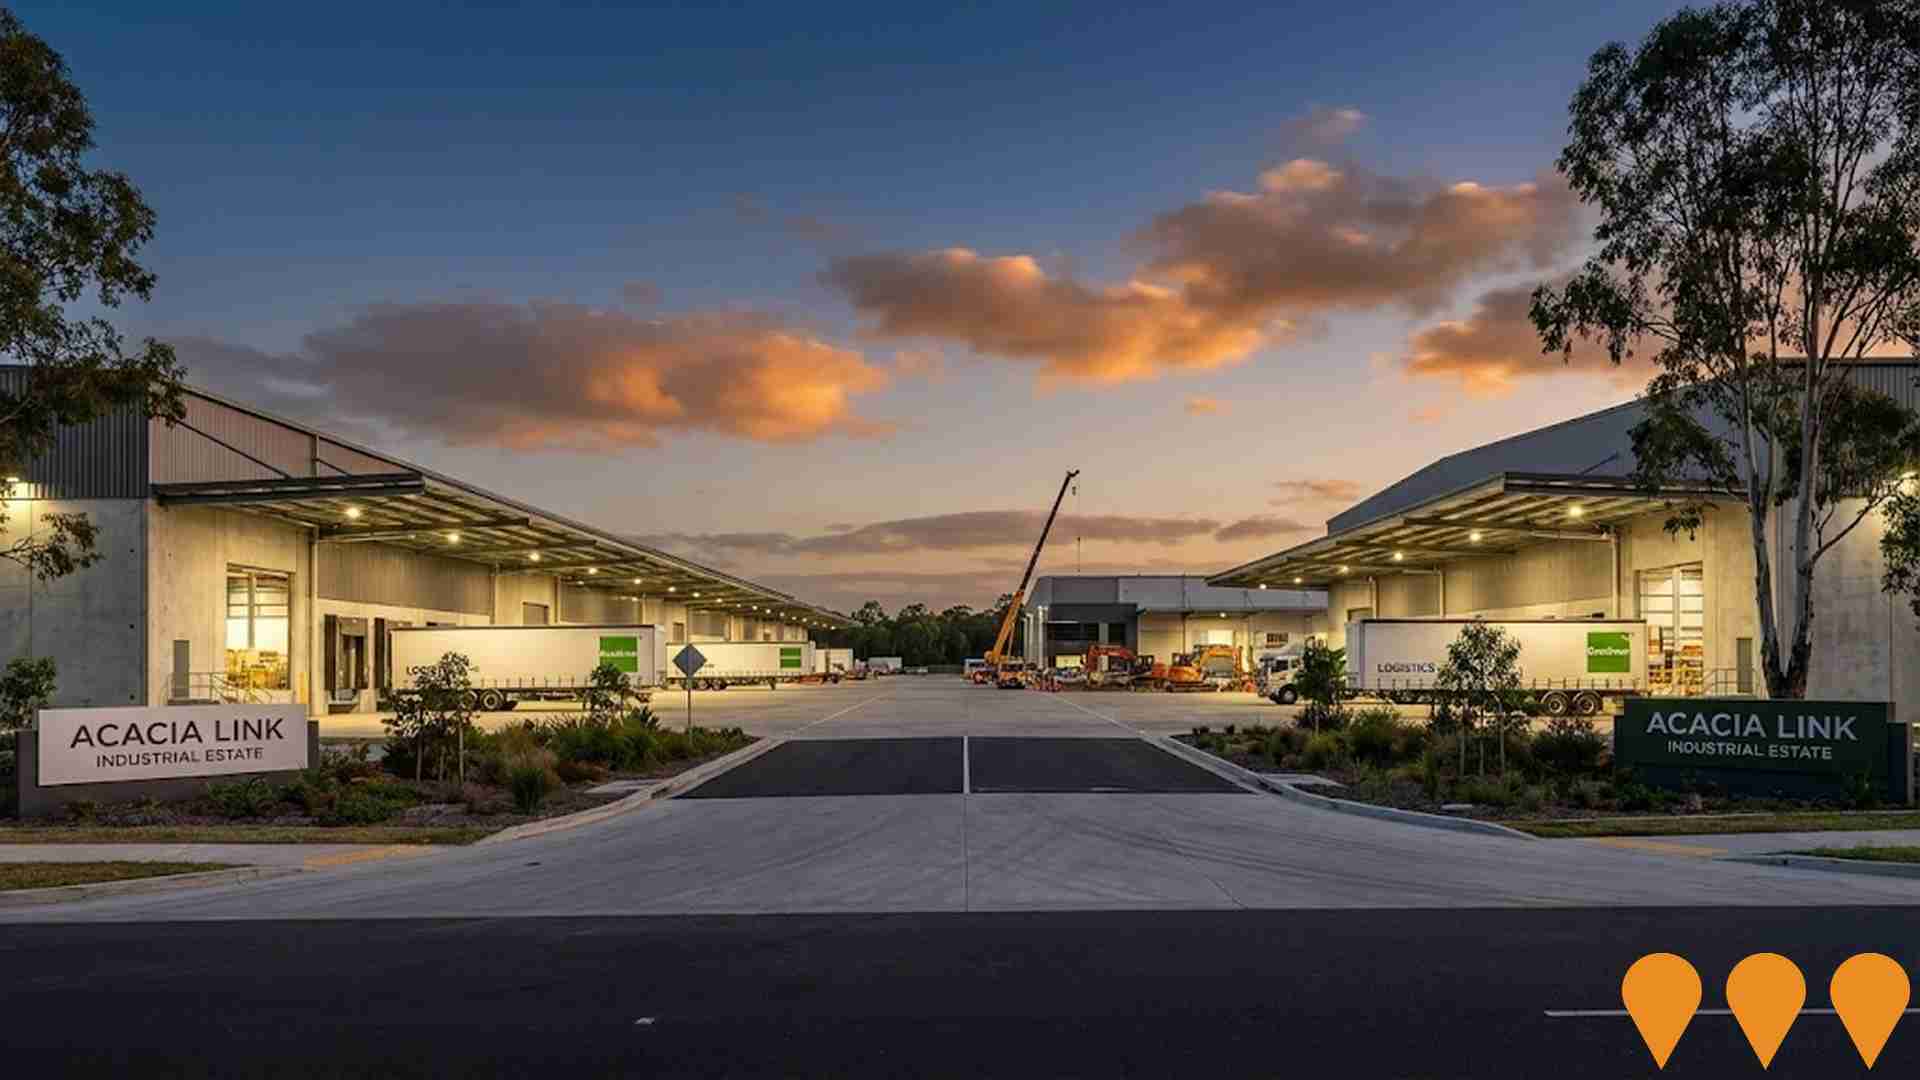
Acacia Ridge Industrial Estate Expansion - Warehouse & Logistics Facilities
Major expansion of one of Australia's largest industrial estates with new premium warehouse and logistics facilities, potentially relating to the Acacia Link Industrial Estate developments in the area. The Goodman Group has multiple properties in the Acacia Ridge area which are completed and available for lease or are part of their overall development pipeline. The original project is likely completed or superseded by several ongoing developments in the Acacia Ridge area.
Employment
Employment performance in Coopers Plains has been below expectations when compared to most other areas nationally
Coopers Plains has a highly educated workforce with well-represented essential services sectors. Its unemployment rate was 6.1% as of September 2025.
Over the past year, it maintained relative employment stability. As of that month, 3,373 residents were employed while the unemployment rate was 2.2% higher than Greater Brisbane's rate of 4.0%. Workforce participation was broadly similar to Greater Brisbane's 64.5%. Leading employment industries among Coopers Plains residents include health care & social assistance, retail trade, and education & training.
The area shows a notable concentration in accommodation & food services with employment levels at 1.3 times the regional average. However, construction has limited presence with 5.7% employment compared to the regional average of 9.0%. As of the Census, Coopers Plains functions as an employment hub with 1.3 workers for every resident, hosting more jobs than residents and attracting workers from surrounding areas. Over the 12 months to September 2025, labour force levels increased by 0.7% in Coopers Plains while employment declined by 0.0%, resulting in a rise of 0.7 percentage points in unemployment rate. In contrast, Greater Brisbane saw employment rise by 3.8%, labour force grow by 3.3%, and unemployment fall by 0.5 percentage points. State-level data to 25-Nov shows Queensland employment contracted by 0.01% (losing 1,210 jobs) with the state unemployment rate at 4.2%, broadly in line with the national rate of 4.3%. Jobs and Skills Australia's national employment forecasts from May-25 offer further insight into potential future demand within Coopers Plains. National employment is forecast to expand by 6.6% over five years and 13.7% over ten years, with growth rates differing significantly between industry sectors. Applying these projections to Coopers Plains's employment mix suggests local employment should increase by 6.5% over five years and 13.6% over ten years.
Frequently Asked Questions - Employment
Income
Income levels sit below national averages according to AreaSearch assessment
The Coopers Plains SA2 had an income level below the national average according to ATO data aggregated by AreaSearch for the financial year ending June 30, 2022. The median income among taxpayers was $47,611, with an average income of $56,175. This compares to figures for Greater Brisbane's median income of $55,645 and average income of $70,520 in the same period. Based on Wage Price Index growth of 13.99% since June 30, 2022, current estimates would be approximately $54,272 for median income and $64,034 for average income as of September 2025. According to the Census conducted in August 2021, household, family, and personal incomes all ranked modestly in Coopers Plains, between the 32nd and 41st percentiles. The predominant income cohort spanned 34.4% of locals (2,165 people) in the $1,500 - 2,999 category, reflecting patterns seen in the surrounding region where 33.3% similarly occupied this range. Housing affordability pressures were severe, with only 81.6% of income remaining after housing costs, ranking at the 39th percentile. The area's SEIFA income ranking placed it in the 5th decile.
Frequently Asked Questions - Income
Housing
Coopers Plains is characterized by a predominantly suburban housing profile, with a higher proportion of rental properties than the broader region
Dwelling structure in Coopers Plains, as per the latest Census, comprised 74.1% houses and 25.9% other dwellings (semi-detached, apartments, 'other' dwellings). In comparison, Brisbane metro had 77.8% houses and 22.2% other dwellings. Home ownership in Coopers Plains was at 23.1%, with mortgaged dwellings at 27.3% and rented dwellings at 49.6%. The median monthly mortgage repayment in the area was $1,733, lower than Brisbane metro's average of $2,100. The median weekly rent figure was $376, compared to Brisbane metro's $388. Nationally, Coopers Plains's mortgage repayments were below the Australian average of $1,863, while rents exceeded the national figure of $375.
Frequently Asked Questions - Housing
Household Composition
Coopers Plains features high concentrations of group households, with a fairly typical median household size
Family households constitute 65.3% of all households, including 26.1% couples with children, 26.1% couples without children, and 10.8% single parent families. Non-family households account for the remaining 34.7%, with lone person households at 25.3% and group households comprising 9.1%. The median household size is 2.6 people, which aligns with the Greater Brisbane average.
Frequently Asked Questions - Households
Local Schools & Education
Educational attainment in Coopers Plains aligns closely with national averages, showing typical qualification patterns and performance metrics
Educational attainment in Coopers Plains is notably high, with 40.6% of residents aged 15 years and over holding university qualifications as of the latest data. This figure surpasses both Queensland's state average of 25.7% and Australia's national average of 30.4%. The area's strong educational attainment positions it well for knowledge-based opportunities. Bachelor degrees are most prevalent at 25.3%, followed by postgraduate qualifications (12.7%) and graduate diplomas (2.6%).
Vocational credentials are also prominent, with 27.2% of residents aged 15 years and over holding such qualifications – advanced diplomas account for 10.8% and certificates for 16.4%. Educational participation is notably high in the area, with 31.2% of residents currently enrolled in formal education. This includes 10.3% in tertiary education, 7.8% in primary education, and 5.1% pursuing secondary education.
Frequently Asked Questions - Education
Schools Detail
Nearby Services & Amenities
Transport
Transport servicing is high compared to other areas nationally based on assessment of service frequency, route connectivity and accessibility
Coopers Plains has 46 active public transport stops. These include both train and bus services. There are 31 different routes operating in total, providing a combined weekly passenger trip count of 2,559.
The average distance from residents to the nearest stop is 162 meters, indicating excellent accessibility. On average, there are 365 trips per day across all routes, which translates to approximately 55 weekly trips per individual stop.
Frequently Asked Questions - Transport
Transport Stops Detail
Health
Coopers Plains's residents are healthier than average in comparison to broader Australia with prevalence of common health conditions quite low among the general population though higher than the nation's average across older, at risk cohorts
Health data for Coopers Plains shows relatively positive health outcomes, with low prevalence of common conditions among the general population compared to national averages but higher among older, at-risk cohorts. Private health cover is very low, at approximately 48% (3,021 people), compared to Greater Brisbane's 57.3%. Nationally, it stands at 55.3%.
Mental health issues and asthma are the most common conditions, affecting 8.2 and 7.2% respectively. About 72.9% of residents report no medical ailments, close to Greater Brisbane's 72.3%. The area has 12.7% seniors (800 people), with health outcomes requiring more attention than the broader population.
Frequently Asked Questions - Health
Cultural Diversity
Coopers Plains is among the most culturally diverse areas in the country based on AreaSearch assessment of a range of language and cultural background related metrics
Coopers Plains has a high level of cultural diversity, with 49.2% of its residents speaking a language other than English at home and 49.6% born overseas. Christianity is the predominant religion in Coopers Plains, accounting for 41.2% of the population. Hinduism is notably overrepresented, comprising 10.7%, which is significantly higher than the Greater Brisbane average of 3.9%.
The top three ancestry groups are Australian and English, each at 16.6%, and Other at 15.5%. There are notable differences in the representation of certain ethnic groups: Indian is overrepresented at 7.8% (compared to 3.0% regionally), Filipino at 3.6% (compared to 1.3%), and Korean at 1.3% (compared to 0.6%).
Frequently Asked Questions - Diversity
Age
Coopers Plains's young demographic places it in the bottom 15% of areas nationwide
Coopers Plains has a median age of 33 years, which is slightly younger than Greater Brisbane's average of 36 and significantly lower than Australia's national average of 38. Compared to Greater Brisbane, Coopers Plains has a higher proportion of residents aged 25-34 (23.4%) but fewer residents aged 45-54 (9.6%). This concentration of 25-34 year-olds is notably higher than the national average of 14.5%. According to post-2021 Census data, the proportion of residents aged 35-44 has increased from 15.6% to 17.9%, while the proportion of those aged 55-64 has decreased from 8.6% to 7.7%. By 2041, demographic modeling suggests significant changes in Coopers Plains's age profile, with the strongest projected growth occurring among residents aged 45-54, expected to increase by 74%, adding 446 residents to reach a total of 1,048.
