Chart Color Schemes
This analysis uses ABS Statistical Areas Level 2 (SA2) boundaries, which can materially differ from Suburbs and Localities (SAL) even when sharing similar names.
SA2 boundaries are defined by the Australian Bureau of Statistics and are designed to represent communities for statistical reporting (e.g., census and ERP).
Suburbs and Localities (SAL) represent commonly-used suburb/locality names (postal-style areas) and may use different geographic boundaries. For comprehensive analysis, consider reviewing both boundary types if available.
est. as @ -- *
ABS ERP | -- people | --
2021 Census | -- people
Sales Activity
Curious about local property values? Filter the chart to assess the volume and appreciation (including resales) trends and regional comparisons, or scroll to the map below view this information at an individual property level.
Find a Recent Sale
Sales Detail
Population
Macgregor has seen population growth performance typically on par with national averages when looking at short and medium term trends
Macgregor's population was around 6,619 as of November 2025, reflecting a 10.7% increase from the 2021 Census figure of 5,979 people. This change is inferred from ABS estimates: 6,619 in June 2024 and three additional validated addresses since the Census date. The population density was 2,460 persons per square kilometer, placing Macgregor in the upper quartile nationally. Its growth exceeded both national (8.9%) and SA3 area averages, driven primarily by overseas migration contributing approximately 94.5% of overall gains. AreaSearch uses ABS/Geoscience Australia projections for each SA2 area released in 2024 with a base year of 2022. For areas not covered post-2032, Queensland State Government's SA2 area projections from 2023 using 2021 data are adopted.
Age category splits are applied proportionally according to ABS Greater Capital Region projections released in 2023 based on 2022 data. Projected demographic shifts indicate a significant population increase by 2041, with Macgregor expected to gain 2,826 persons, reflecting a total growth of 42.7% over the 17 years.
Frequently Asked Questions - Population
Development
Residential development activity is lower than average in Macgregor according to AreaSearch's national comparison of local real estate markets
Macgregor has recorded approximately 9 residential properties granted approval annually. Over the past 5 financial years, from FY21 to FY25, 45 homes were approved, with an additional 4 approved in FY26 so far. On average, around 9 new residents arrive per dwelling constructed each year during this period.
This supply is substantially lagging demand, leading to heightened buyer competition and pricing pressures. Developers are targeting the premium market segment, with new dwellings developed at an average value of $434,000. In FY26, $5.0 million in commercial development approvals have been recorded, suggesting the area's residential character. Compared to Greater Brisbane, Macgregor shows substantially reduced construction, 78.0% below the regional average per person, which usually reinforces demand and pricing for existing properties. This level is also below average nationally, reflecting the area's maturity and possible planning constraints.
Recent development has been entirely comprised of detached houses, preserving the area's suburban nature and attracting space-seeking buyers. With around 690 people per dwelling approval, Macgregor reflects a highly mature market. According to the latest AreaSearch quarterly estimate, Macgregor is projected to add 2,826 residents by 2041. If current development rates continue, housing supply may not keep pace with population growth, potentially increasing buyer competition and supporting stronger price growth.
Frequently Asked Questions - Development
Infrastructure
Macgregor has very high levels of nearby infrastructure activity, ranking in the top 20% nationally
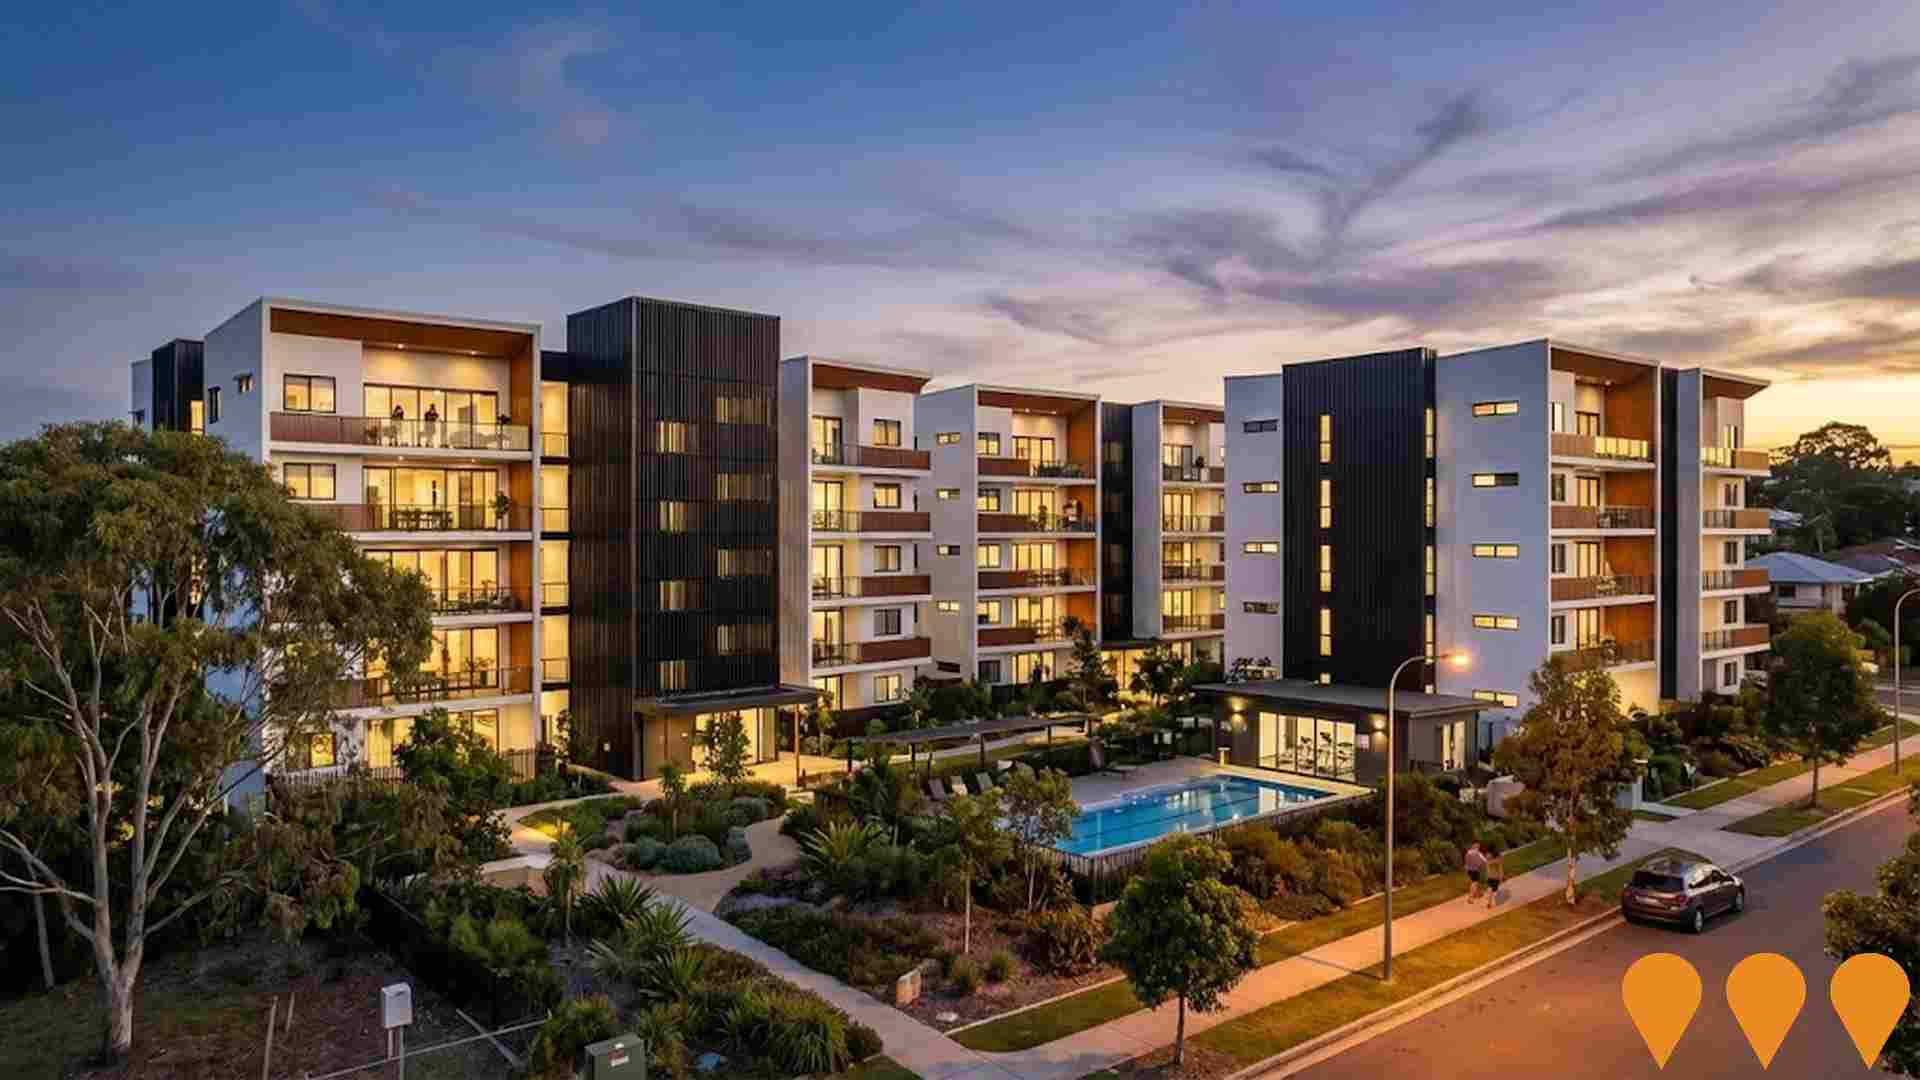
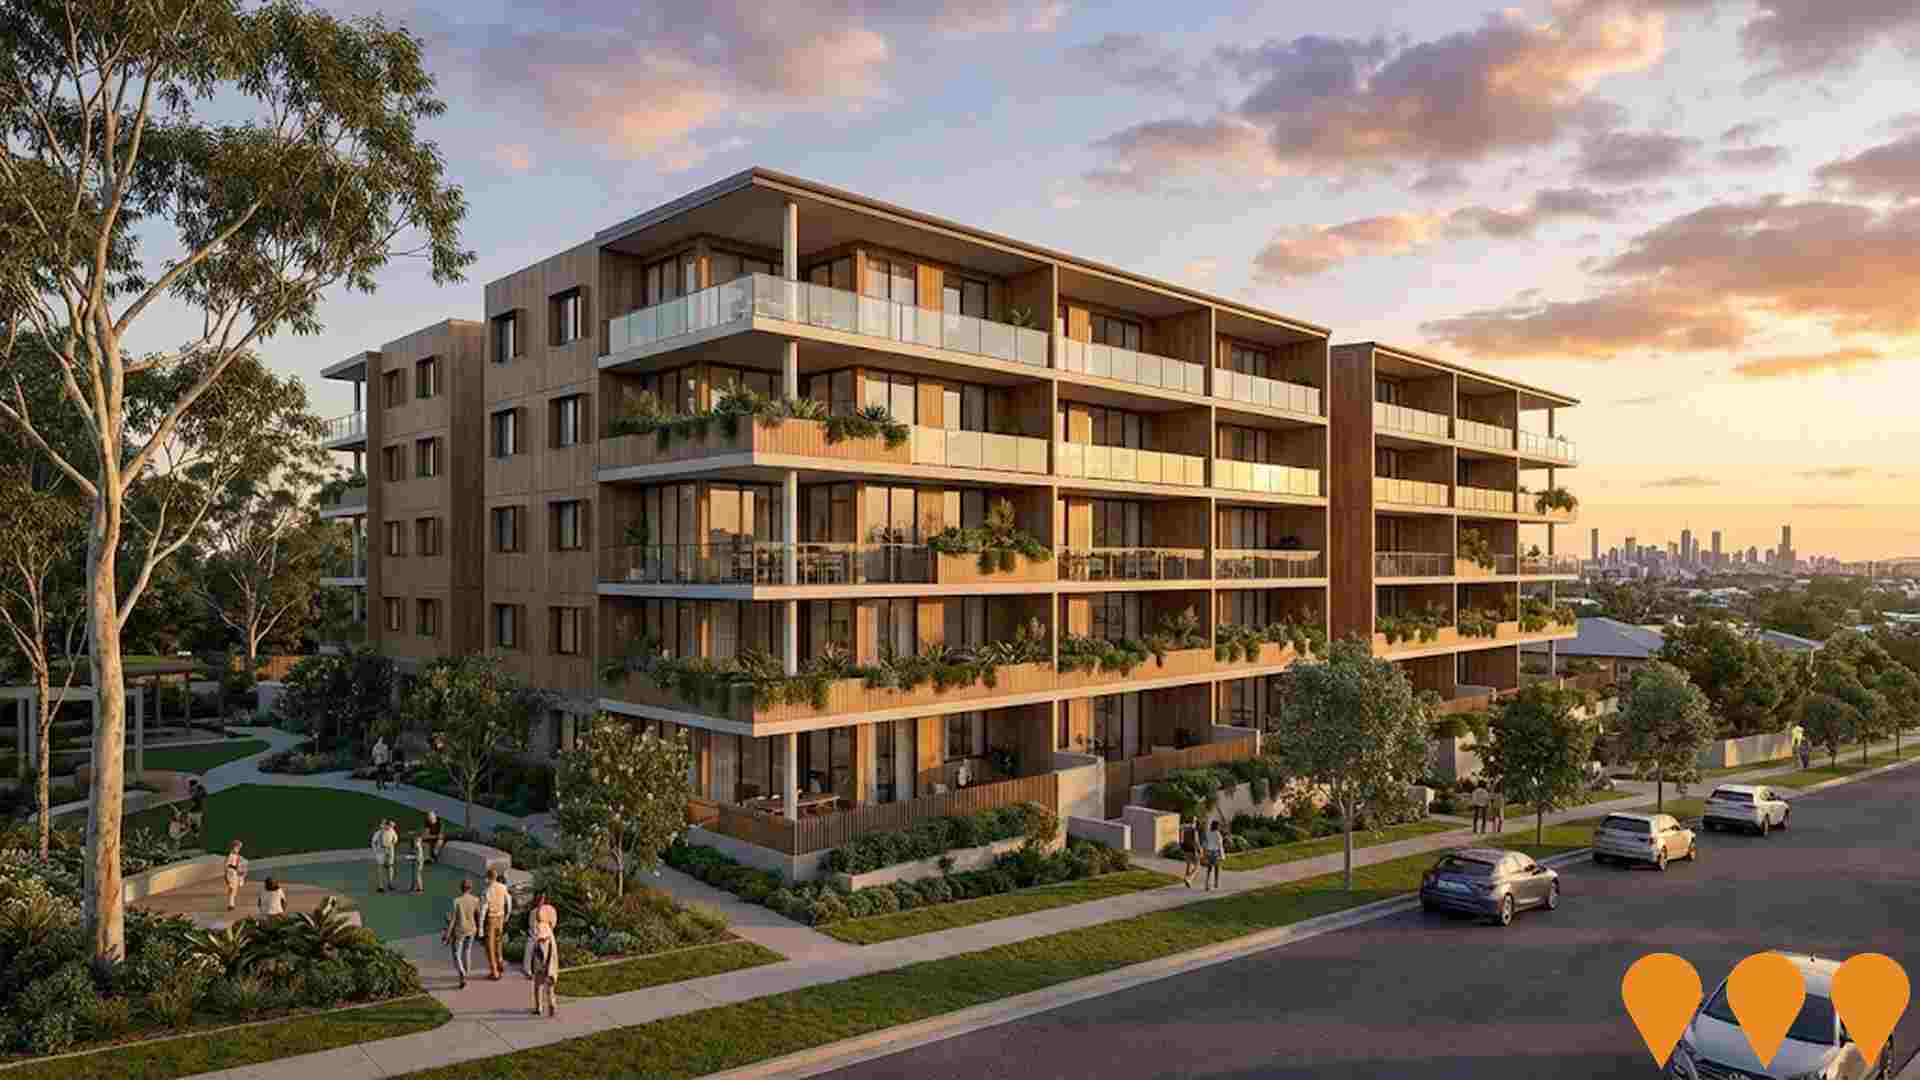
Changes in local infrastructure significantly affect an area's performance. AreaSearch has identified 29 projects that could impact the area. Notable projects include the Macgregor State High School Major Upgrade & Expansion, Macgregor Gardens Retirement Village Expansion, Salina Towers, and Archer Street Residential Developments. The following list details those most relevant.
Professional plan users can use the search below to filter and access additional projects.
INFRASTRUCTURE SEARCH
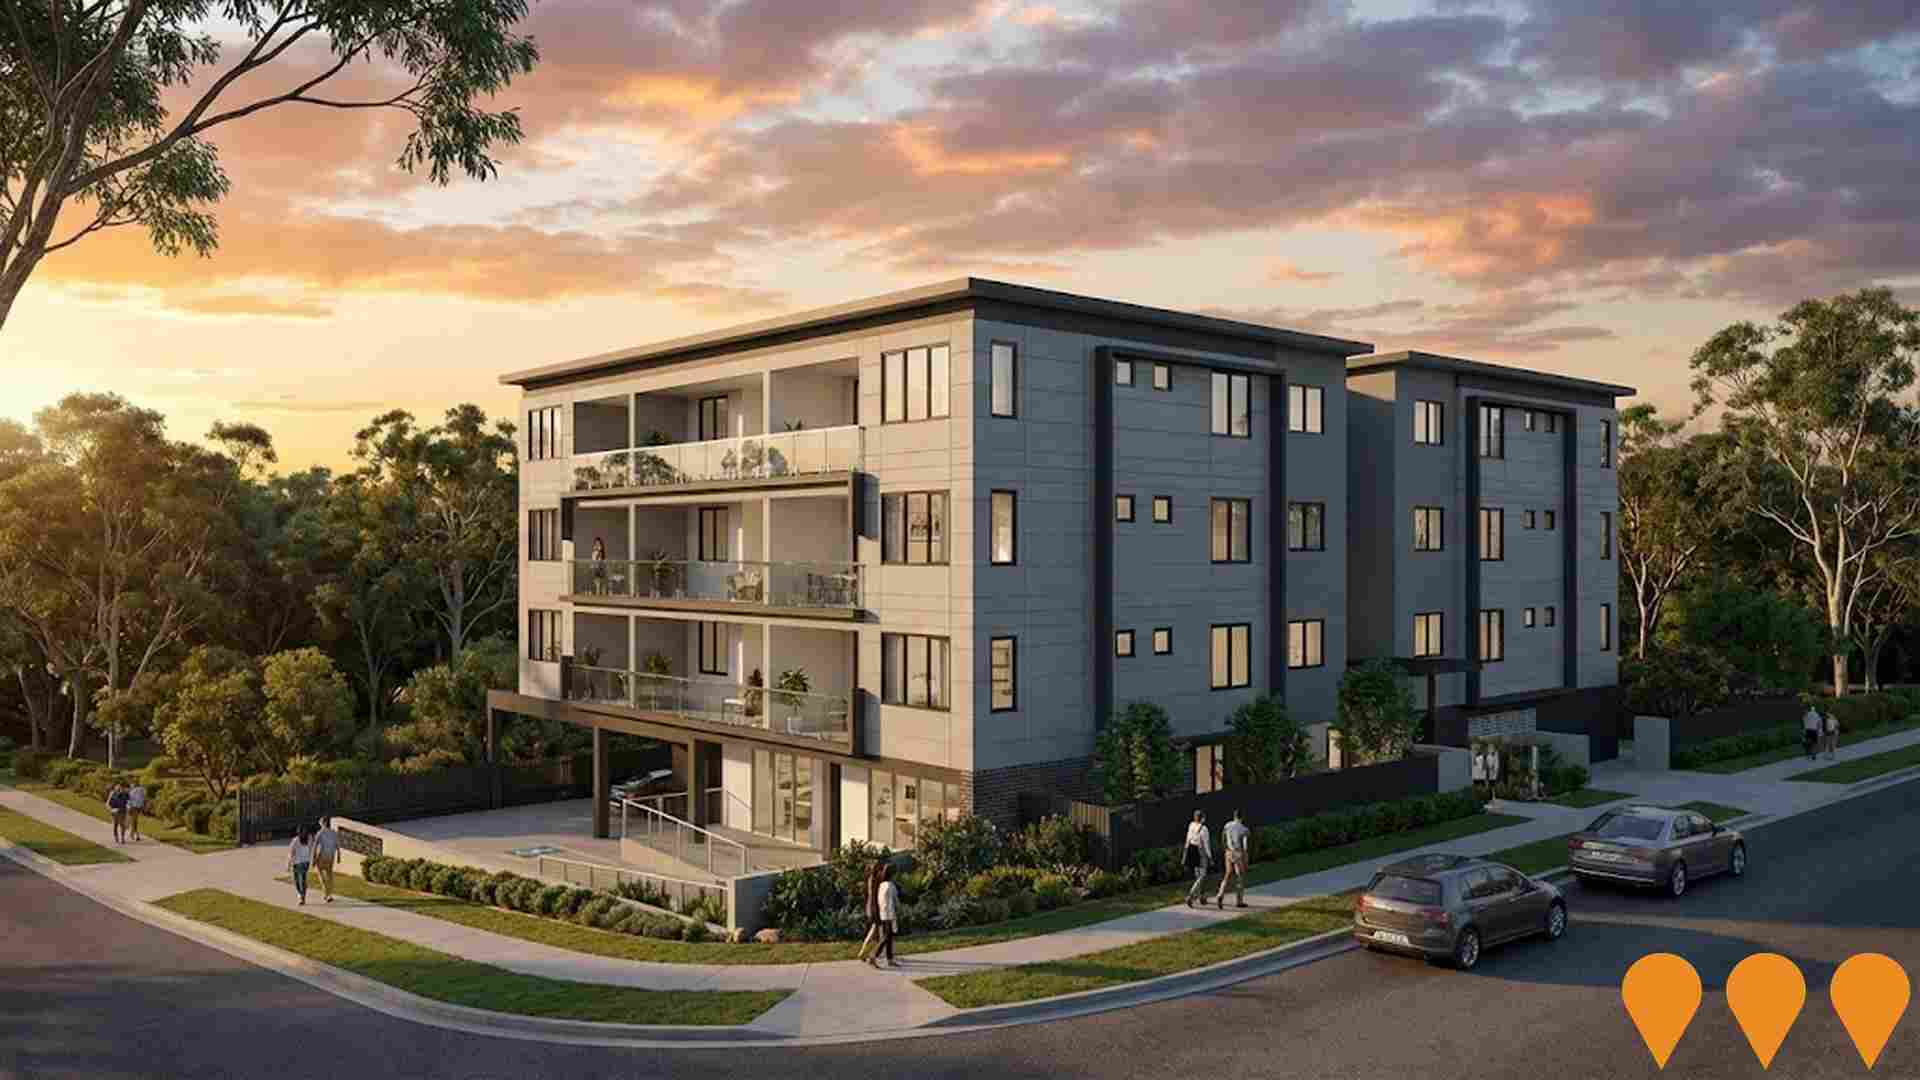
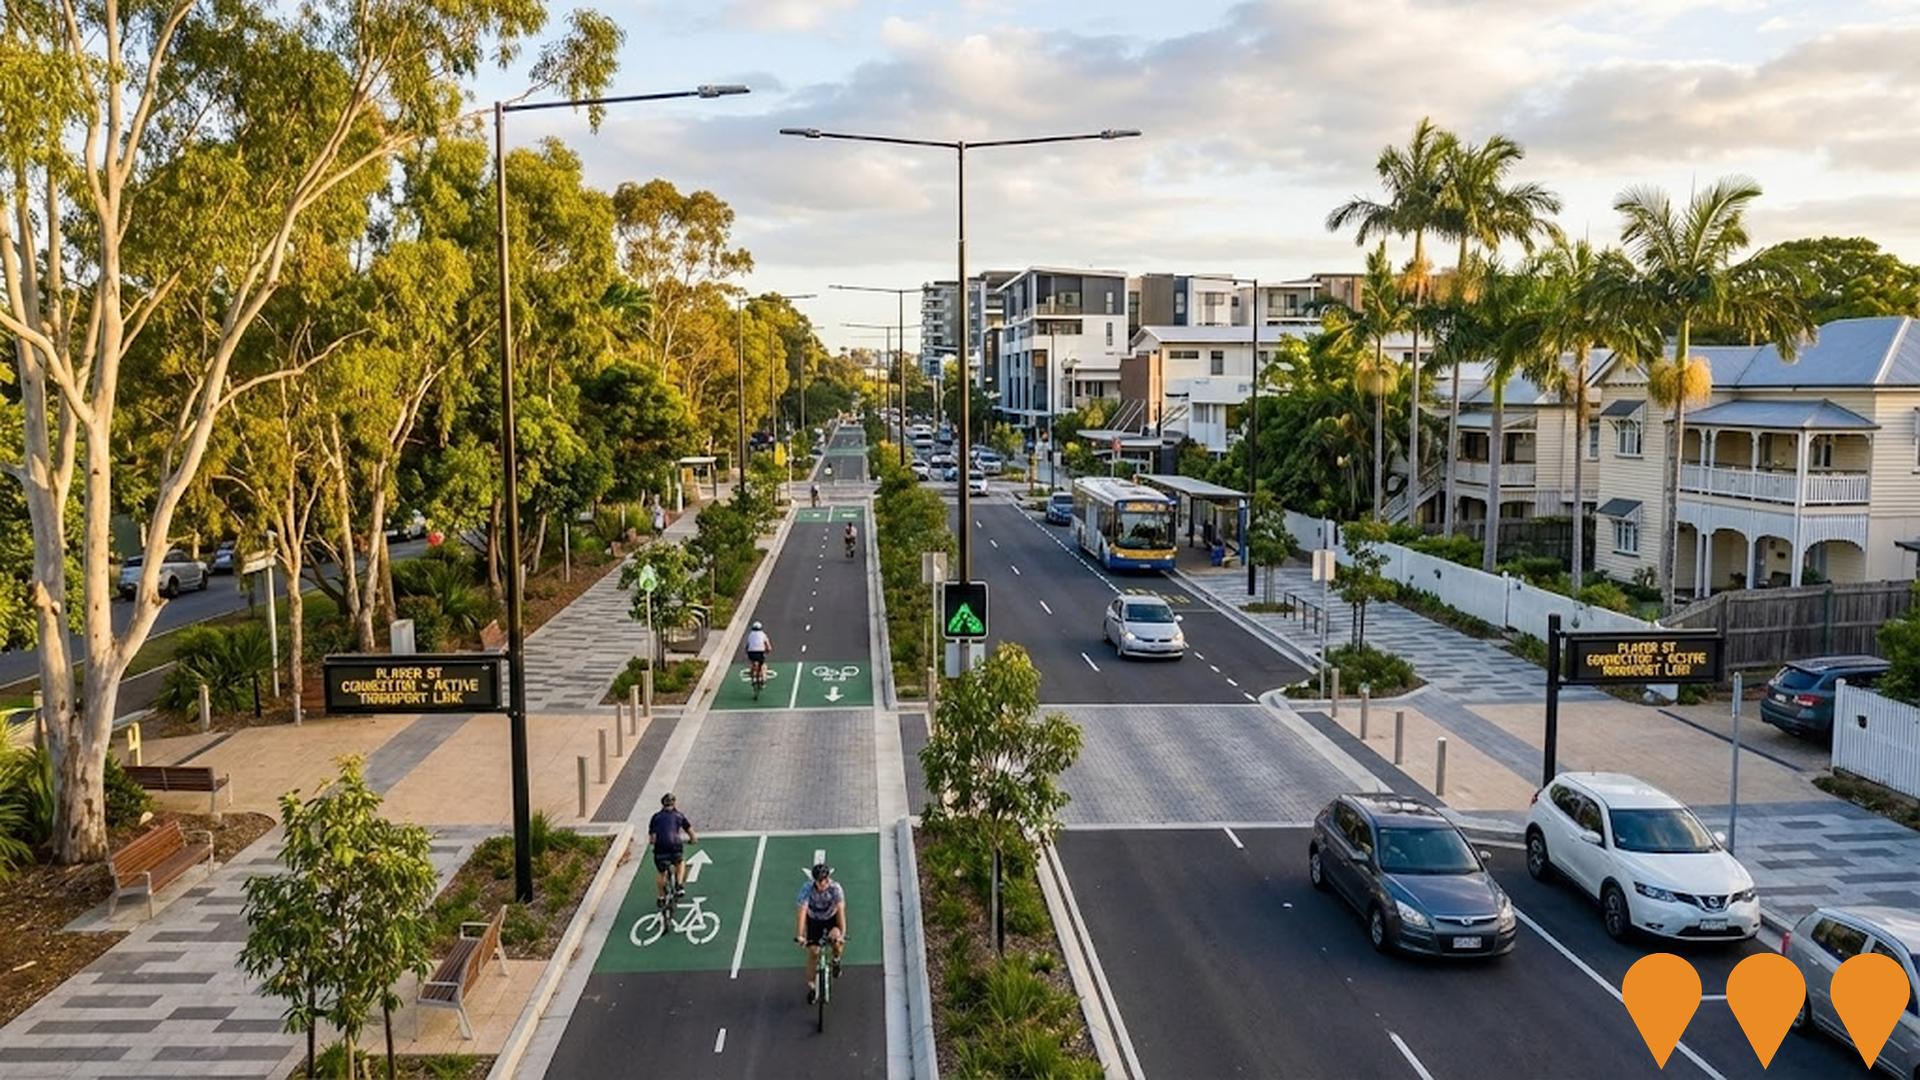
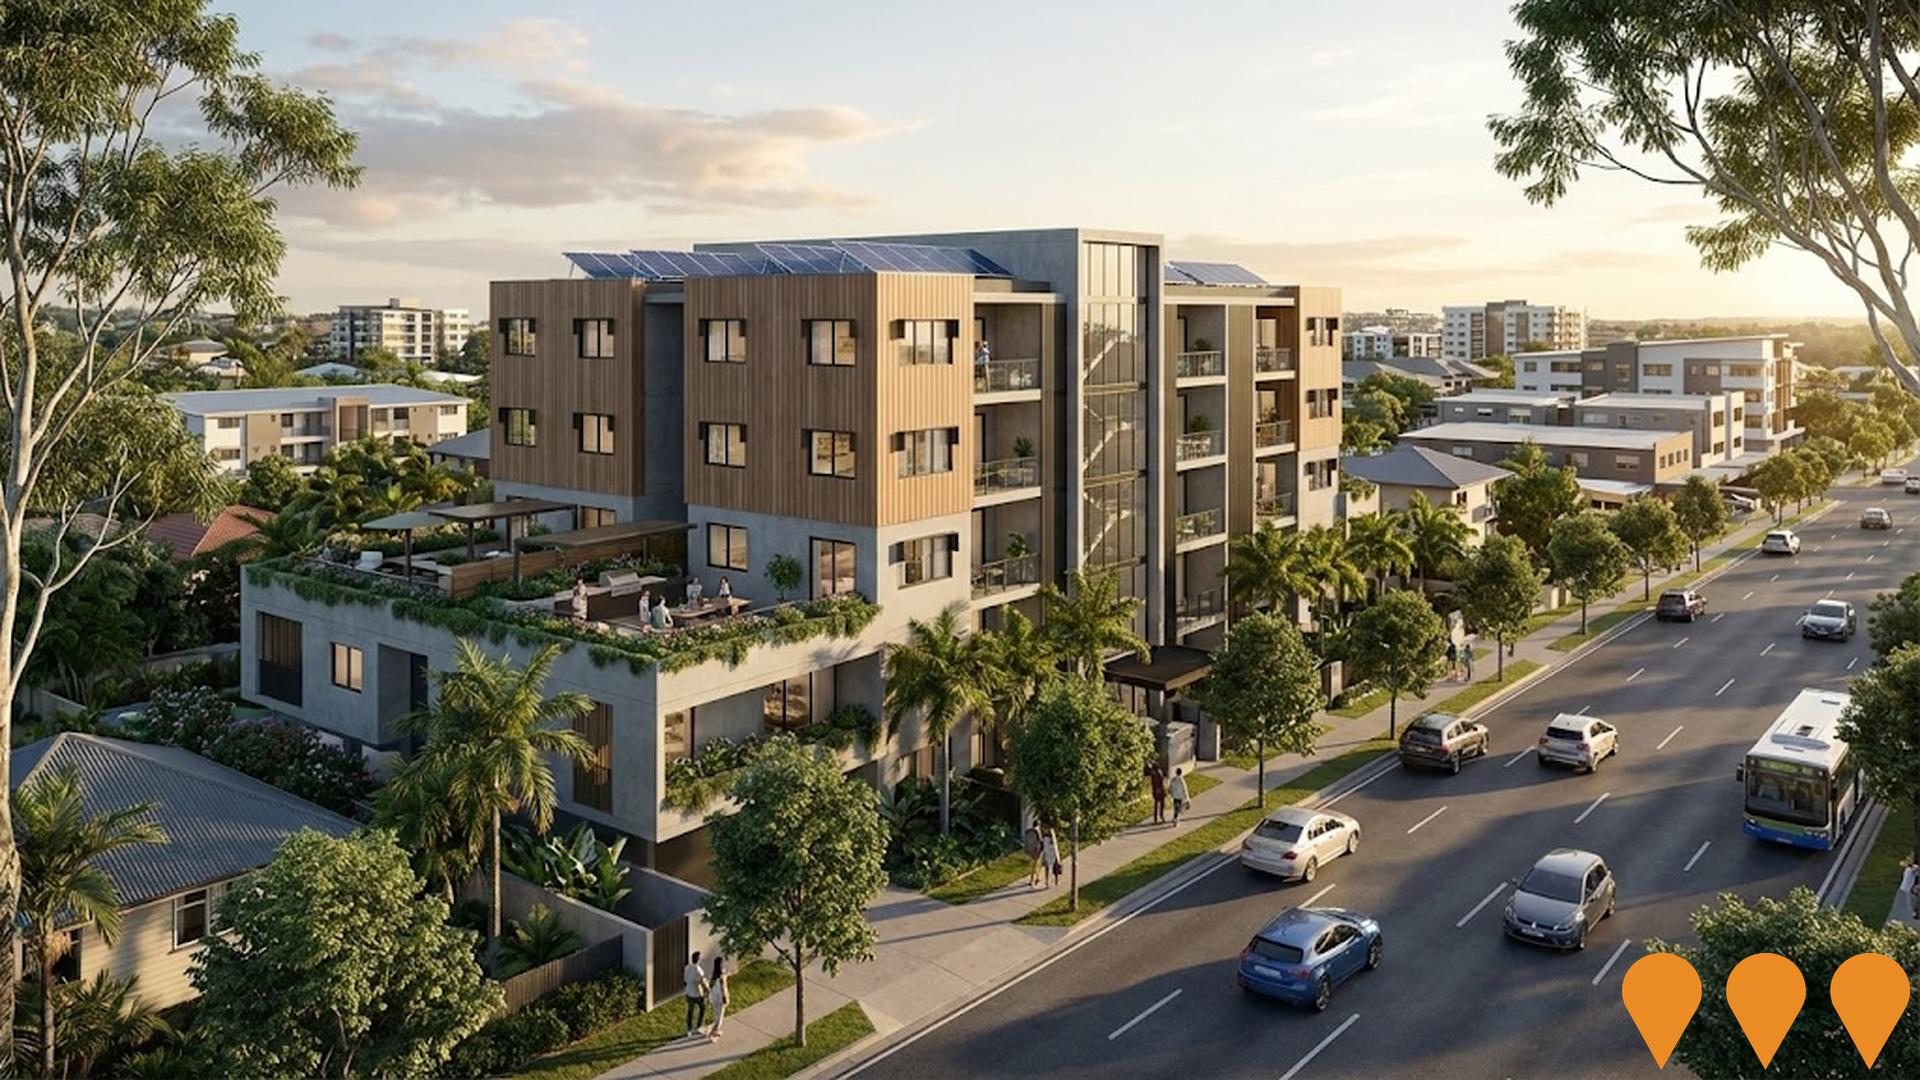
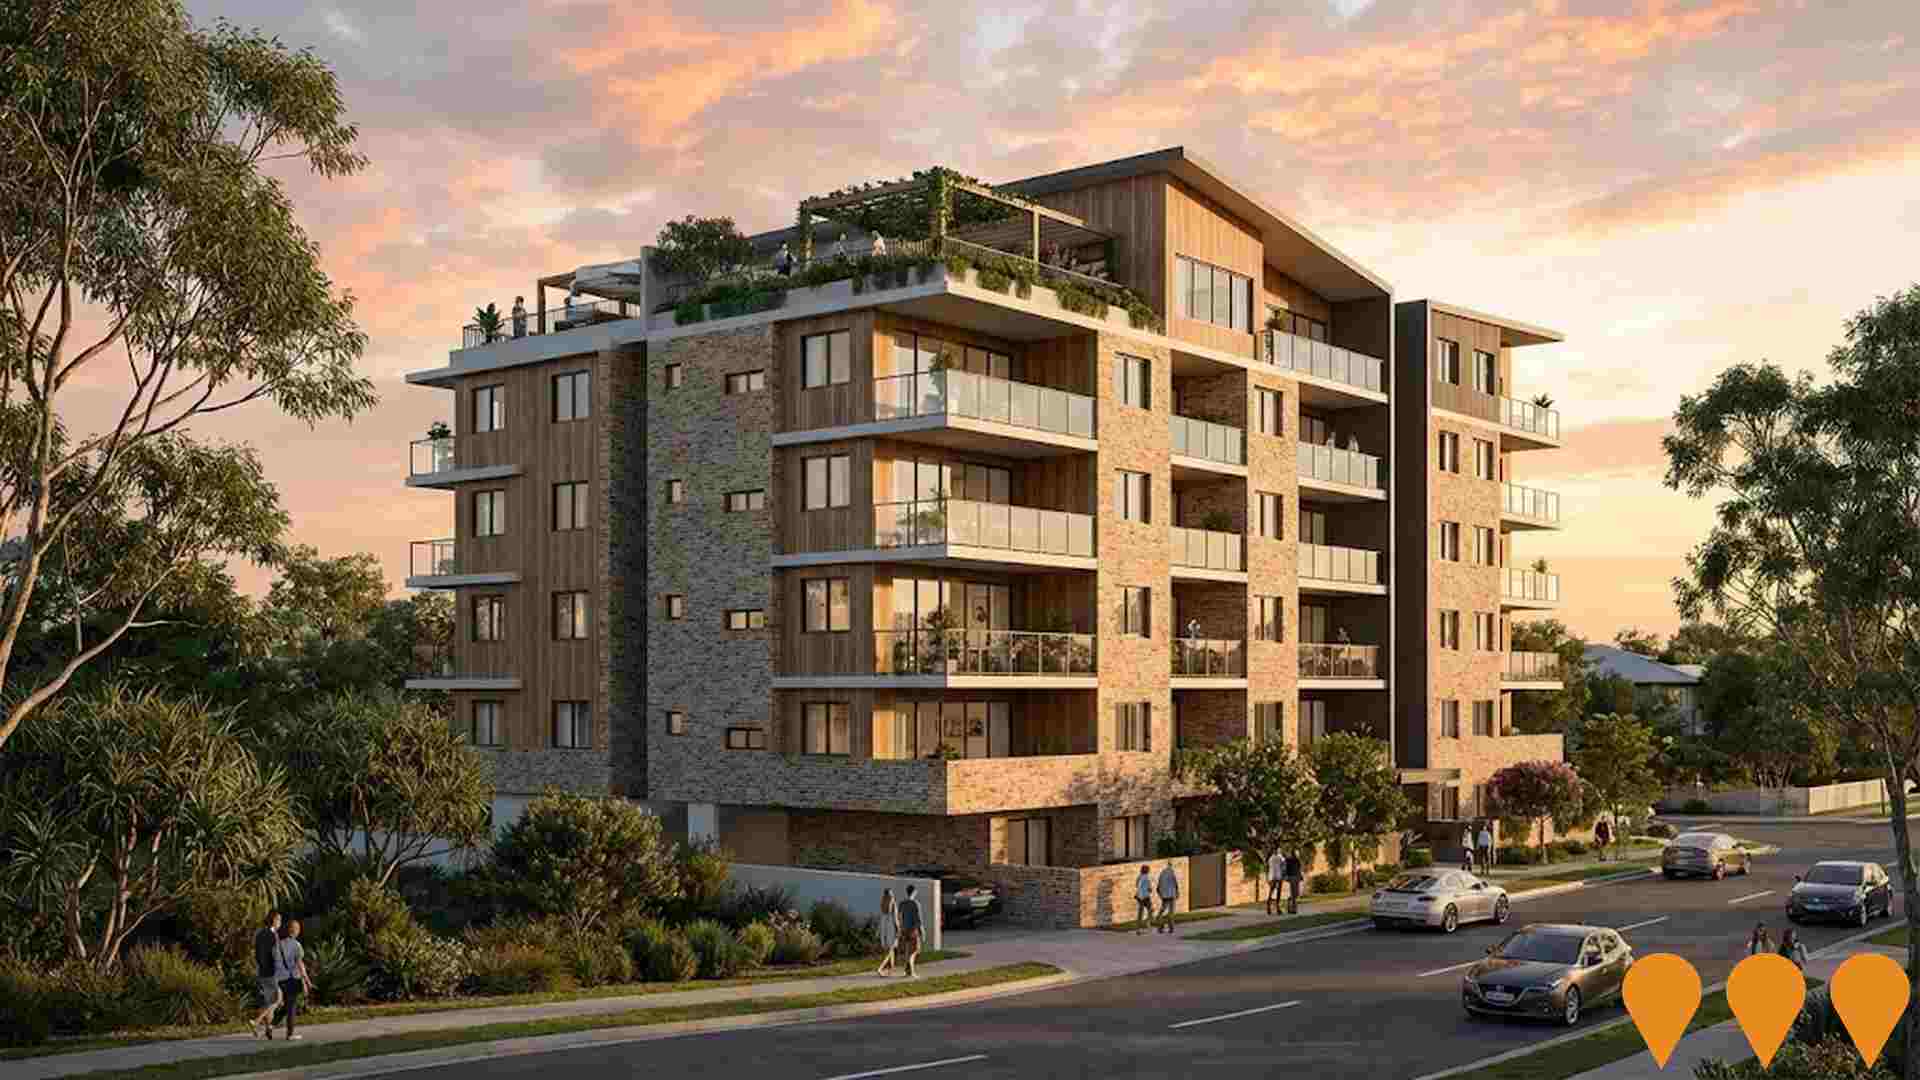
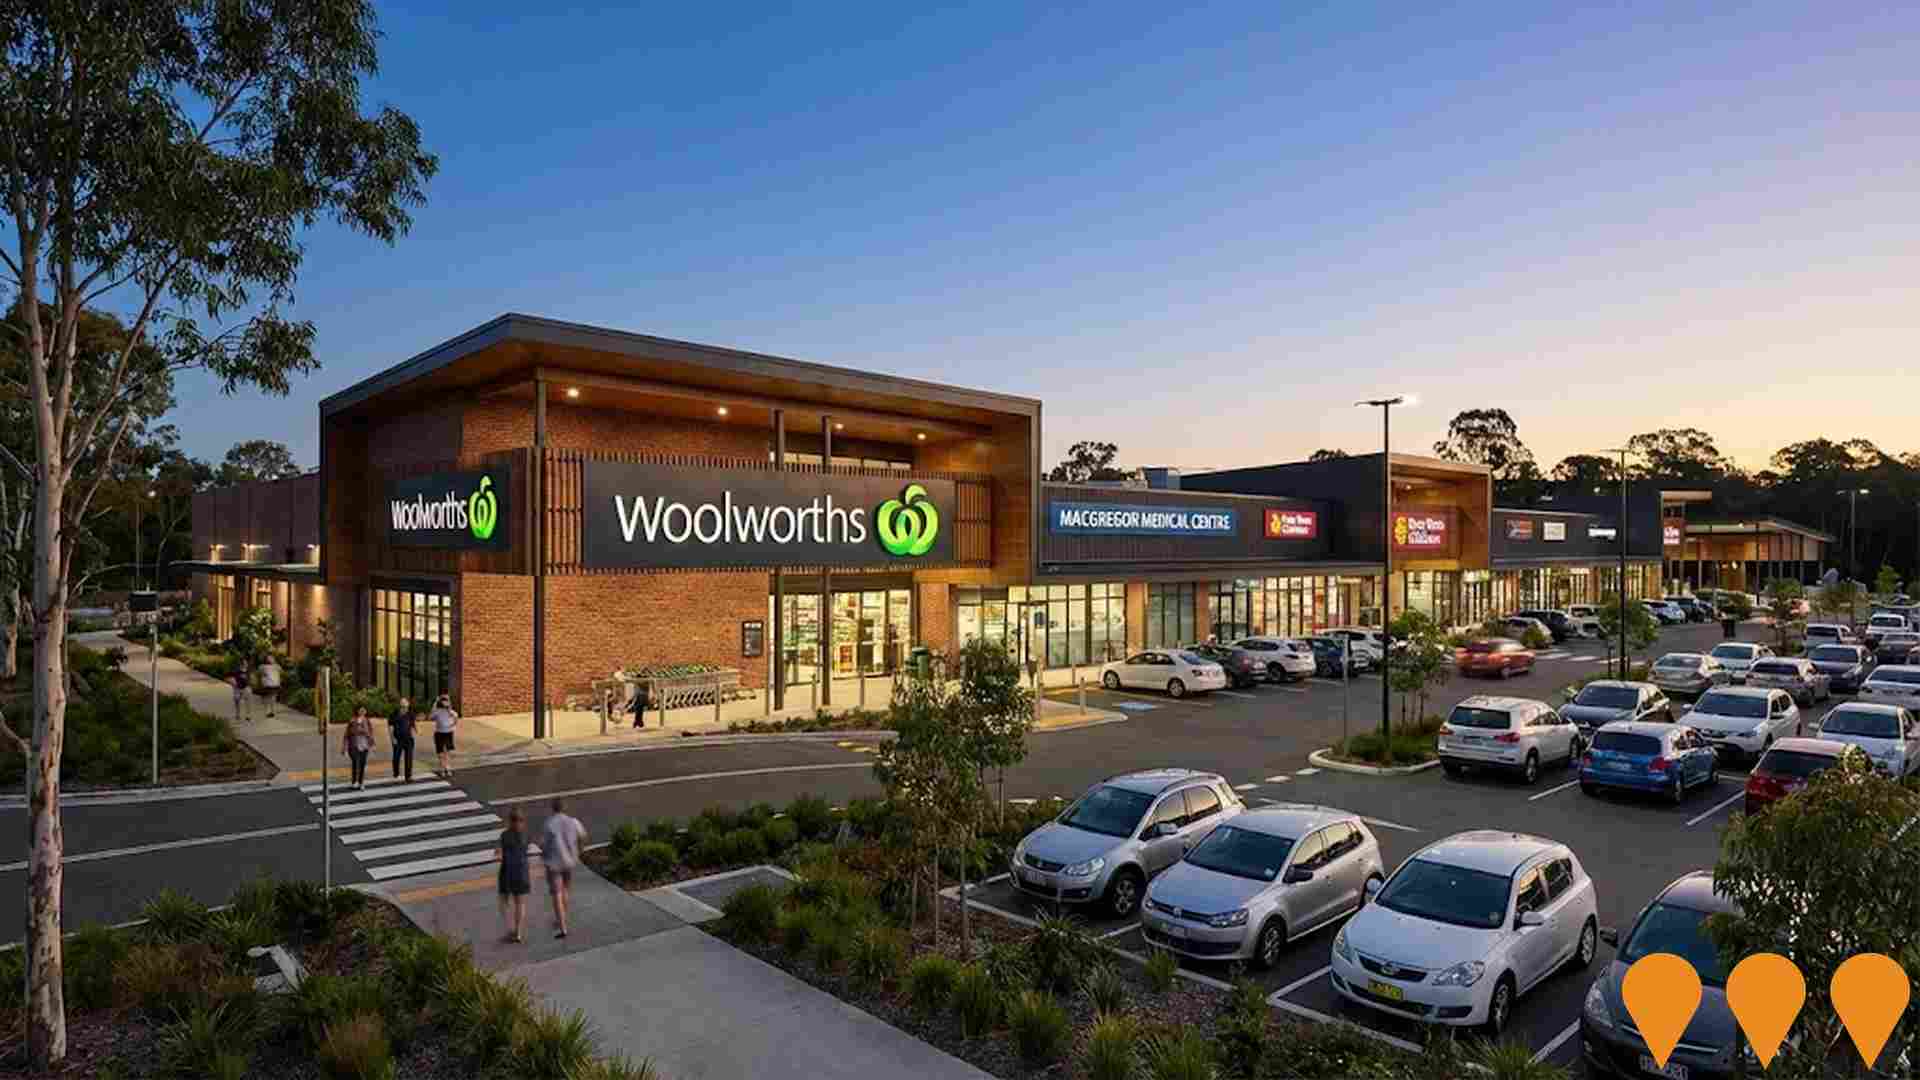
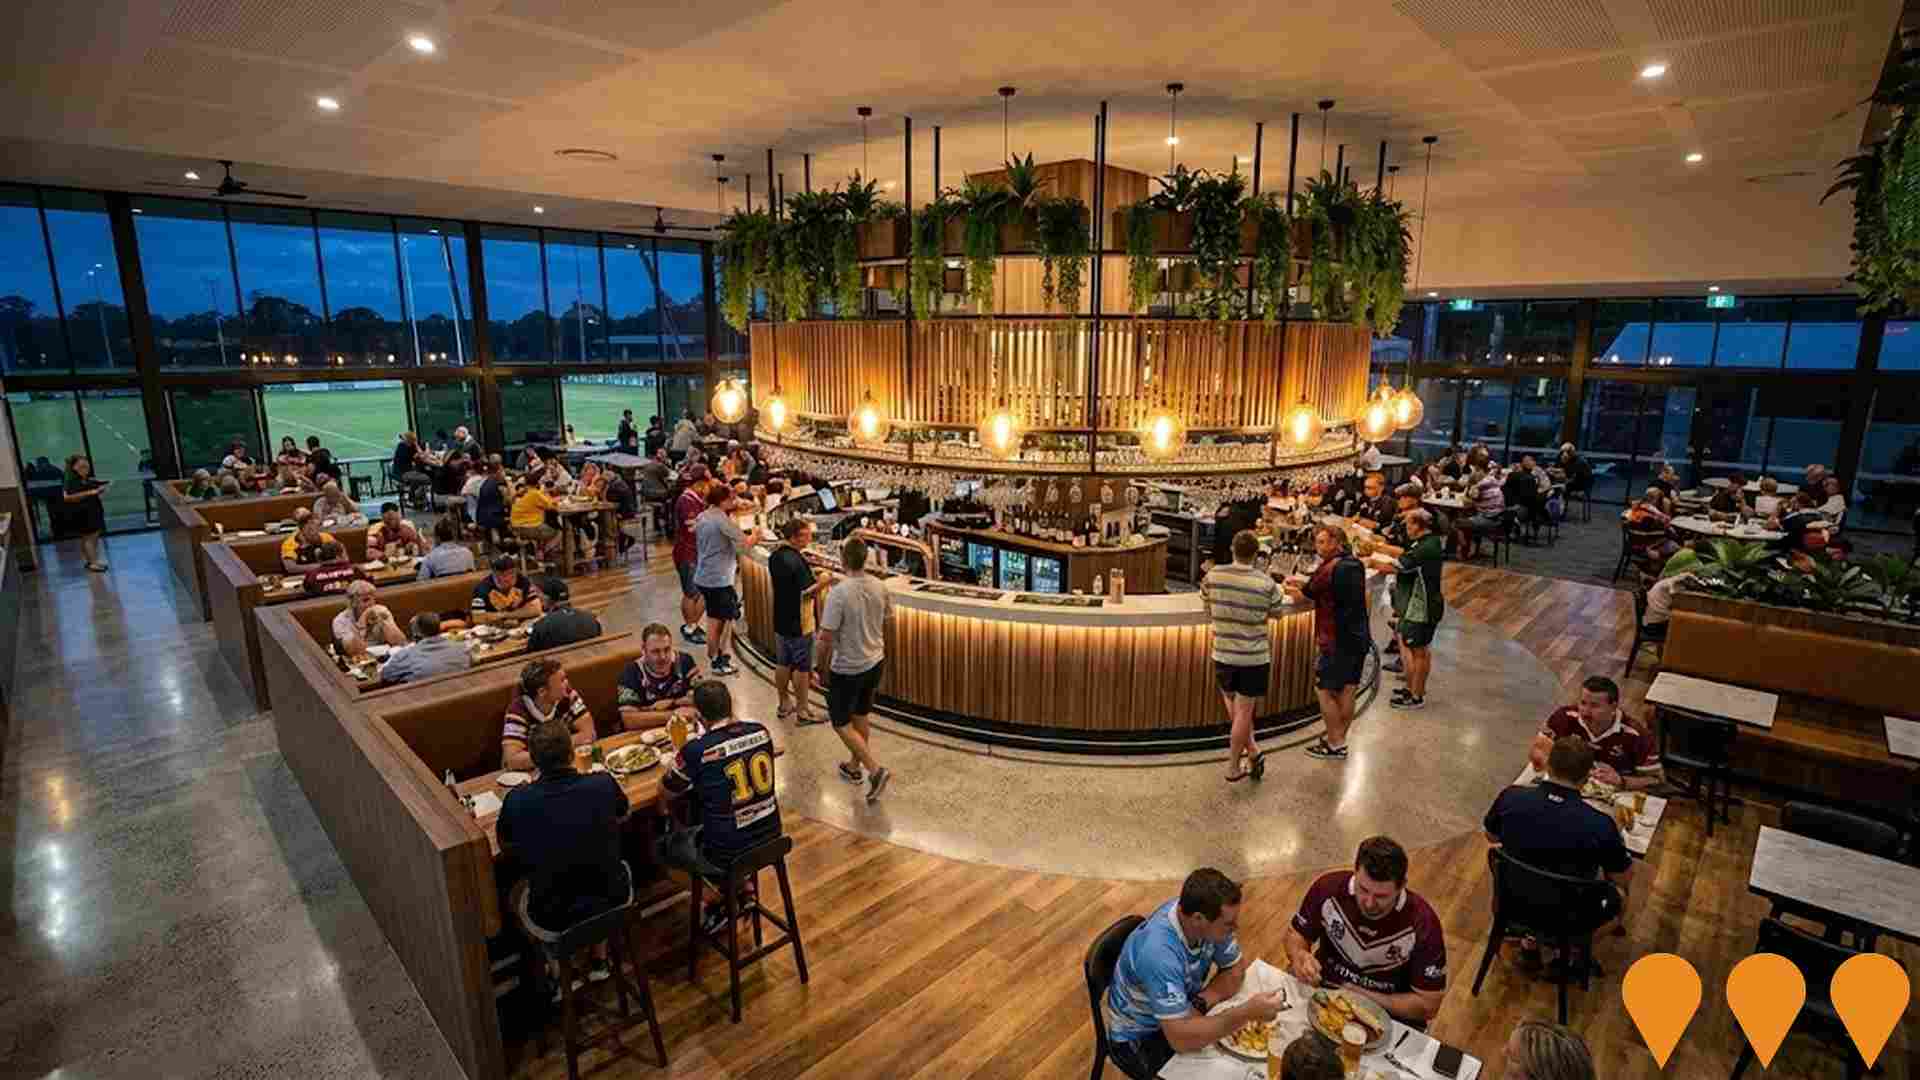
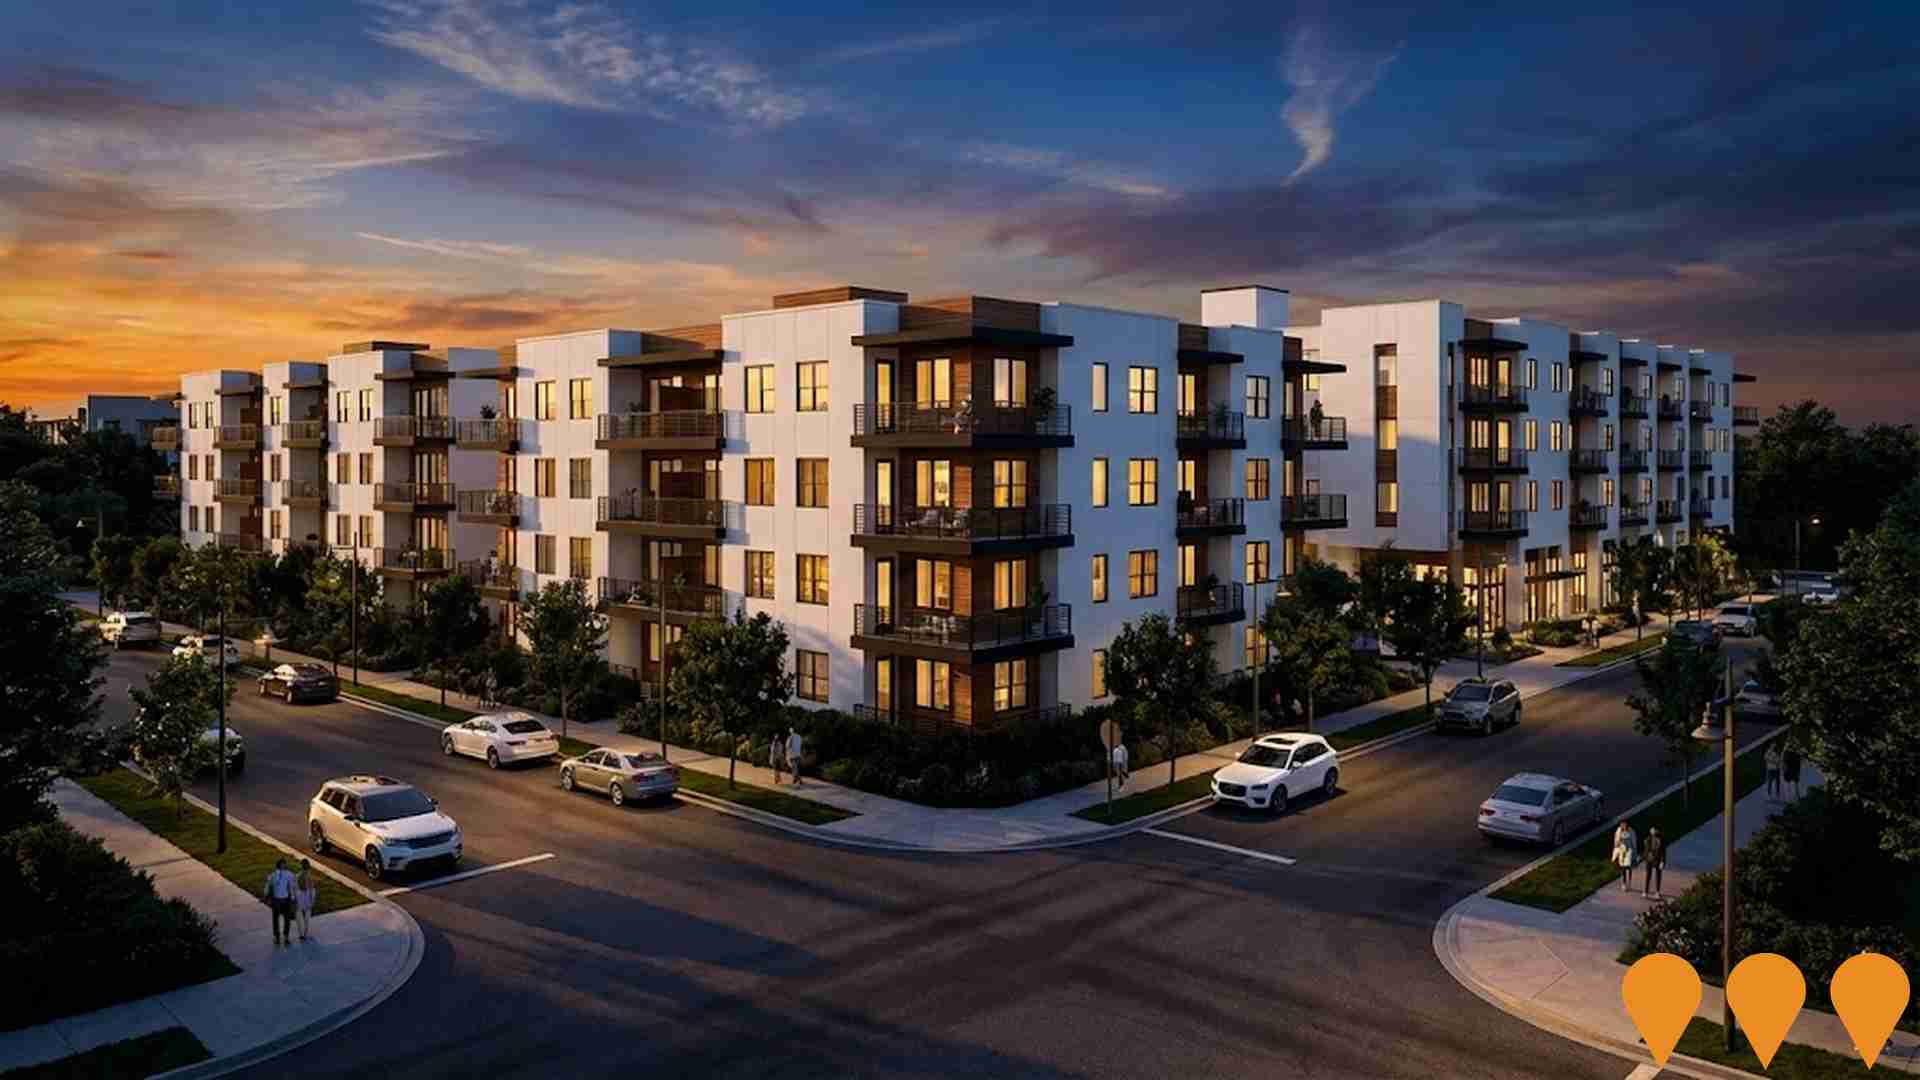
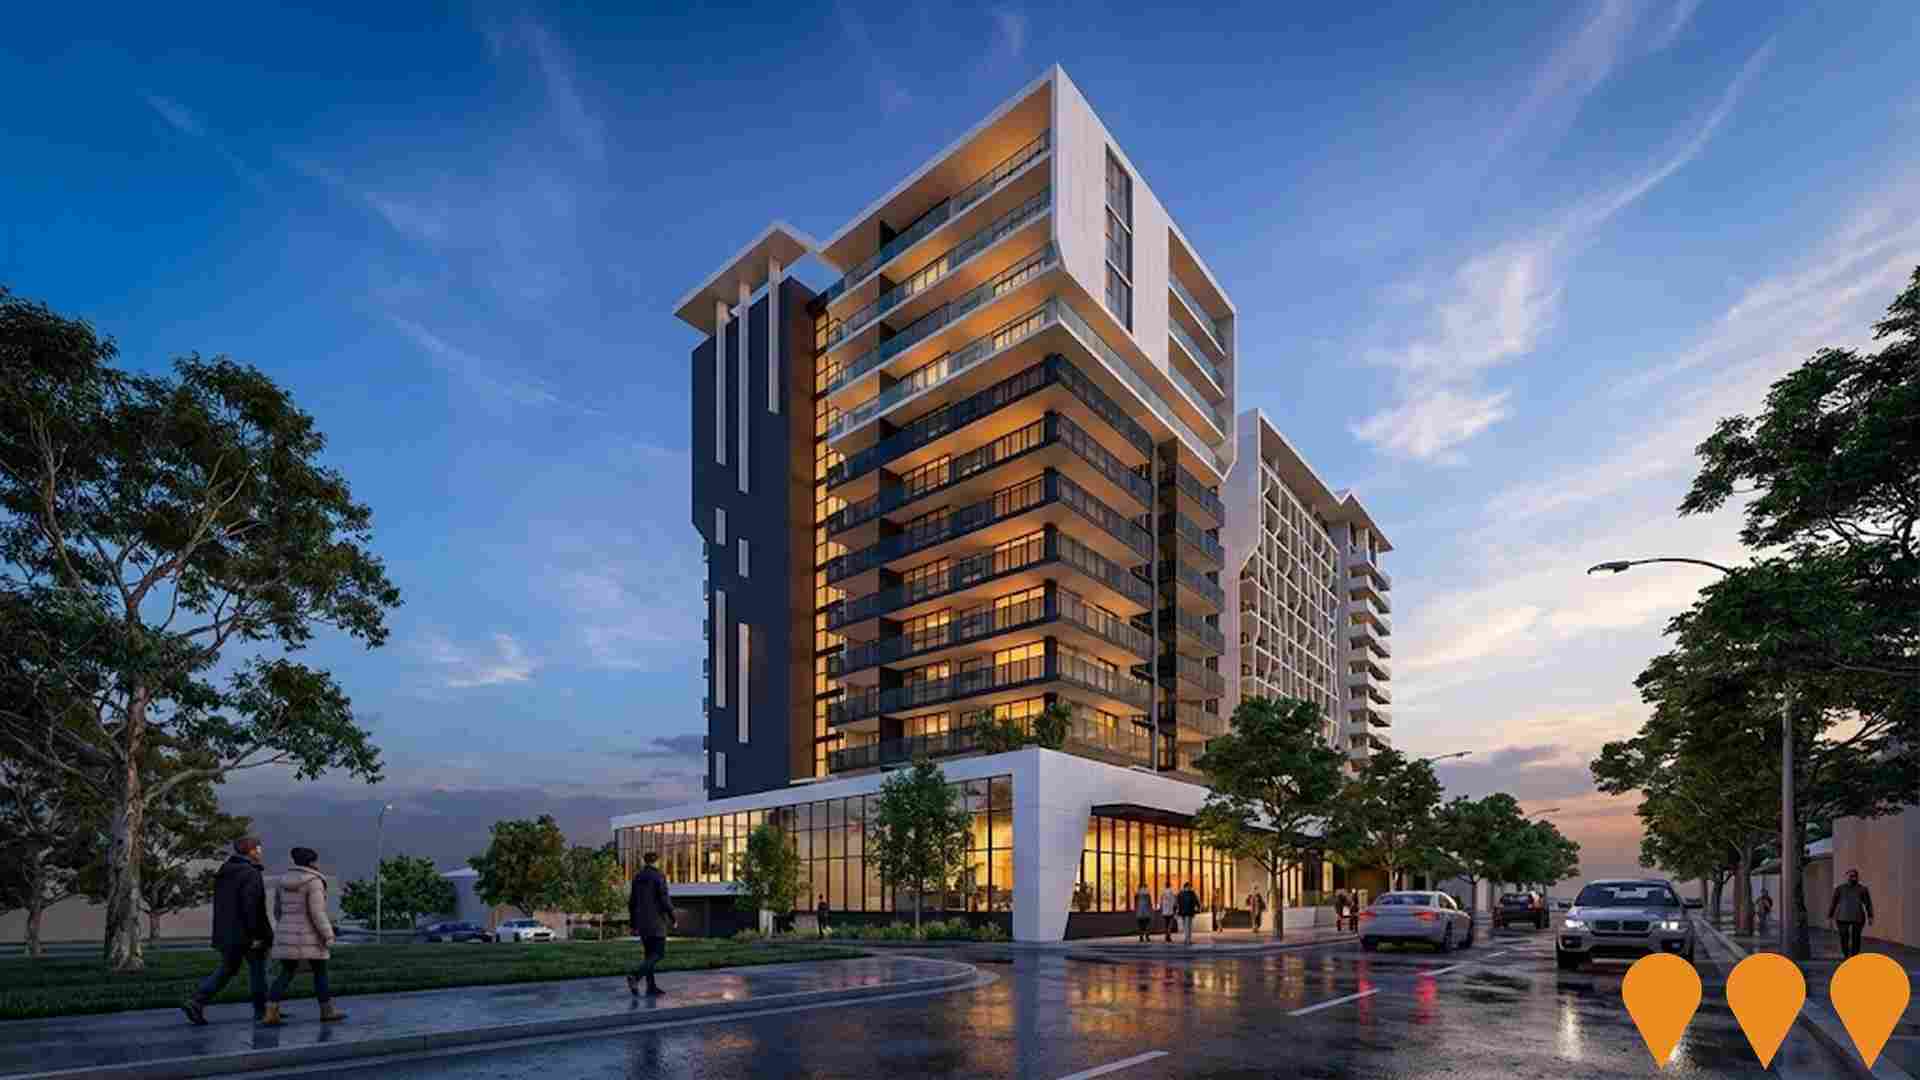
 Denotes AI-based impression for illustrative purposes only, not to be taken as definitive under any circumstances. Please follow links and conduct other investigations from the project's source for actual imagery. Developers and project owners wishing us to use original imagery please Contact Us and we will do so.
Frequently Asked Questions - Infrastructure
Mt Gravatt Centre Suburban Renewal Precinct Plan
Brisbane City Council's Mt Gravatt Centre Suburban Renewal Precinct Plan guides future growth along the Logan Road corridor from Glindemann Park to Mt Gravatt Showgrounds. The plan focuses on increased housing choice and density, mixed-use developments, vibrant village atmosphere with enhanced retail/dining and public spaces, subtropical character preservation, and improved walkability, public transport, and active transport connections. The draft plan is under public consultation until 14 December 2025 and will amend Brisbane City Plan 2014 once adopted. The precinct supports housing demand, economic development, and transforms Mt Gravatt into a more connected, vibrant, and sustainable urban hub.

Macgregor State High School Major Upgrade & Expansion
Multi-stage redevelopment including new teaching blocks, performing arts centre, sports facilities and refurbishment of existing buildings as part of Queensland Government's school infrastructure program.

Garden City Square - Macgregor
Completed neighbourhood retail centre anchored by Woolworths, medical centre, childcare and specialty stores directly serving Macgregor and surrounding suburbs.
$9.5 Million Sunnybank Community & Rugby Sports Precinct Renovation
Multi-stage renovation of the Sunnybank Community & Sports Club and associated rugby precinct, including a new sports bar, office upgrades, kitchen expansion, reimagined sunset bar and grill, improved gym, upgraded changerooms, expanded outdoor spaces, and enhanced facilities for community and sporting activities.
Macgregor Gardens Retirement Village Expansion
Stage 2 expansion adding 42 independent living units and new community facilities to the existing Macgregor Gardens retirement village.

Mode Terraces
Residential project comprising Mode Terraces (three-storey 4-bedroom terrace homes) fronting Player Street and Mode Arise (two-bedroom apartments) on the rear lot. Total 44 dwellings. Sales and enquiries are active via the project website; construction and releases are progressing in 2025.
V1 Veloway Extension
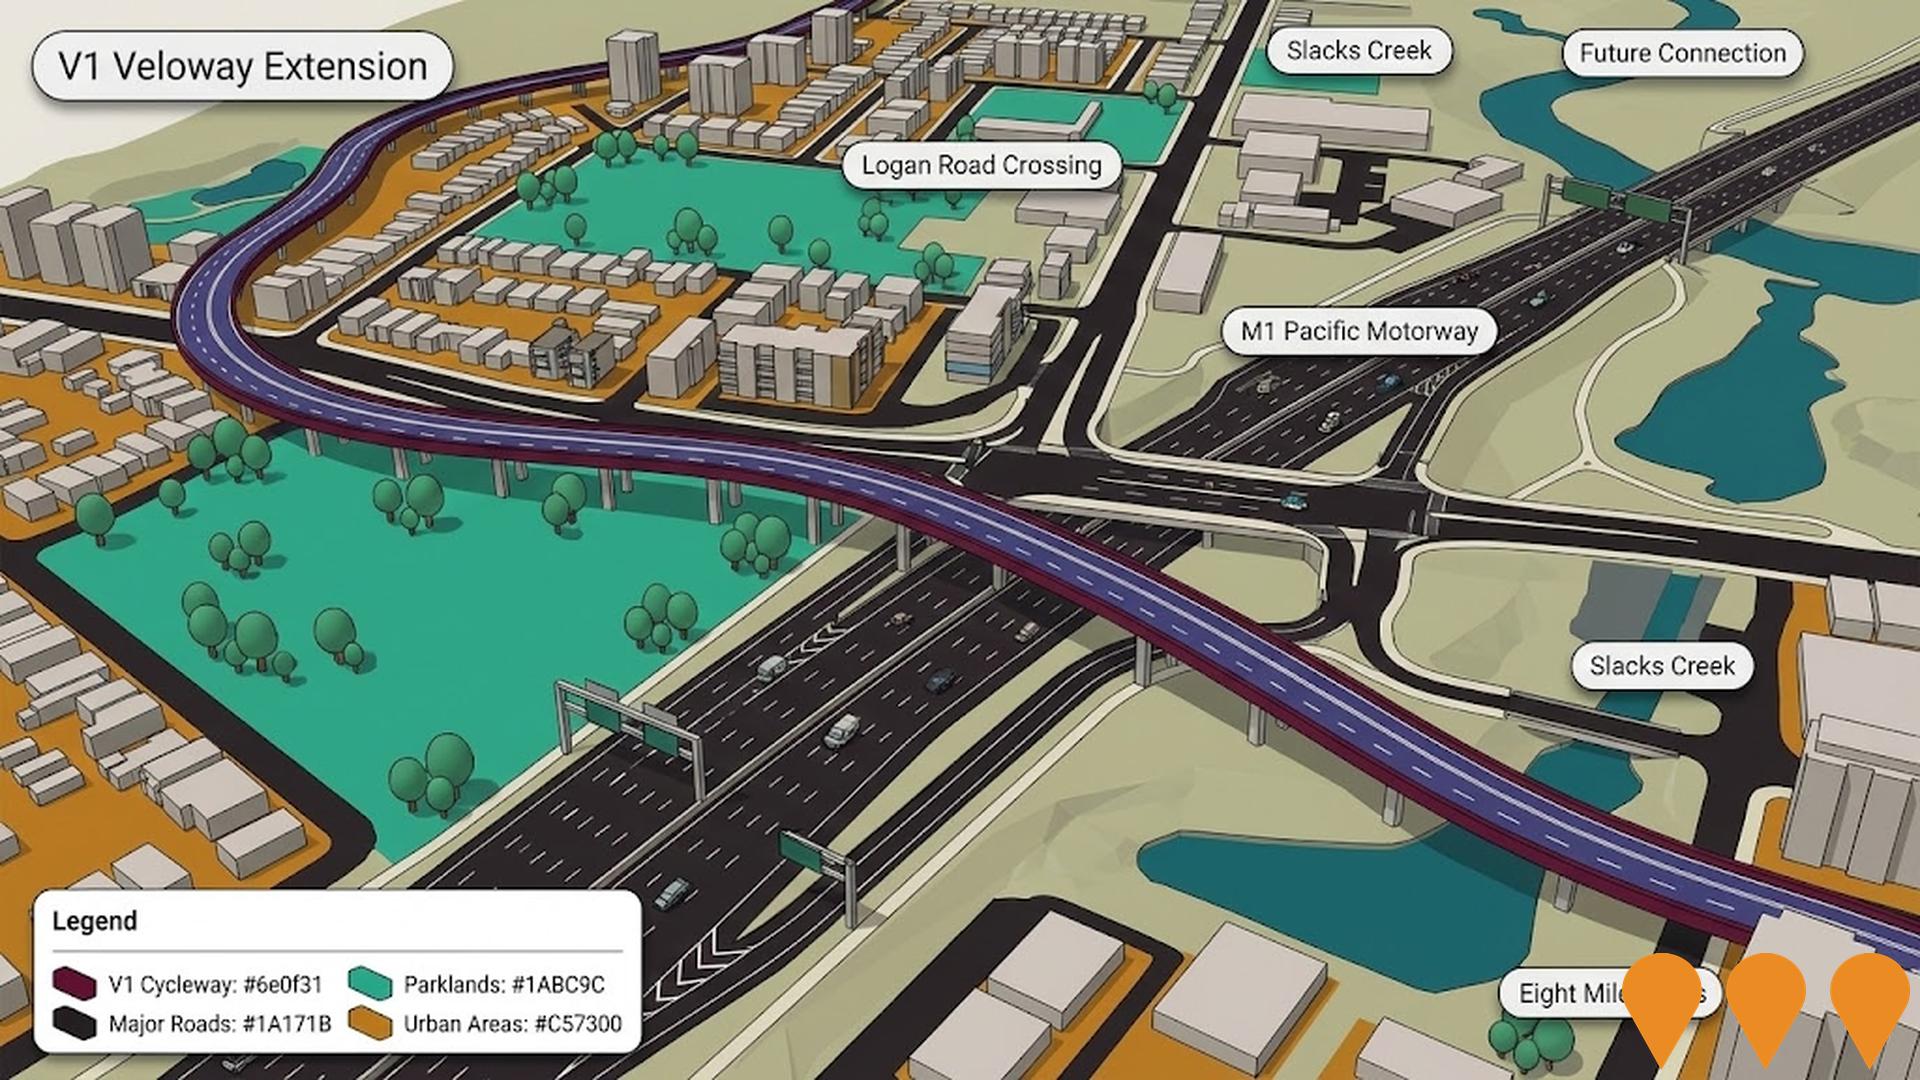
7.5km dedicated cycling pathway extension from Logan Road in Eight Mile Plains to Watland Street in Slacks Creek, including grade-separated cycleway crossing of Logan Road. Completion of missing V1 cycleway link on western side of M1 from Gateway Motorway to Paradise Road as part of Pacific Motorway upgrade. Part of Queensland's $315 million cycling infrastructure investment connecting cycling infrastructure for active transport.
Archer Street Residential Developments
Residential infill developments along Archer Street including duplex and townhouse developments. Part of gradual urban renewal to increase housing supply while maintaining neighbourhood character.
Employment
Employment conditions in Macgregor remain below the national average according to AreaSearch analysis
Macgregor has a highly educated workforce with prominent tourism and hospitality sectors. Its unemployment rate was 4.5% in the past year, with an estimated employment growth of 0.9%.
As of September 2025, 3,535 residents are employed, with an unemployment rate of 4.5%, which is 0.5% higher than Greater Brisbane's rate of 4.0%. Workforce participation in Macgregor is lower at 59.8%, compared to Greater Brisbane's 64.5%. The leading employment industries among residents are health care & social assistance, accommodation & food, and retail trade. Macgregor has a particular specialization in accommodation & food, with an employment share of 2.0 times the regional level.
Public administration & safety has limited presence in Macgregor, with 4.6% employment compared to the regional level of 7.0%. The area appears to offer limited local employment opportunities, as indicated by the count of Census working population versus resident population. Between September 2024 and September 2025, employment levels increased by 0.9%, while labour force increased by 0.8%, with unemployment remaining essentially unchanged. In comparison, Greater Brisbane recorded employment growth of 3.8% and labour force growth of 3.3%, with a decrease in unemployment of 0.5 percentage points. State-level data to November 25, 2025 shows Queensland's employment contracted by 0.01%, with the state unemployment rate at 4.2%. National employment forecasts from May 2025 suggest an expansion of 6.6% over five years and 13.7% over ten years. Applying these projections to Macgregor's employment mix, local employment is estimated to increase by 6.6% over five years and 13.6% over ten years.
Frequently Asked Questions - Employment
Income
Income levels sit below national averages according to AreaSearch assessment
The Macgregor SA2 had a median taxpayer income of $40,094 and an average of $52,847 in the financial year 2022, according to postcode level ATO data aggregated by AreaSearch. This was lower than national averages compared to Greater Brisbane's median income of $55,645 and average income of $70,520 during the same period. By September 2025, estimated incomes would be approximately $45,703 (median) and $60,240 (average), based on a 13.99% growth in Wage Price Index since financial year 2022. In 2021 Census figures, individual incomes were at the 16th percentile ($634 weekly), while household income was at the 50th percentile. Income analysis showed that the $1,500 - $2,999 bracket dominated with 33.1% of residents (2,190 people), aligning with regional levels where this cohort represented 33.3%. High housing costs consumed 15.3% of income, but strong earnings placed disposable income at the 52nd percentile. The area's SEIFA income ranking placed it in the 5th decile.
Frequently Asked Questions - Income
Housing
Macgregor is characterized by a predominantly suburban housing profile, with above-average rates of outright home ownership
Macgregor's dwelling structure, as per the latest Census, consisted of 85.7% houses and 14.2% other dwellings (semi-detached, apartments, 'other' dwellings). This compares to Brisbane metro's 74.0% houses and 26.0% other dwellings. Home ownership in Macgregor stood at 38.7%, with the rest of dwellings either mortgaged (24.7%) or rented (36.5%). The median monthly mortgage repayment was $1,950, below Brisbane metro's average of $2,100. The median weekly rent in Macgregor was $430, compared to Brisbane metro's $420. Nationally, Macgregor's mortgage repayments were higher than the Australian average of $1,863, while rents were substantially above the national figure of $375.
Frequently Asked Questions - Housing
Household Composition
Macgregor features high concentrations of group households, with a higher-than-average median household size
Family households constitute 70.8% of all households, including 30.1% couples with children, 26.3% couples without children, and 12.1% single parent families. Non-family households account for the remaining 29.2%, with lone person households at 17.9% and group households comprising 11.0%. The median household size is 3.0 people, larger than the Greater Brisbane average of 2.8.
Frequently Asked Questions - Households
Local Schools & Education
The educational profile of Macgregor exceeds national averages, with above-average qualification levels and academic performance metrics
Educational attainment in Macgregor is notably higher than broader benchmarks. As of the latest data, 40.2% of residents aged 15 and above hold university qualifications, compared to 25.7% in Queensland (QLD) and 30.4% nationally. Bachelor degrees are most prevalent at 25.9%, followed by postgraduate qualifications at 11.9% and graduate diplomas at 2.4%. Vocational credentials are also prominent, with 25.3% of residents holding such qualifications, including advanced diplomas (11.1%) and certificates (14.2%).
Educational participation is high, with 32.9% of residents currently enrolled in formal education. This includes 11.4% in tertiary education, 6.8% in primary education, and 6.2% pursuing secondary education.
Frequently Asked Questions - Education
Schools Detail
Nearby Services & Amenities
Transport
Transport servicing is good compared to other areas nationally based on assessment of service frequency, route connectivity and accessibility
Transport analysis indicates 35 active stops in Macgregor, all bus services. These are covered by 15 routes offering 2018 weekly passenger trips. Residents enjoy excellent accessibility, with an average distance of 163 meters to the nearest stop.
Daily service frequency is 288 trips across all routes, resulting in about 57 weekly trips per individual stop.
Frequently Asked Questions - Transport
Transport Stops Detail
Health
Macgregor's residents boast exceedingly positive health performance metrics with very low prevalence of common health conditions across all age groups
Macgregor demonstrates excellent health outcomes with low prevalence of common conditions across all ages. Private health cover rate is approximately 47%, compared to Greater Brisbane's 52.4% and the national average of 55.3%. The most prevalent conditions are asthma (5.3%) and mental health issues (5.2%), while 78.3% report no medical ailments, higher than Greater Brisbane's 75.7%.
There are 983 residents aged 65 and over, comprising 14.9% of the population. Senior health outcomes align with the general population's profile.
Frequently Asked Questions - Health
Cultural Diversity
Macgregor is among the most culturally diverse areas in the country based on AreaSearch assessment of a range of language and cultural background related metrics
Macgregor has a high level of cultural diversity, with 60.0% of its population speaking a language other than English at home and 59.9% born overseas. Christianity is the predominant religion in Macgregor, making up 38.0% of people. Buddhism is overrepresented compared to Greater Brisbane, comprising 8.9% of Macgregor's population versus 4.5%.
The top three ancestry groups are Chinese (29.6%), English (14.8%), and Other (13.6%). Korean (2.8%) and Russian (0.7%) are notably overrepresented compared to regional averages, while Vietnamese is also higher at 2.6% versus 1.1%.
Frequently Asked Questions - Diversity
Age
Macgregor hosts a young demographic, positioning it in the bottom quartile nationwide
Macgregor has a median age of 33 years, which is slightly lower than Greater Brisbane's average of 36 and significantly below the national average of 38. Compared to Greater Brisbane, Macgregor has a higher proportion of residents aged 25-34 (22.5%) but fewer residents aged 5-14 (9.1%). This concentration of 25-34 year-olds is notably higher than the national figure of 14.5%. Post-2021 Census data indicates that the 25 to 34 age group has increased from 20.2% to 22.5%, while the 65 to 74 cohort has decreased from 8.7% to 7.2%. By 2041, demographic modeling projects significant changes in Macgregor's age profile, with the strongest growth expected in the 45 to 54 cohort, which is projected to grow by 72%, adding 514 residents and reaching a total of 1,231.
