Chart Color Schemes
This analysis uses ABS Statistical Areas Level 2 (SA2) boundaries, which can materially differ from Suburbs and Localities (SAL) even when sharing similar names.
SA2 boundaries are defined by the Australian Bureau of Statistics and are designed to represent communities for statistical reporting (e.g., census and ERP).
Suburbs and Localities (SAL) represent commonly-used suburb/locality names (postal-style areas) and may use different geographic boundaries. For comprehensive analysis, consider reviewing both boundary types if available.
est. as @ -- *
ABS ERP | -- people | --
2021 Census | -- people
Sales Activity
Curious about local property values? Filter the chart to assess the volume and appreciation (including resales) trends and regional comparisons, or scroll to the map below view this information at an individual property level.
Find a Recent Sale
Sales Detail
Population
Wellington is positioned among the lower quartile of areas assessed nationally for population growth based on AreaSearch's assessment of recent, and medium term trends
Wellington's population was approximately 9,194 as of November 2025. This figure reflects an increase of 425 people since the 2021 Census, which reported a population of 8,769. The change is inferred from the estimated resident population of 9,122 in June 2024 and an additional 53 validated new addresses since the Census date. This results in a population density ratio of 2.6 persons per square kilometer. Wellington's growth rate of 4.8% since the 2021 census exceeded the SA4 region's 3.4%, indicating it as a growth leader. Overseas migration contributed approximately 43.1% of overall population gains during recent periods, with all drivers including interstate migration and natural growth being positive factors.
AreaSearch uses ABS/Geoscience Australia projections for each SA2 area, released in 2024 with a base year of 2022. For areas not covered by this data, NSW State Government's SA2 level projections are utilised, released in 2022 with a base year of 2021. Growth rates by age group from these aggregations are applied to all areas for years 2032 to 2041. Based on projected demographic shifts, the area is expected to grow by approximately 631 persons to 2041, reflecting an increase of 6.1% in total over the 17-year period.
Frequently Asked Questions - Population
Development
AreaSearch assessment of residential development drivers sees a low level of activity in Wellington, placing the area among the bottom 25% of areas assessed nationally
Wellington has averaged approximately 18 new dwelling approvals per year over the past five financial years, totalling 92 homes. As of FY-26, 13 approvals have been recorded. Over these five years, an average of 1.1 people moved to the area for each dwelling built. However, this figure has increased to 10.7 people per dwelling over the past two financial years, indicating Wellington's growing popularity and potential supply constraints. New properties are constructed at an average expected cost of $329,000.
In FY-26, $5.8 million in commercial approvals have been registered, reflecting the area's primarily residential nature. Compared to the Rest of NSW, Wellington records significantly lower building activity, 64.0% below the regional average per person. This scarcity typically strengthens demand and prices for existing properties. Recent construction comprises 83.0% detached dwellings and 17.0% townhouses or apartments, maintaining Wellington's traditional low density character focused on family homes. The estimated population count per dwelling approval is 1074 people, reflecting the area's quiet development environment.
According to AreaSearch quarterly estimates, Wellington is forecasted to gain 559 residents by 2041. At current development rates, new housing supply should comfortably meet demand, offering good conditions for buyers and potentially supporting growth beyond current population projections.
Frequently Asked Questions - Development
Infrastructure
Wellington has moderate levels of nearby infrastructure activity, ranking in the 43rdth percentile nationally
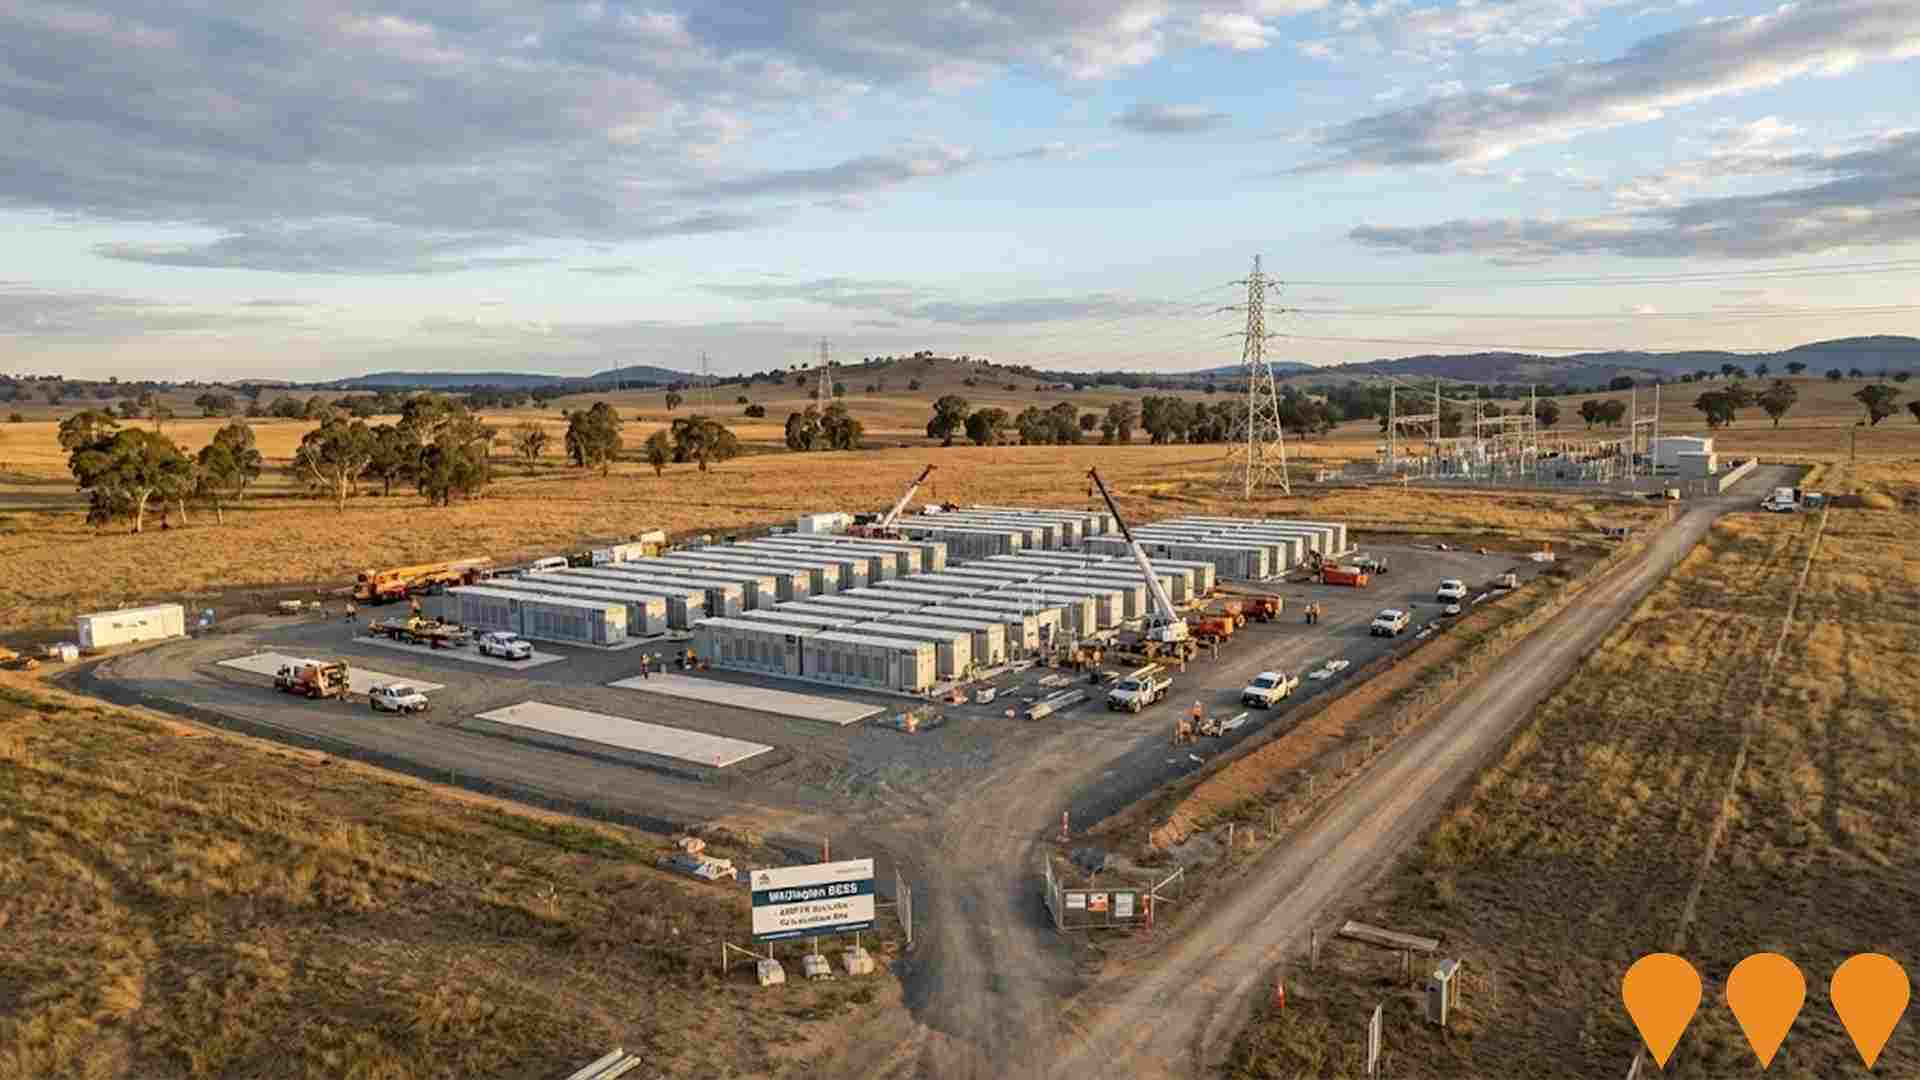
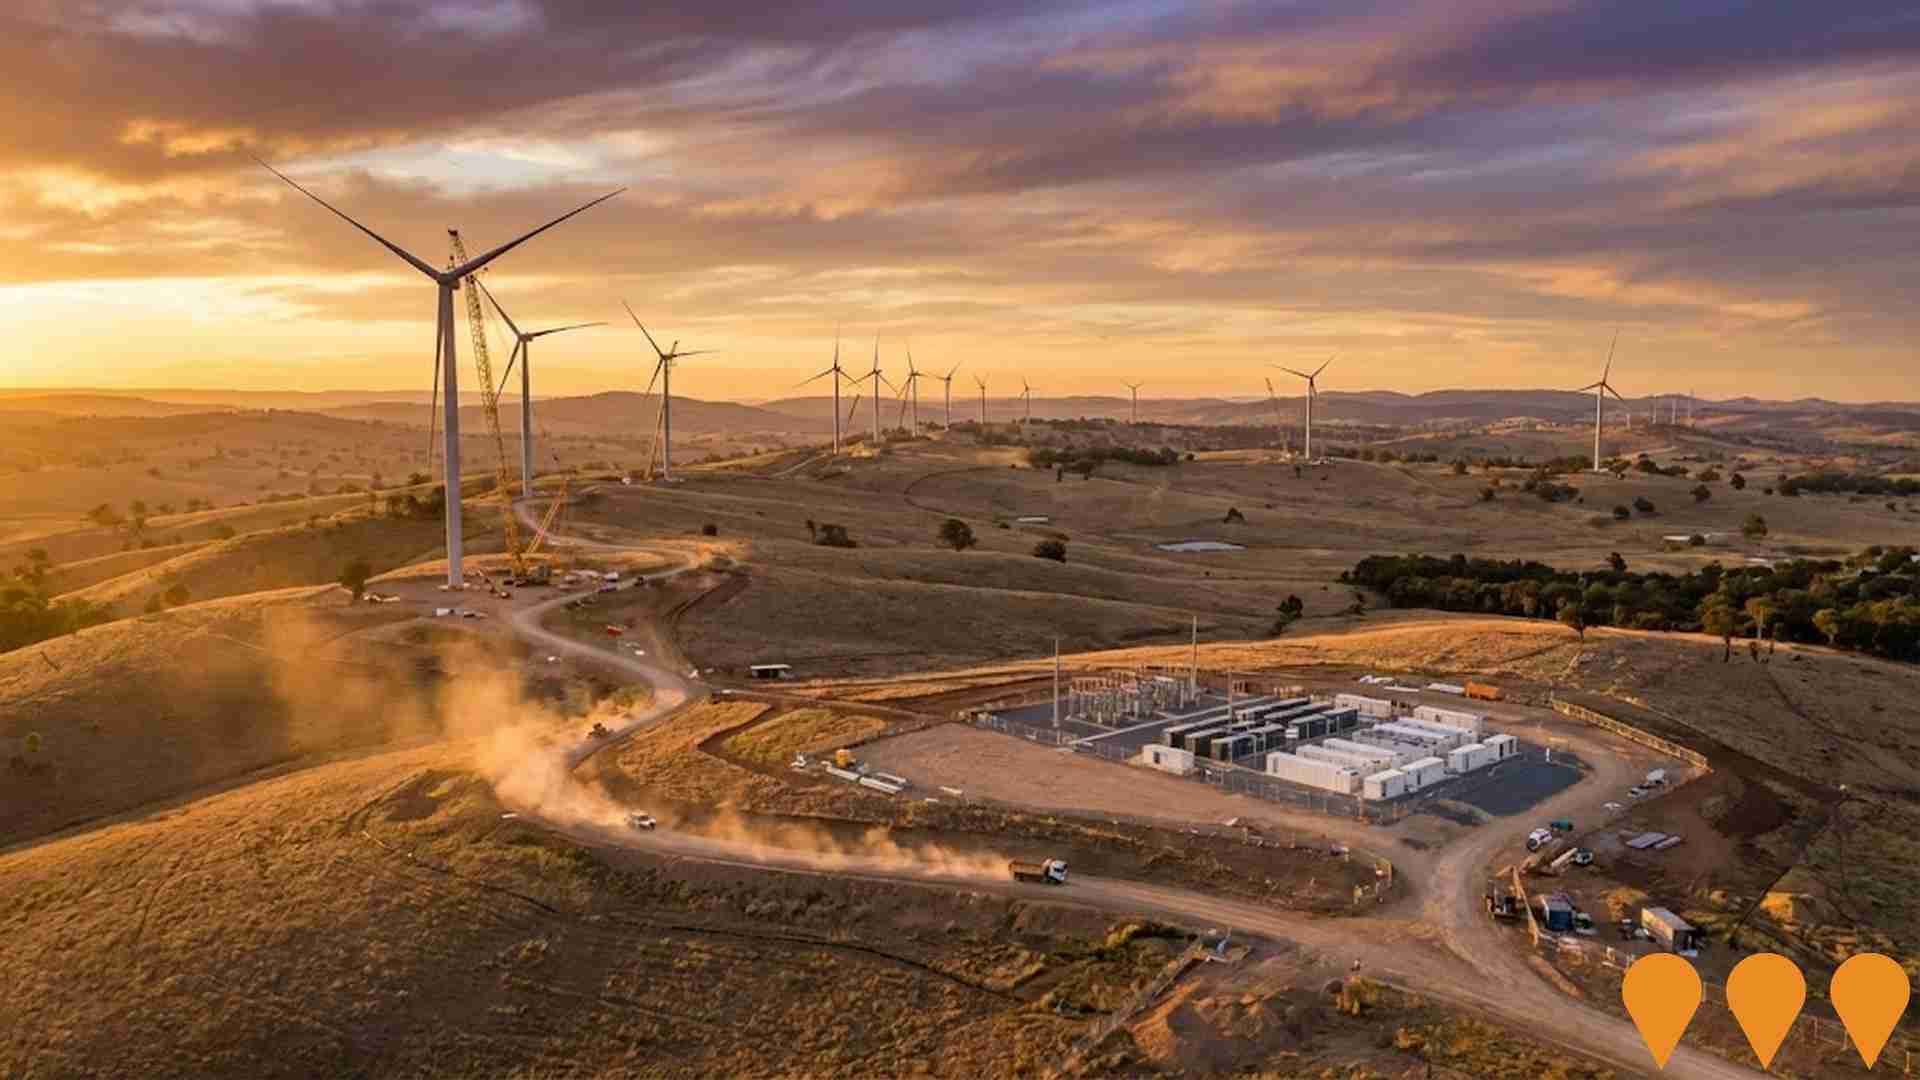
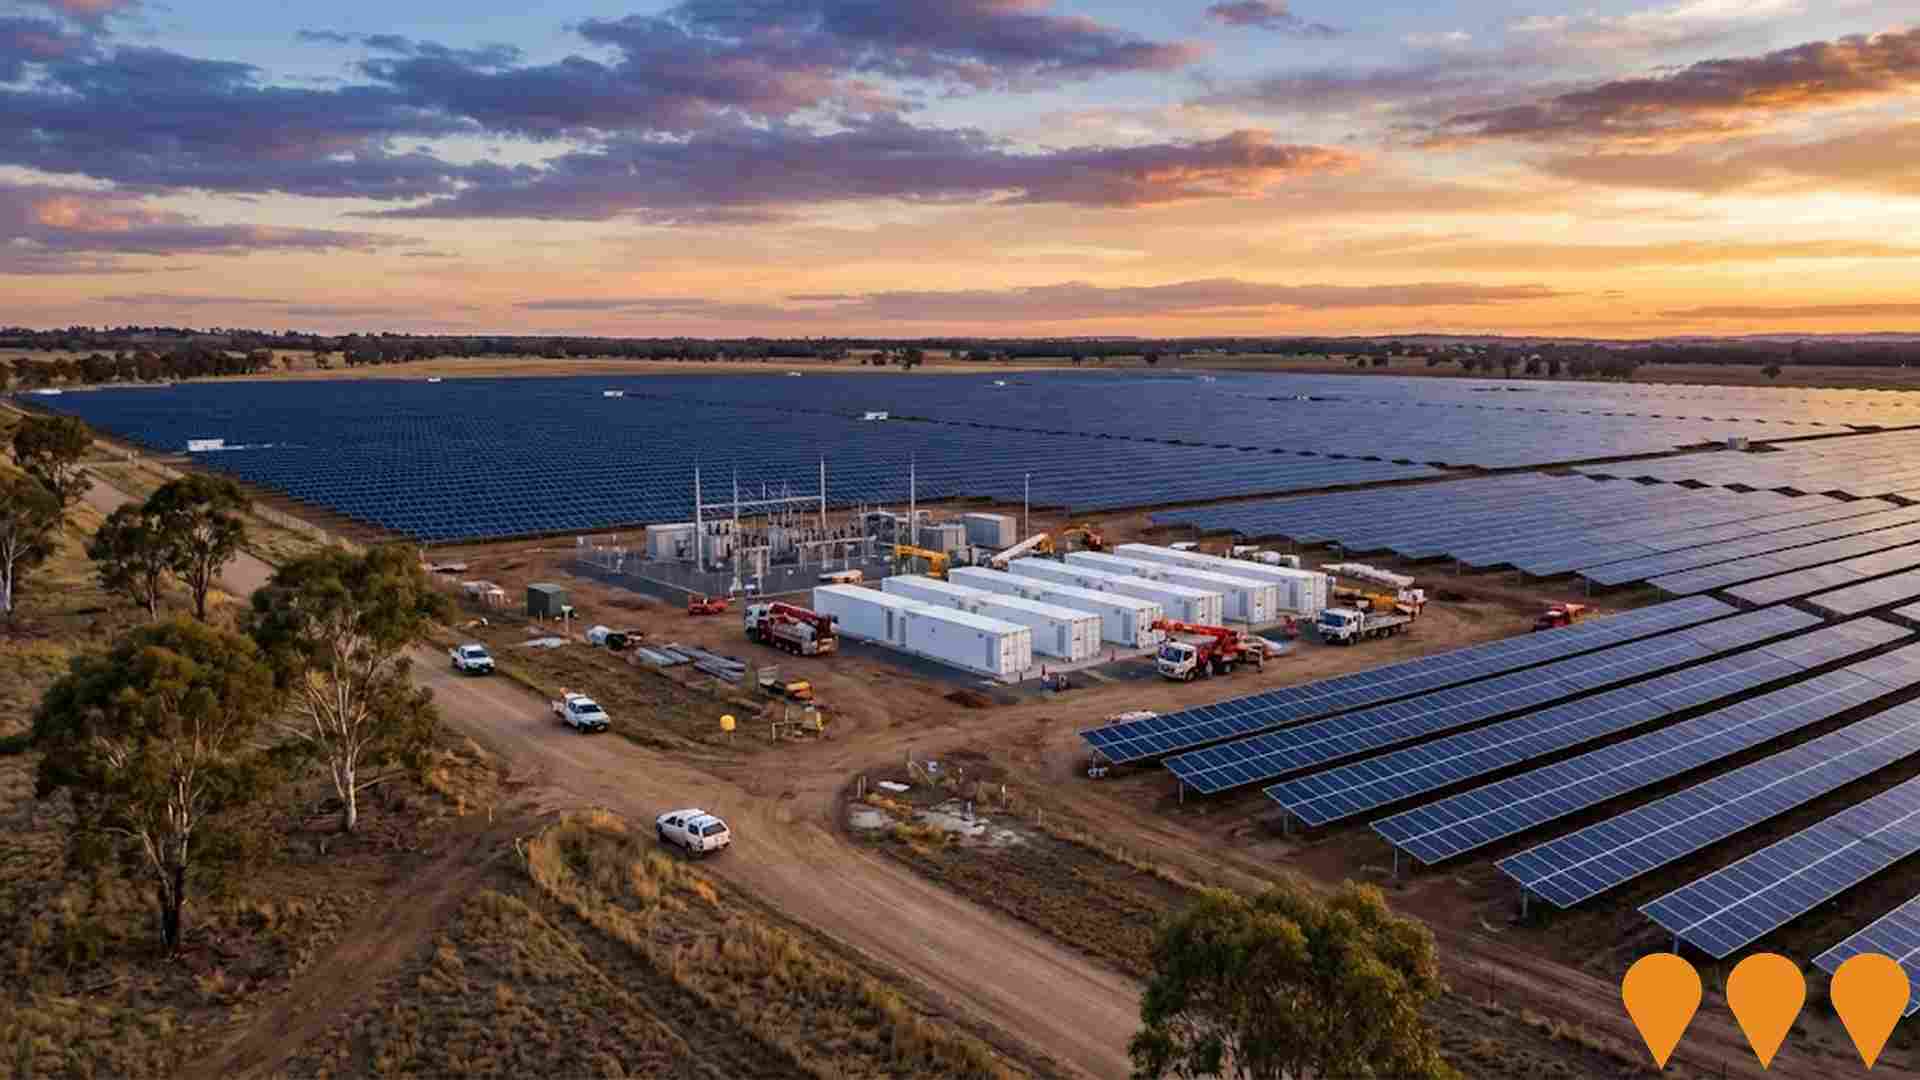
Changes to local infrastructure significantly impact an area's performance. AreaSearch identified 32 projects likely affecting the region. Key initiatives include the Wellington Roads To Home Project at Nanima Village, the Wellington Battery Energy Storage System, Orana Battery Energy Storage System, and Wellington North Solar Farm. The following list details those most relevant.
Professional plan users can use the search below to filter and access additional projects.
INFRASTRUCTURE SEARCH
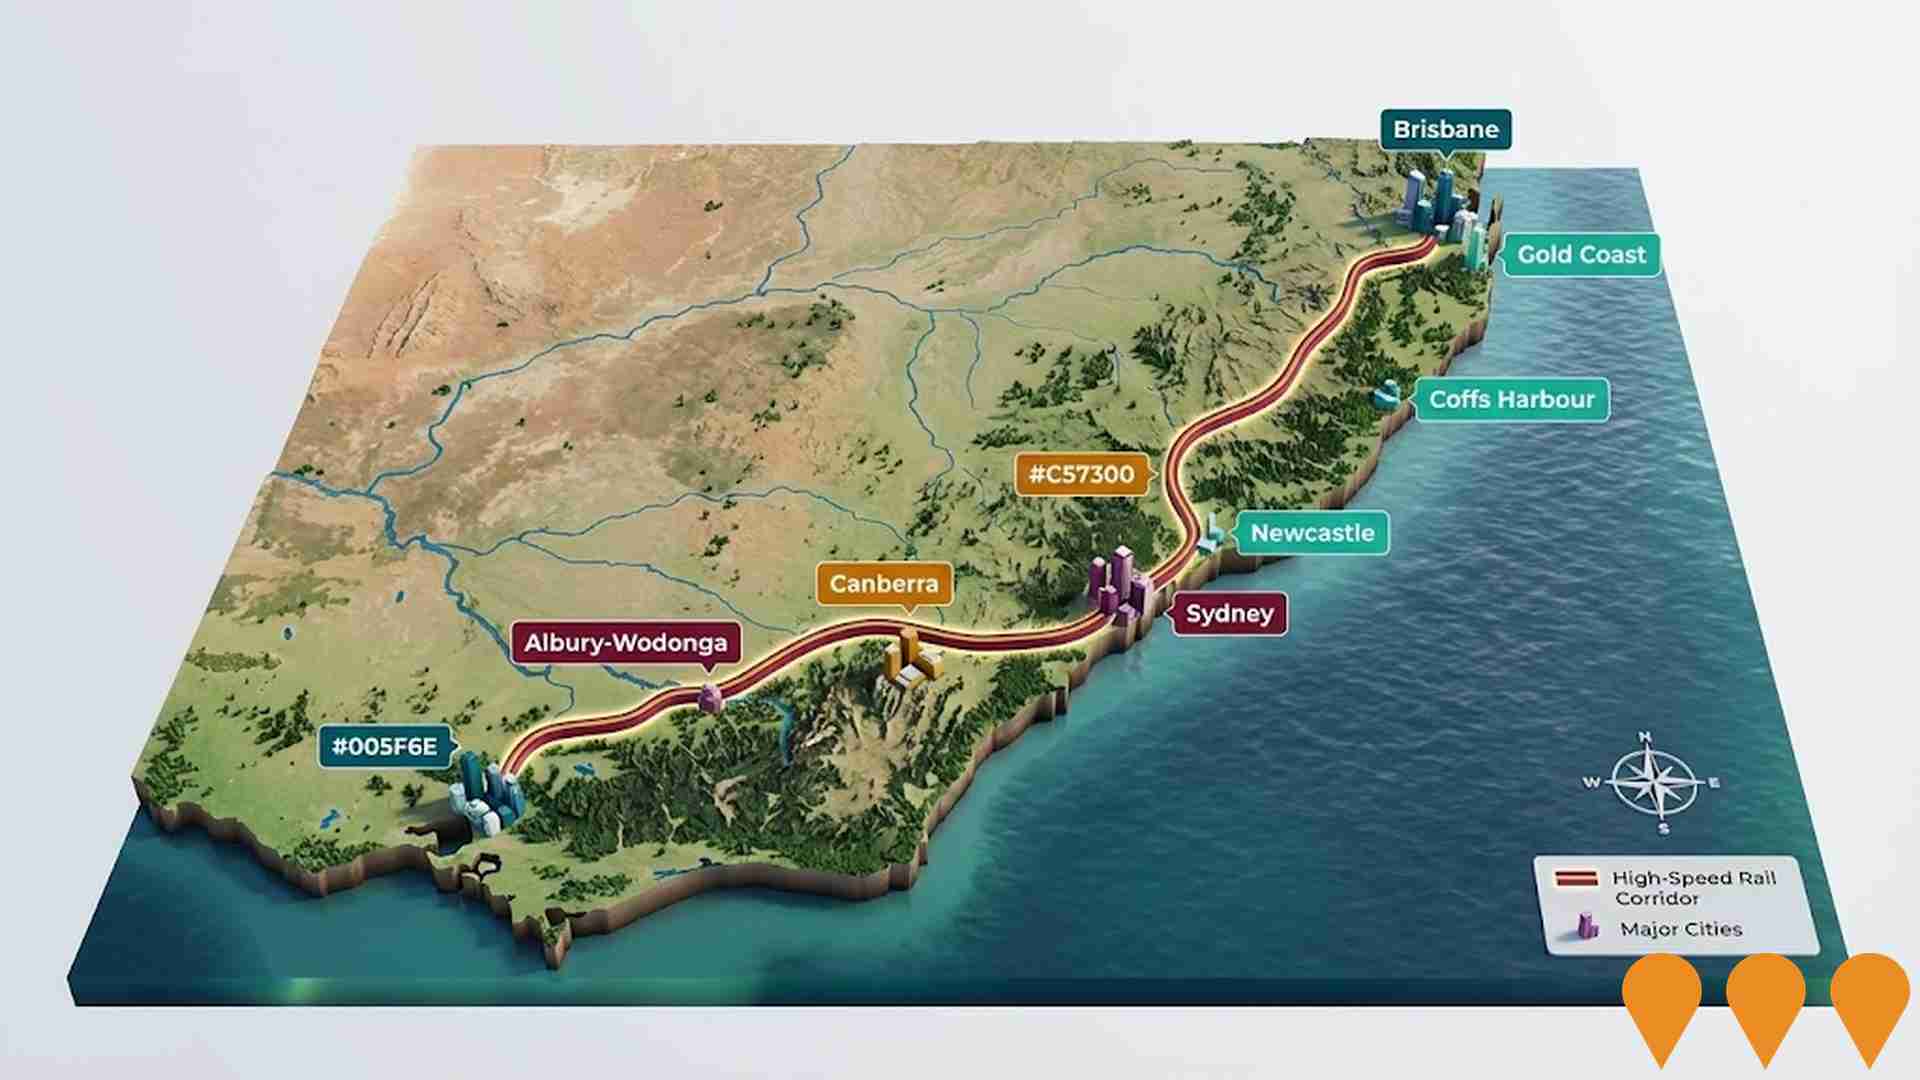
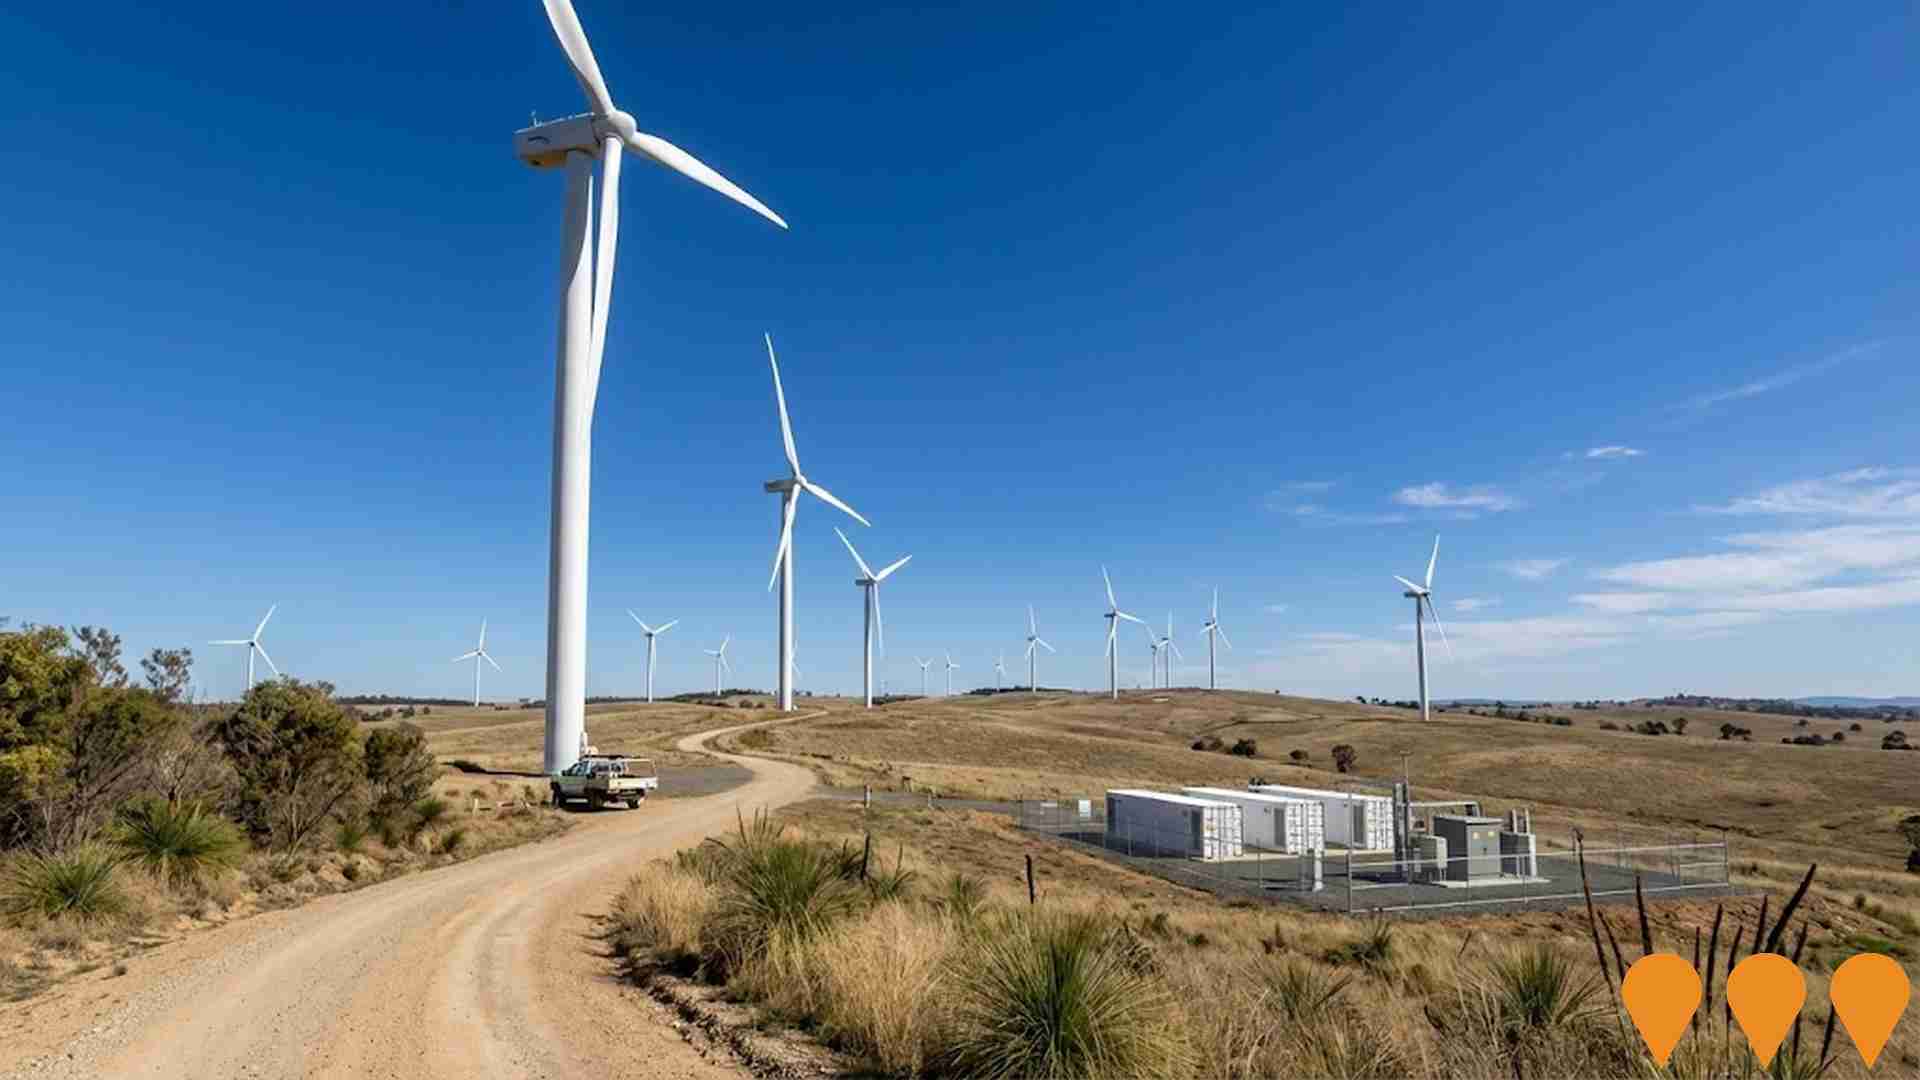
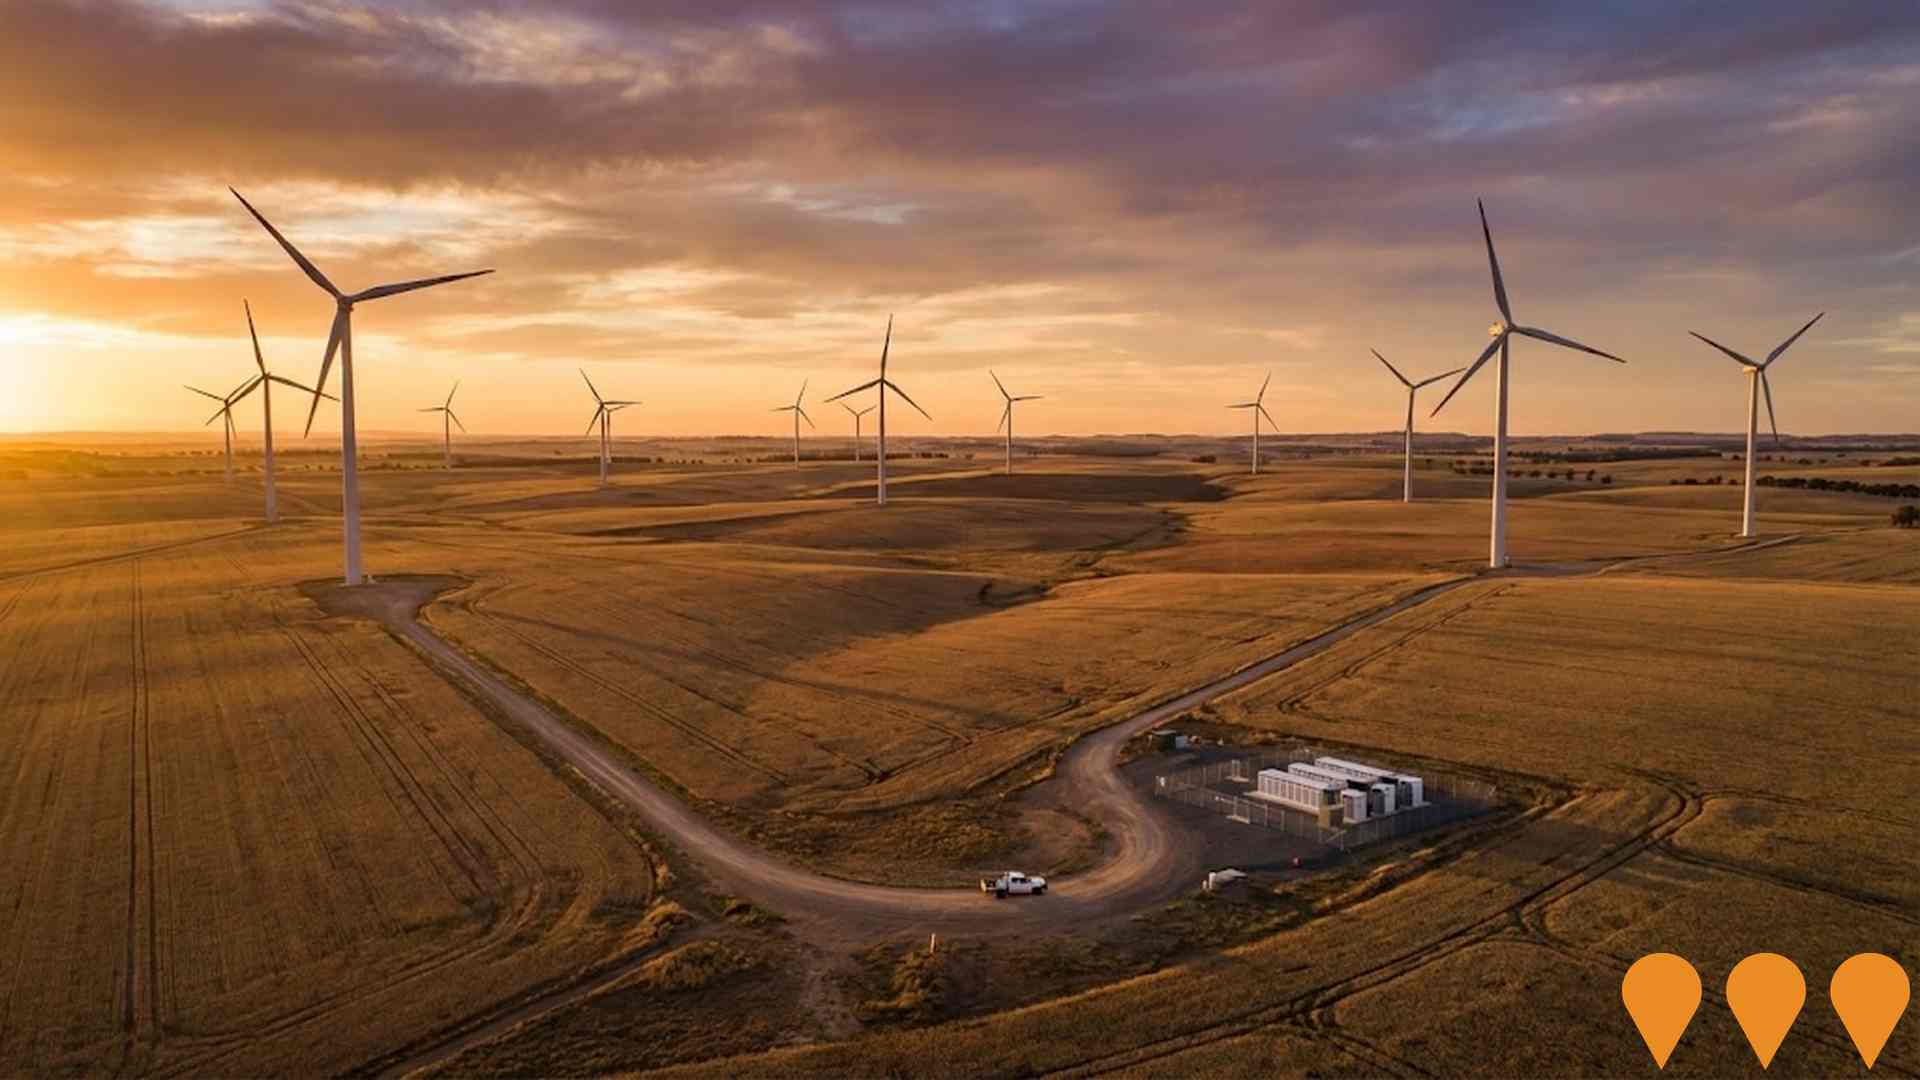
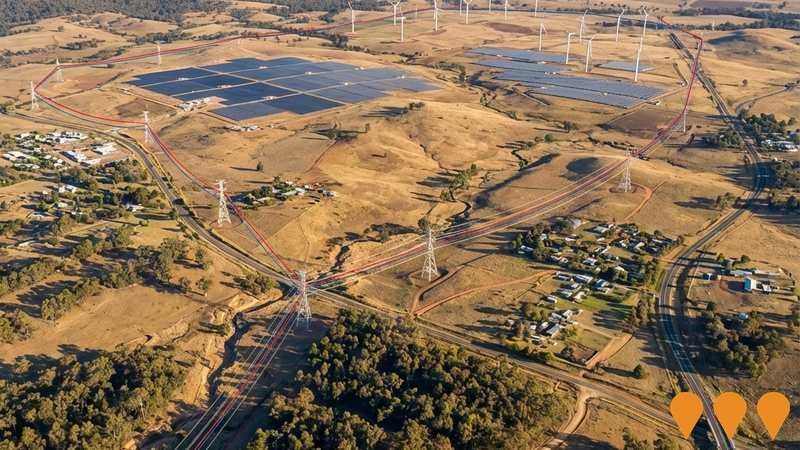
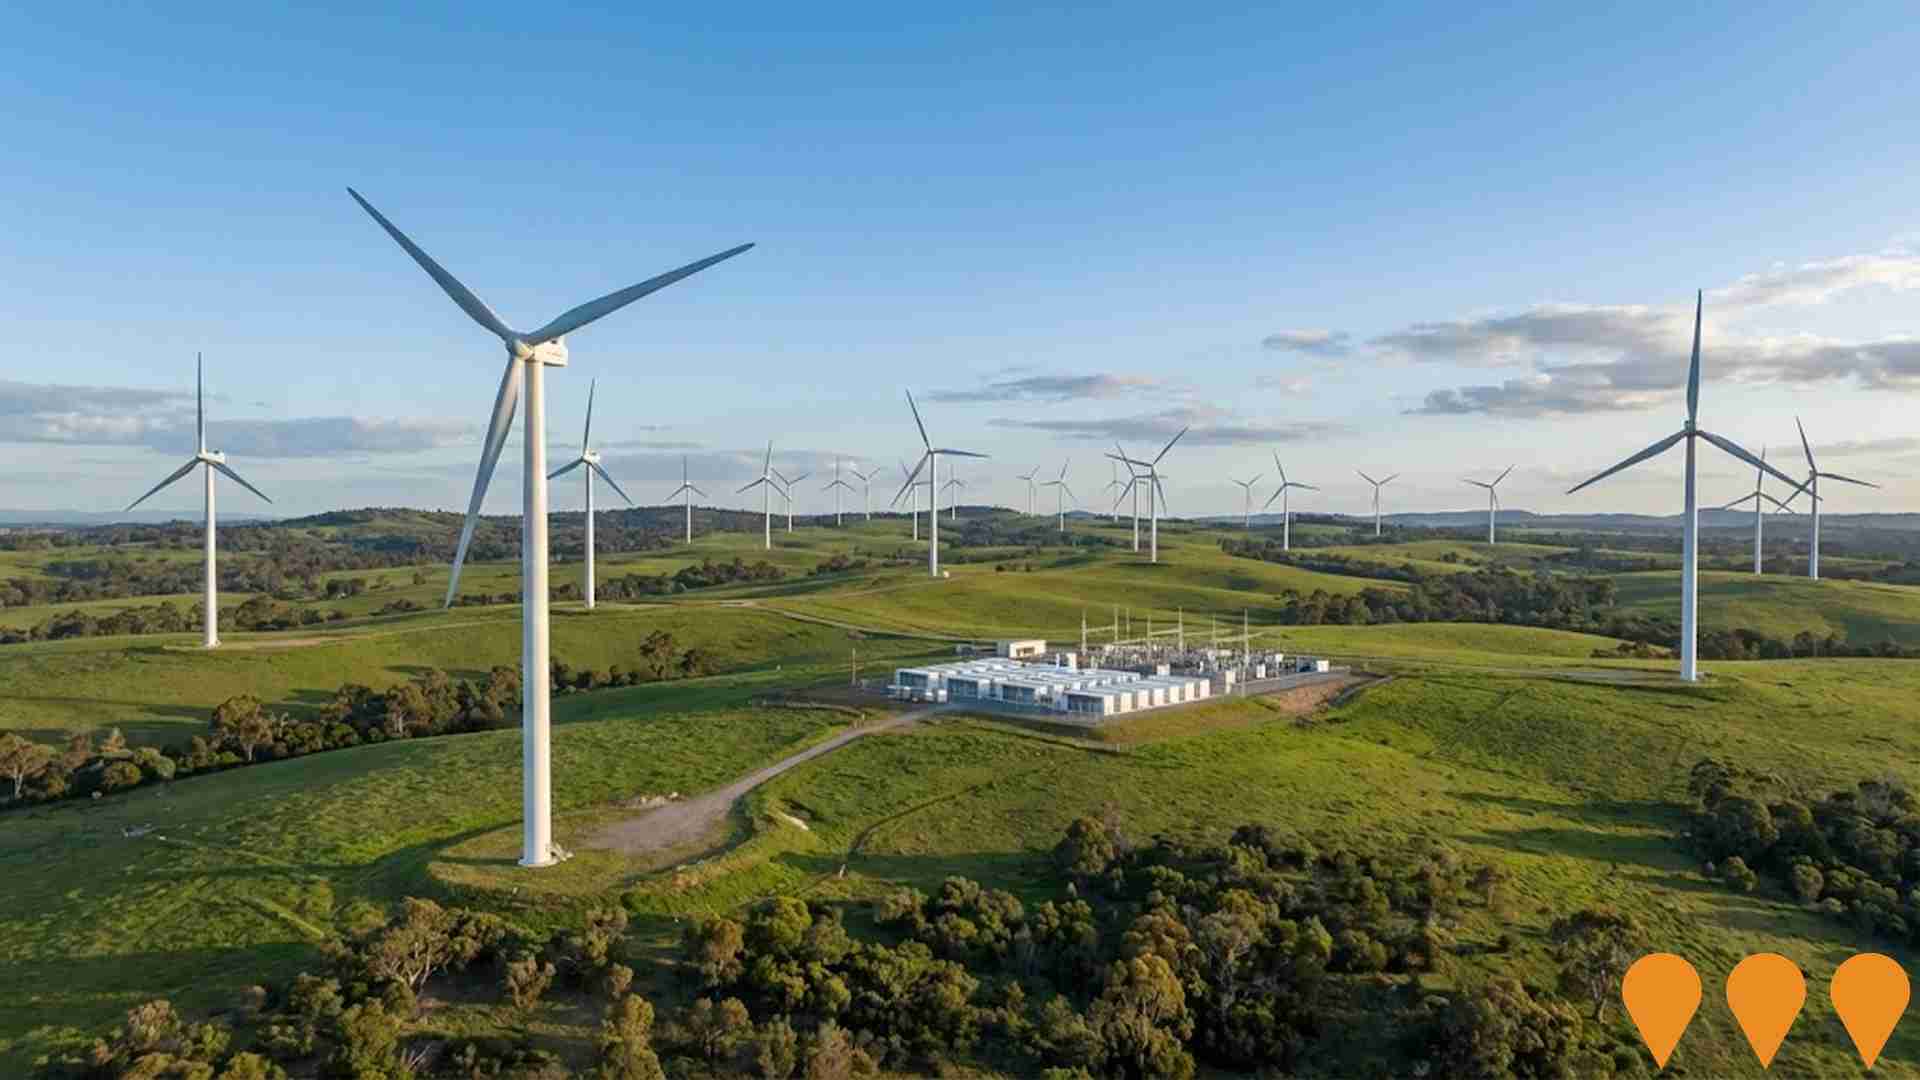
 Denotes AI-based impression for illustrative purposes only, not to be taken as definitive under any circumstances. Please follow links and conduct other investigations from the project's source for actual imagery. Developers and project owners wishing us to use original imagery please Contact Us and we will do so.
Frequently Asked Questions - Infrastructure
Central-West Orana Renewable Energy Zone (REZ) Transmission Project
Australia's first coordinated Renewable Energy Zone transmission project. Delivers new 500 kV and 330 kV lines, energy hubs and substations across approximately 20,000 km2 in central-west NSW. ACEREZ consortium (Acciona, Cobra, Endeavour Energy) appointed as the Network Operator for design, construction, financing, operation and maintenance over 35 years. Initial network capacity of 4.5 GW, expanding to 6 GW by 2038. Construction commenced June 2025, with staged commissioning from 2027 and full operations targeted for 2028-2029. Project reached financial close in April 2025.
Spicers Creek Wind Farm
A 700 MW wind farm of up to 117 wind turbines with a 400 MW / 1800 MWh battery energy storage system in the Central-West Orana Renewable Energy Zone, located 25km northwest of Gulgong and 35km northeast of Wellington. NSW Independent Planning Commission granted development consent on 31 October 2024, Commonwealth EPBC approval was granted on 6 March 2025, and the project was selected for the Capacity Investment Scheme in December 2024. Expected to power approximately 395,000 homes and reduce emissions by 650,000 tonnes annually.
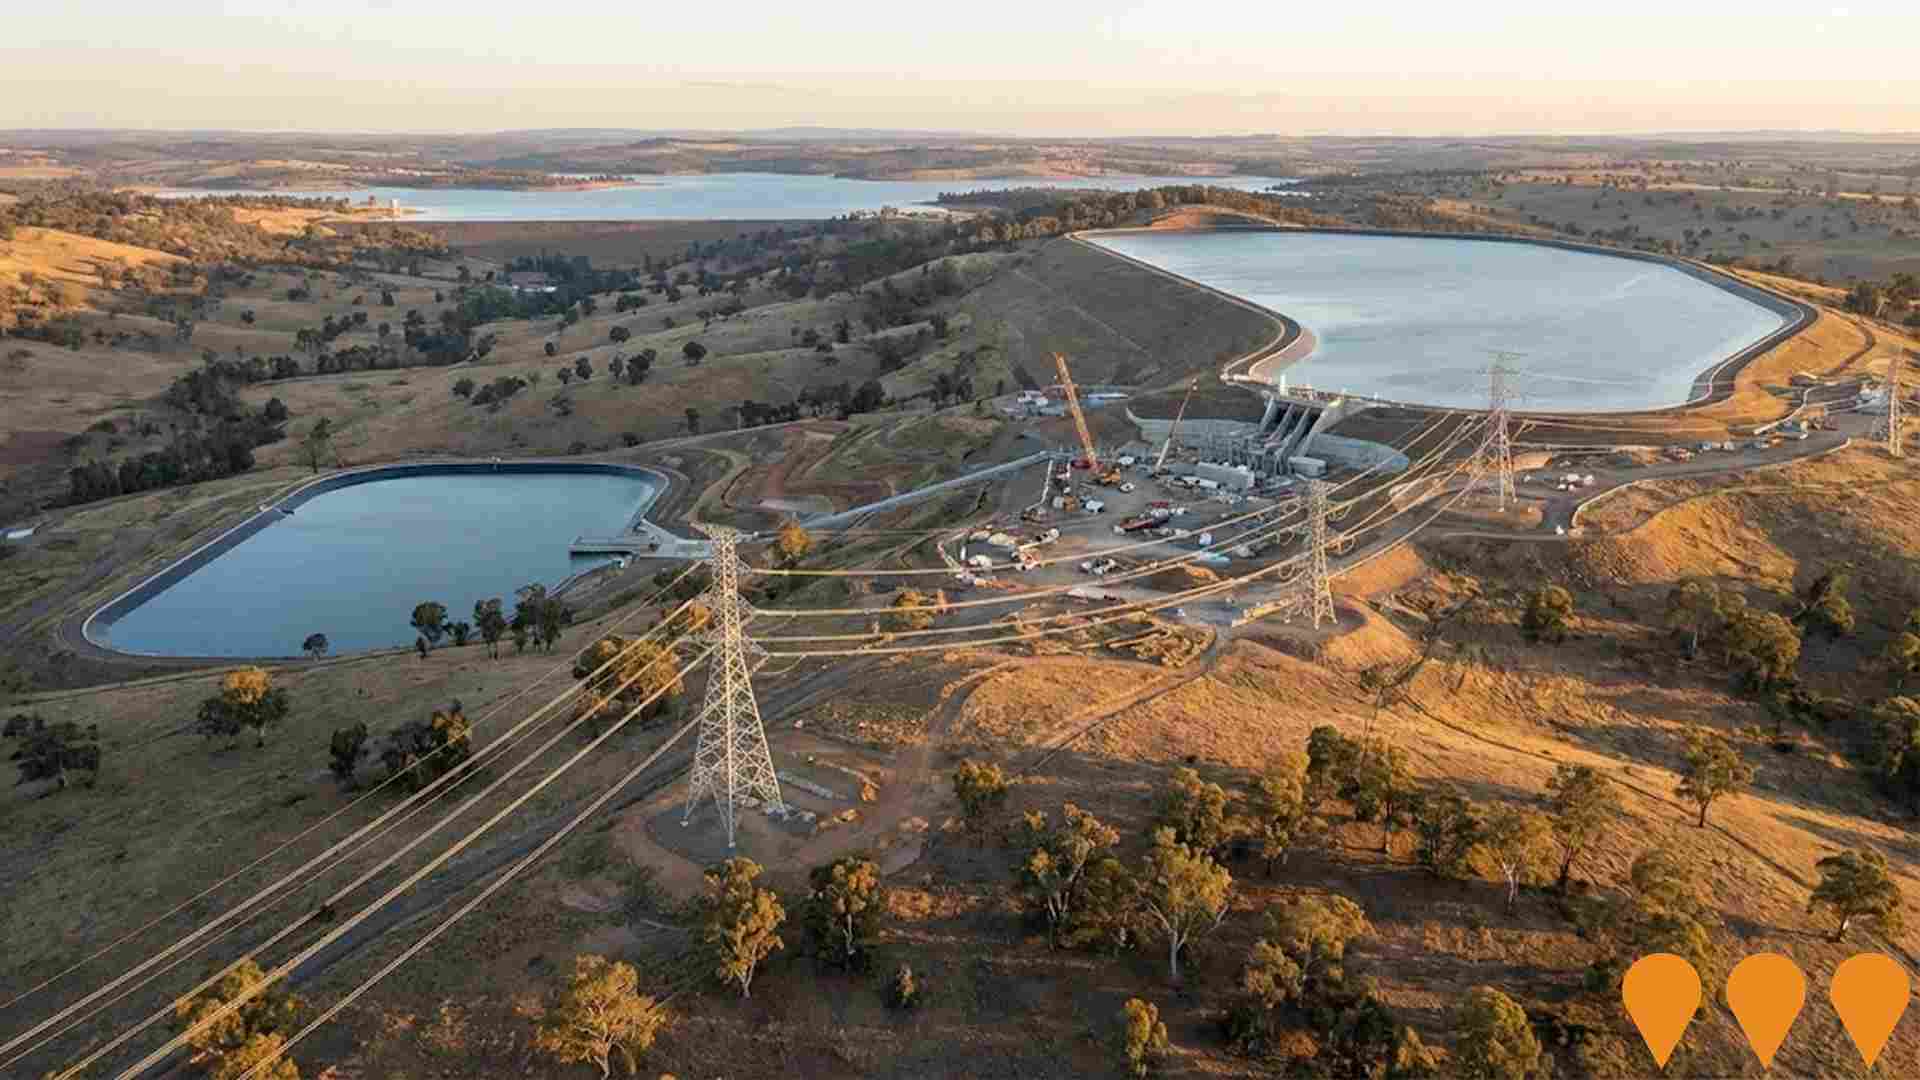
Phoenix Pumped Hydro Project
The Phoenix Pumped Hydro Project is an 800 MW off-stream pumped hydro energy storage facility developed by ACEN Australia, capable of delivering 800 MW for up to 15 hours (approximately 12,000 MWh total storage). Located on WaterNSW and adjacent private land on the eastern side of Burrendong Dam near Yarrabin (35 km west of Mudgee) in the Central-West Orana REZ. Features purpose-built upper and lower reservoirs (each ~50 ha), underground powerhouse, and tunnel connection. The project secured a Long-Term Energy Service Agreement (LTESA) in February 2025 and is currently preparing its Environmental Impact Statement (EIS), with construction targeted for ~2027 and operations in the early 2030s.
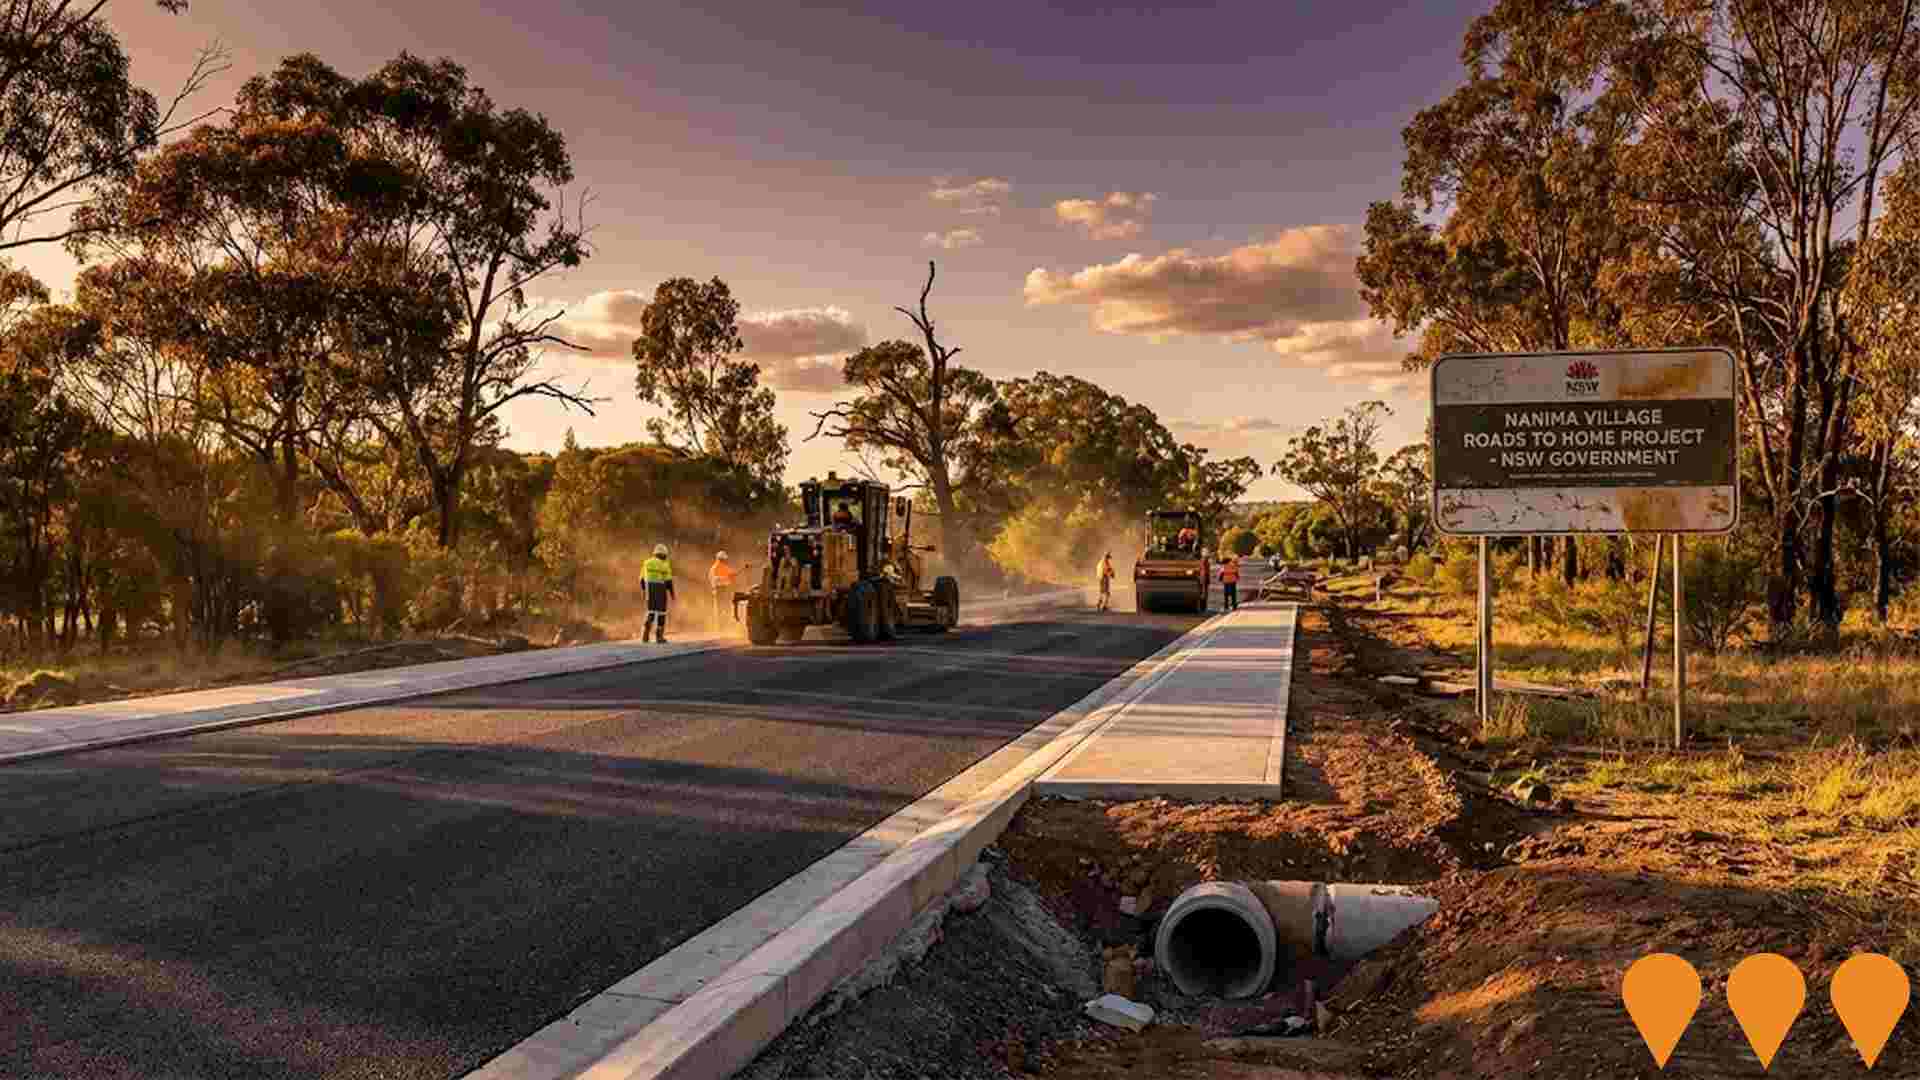
Wellington Roads To Home Project Nanima Village
The NSW Roads to Home Program is a NSW Government initiative to upgrade infrastructure in discrete Aboriginal communities. The Wellington Nanima Village project involves civil construction works for subdivision certification, including road and footpath reconstruction, new stormwater and water mains, sewer upgrades, and landscaping for the 21-dwelling community. The program aims to provide municipal services to appropriate standards, improve social and economic connections, and reduce health hazards.
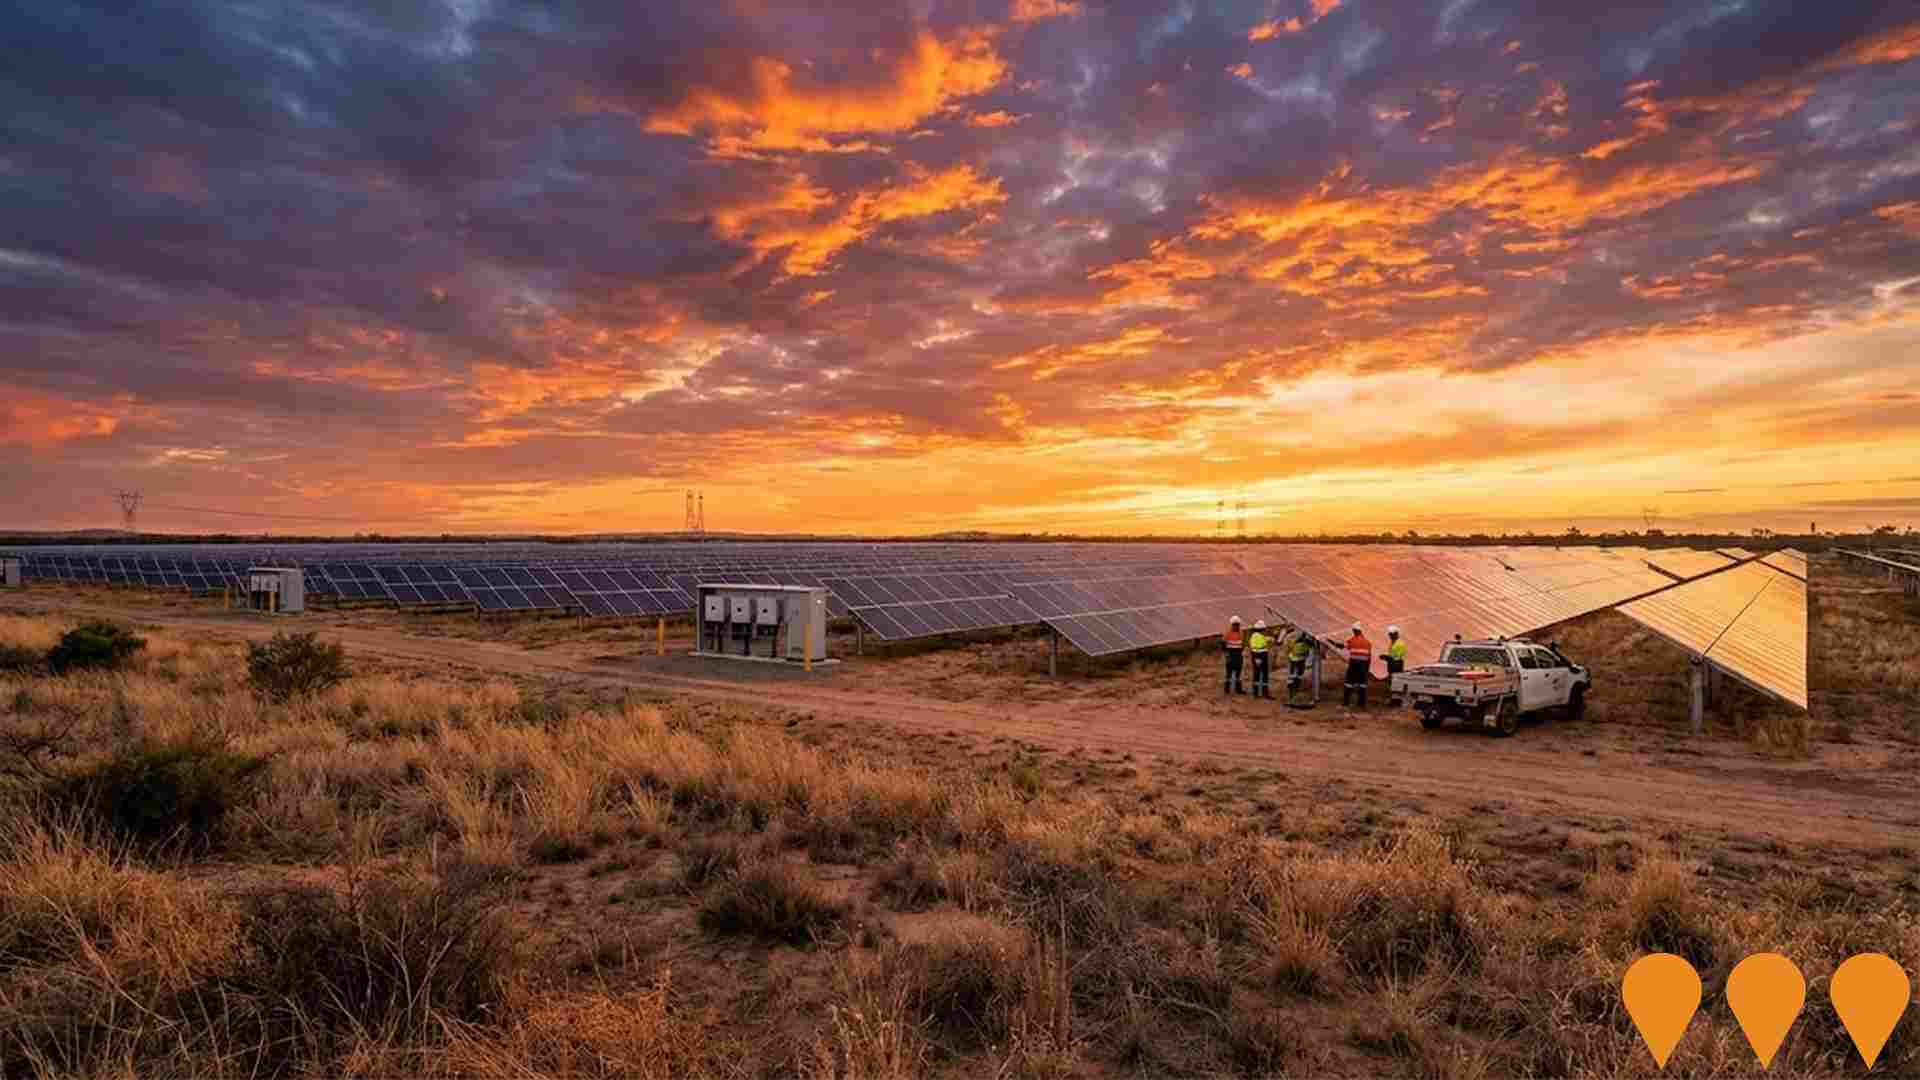
Wellington North Solar Farm
The Wellington North Solar Farm is a 425MWdc solar farm developed by Lightsource BP, located approximately seven kilometres north-east of Wellington off Goolma Road in the Central-West Orana region of NSW. The project uses 1.2 million bifacial solar panels and creates a solar hub with the adjacent 200MWdc Wellington Solar Farm for a combined capacity of 625MWdc. The project includes 155 inverter stations and connects to TransGrid's Wellington substation via a 2.4km 330kV transmission line. Construction creates 400 jobs with completion expected by 2024, generating enough electricity to power approximately 170,000 Australian homes annually.
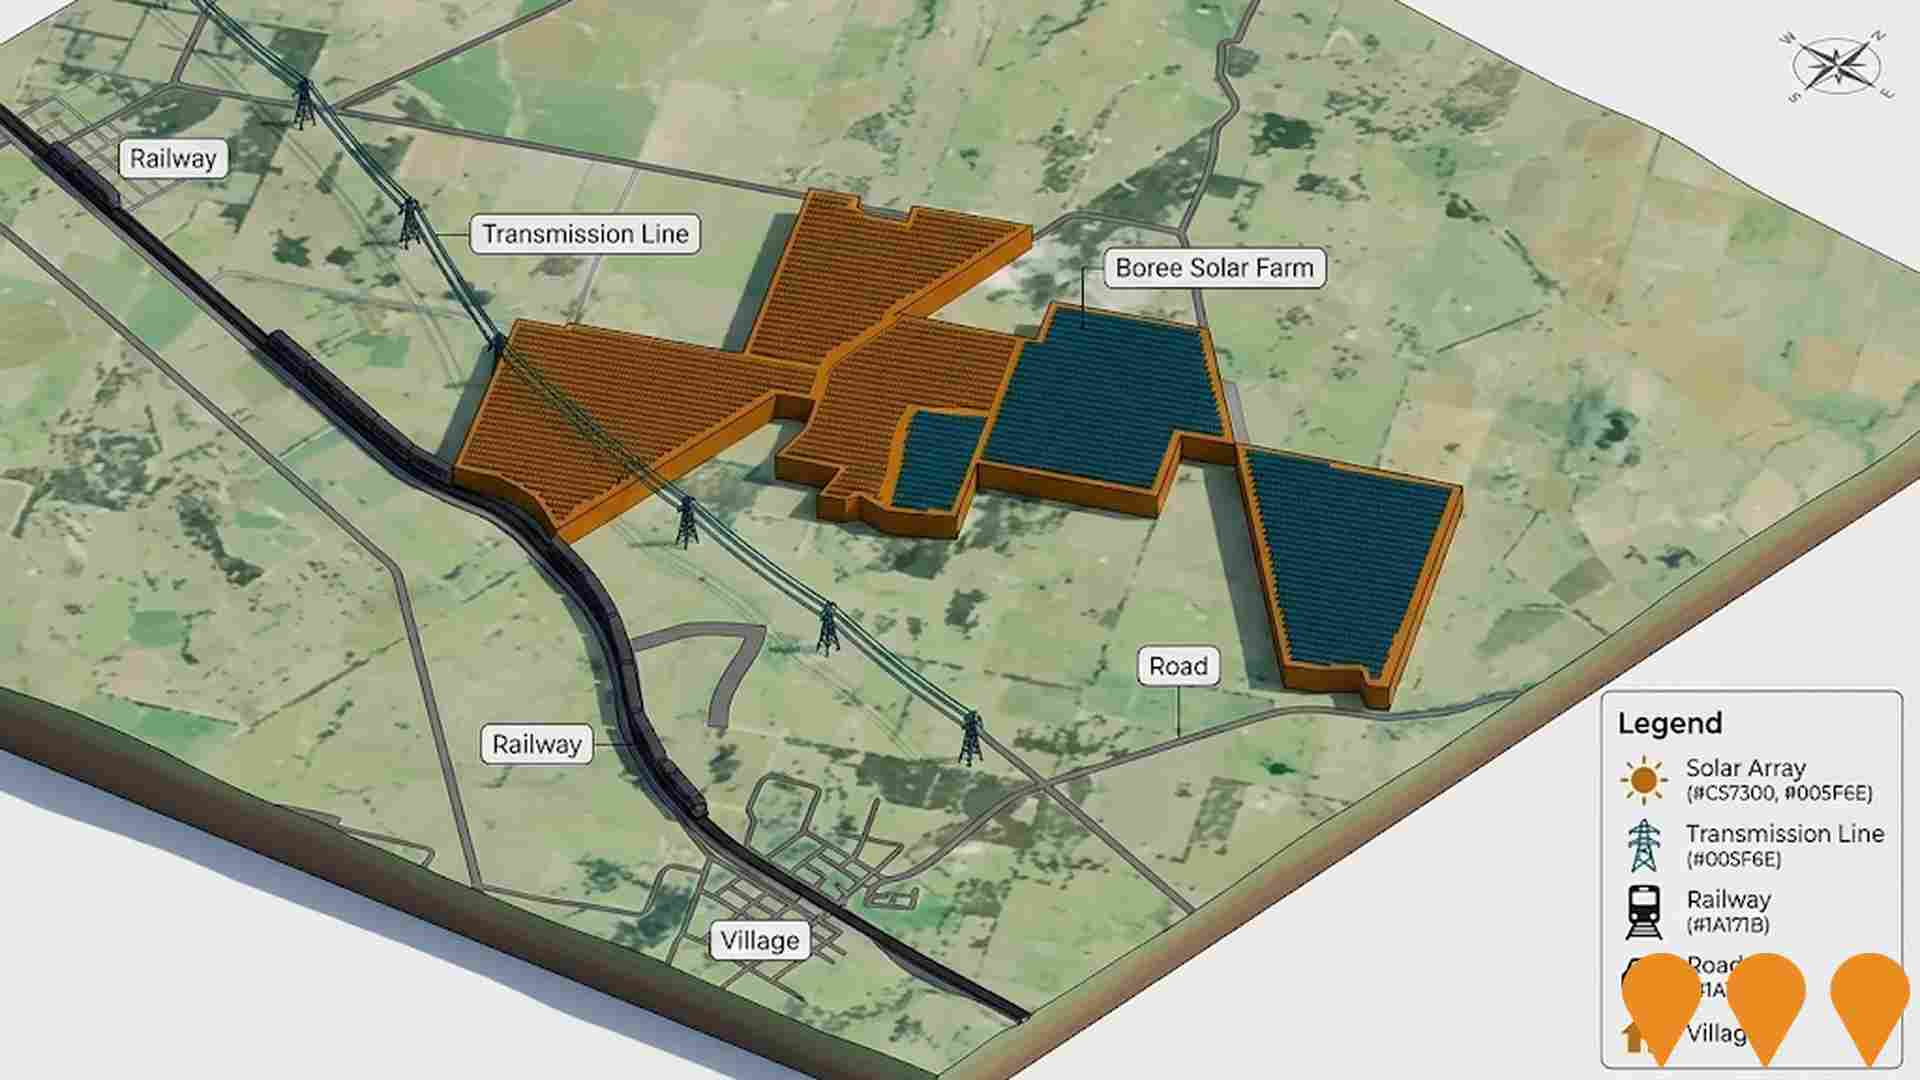
Boree Solar Farm
A 250 MW solar photovoltaic farm with a 150 MW/800 MWh battery energy storage system spanning 1322 hectares. The project is expected to power approximately 96,000 homes and reduce greenhouse gas emissions by about 11,450,000 tonnes over 30 years. Located within the Central West Orana Renewable Energy Zone, the project is currently in the planning stage with a Scoping Report to be submitted to the Department of Planning, Housing and Infrastructure in Q2 2025.
Orana Battery Energy Storage System
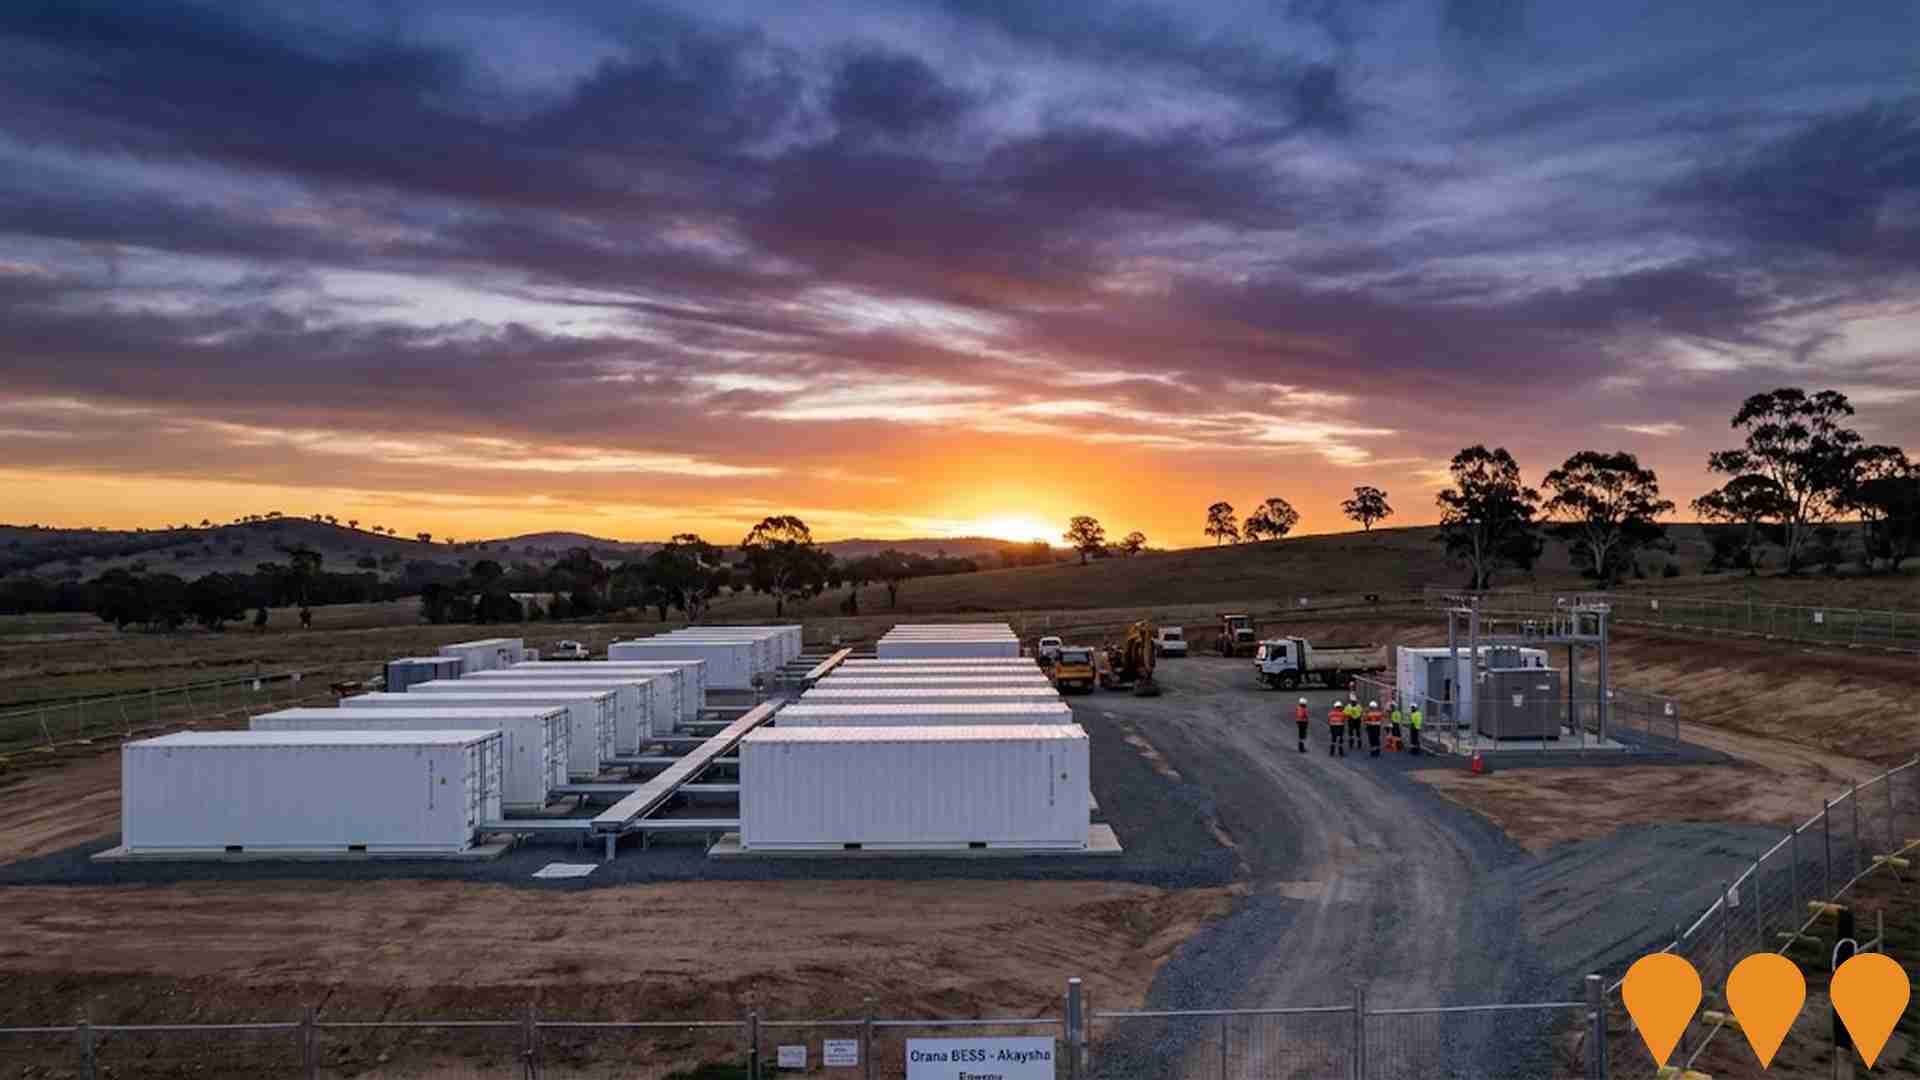
Akaysha Energy is delivering a grid-scale battery near Wellington within the Central West Orana REZ. The Orana BESS is sized at about 415 MW / 1,660 MWh (four-hour duration) with associated connection works adjacent to the TransGrid 330 kV network. Development consent was granted in December 2023, subsequent modifications have been approved, financing has closed, and site works have commenced.
Burrendong Wind Farm
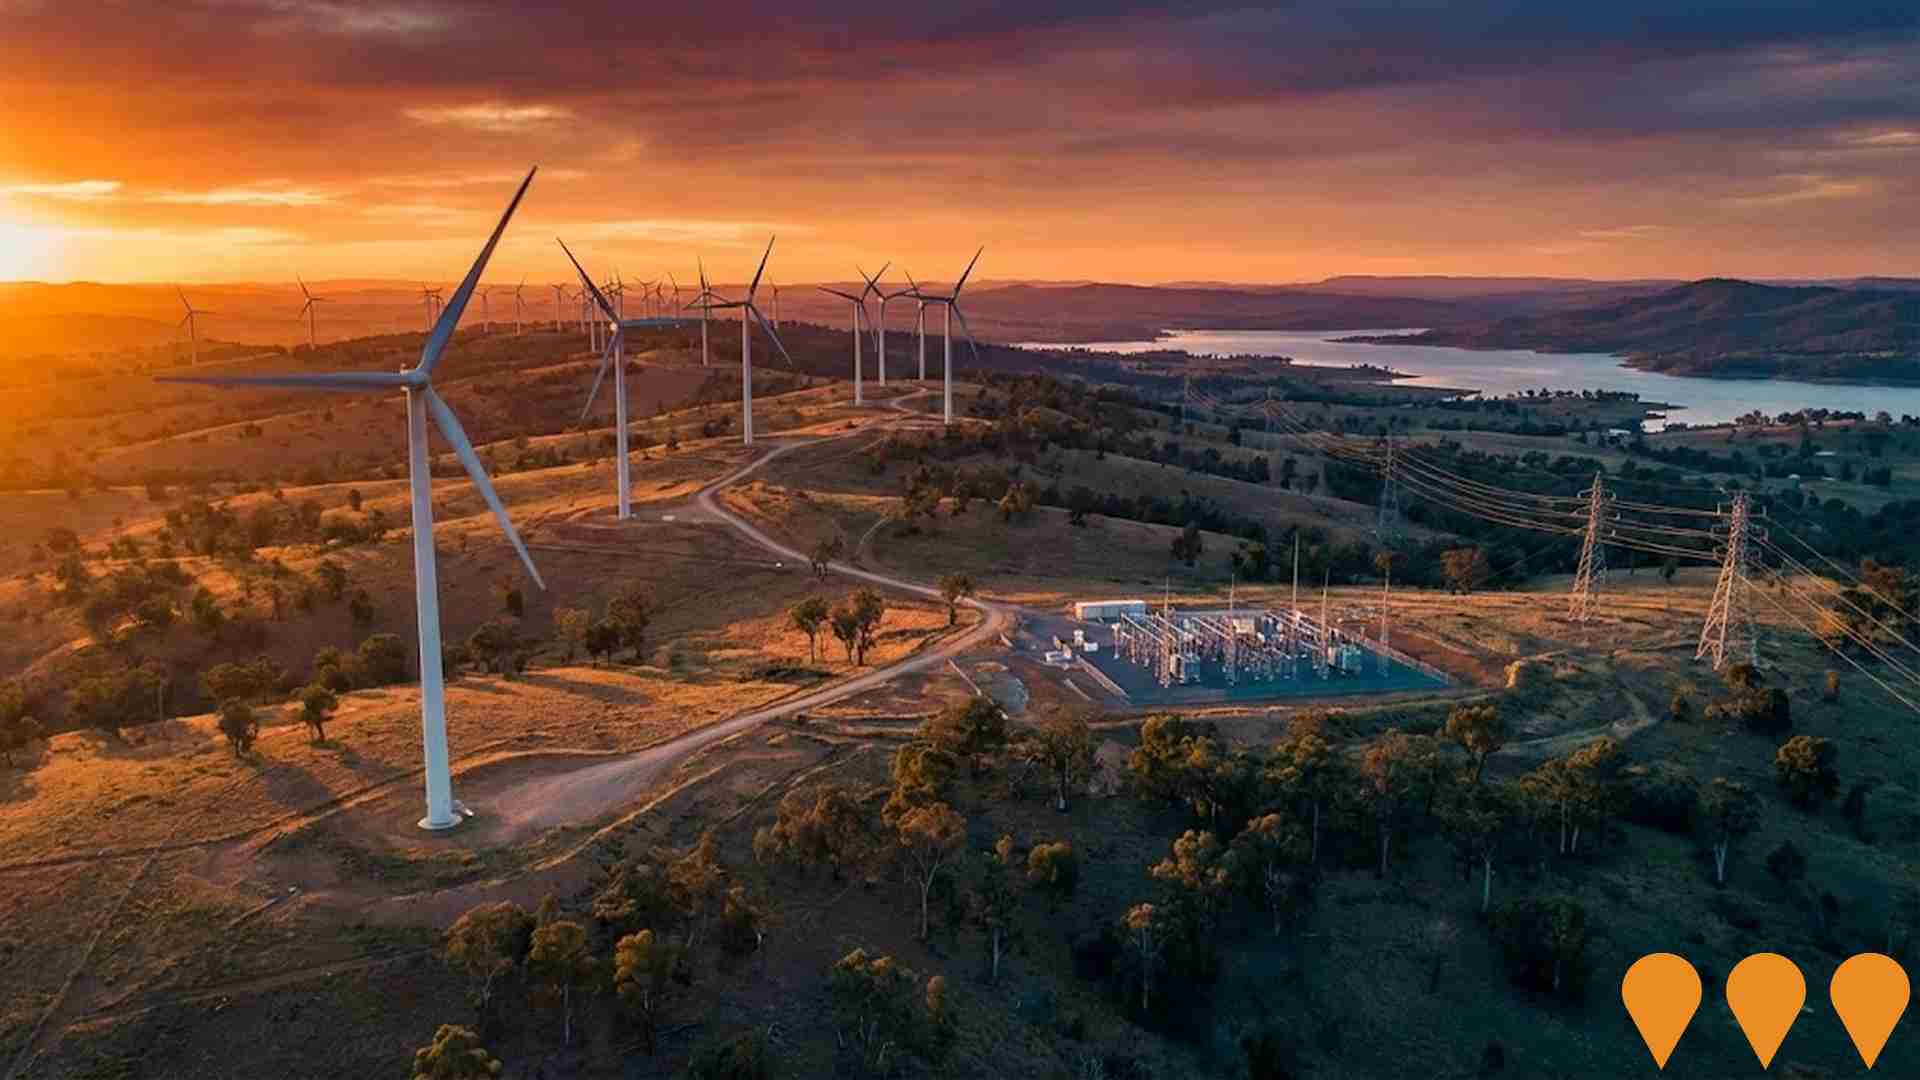
Ark Energy is proposing a 500 MW wind farm with up to 70 wind turbines (each up to 250 m tall, 6-7 MW capacity) in Yarrabin, NSW, within the Central-West Orana Renewable Energy Zone. Key components include internal roads and drainage, up to two substations, one O&M compound, 33 kV electrical connections, up to three permanent meteorological masts, temporary facilities, and connection to the existing TransGrid 330 kV transmission line west of Lake Burrendong. The project has a 30-year operational lifespan. EIS exhibited Nov-Dec 2023; Submissions Report and Amendment Report lodged Dec 2024. Currently under assessment by NSW Department of Planning (SSD-8950984).
Employment
AreaSearch analysis reveals Wellington recording weaker employment conditions than most comparable areas nationwide
Wellington's workforce is balanced across white and blue-collar jobs, with essential services well represented. The unemployment rate in September 2025 was 4.4%.
There were 3,343 residents employed at this time, with an unemployment rate of 0.6% higher than the Rest of NSW's rate of 3.8%. Workforce participation lagged significantly at 46.0%, compared to Rest of NSW's 56.4%. Key employment sectors among residents include agriculture, forestry & fishing, health care & social assistance, and public administration & safety. Agriculture, forestry & fishing is particularly strong, with an employment share 2.9 times the regional level.
Conversely, manufacturing employs only 2.7% of local workers, below Rest of NSW's 5.8%. The area appears to offer limited local employment opportunities, as indicated by Census data comparing working population to resident population. Between September 2024 and 2025, labour force decreased by 4.2%, while employment fell by 4.6%, causing the unemployment rate to rise by 0.4 percentage points. In contrast, Rest of NSW saw employment contract by 0.5% and labour force fall by 0.1%. State-level data as of 25-Nov-25 shows NSW employment contracted by 0.03% (losing 2,260 jobs), with the state unemployment rate at 3.9%, compared to the national rate of 4.3%. Jobs and Skills Australia's national employment forecasts from May-25 suggest that while overall employment is expected to expand by 6.6% over five years and 13.7% over ten years, growth rates vary significantly between industry sectors. Applying these projections to Wellington's employment mix indicates local employment should increase by 5.9% over five years and 12.5% over ten years.
Frequently Asked Questions - Employment
Income
The area's income levels rank in the lower 15% nationally based on AreaSearch comparative data
AreaSearch's latest postcode level ATO data for financial year 2022 shows that income in Wellington SA2 is below the national average. The median assessed income is $44,471 and the average income stands at $50,647. This contrasts with Rest of NSW's figures where the median income is $49,459 and the average income is $62,998. Based on Wage Price Index growth of 12.61% since financial year 2022, current estimates for Wellington would be approximately $50,079 (median) and $57,034 (average) as of September 2025. According to the 2021 Census, household, family and personal incomes in Wellington fall between the 10th and 13th percentiles nationally. The earnings profile shows that 27.3% of locals (2,509 people) earn between $800 and $1,499, differing from metropolitan regions where the predominant earning category is $1,500 to $2,999 at 29.9%. Housing costs are modest with 87.9% of income retained, but total disposable income ranks at just the 14th percentile nationally.
Frequently Asked Questions - Income
Housing
Wellington is characterized by a predominantly suburban housing profile, with above-average rates of outright home ownership
In Wellington, as per the latest Census evaluation, 93.5% of dwellings were houses with the remaining 6.5% being semi-detached, apartments, or other types. This contrasts with Non-Metro NSW's 88.0% houses and 12.1% other dwellings. Home ownership in Wellington stood at 42.7%, with mortgaged dwellings at 30.1% and rented ones at 27.2%. The median monthly mortgage repayment was $1,100, lower than Non-Metro NSW's average of $1,450. The median weekly rent in Wellington was $230, compared to Non-Metro NSW's $280. Nationally, Wellington's mortgage repayments were significantly lower at $1,100 versus the Australian average of $1,863, and rents were substantially below the national figure of $375.
Frequently Asked Questions - Housing
Household Composition
Wellington features high concentrations of lone person households, with a lower-than-average median household size
Family households account for 65.2% of all households, including 22.1% couples with children, 27.8% couples without children, and 13.8% single parent families. Non-family households constitute the remaining 34.8%, with lone person households at 31.7% and group households comprising 3.1%. The median household size is 2.4 people, which is smaller than the Rest of NSW average of 2.5.
Frequently Asked Questions - Households
Local Schools & Education
Wellington faces educational challenges, with performance metrics placing it in the bottom quartile of areas assessed nationally
The area's university qualification rate is 15.4%, significantly lower than the NSW average of 32.2%. Bachelor degrees are most common at 11.7%, followed by postgraduate qualifications (2.0%) and graduate diplomas (1.7%). Vocational credentials are prominent, with 44.8% of residents aged 15+ holding them, including advanced diplomas (10.2%) and certificates (34.6%). Educational participation is high, with 37.2% currently enrolled in formal education, including primary (15.1%), secondary (10.8%), and tertiary (2.8%) levels.
Educational participation is notably high, with 37.2% of residents currently enrolled in formal education. This includes 15.1% in primary education, 10.8% in secondary education, and 2.8% pursuing tertiary education.
Frequently Asked Questions - Education
Schools Detail
Nearby Services & Amenities
Transport
Transport servicing is moderate compared to other areas nationally based on assessment of service frequency, route connectivity and accessibility
Wellington has 307 active public transport stops offering a mix of train and bus services. These stops are served by 35 routes that together facilitate 1,119 weekly passenger trips. Residents enjoy excellent transport accessibility, with an average distance of 177 meters to the nearest stop.
Service frequency across all routes averages 159 trips per day, equating to roughly 3 weekly trips per stop.
Frequently Asked Questions - Transport
Transport Stops Detail
Health
Health performance in Wellington is a key challenge with a range of health conditions having marked impacts on both younger and older age cohorts
Wellington faces significant health challenges, with various conditions affecting both younger and older age groups. The rate of private health cover stands at approximately 46%, covering around 4,247 people, compared to Rest of NSW's 49.7%. Nationally, this figure is 55.3%.
The most prevalent medical conditions are arthritis (10.9%) and mental health issues (9.2%). Notably, 61.3% of residents report no medical ailments, compared to 64.1% in Rest of NSW. Wellington has a higher proportion of seniors aged 65 and over at 20.5%, or 1,887 people, compared to Rest of NSW's 19.5%. Health outcomes among seniors are broadly aligned with the general population's health profile.
Frequently Asked Questions - Health
Cultural Diversity
The latest Census data sees Wellington placing among the least culturally diverse areas in the country when compared across a range of language and cultural background related metrics
Wellington's cultural diversity was found to be below average, with 78.6% of its population being citizens, 91.6% born in Australia, and 96.5% speaking English only at home. Christianity is the main religion in Wellington, making up 65.6% of people, similar to the 65.6% across Rest of NSW. The top three ancestry groups are Australian (31.3%), English (28.6%), and Australian Aboriginal (15.2%).
Notably, Irish ethnicity is overrepresented at 7.8%, compared to 8.2% regionally, while French ethnicity stands at 0.4%, slightly higher than the regional average of 0.3%.
Frequently Asked Questions - Diversity
Age
Wellington's population is slightly older than the national pattern
Wellington's median age is 41 years, which is lower than the Rest of NSW average of 43 but higher than the national average of 38. The 25-34 age group makes up 13.9% of Wellington's population, compared to the Rest of NSW figure. The 75-84 cohort represents 6.8%. Post-2021 Census data shows that the 35 to 44 age group has increased from 11.6% to 12.5%, while the 55 to 64 cohort has decreased from 13.6% to 12.9%. By 2041, demographic modeling suggests Wellington's age profile will change significantly. The 35 to 44 cohort is projected to grow by 18%, adding 206 residents to reach 1,353. In contrast, populations in the 15 to 24 and 65 to 74 cohorts are projected to decline.
