Chart Color Schemes
This analysis uses ABS Statistical Areas Level 2 (SA2) boundaries, which can materially differ from Suburbs and Localities (SAL) even when sharing similar names.
SA2 boundaries are defined by the Australian Bureau of Statistics and are designed to represent communities for statistical reporting (e.g., census and ERP).
Suburbs and Localities (SAL) represent commonly-used suburb/locality names (postal-style areas) and may use different geographic boundaries. For comprehensive analysis, consider reviewing both boundary types if available.
est. as @ -- *
ABS ERP | -- people | --
2021 Census | -- people
Sales Activity
Curious about local property values? Filter the chart to assess the volume and appreciation (including resales) trends and regional comparisons, or scroll to the map below view this information at an individual property level.
Find a Recent Sale
Sales Detail
Population
Homebush lies within the top 10% of areas nationally in terms of population growth performance according to AreaSearch analysis of short and medium-term trends
Homebush's population, as per AreaSearch's analysis, was approximately 23,475 by November 2025. This figure shows a rise of 2,653 individuals, representing a 12.7% increase since the 2021 Census, which recorded a population of 20,822. The change is inferred from the estimated resident population of 23,020 in June 2024 and an additional 599 validated new addresses since the Census date. This results in a population density ratio of 6,113 persons per square kilometer, placing Homebush in the top 10% of national locations assessed by AreaSearch, indicating high demand for land in the area. Homebush's growth rate of 12.7% since the 2021 Census surpassed both the SA4 region (6.4%) and the state level, positioning it as a growth leader in the region. Overseas migration contributed approximately 78.3% of overall population gains during recent periods, driving primary growth for the area.
AreaSearch adopts ABS/Geoscience Australia projections for each SA2 area, released in 2024 with 2022 as the base year. For areas not covered by this data, AreaSearch uses NSW State Government's SA2 level projections, released in 2022 with 2021 as the base year. Growth rates by age group from these aggregations are applied to all areas for years 2032 to 2041. Looking ahead, significant population growth is forecasted for Homebush, with an expected increase of 7,344 persons by 2041 based on the latest annual ERP population numbers, reflecting a total increase of 29.4% over the 17-year period.
Frequently Asked Questions - Population
Development
The level of residential development activity in Homebush was found to be higher than 90% of real estate markets across the country
Homebush has recorded approximately 158 residential properties granted approval per year over the past five financial years, totalling 794 homes. As of FY26, zero approvals have been recorded so far. On average, 3.8 people moved to the area annually for each dwelling built between FY21 and FY25, indicating demand significantly outstripping supply. New homes are being constructed at an average cost of $205,000, below the regional average, suggesting more affordable housing options.
In FY26, $32.4 million in commercial approvals have been registered, reflecting high local commercial activity. Compared to Greater Sydney, Homebush records 54.0% more new home approvals per person, offering buyers greater choice. New building activity comprises 11.0% standalone homes and 89.0% townhouses or apartments, promoting higher-density living that caters to downsizers, investors, and first-home buyers. Homebush's population is estimated to grow by 6,889 residents by 2041, potentially outpacing housing supply if current development rates continue, which could increase competition among buyers and support stronger price growth.
Looking ahead, Homebush is expected to grow by 6,889 residents through to 2041 (from the latest AreaSearch quarterly estimate). If current development rates continue, housing supply may not keep pace with population growth, potentially increasing competition among buyers and supporting stronger price growth.
Frequently Asked Questions - Development
Infrastructure
Homebush has very high levels of nearby infrastructure activity, ranking in the top 10% nationally
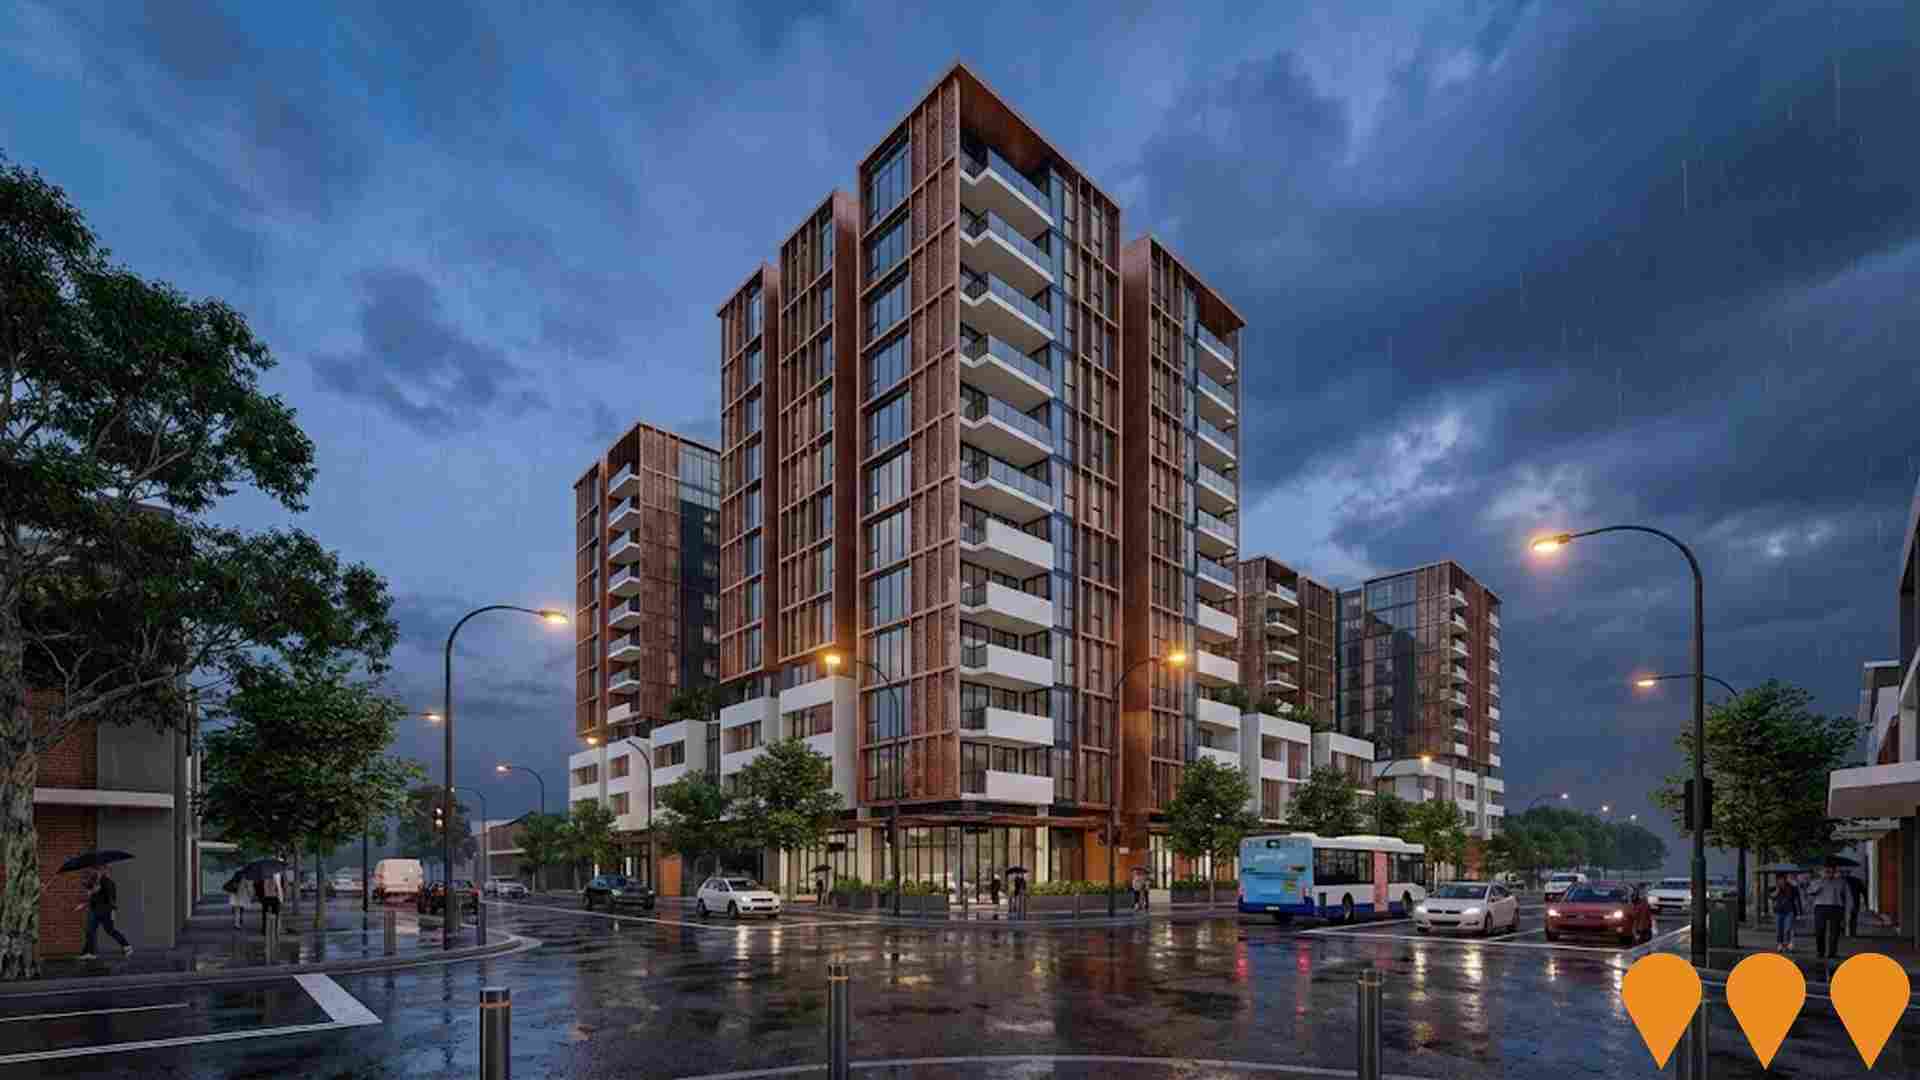
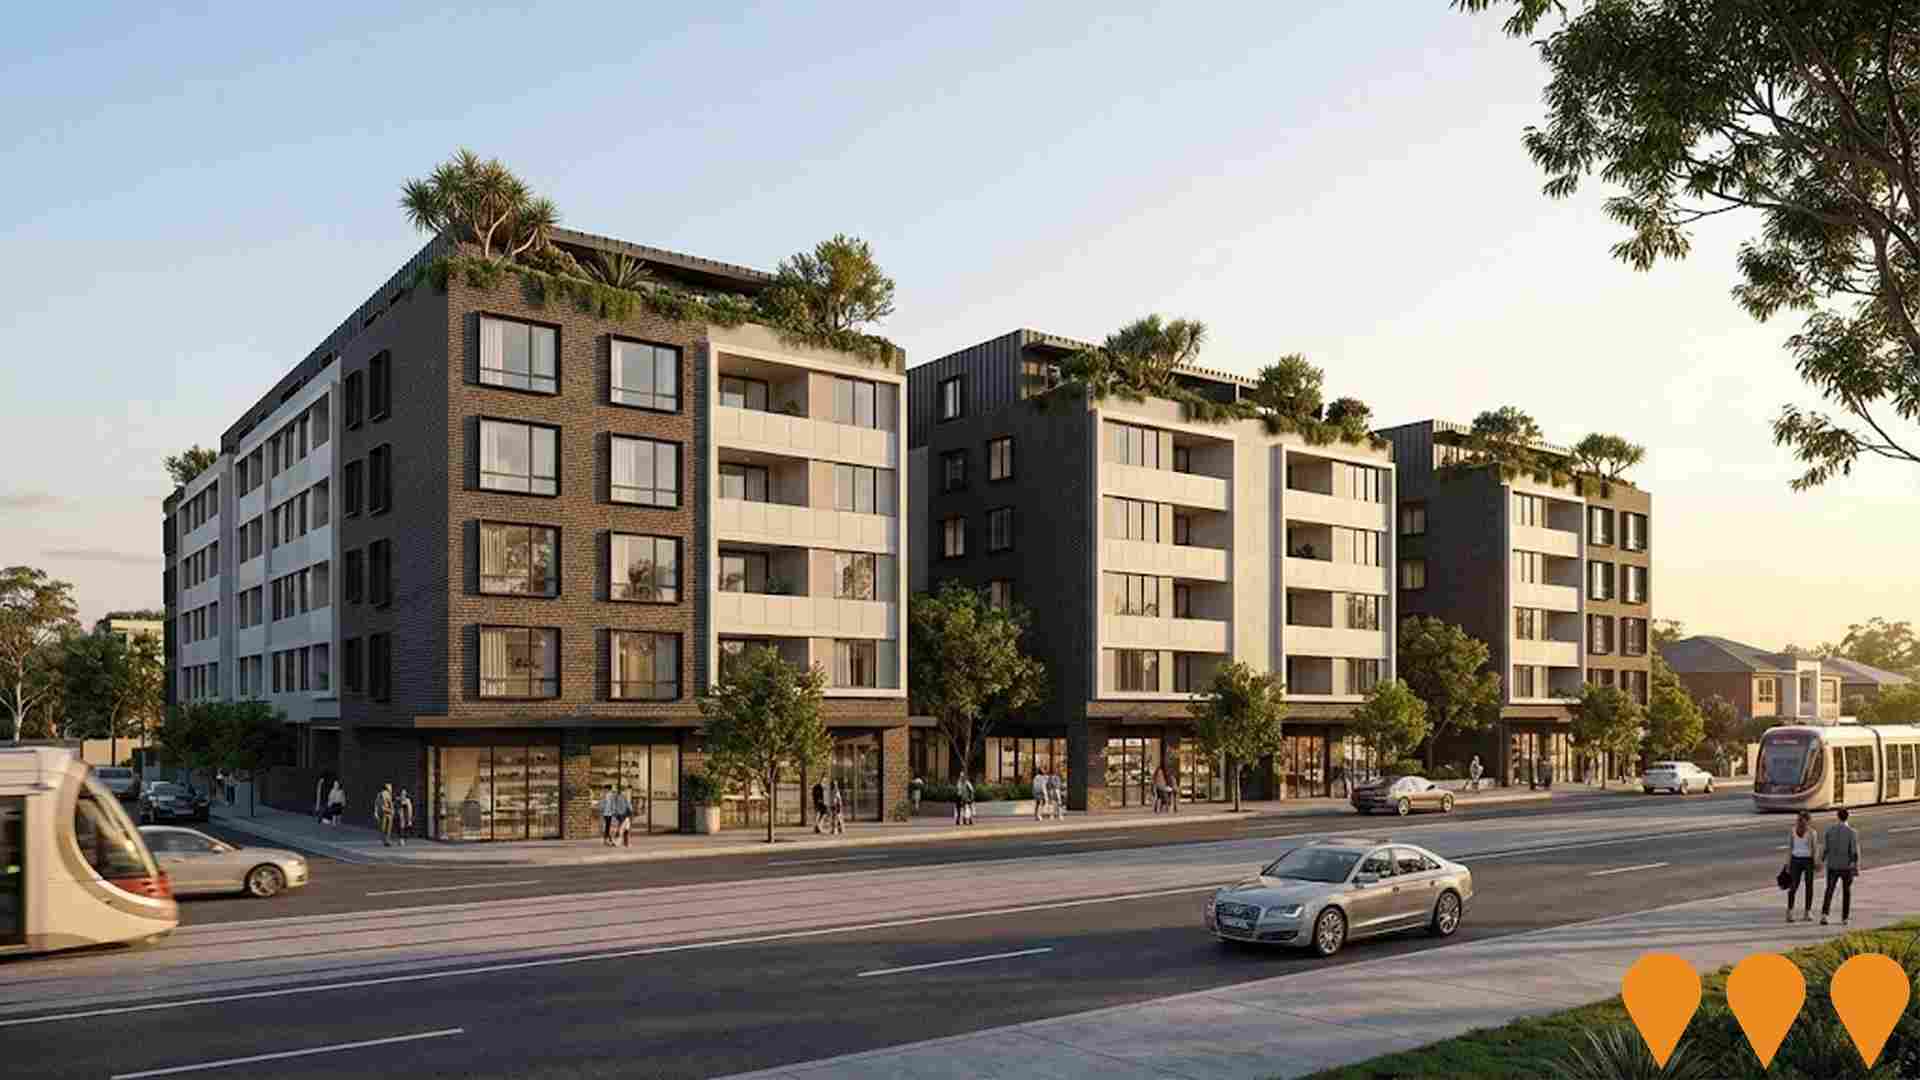
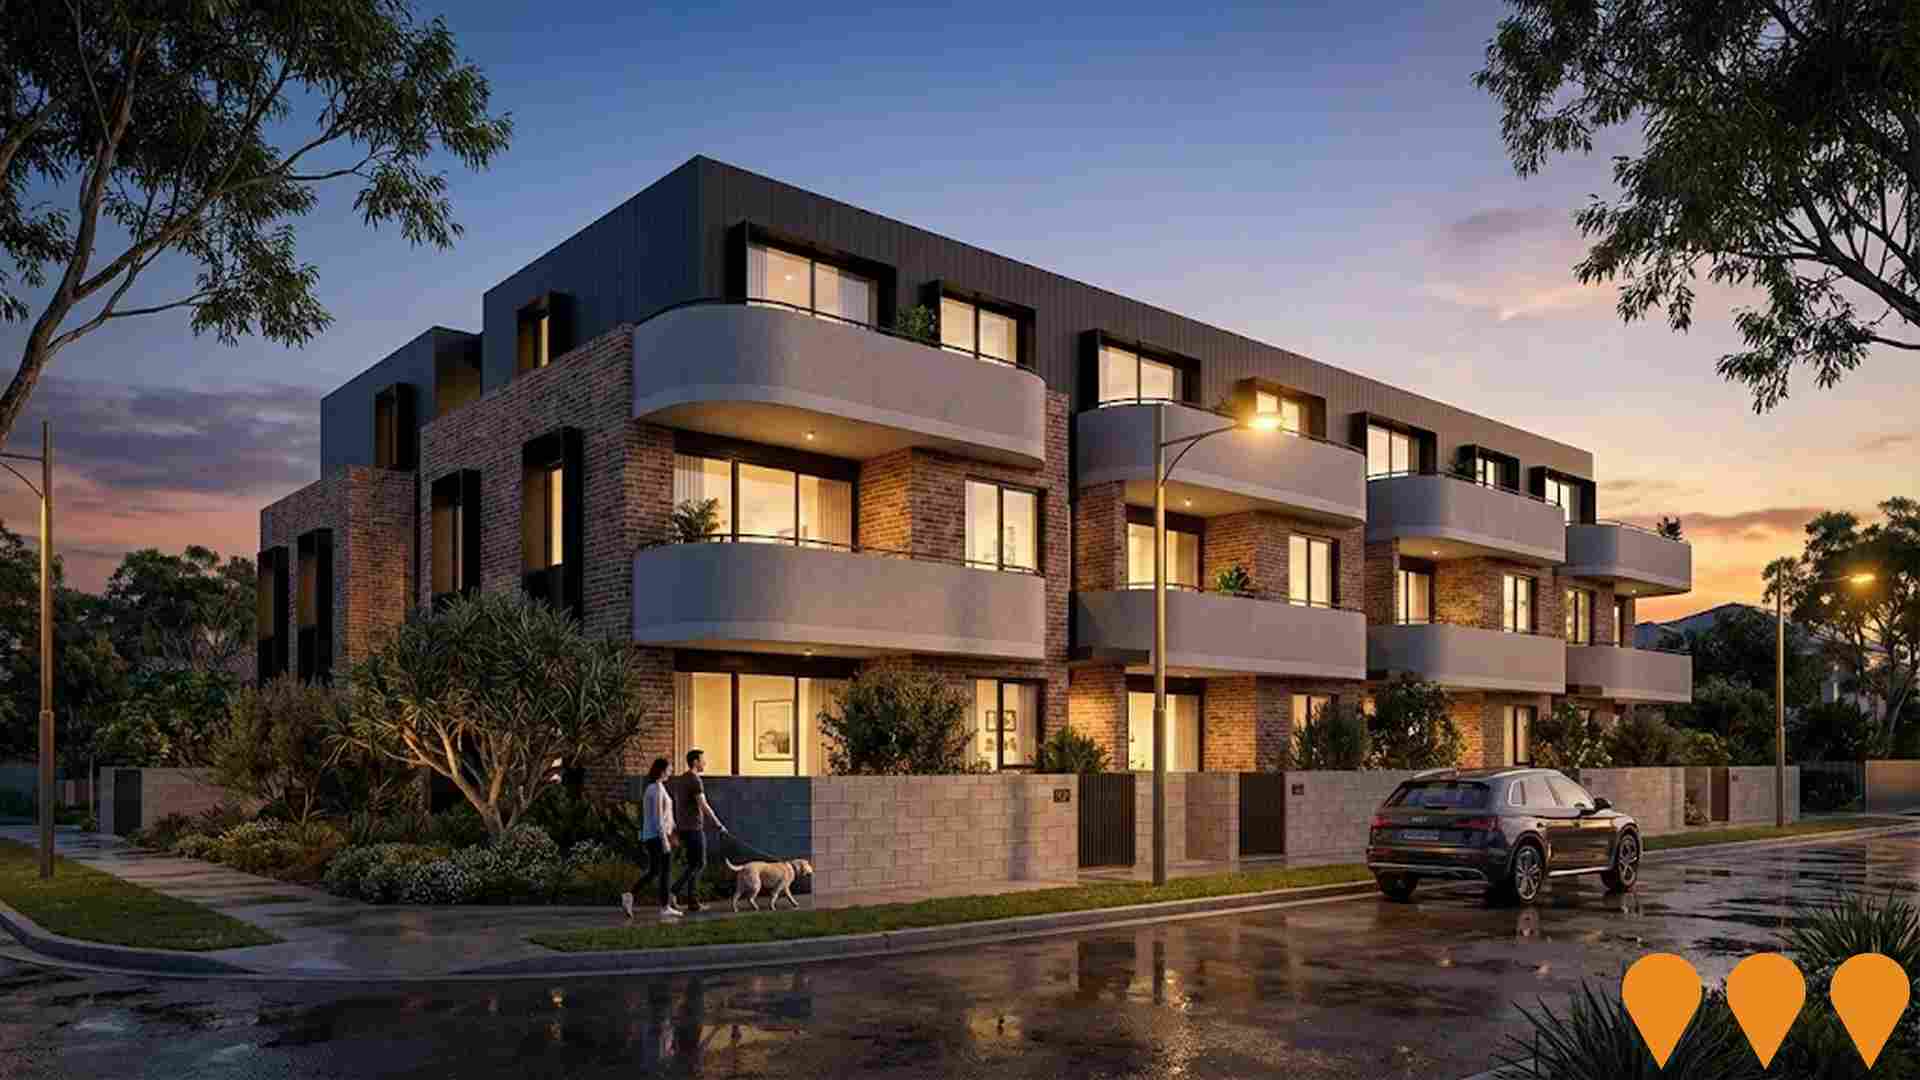
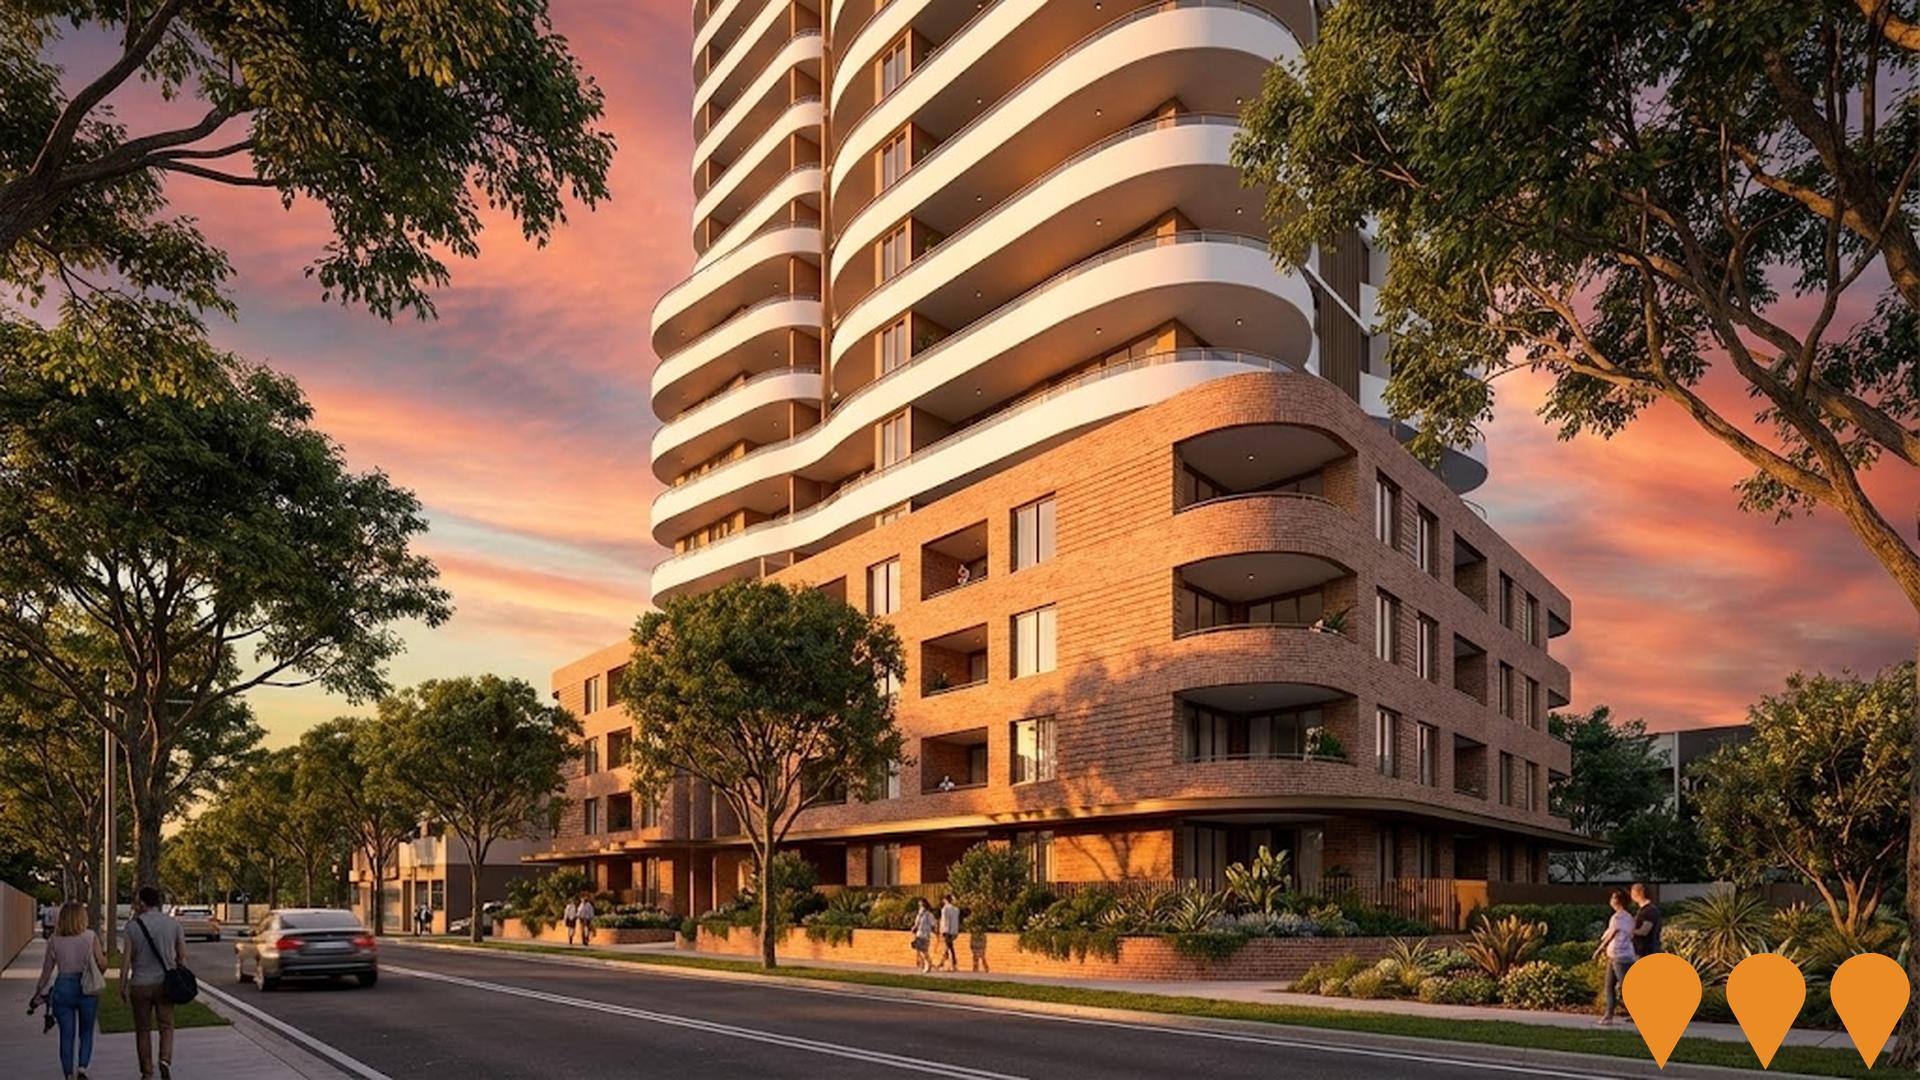
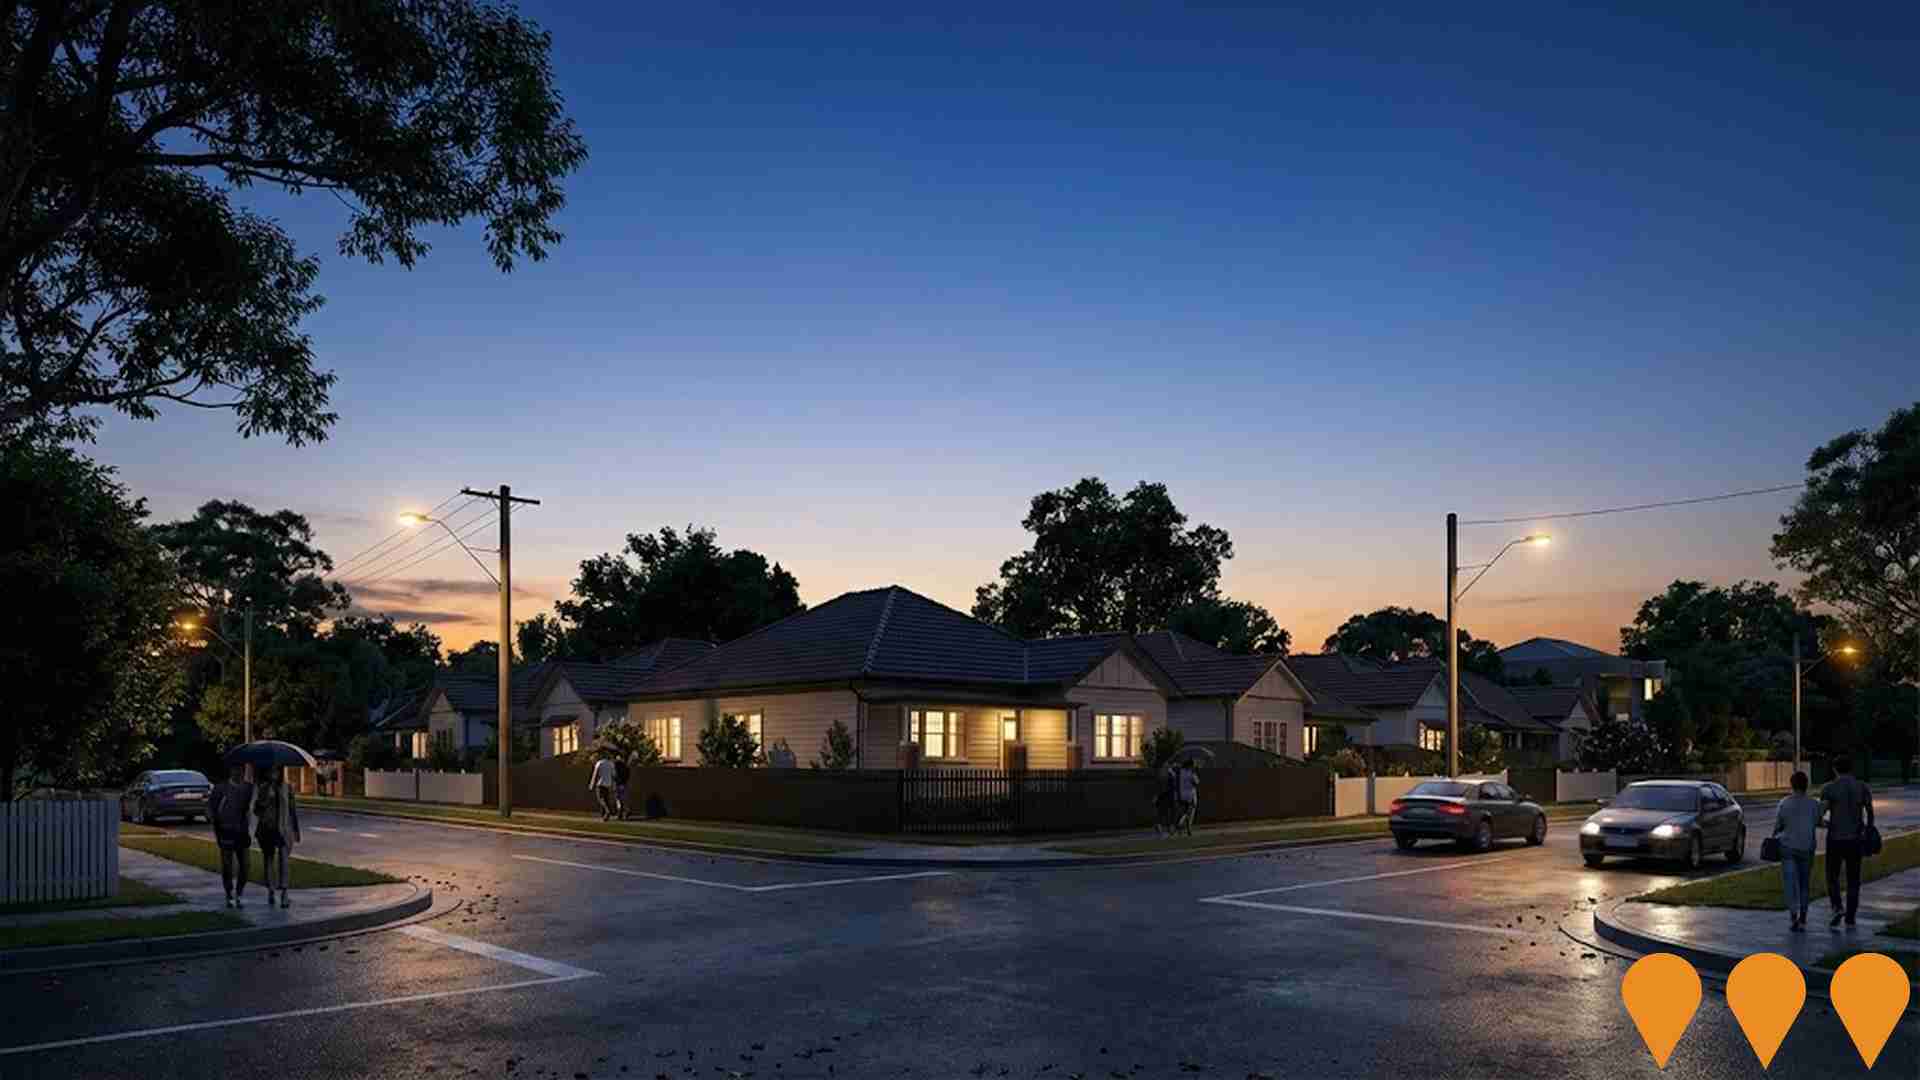
Changes in local infrastructure significantly impact an area's performance. AreaSearch has identified 51 projects that may affect this region. Notable ones include the Parramatta Road Urban Amenity Improvement Program, Sydney Metro West - Sydney Olympic Park Station and Precinct, Bridge Road Residences, and 136 Parramatta Road Mixed-Use Hotel. The following list details those most likely to be relevant.
Professional plan users can use the search below to filter and access additional projects.
INFRASTRUCTURE SEARCH
 Denotes AI-based impression for illustrative purposes only, not to be taken as definitive under any circumstances. Please follow links and conduct other investigations from the project's source for actual imagery. Developers and project owners wishing us to use original imagery please Contact Us and we will do so.
Frequently Asked Questions - Infrastructure
Sydney Metro West - Sydney Olympic Park Station and Precinct
New underground metro station on the Sydney Metro West line with an integrated above-station precinct development. The station is under construction, with station box excavation completed in 2024 by Acciona Ferrovial JV. The Integrated Station Development (ISD) includes three mixed-use towers (27-45 storeys) delivering over 690 apartments (increased from original ~500 via MOD 2 approved October 2025), commercial office space, retail and public domain improvements. Three consortia shortlisted for the ISD PPP contract, with award now expected mid-2026. Station due to open 2032, full precinct completion expected 2034-2035.

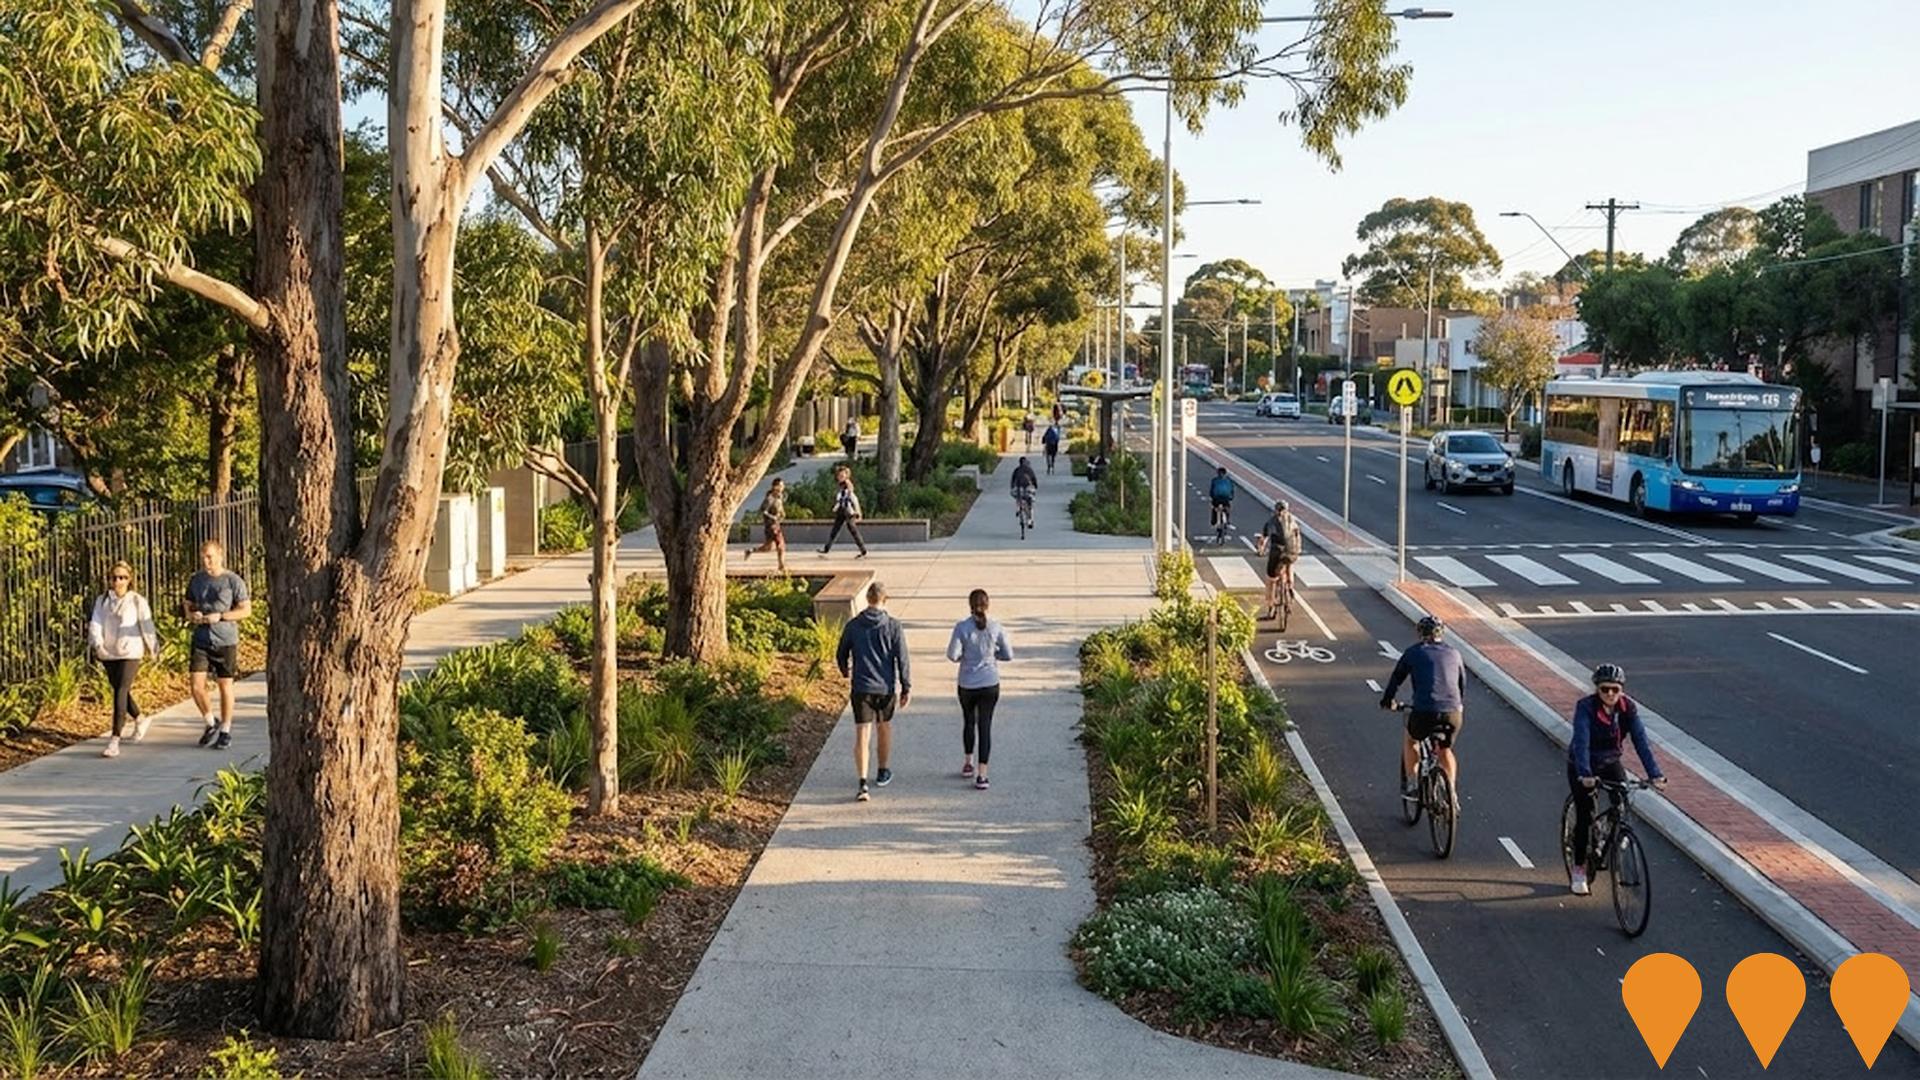
Parramatta Road Urban Amenity Improvement Program
A $198 million NSW Government program (PRUAIP) delivering 32 urban amenity projects along the 20km Parramatta Road corridor in partnership with six inner-west councils. Includes new parks, plazas, streetscape upgrades, over 10,000 new trees, separated cycleways, wider footpaths, public art and improved pedestrian crossings. As of December 2025, approximately 60% of projects are complete or under construction, with the full program on track for completion by 2027-2028.
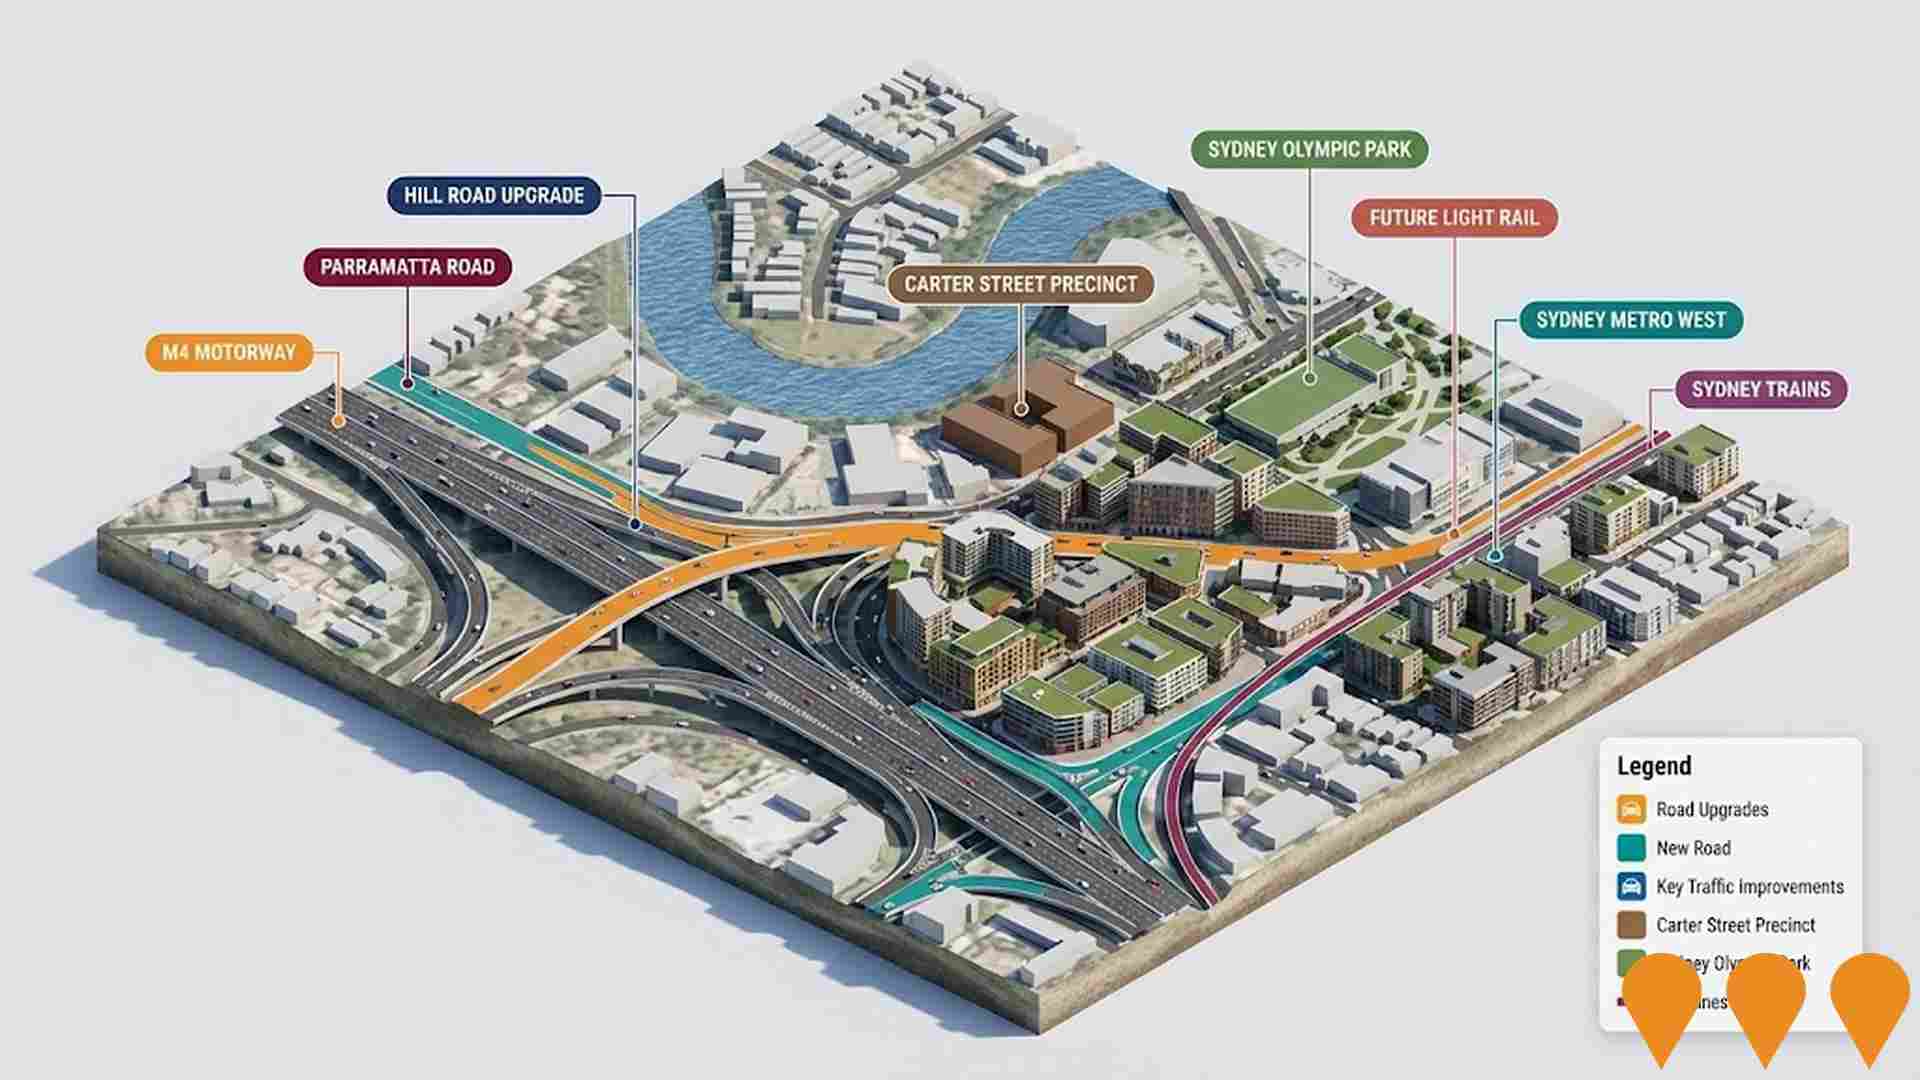
Hill Road Upgrade
A major road upgrade by Transport for NSW to improve connectivity between Sydney Olympic Park and Lidcombe. The project upgrades Hill Road between Parramatta Road and Bombay Street to the south and Old Hill Link to the north, improving connectivity to Carter Street Precinct, Sydney Olympic Park and surrounding areas. Key features include upgrading the intersection of Parramatta Road and Hill Road, widening the M4 Motorway eastbound off-ramp to Hill Road and signalising the intersection, upgrading the Hill Road and John Ian Wing Parade intersection with a new fourth approach through Stockyard Boulevard, and creating new shared pathways for cyclists and pedestrians. The project will ease congestion, deliver reliable travel times and improve safety for all road users. Construction commenced in March 2025 by contractor Abergeldie Complex Infrastructure and is expected to be completed in late 2027. The project is funded as part of the $140 million Housing Acceleration Fund by the Department of Planning, Housing and Infrastructure.
136 Parramatta Road Mixed-Use Hotel
IRIS Capital's first build-to-rent project featuring approved mixed-use development with hotel, 63 serviced and residential apartments, and basement parking. Luxury development with upper floor levels commanding CBD views.

Ovation Quarter
Multi-stage master-planned development by AYMCI adjacent to Sydney Olympic Park, featuring luxury residential towers, retail precincts, community facilities, and public spaces. The initial stages, including Emerald, Ruby, and Sapphire buildings totaling 421 apartments, have been completed and sold out. The overall development plans for approximately 3000 apartments, with further stages DA-approved and land being marketed.
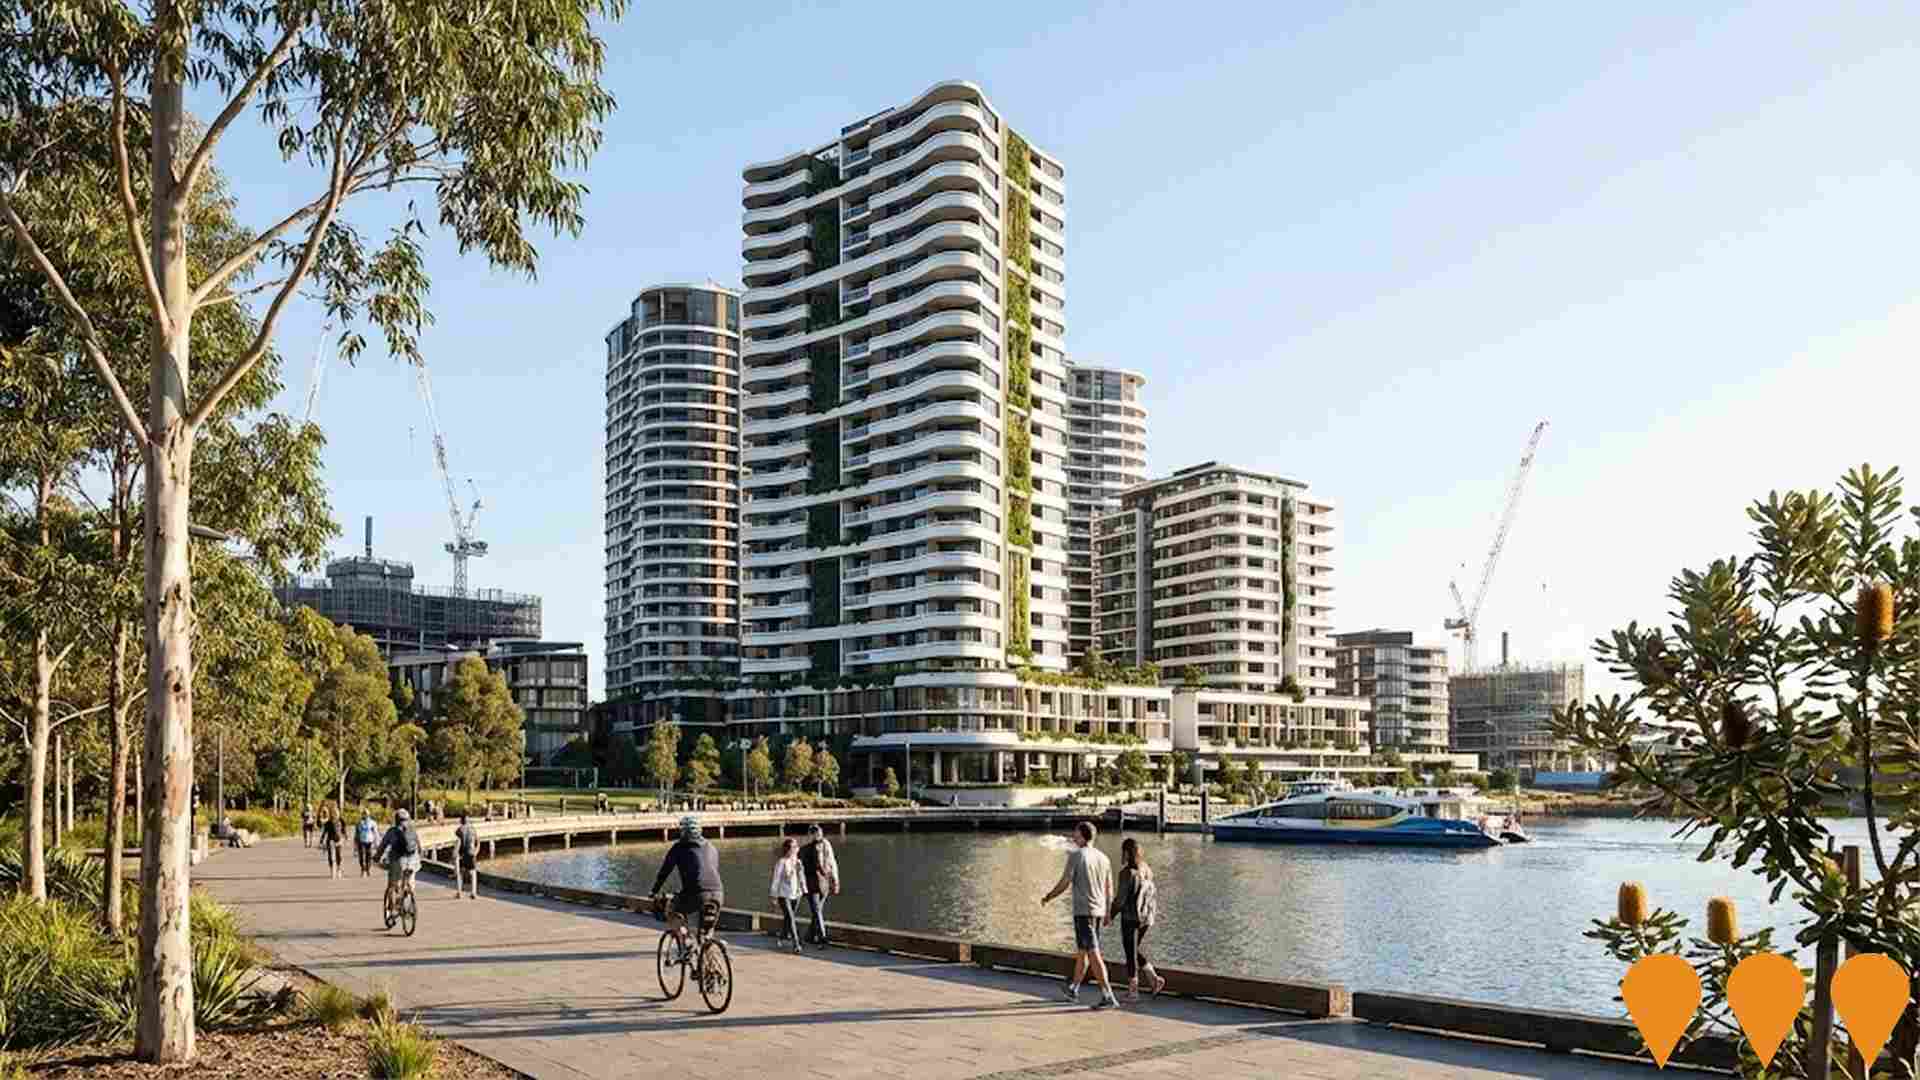
The Crescent
88-apartment development across 8 floors in 2 buildings, featuring 1-3 bedroom apartments with unparalleled finishes and luxury design. Includes communal open space, pool, and premium amenities. Sets new benchmark for luxury living in Homebush.
Sydney Markets Rezoning (Parramatta Road Precinct)
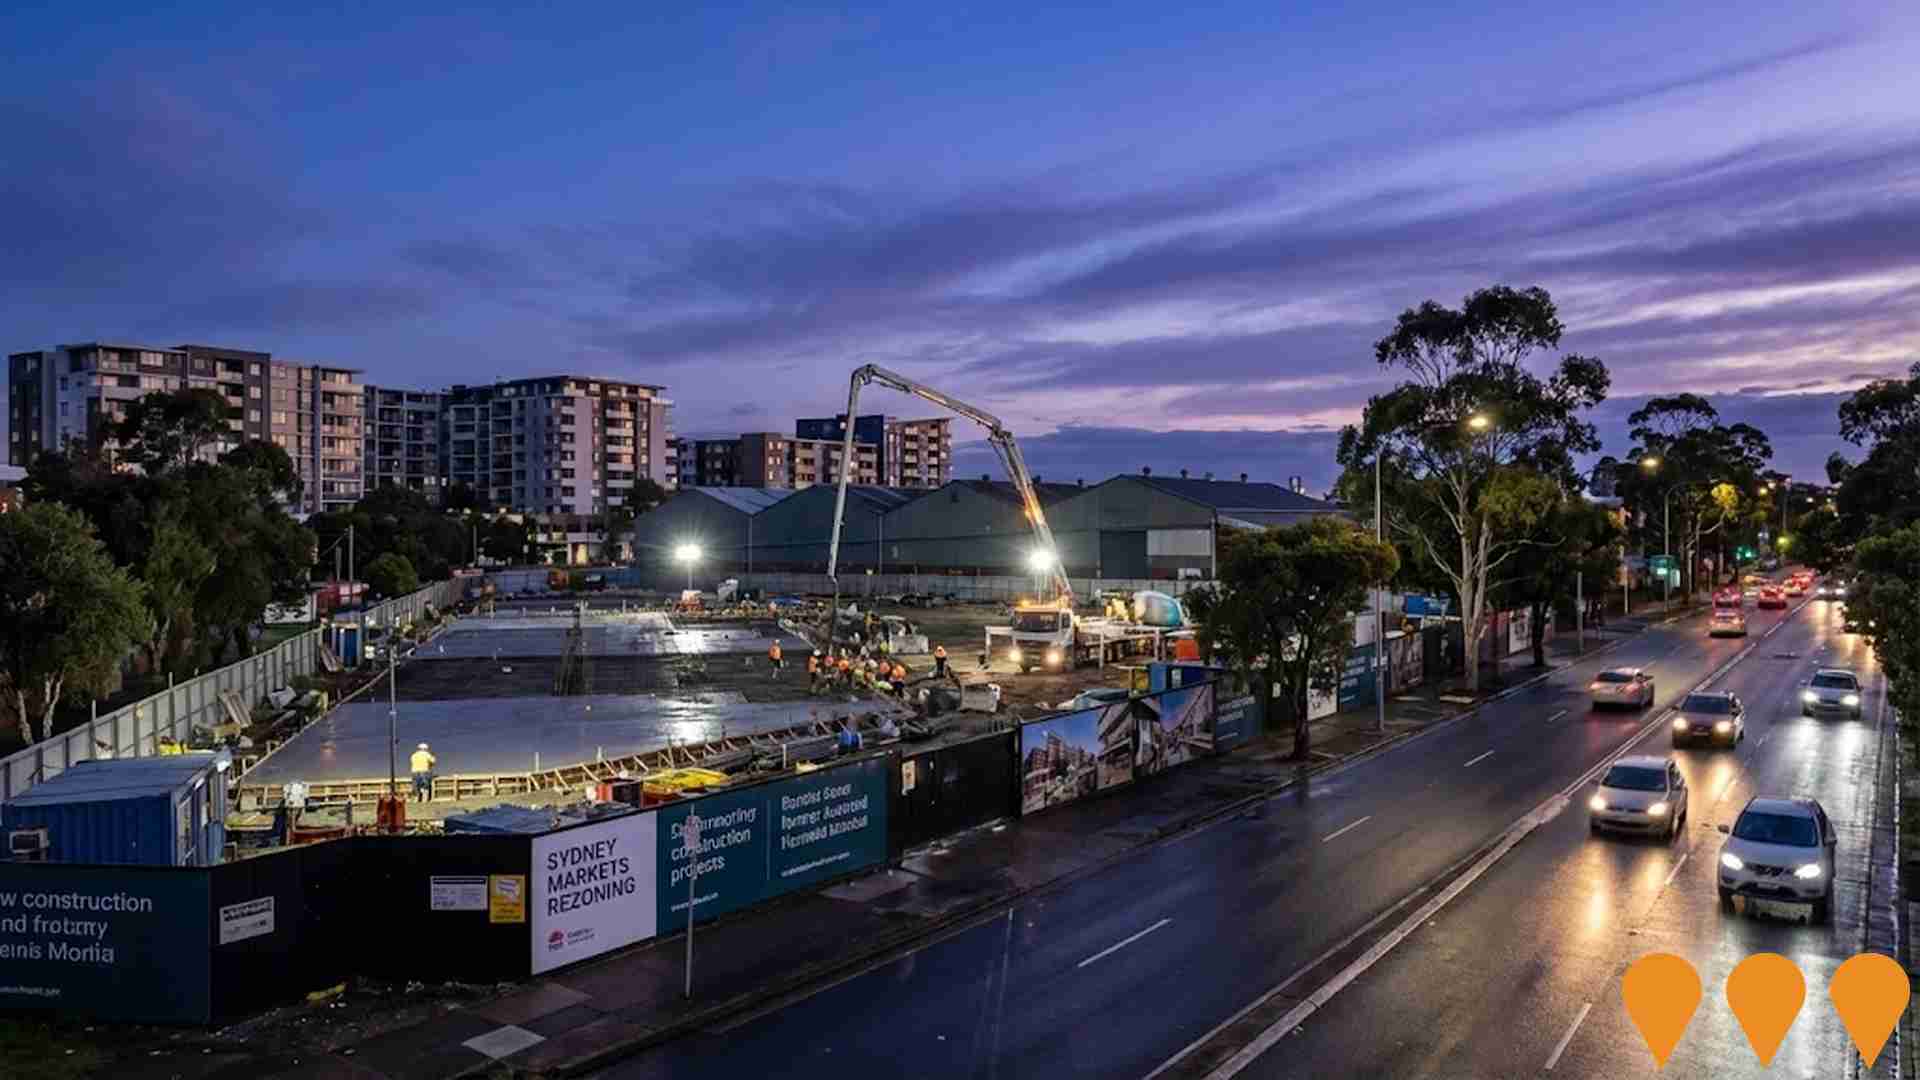
A state-assessed rezoning proposal for a portion of the Sydney Markets site (along Parramatta Road, Flemington) to allow for a mixed-use precinct. The proposal unlocks the capacity for up to 1,500 new homes, approximately 20,000 sqm of supporting non-residential floor space (retail, commercial), and new green open space. The rezoning was selected for fast-tracked assessment under the NSW Government's State Significant Rezoning Policy to boost housing supply in a well-located area. The core Sydney Markets operations will remain at Flemington.
Atrium The Retreat
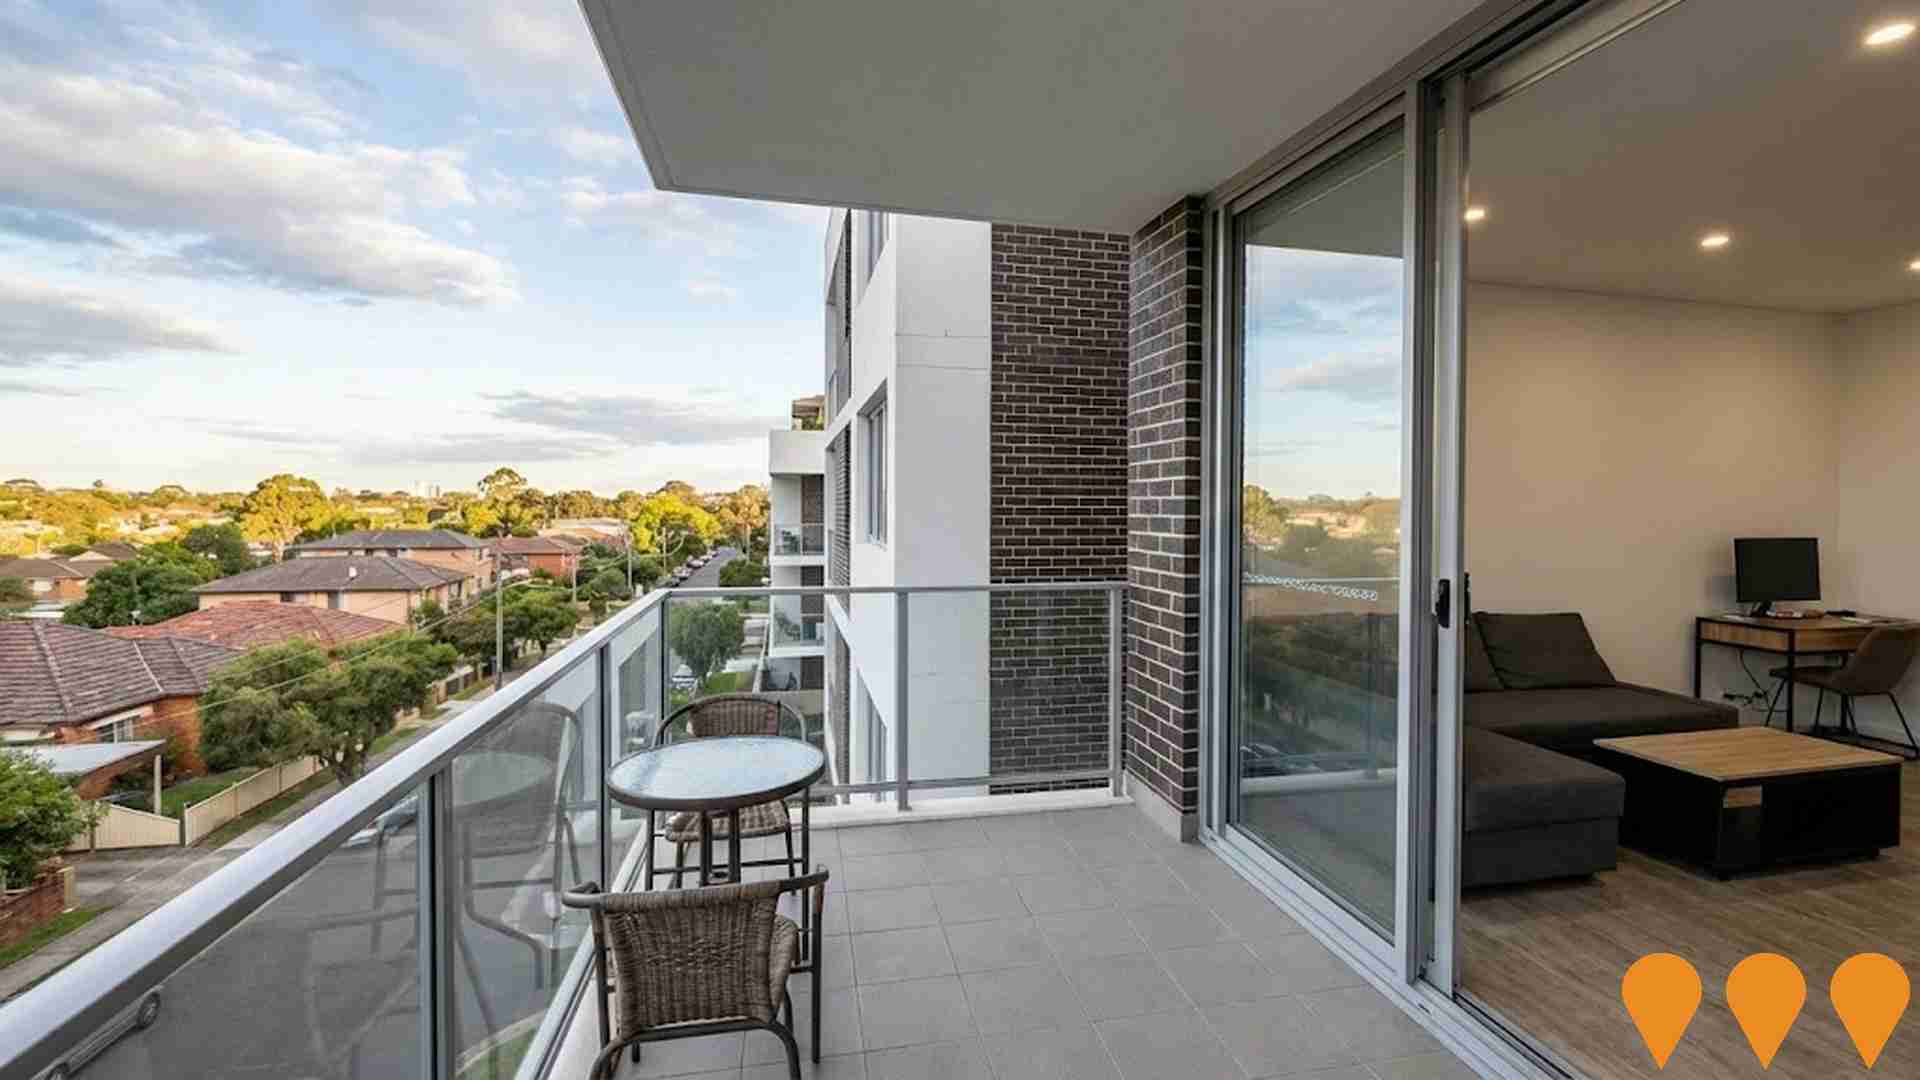
A residential oasis home to the tallest towers in the Sydney Olympic Park area, rising 43 levels with 655 luxury 1, 2, 3 and 4 bedroom apartments across two towers. The final release within The Retreat master-planned community by Meriton, featuring oversized layouts, premium finishes, a vibrant retail precinct with cafes, restaurants, Woolworths, BWS and a 75-place childcare centre, plus resort-style amenities including pools, gym, gardens and a community centre.

Employment
Employment performance in Homebush has been broadly consistent with national averages
Homebush has a highly educated workforce with strong representation in professional services. Its unemployment rate is 3.6%.
Over the past year, it has shown relative employment stability. As of September 2025, 14,470 residents are employed, with an unemployment rate of 3.6%, which is 0.6% below Greater Sydney's rate of 4.2%. Workforce participation in Homebush is 67.3%, compared to Greater Sydney's 60.0%. The key industries of employment among residents are health care & social assistance, professional & technical services, and retail trade.
Notably, accommodation & food services have employment levels at 1.4 times the regional average. Conversely, construction employment is under-represented in Homebush, with only 5.3% of its workforce compared to Greater Sydney's 8.6%. While local employment opportunities exist, many residents commute elsewhere for work based on Census data. Between September 2024 and September 2025, employment increased by 0.1%, while labour force increased by 0.5%, leading to a rise in unemployment of 0.4 percentage points. In comparison, Greater Sydney experienced employment growth of 2.1% and labour force growth of 2.4%, with an unemployment rate increase of 0.2 percentage points. State-wide, NSW employment contracted by 0.03% between November 2024 and November 2025, losing 2,260 jobs, with a state unemployment rate of 3.9%. Nationally, the unemployment rate was 4.3%. Jobs and Skills Australia's national employment forecasts from May-25 project national employment growth of 6.6% over five years and 13.7% over ten years. Applying these projections to Homebush's employment mix suggests local employment should increase by 6.9% over five years and 14.0% over ten years, based on a simple weighting extrapolation for illustrative purposes.
Frequently Asked Questions - Employment
Income
Income levels align closely with national averages, indicating typical economic conditions for Australian communities according to AreaSearch analysis
The Homebush SA2 had a median income of $49,606 and an average income of $64,018 in financial year 2022, according to the latest ATO data aggregated by AreaSearch. These figures were lower than Greater Sydney's median income of $56,994 and average income of $80,856. By September 2025, estimates based on a 12.61% Wage Price Index growth suggest the median income would be approximately $55,861 and the average income around $72,091. Census data indicates that incomes in Homebush cluster around the 67th percentile nationally. Income analysis shows that 39.3% of the population, equating to 9,225 individuals, fall within the $1,500 - $2,999 income range. This is consistent with broader trends across the surrounding region where 30.9% of the population falls into the same category. High housing costs consume 20.3% of income in Homebush. Despite this, strong earnings place disposable income at the 61st percentile nationally. The area's SEIFA income ranking places it in the 7th decile.
Frequently Asked Questions - Income
Housing
Homebush features a more urban dwelling mix with significant apartment living, with a higher proportion of rental properties than the broader region
In Homebush, as per the latest Census, 10.2% of dwellings were houses while 89.8% consisted of semi-detached homes, apartments, and other types. This contrasts with Sydney metropolitan areas where 33.5% of dwellings are houses and 66.5% are other types. Homebush's home ownership rate was 10.9%, lower than Sydney metro's average. Mortgaged dwellings accounted for 29.8% and rented ones for 59.3%. The median monthly mortgage repayment in the area was $2,127, below Sydney metro's average of $2,436. Median weekly rent in Homebush was $450, compared to Sydney metro's $465. Nationally, Homebush's mortgage repayments were higher at $2,127 versus the Australian average of $1,863, and rents were substantially above the national figure of $375.
Frequently Asked Questions - Housing
Household Composition
Homebush features high concentrations of group households, with a higher-than-average median household size
Family households comprise 67.7% of all households, including 30.2% couples with children, 27.2% couples without children, and 7.5% single parent families. Non-family households account for the remaining 32.3%, with lone person households at 21.5% and group households comprising 10.9%. The median household size is 2.6 people, larger than the Greater Sydney average of 2.5 people.
Frequently Asked Questions - Households
Local Schools & Education
Homebush shows strong educational performance, ranking in the upper quartile nationally when assessed across multiple qualification and achievement indicators
Homebush has a notably high level of educational attainment. As of 2016, 55.8% of residents aged 15 years or above held university qualifications. This figure is significantly higher than the national average of 30.4% and the NSW average of 32.2%. The area's educational advantage is reflected in its strong focus on knowledge-based opportunities.
The majority of these university qualifications are Bachelor degrees, with 34.1% of residents holding one. Postgraduate qualifications follow at 19.6%, while graduate diplomas account for 2.1%. Vocational pathways are also pursued by a significant number of residents aged 15 years or above, with advanced diplomas making up 11.4% and certificates accounting for 8.3%. Educational participation in the area is notably high, with 33.5% of residents currently enrolled in formal education as of 2016. This includes 10.6% pursuing tertiary education, 7.3% in primary education, and 4.5% engaged in secondary education.
Frequently Asked Questions - Education
Schools Detail
Nearby Services & Amenities
Transport
Transport servicing is good compared to other areas nationally based on assessment of service frequency, route connectivity and accessibility
The analysis shows 48 active public transport stops in Homebush. These are a mix of train and bus services. There are 19 individual routes operating, which together provide 6,185 weekly passenger trips.
The accessibility of these services is rated as good, with residents typically located 220 meters from the nearest stop. On average, there are 883 trips per day across all routes, equating to approximately 128 weekly trips per individual stop.
Frequently Asked Questions - Transport
Transport Stops Detail
Health
Homebush's residents boast exceedingly positive health performance metrics with very low prevalence of common health conditions across all age groups
Health outcomes data shows exceptional results across Homebush, with very low prevalence of common health conditions across all age groups. The rate of private health cover stands at approximately 51% of the total population (~12,019 people), slightly lower than the average SA2 area's 57.3%, and Greater Sydney's 57.3%.
Asthma and diabetes are the most common medical conditions in Homebush, affecting 3.7% and 3.3% of residents respectively. A total of 86.6% of residents report being completely free from medical ailments, compared to 77.0% across Greater Sydney. The area has 7.5% of residents aged 65 and over (1,755 people), lower than the 14.5% in Greater Sydney. Health outcomes among seniors are particularly strong, aligning with the general population's health profile.
Frequently Asked Questions - Health
Cultural Diversity
Homebush is among the most culturally diverse areas in the country based on AreaSearch assessment of a range of language and cultural background related metrics
Homebush has a high level of cultural diversity, with 75.8% of its residents speaking a language other than English at home and 71.4% born overseas. The predominant religion in Homebush is Hinduism, practiced by 29.3% of the population, which is higher than the Greater Sydney average of 11.2%. In terms of ancestry, the top three groups are Other (27.6%), Chinese (21.8%), and Indian (14.4%).
The percentage of people with an Other ancestry in Homebush is substantially higher than the regional average of 17.6%. Additionally, there are significant differences in the representation of Korean (6.0% vs regional 2.8%), Sri Lankan (1.0% vs regional 0.4%), and Vietnamese (2.1% vs regional 2.1%) ethnic groups.
Frequently Asked Questions - Diversity
Age
Homebush hosts a very young demographic, ranking in the bottom 10% of areas nationwide
Homebush has a median age of 32 years, which is younger than Greater Sydney's average of 37 and lower than Australia's national average of 38 years. Compared to Greater Sydney, Homebush has a higher proportion of residents aged 25-34 (30.6%) but fewer residents aged 55-64 (6.3%). This concentration of 25-34 year-olds is significantly higher than the national average of 14.5%. According to post-2021 Census data, the proportion of residents aged 35-44 has increased from 17.9% to 19.5%, while the proportion of those aged 25-34 has decreased from 32.8% to 30.6%. By 2041, demographic modeling suggests that Homebush's age profile will change significantly. The strongest projected growth is in the 45-54 cohort, with an increase of 69%, adding 1,396 residents to reach a total of 3,411.
