Chart Color Schemes
This analysis uses ABS Statistical Areas Level 2 (SA2) boundaries, which can materially differ from Suburbs and Localities (SAL) even when sharing similar names.
SA2 boundaries are defined by the Australian Bureau of Statistics and are designed to represent communities for statistical reporting (e.g., census and ERP).
Suburbs and Localities (SAL) represent commonly-used suburb/locality names (postal-style areas) and may use different geographic boundaries. For comprehensive analysis, consider reviewing both boundary types if available.
est. as @ -- *
ABS ERP | -- people | --
2021 Census | -- people
Sales Activity
Curious about local property values? Filter the chart to assess the volume and appreciation (including resales) trends and regional comparisons, or scroll to the map below view this information at an individual property level.
Find a Recent Sale
Sales Detail
Population
Wright lies within the top quartile of areas nationally for population growth performance according to AreaSearch analysis of recent, and medium to long-term trends
Wright's population is 4,374 as of November 2025. This figure reflects an increase of 566 people since the 2021 Census, which reported a population of 3,808 people. The change is inferred from the estimated resident population of 4,374 from the ABS in June 2024 and an additional 253 validated new addresses since the Census date. This results in a population density ratio of 3,444 persons per square kilometer, placing Wright in the upper quartile relative to national locations assessed by AreaSearch. Wright's growth of 14.9% since the 2021 census exceeded the state average of 5.9%. Population growth was primarily driven by interstate migration contributing approximately 44.3% during recent periods, although all factors including natural growth and overseas migration were positive.
AreaSearch adopts ABS/Geoscience Australia projections for each SA2 area, released in 2024 with a base year of 2022. For areas not covered by this data and years post-2032, age group growth rates from the ACT Government's SA2 area projections are adopted, using 2022 as a base year. Looking ahead, population projections indicate an increase just below the median of statistical areas analysed by AreaSearch, with Wright expected to increase by 315 persons to 2041 based on the latest annual ERP population numbers, reflecting a total increase of 7.2% over the 17 years.
Frequently Asked Questions - Population
Development
AreaSearch assessment of residential development activity positions Wright among the top 25% of areas assessed nationwide
Wright has seen approximately 55 new homes approved annually. Over the past five financial years, from FY-21 to FY-25, around 278 homes were approved, with none approved so far in FY-26. On average, about 3.3 people moved to the area each year for every dwelling built during these five years, indicating a substantial lag between supply and demand, which typically leads to heightened buyer competition and pricing pressures.
The average expected construction cost of new dwellings was $66,000, below the regional average, suggesting more affordable housing options for buyers. This financial year has seen around $10.8 million in commercial approvals, indicating steady commercial investment activity. Comparatively, Wright records significantly lower building activity than the Australian Capital Territory, with an 82.0% decrease from the regional average per person. This constrained new construction often reinforces demand and pricing for existing dwellings. However, this level is above average nationally, reflecting strong developer confidence in the area. Recent development trends show 12.0% detached houses and 88.0% medium to high-density housing, marking a significant shift from current housing patterns of 40.0% houses. This trend may indicate diminishing developable land availability and responds to evolving lifestyle preferences and housing affordability needs.
With around 297 people per dwelling approval, Wright demonstrates a developing market. According to the latest AreaSearch quarterly estimate, Wright is projected to add approximately 315 residents by 2041. At current development rates, new housing supply should comfortably meet demand, providing favorable conditions for buyers and potentially supporting growth beyond current population projections.
Frequently Asked Questions - Development
Infrastructure
Wright has emerging levels of nearby infrastructure activity, ranking in the 21stth percentile nationally
No changes can significantly affect a region's performance like alterations to local infrastructure, major projects, and planning initiatives. A total of zero projects have been identified by AreaSearch that are expected to impact this area. Notable projects include Molonglo Group Centre to Town Centre Transition, Molonglo Town Centre, Molonglo River Bridge and John Gorton Drive Extension, and Denman Apartments. The following list specifies those likely to be most relevant.
Professional plan users can use the search below to filter and access additional projects.
INFRASTRUCTURE SEARCH
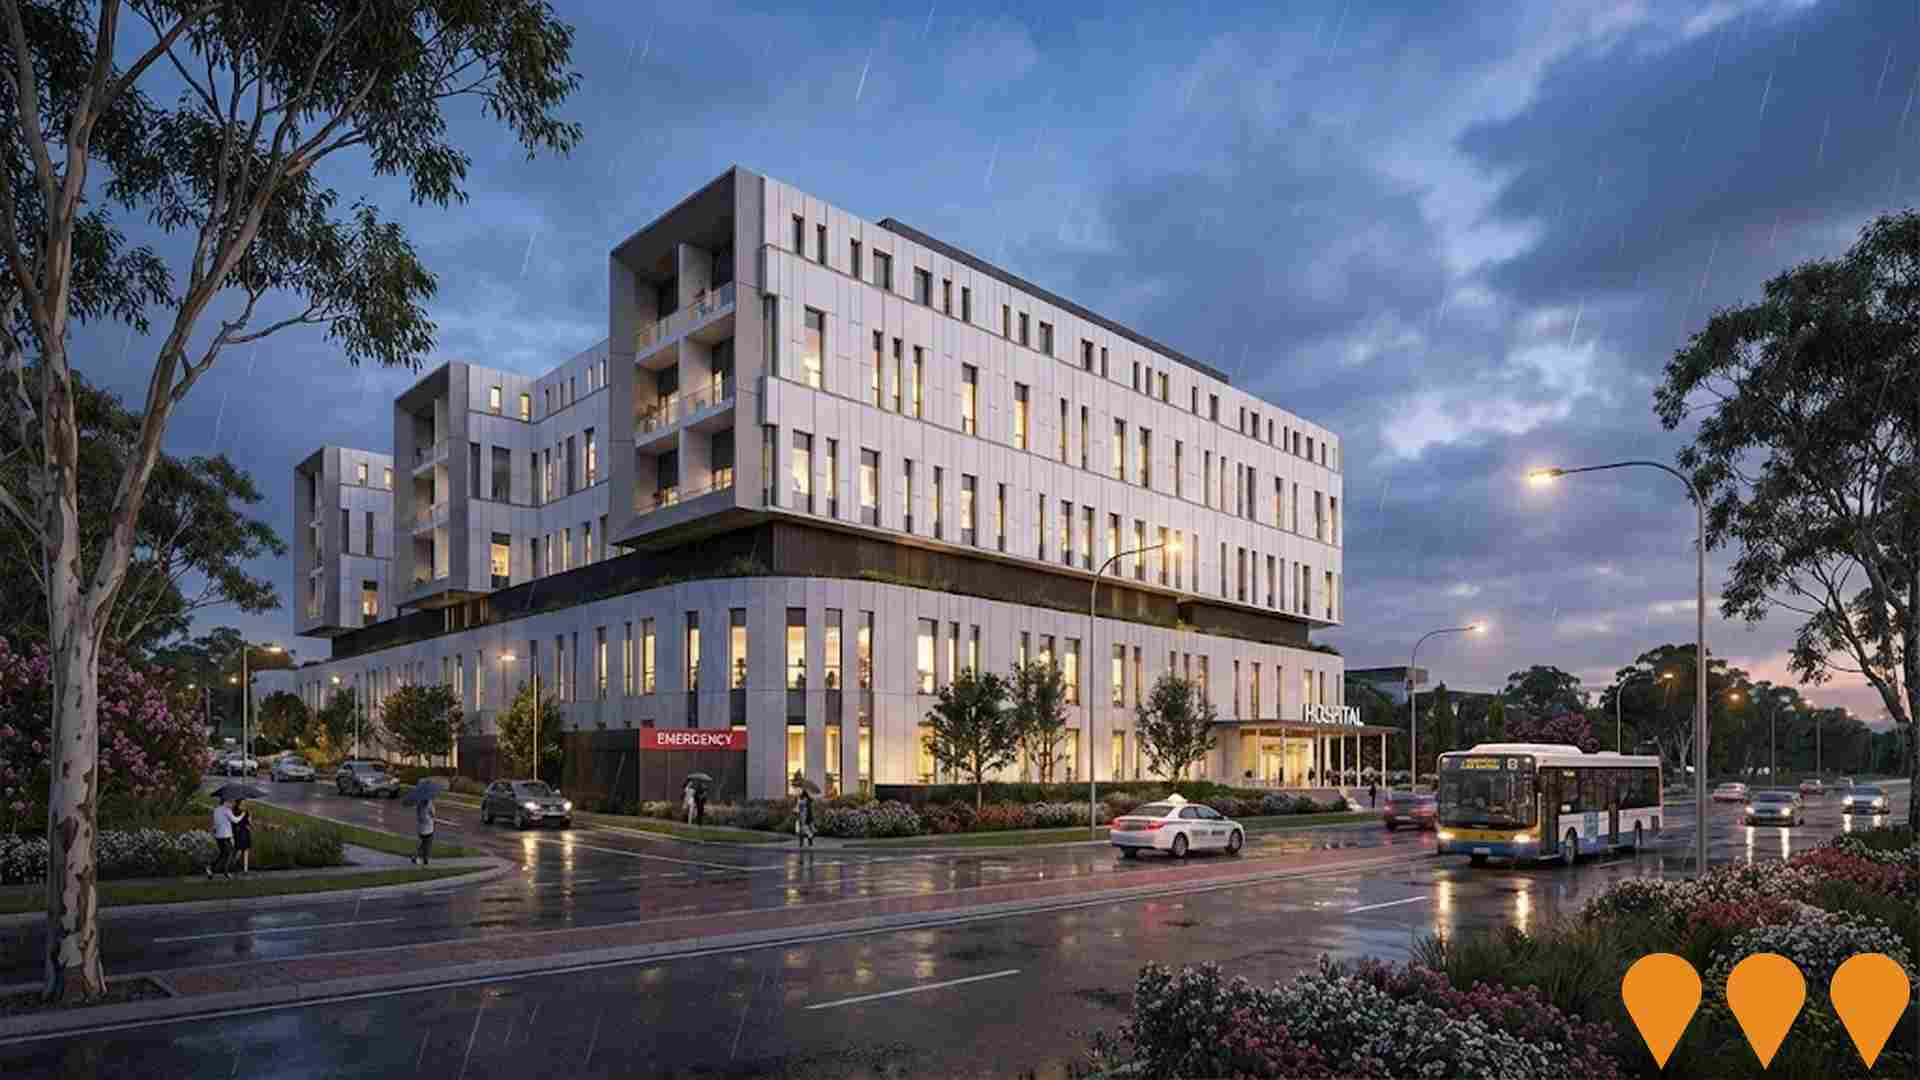
 Denotes AI-based impression for illustrative purposes only, not to be taken as definitive under any circumstances. Please follow links and conduct other investigations from the project's source for actual imagery. Developers and project owners wishing us to use original imagery please Contact Us and we will do so.
Frequently Asked Questions - Infrastructure
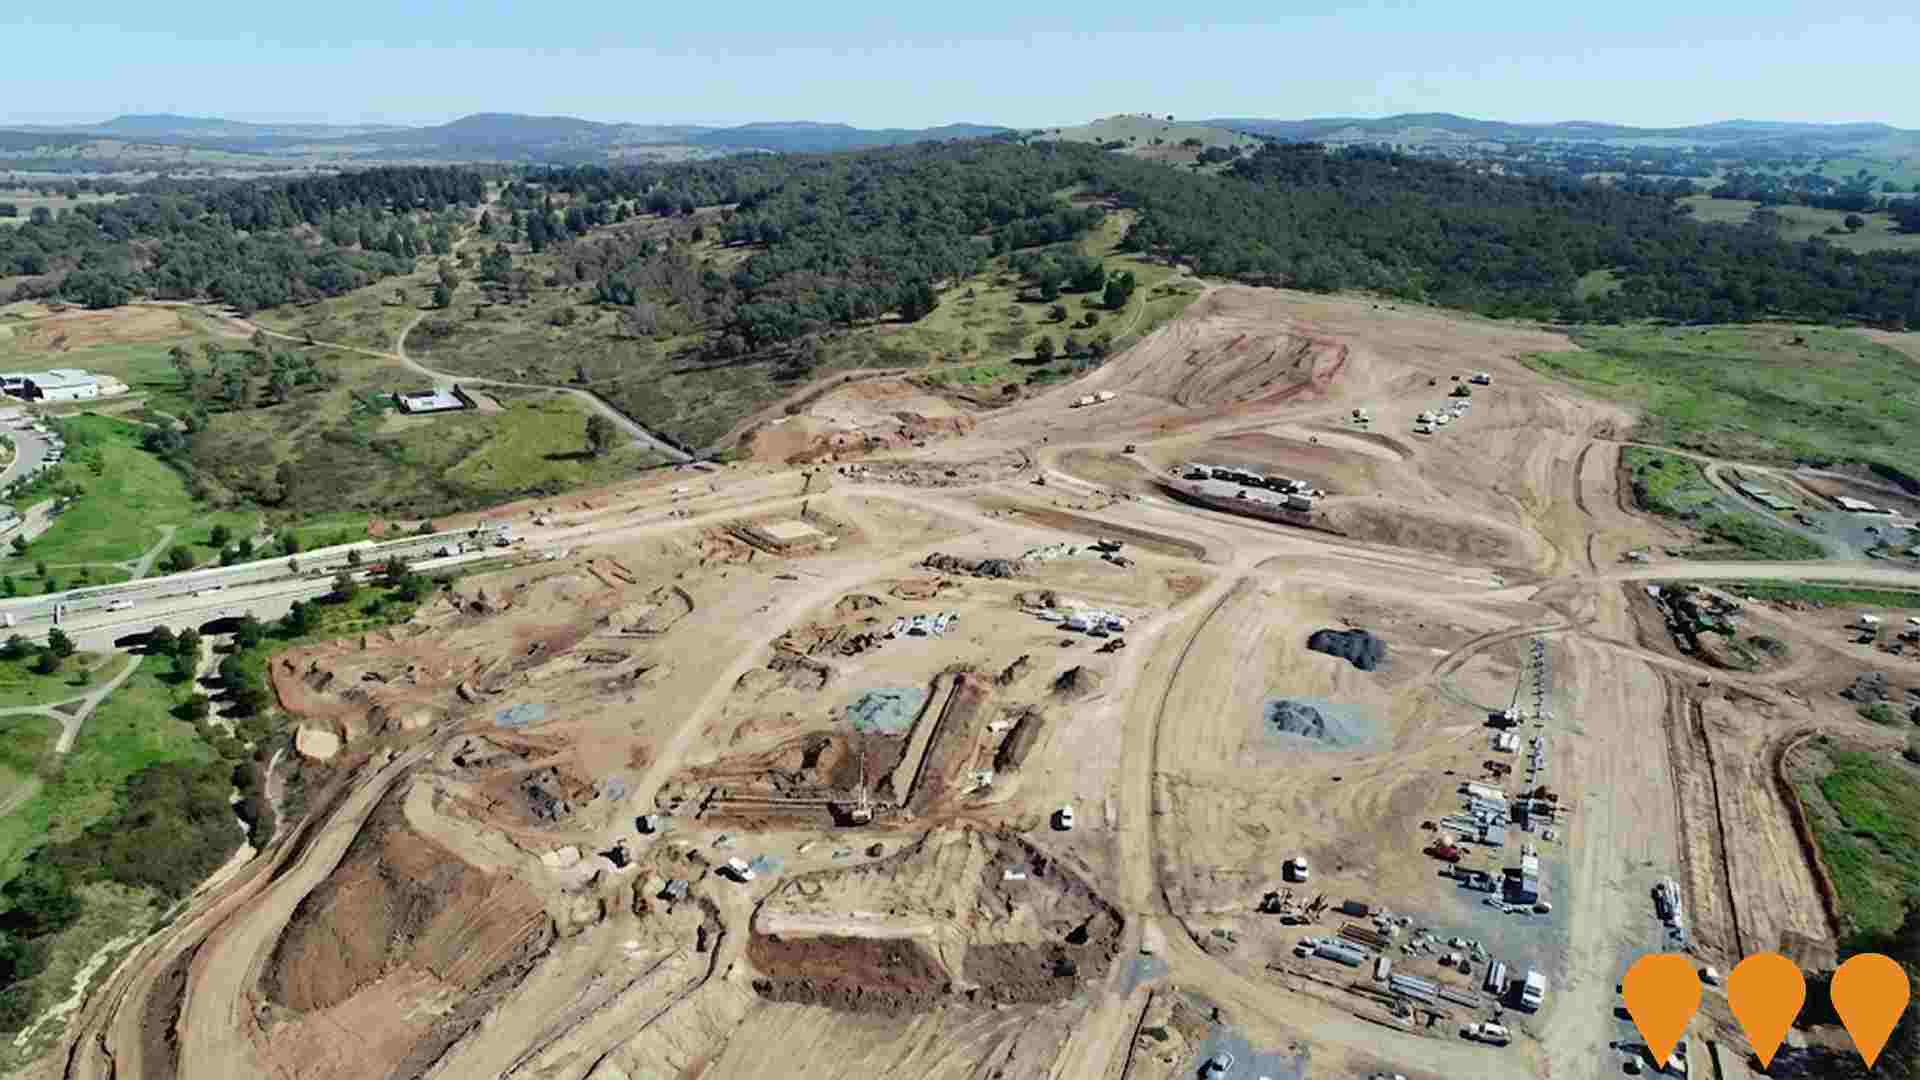
Molonglo Town Centre
Molonglo Town Centre is the future primary commercial, civic and community hub for the Molonglo Valley district in Canberra. This 97-hectare mixed-use centre along the Molonglo River will include a major shopping precinct, homemaker centre, community facilities, library, schools, sports fields, district park, central playground and up to 7,500 new dwellings, ultimately serving approximately 70,000 residents by 2050.
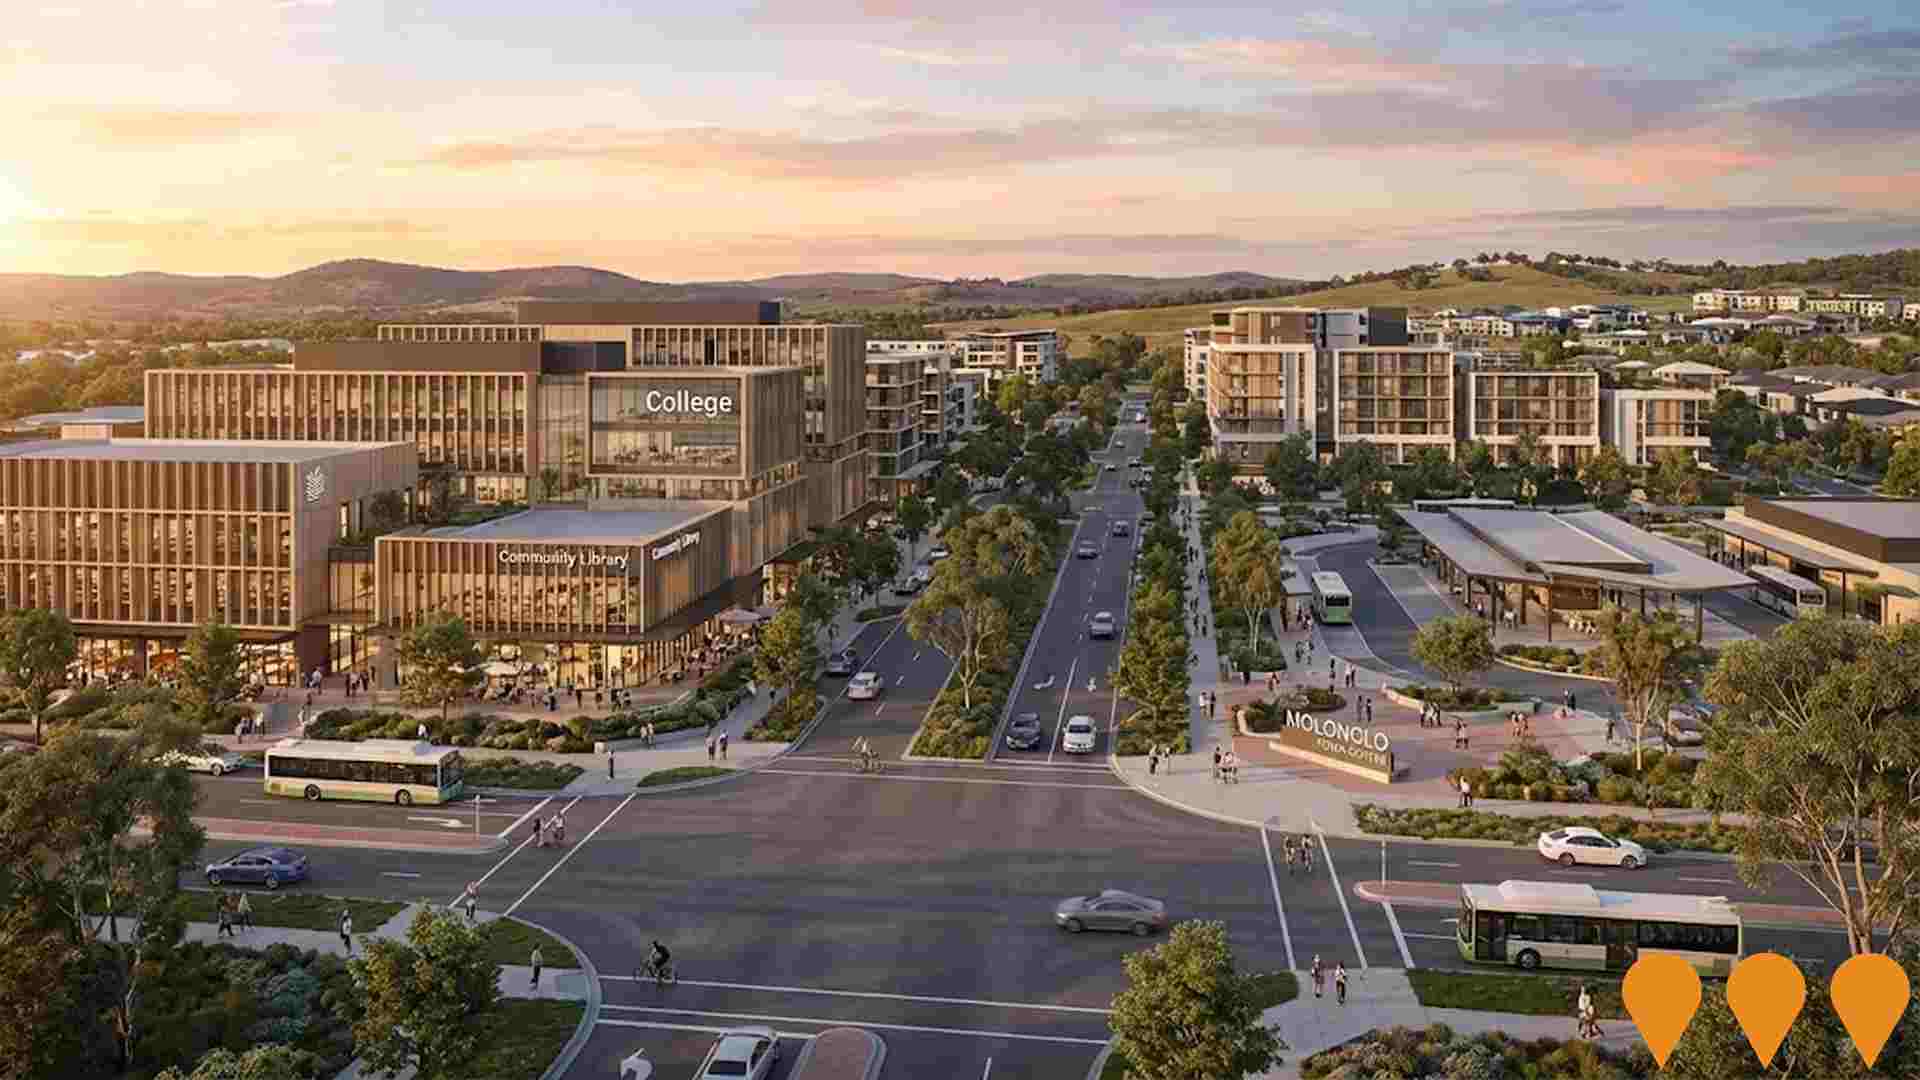
Molonglo Group Centre to Town Centre Transition
Transition of Molonglo Group Centre to Town Centre status to accommodate 70,000+ residents by 2050. Will include college, library, community centre, transport interchange and major commercial centre development.
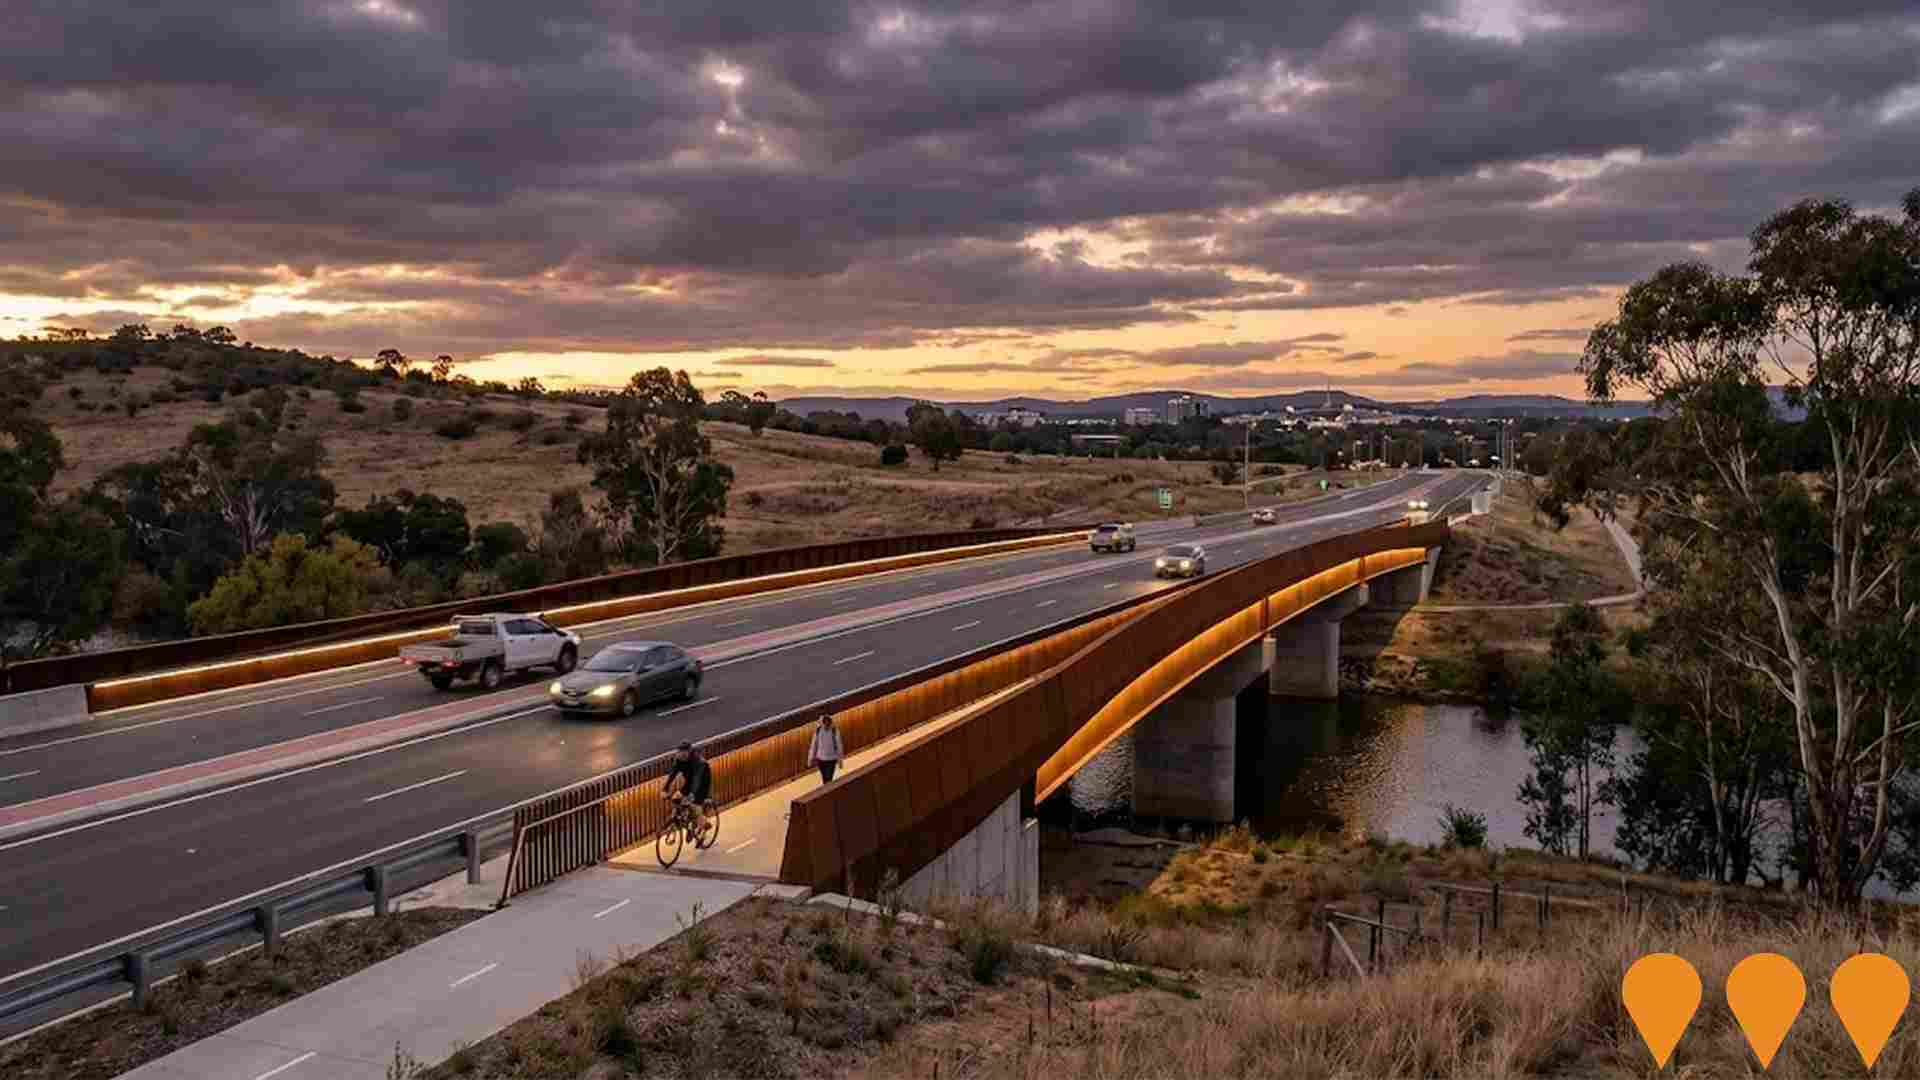
Molonglo River Bridge and John Gorton Drive Extension
The Molonglo River Bridge is a major infrastructure project consisting of a 200-metre long weathering steel bridge over the Molonglo River and approximately 1.7 kilometres of new arterial roads as part of the John Gorton Drive extension. The bridge will be the longest weathering steel bridge in Australia and the tallest road bridge in Canberra. It will significantly improve connectivity for the Molonglo Valley suburbs, including Denman Prospect and Whitlam, to the rest of Canberra, replacing the flood-prone Coppins Crossing and ensuring all-weather access. The project includes new intersections, provisions for public transport (including future light rail), dedicated paths for pedestrians and cyclists, and planned habitat for native fauna including platypus nesting sites.
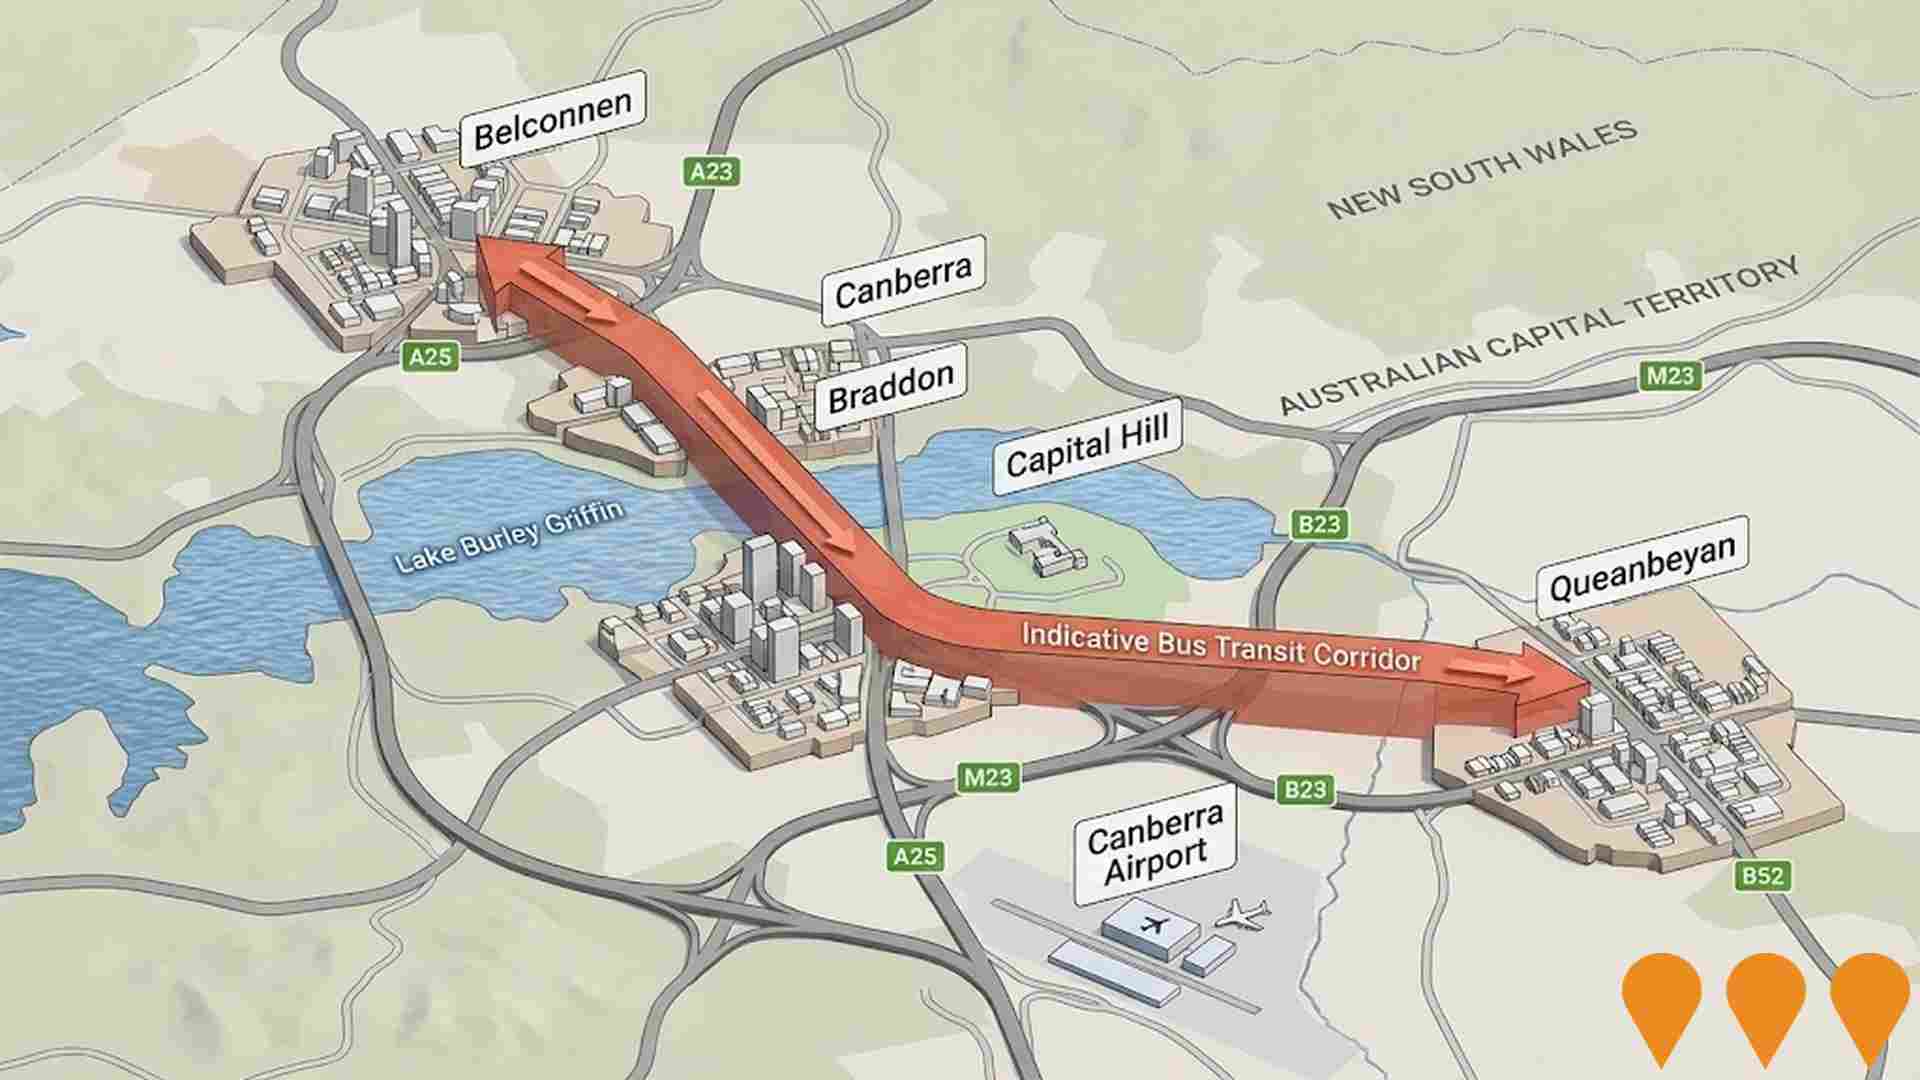
Enhanced bus and light rail corridors (Belconnen & Queanbeyan to Central Canberra)
ACT is progressing an integrated program to enhance high-frequency bus and future light rail corridors that link Belconnen and Queanbeyan with central Canberra. Light Rail Stage 2A (City to Commonwealth Park) commenced construction in early 2025 with services targeted from 2028, while planning and approvals continue for Stage 2B to Woden. The ACT Government has acknowledged and is planning upgrades for the Belconnen-to-City bus corridor as groundwork for a future east-west light rail Stage 3, and is coordinating cross-border public transport initiatives with NSW through the Queanbeyan Region Integrated Transport Plan and the ACT-NSW MoU for Regional Collaboration.
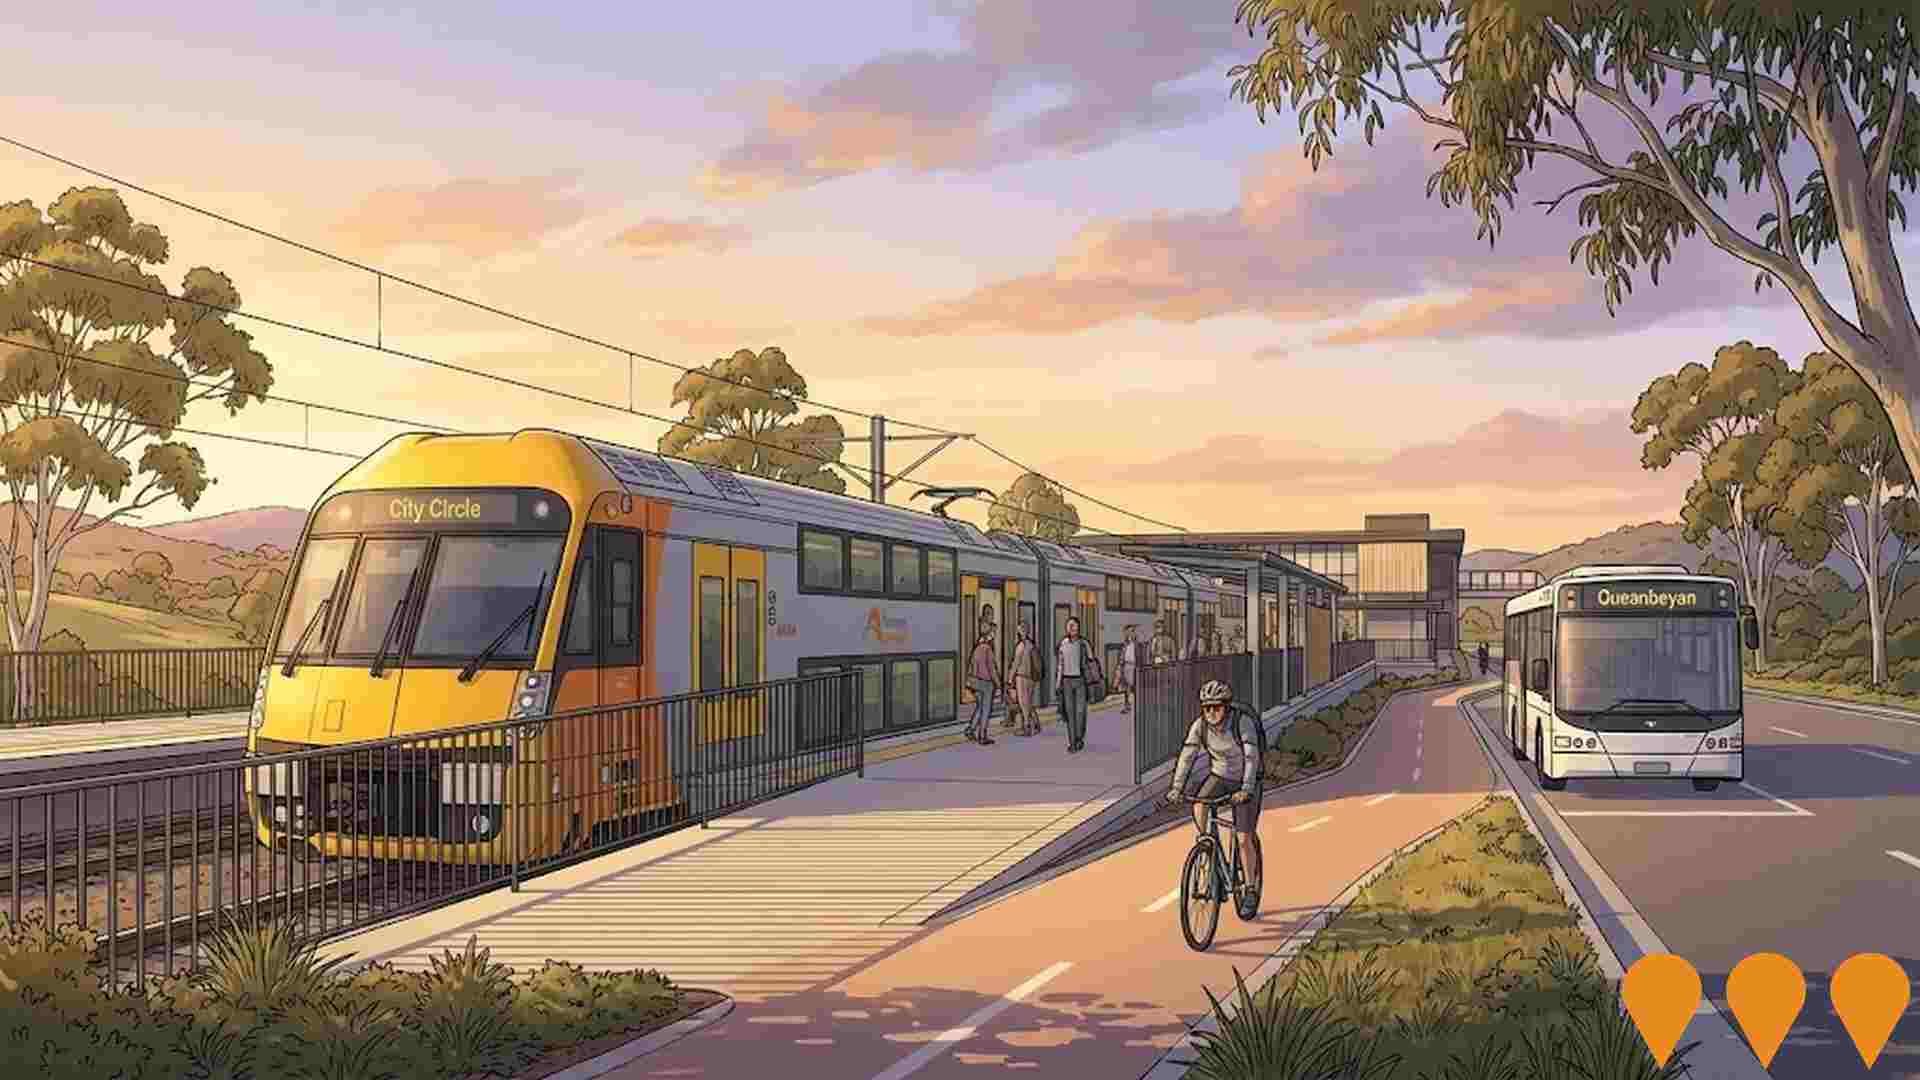
Queanbeyan Regional Integrated Transport Plan
Comprehensive transport planning initiative with 64 key actions for next 10 years. Addresses road safety, active transport connectivity, public transport availability, and future transport needs. Improved connections between Queanbeyan and ACT.
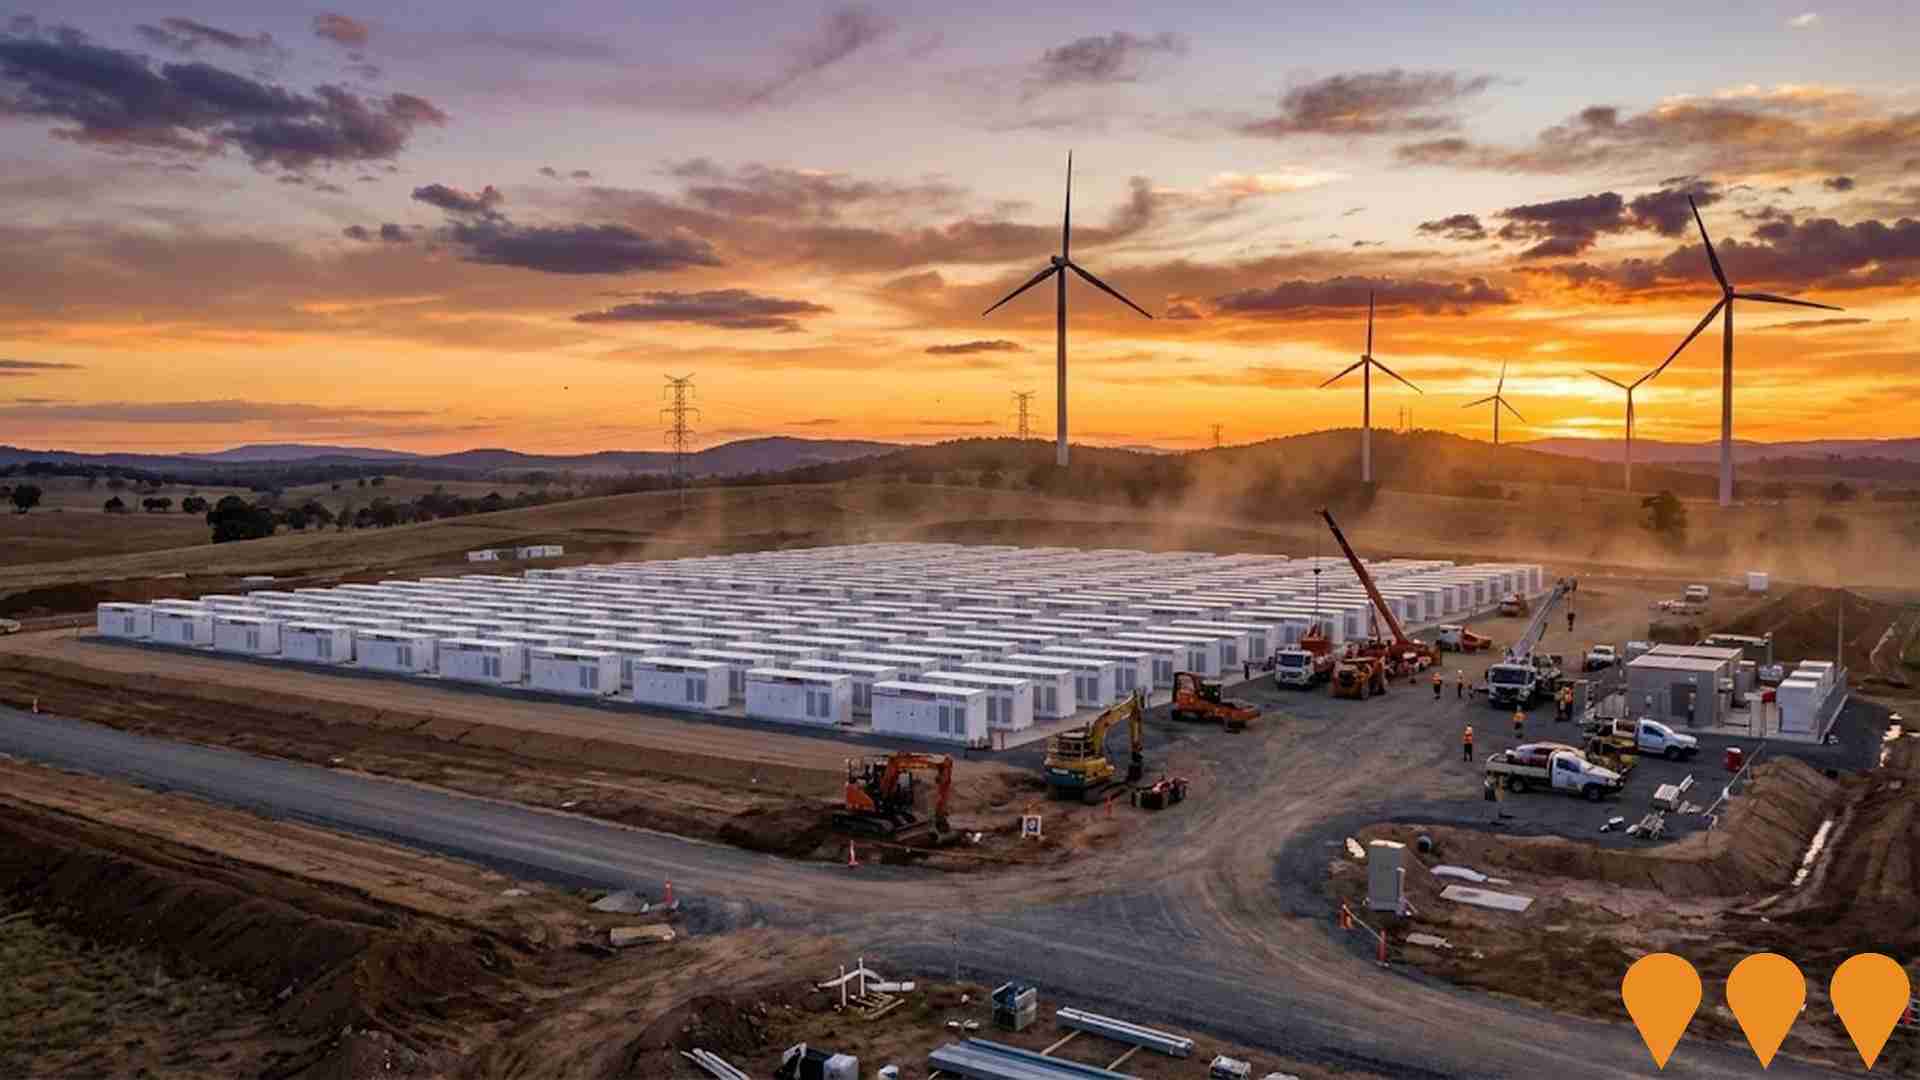
Big Canberra Battery (Williamsdale BESS)
A 250 MW / 500 MWh battery energy storage system at Williamsdale in southern Canberra, delivered by Eku Energy as Stream 1 of the ACT Government's Big Canberra Battery. Construction commenced in November 2024 with partners CPP and Tesla supplying Megapack systems. The asset will connect to Evoenergy's 132 kV network near the Williamsdale substation to provide two hours of dispatchable power, grid services and reliability for the ACT. Target operations in 2026.
Deakin Private Hospital
Deakin Private Hospital offers premium and integrated inpatient, day therapy, and hospital-in-the-home services, focusing on individualised and high-quality mental health treatment. It includes a Specialised PTSD & Trauma Support Unit for military and first responders, and services such as Repetitive Transcranial Magnetic Stimulation (rTMS) for depression. The hospital also features co-located clinics and is supported by a multidisciplinary team of Psychiatrists, Medical, Nursing, and Allied Health professionals.

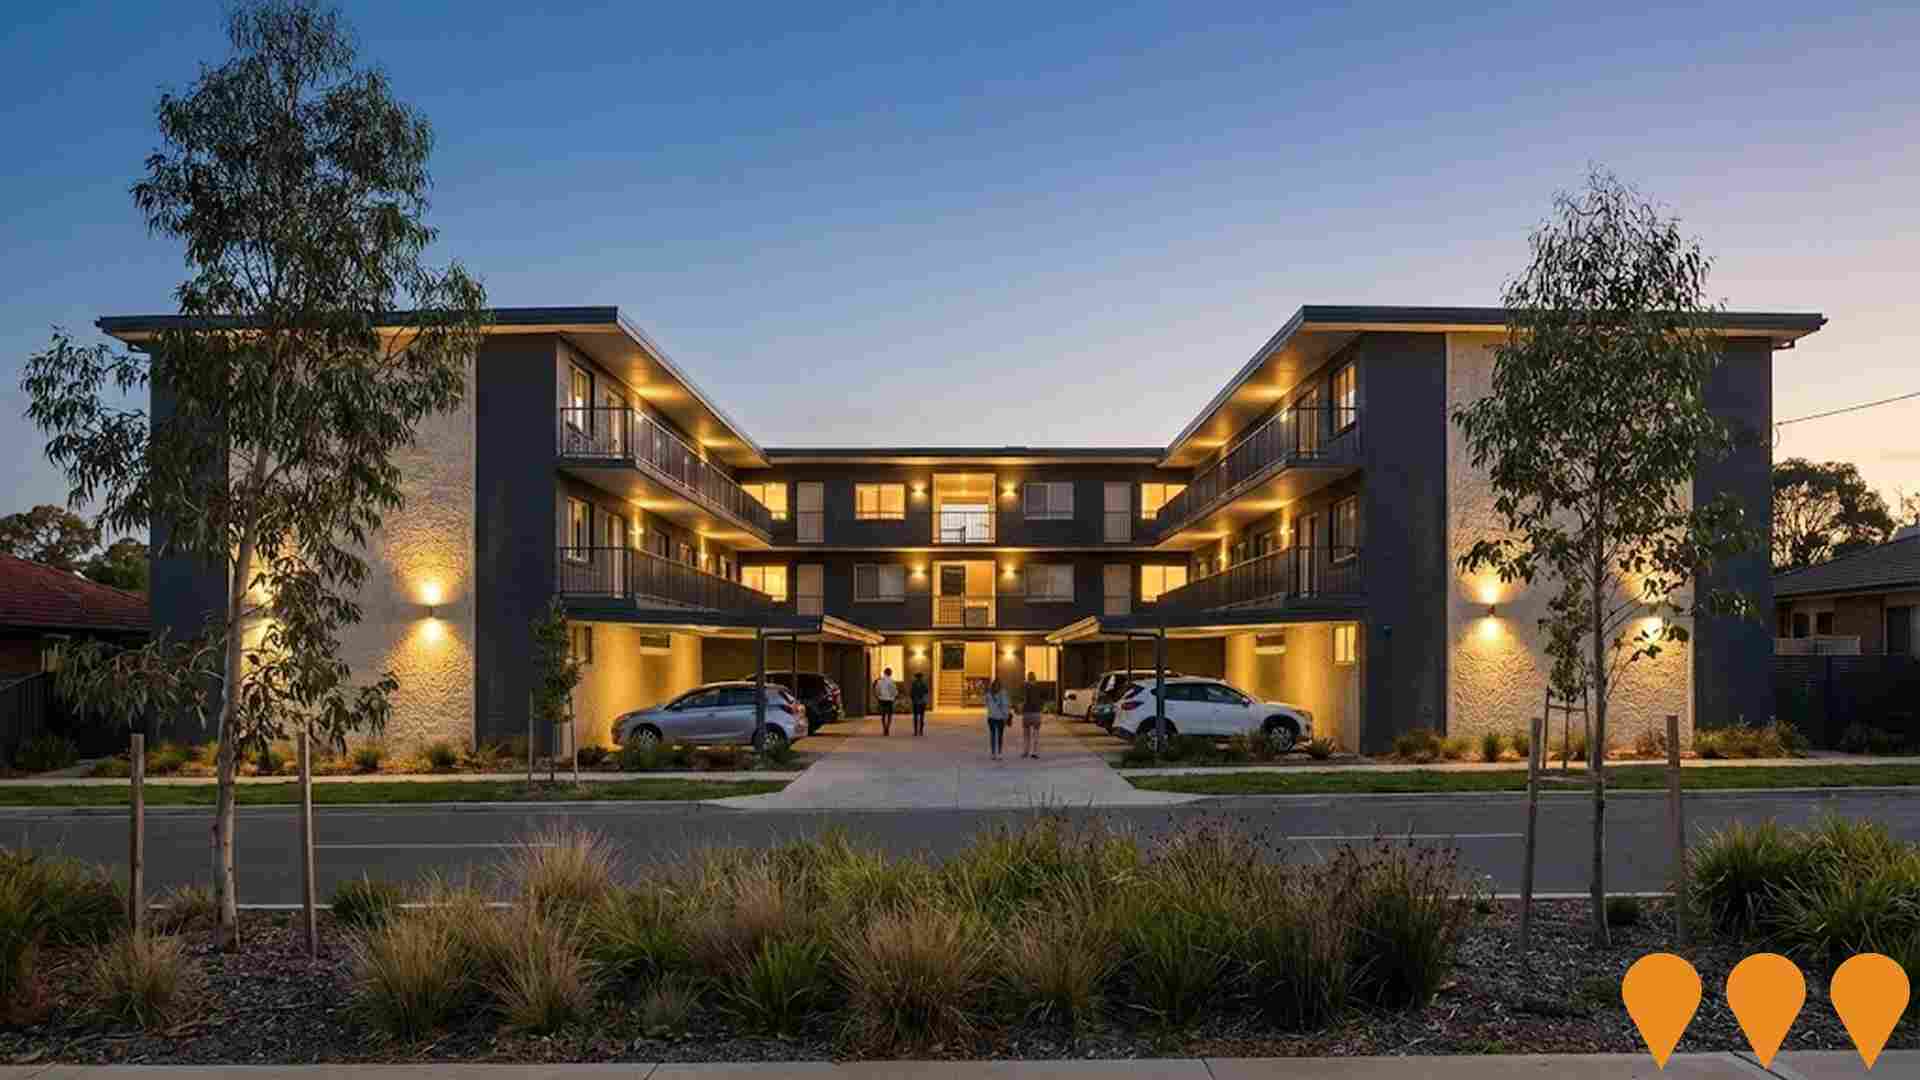
Denman Apartments
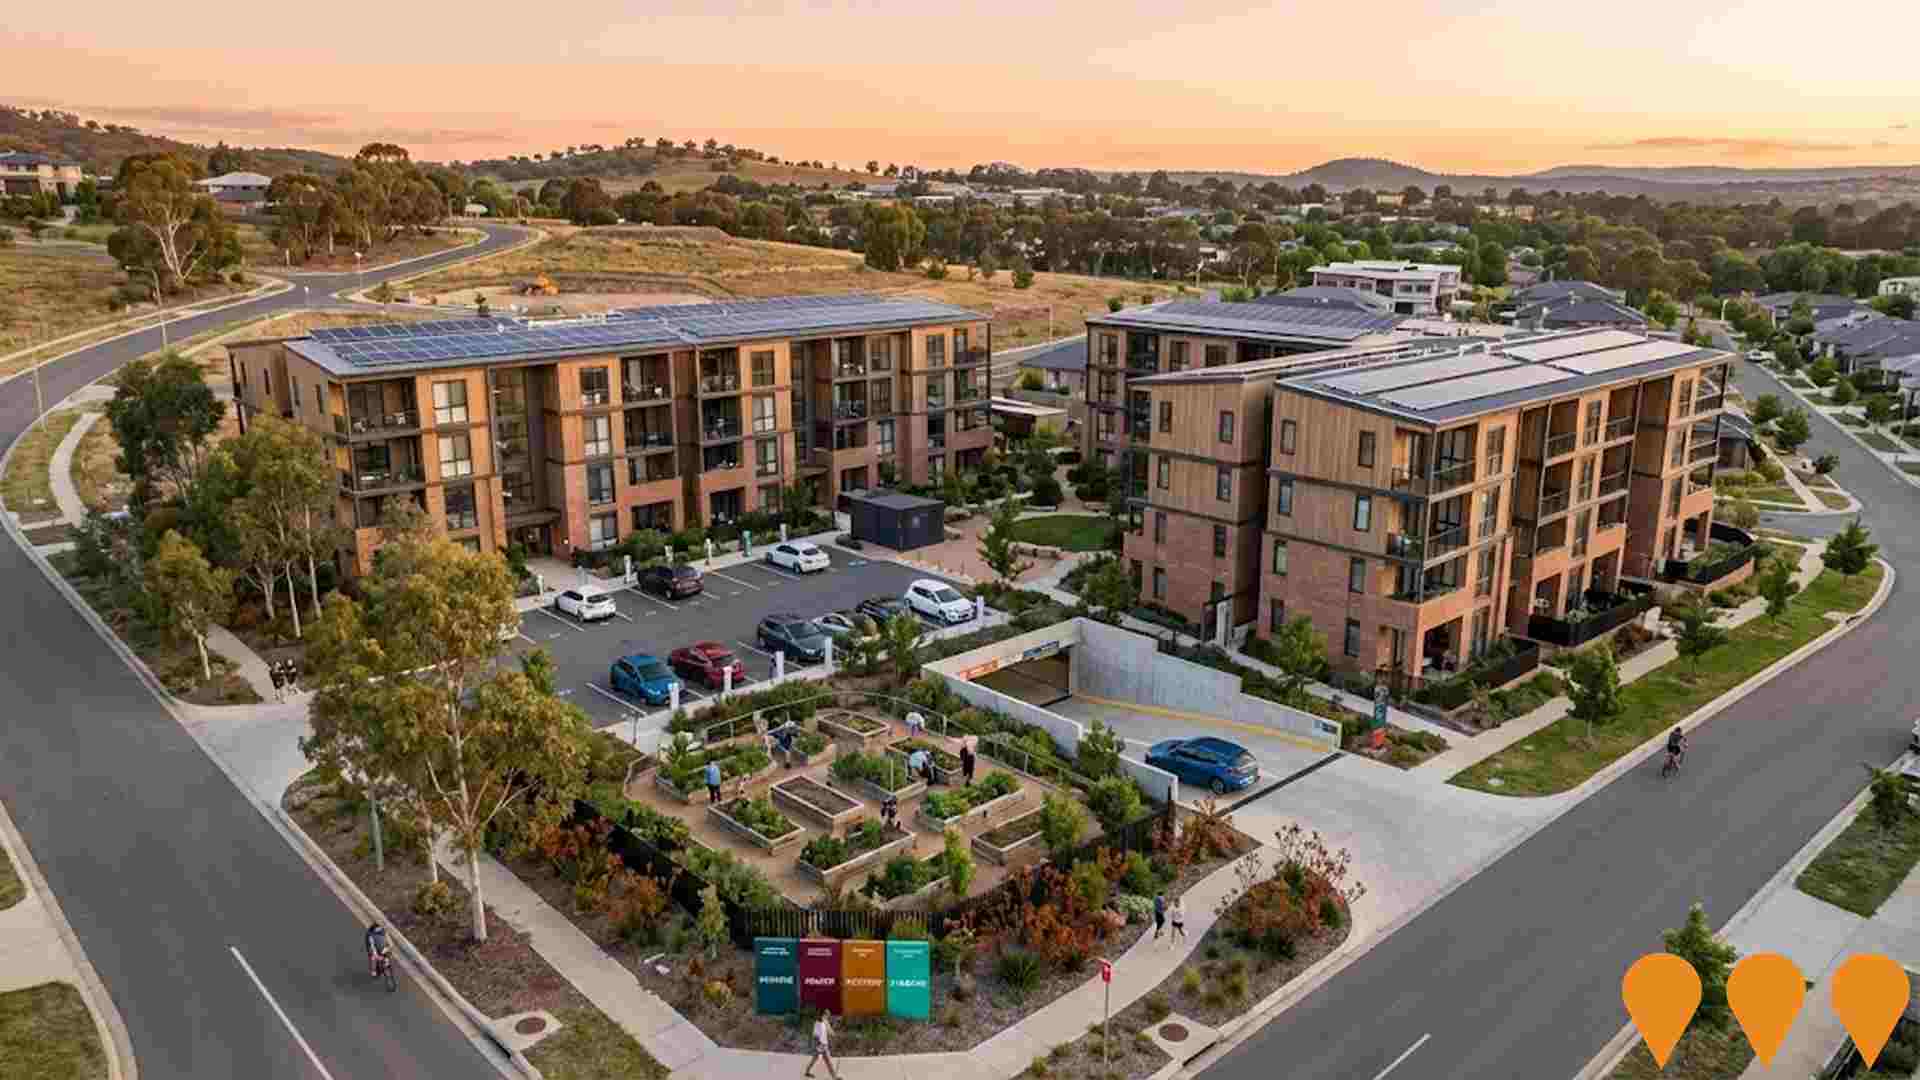
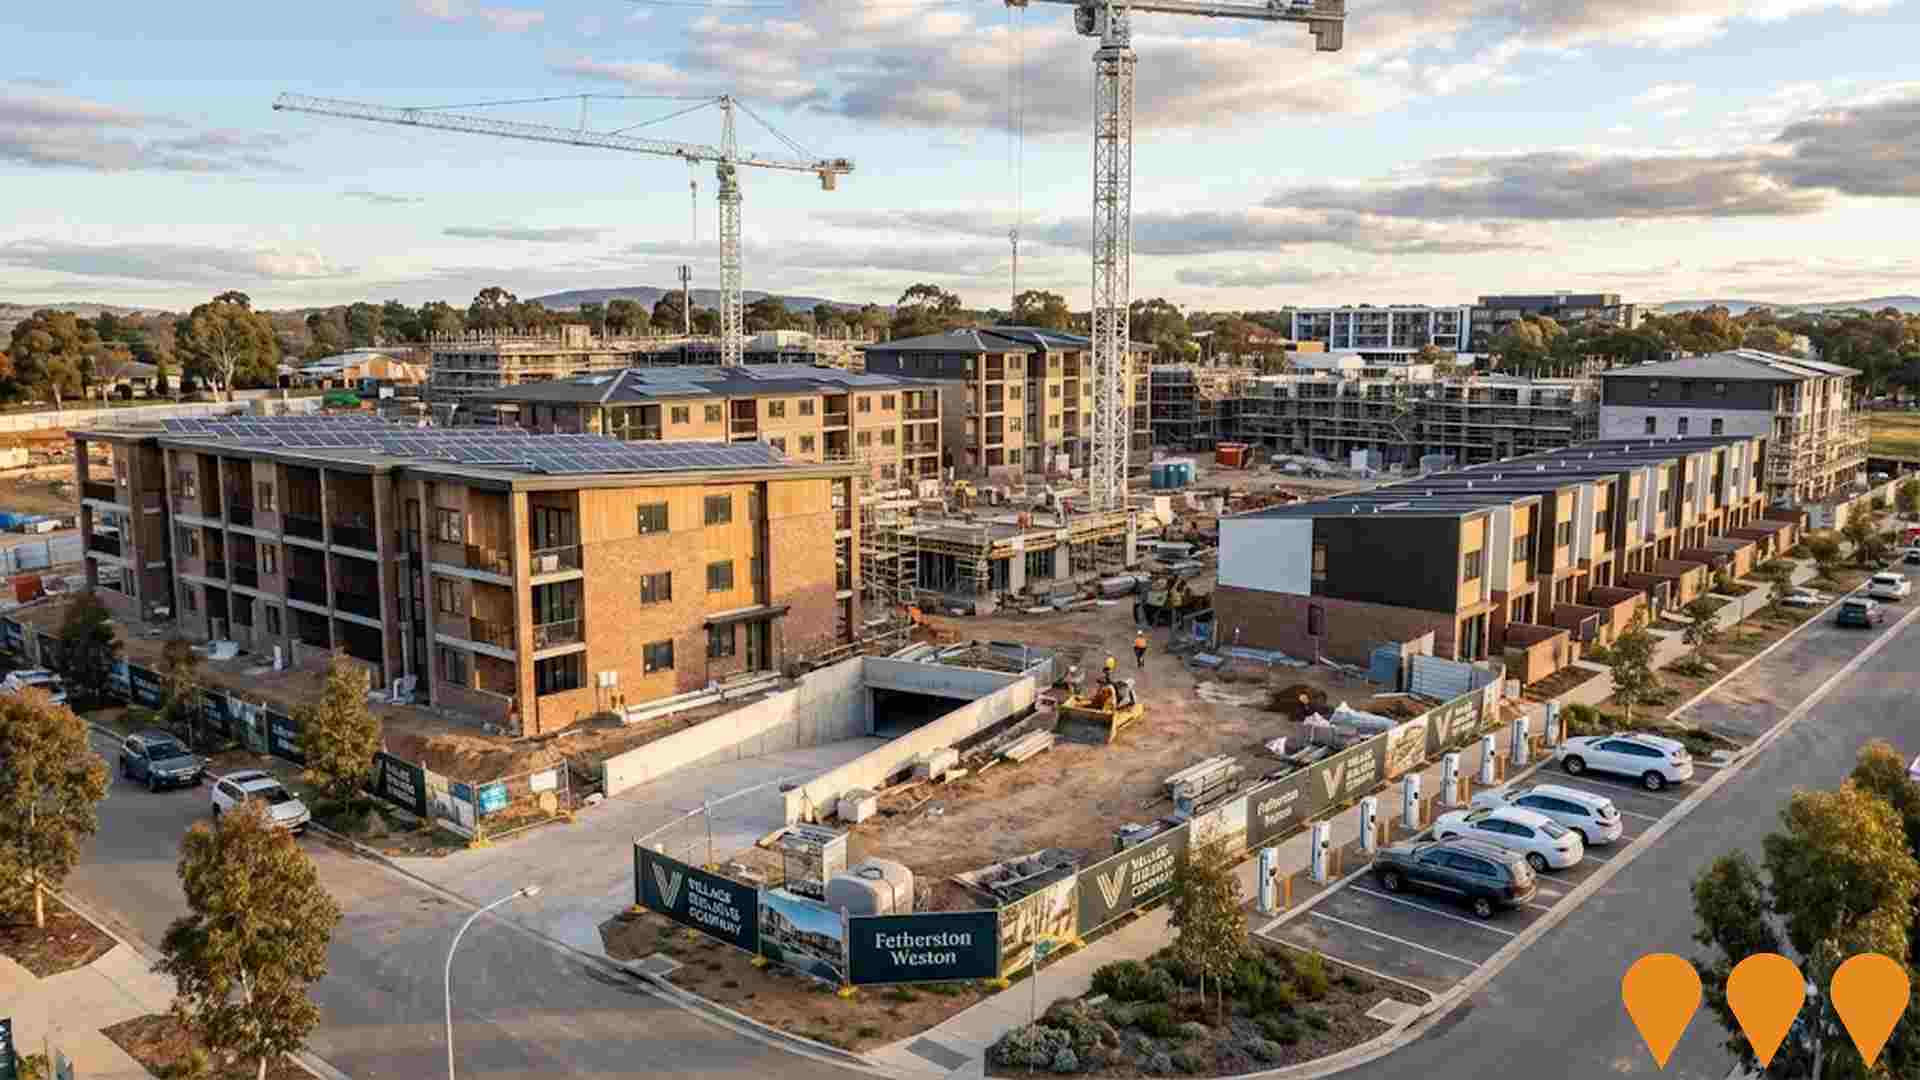
A new housing development by PROJEX Building, consisting of 24 two-bedroom apartments. The project focuses on high energy efficiency, targeting a minimum 7-star rating, and includes adaptable and livable gold-standard units. It features lifts, undercover parking, and centralized communal spaces.
Employment
Wright ranks among the top 25% of areas assessed nationally for overall employment performance
Wright's workforce is highly educated with strong professional services representation. The unemployment rate was 2.4% in the past year, with an estimated employment growth of 1.3%.
As of September 2025, 2946 residents were employed at a rate of 1.2% below the Australian Capital Territory's (ACT) rate of 3.6%. Workforce participation was 82.2%, compared to ACT's 69.6%. Major employment industries include public administration & safety, health care & social assistance, and professional & technical services. Health care & social assistance showed strong specialization with an employment share 1.5 times the regional level.
Construction had limited presence at 4.6% compared to the regional average of 6.8%. Employment opportunities appeared limited locally based on Census data analysis. Between September 2024 and September 2025, employment increased by 1.3%, labour force grew by 1.9%, raising unemployment rate by 0.6 percentage points. In contrast, ACT saw employment rise by 1.4% with a slight fall in unemployment to 3.8%. State-level data from November 2025 showed ACT employment growth of 1.19% year-on-year, adding 710 jobs, with an unemployment rate of 4.5%, slightly higher than the national rate of 4.3%. Jobs and Skills Australia's May 2025 forecasts project national employment growth at 6.6% over five years and 13.7% over ten years. Applying these projections to Wright's employment mix suggests local employment should increase by 7.0% over five years and 14.3% over ten years, assuming constant population projections for illustrative purposes.
Frequently Asked Questions - Employment
Income
The economic profile demonstrates exceptional strength, placing the area among the top 10% nationally based on comprehensive AreaSearch income analysis
The median taxpayer income in Wright SA2 was $81,845, with an average of $97,367 according to AreaSearch's aggregation of postcode level ATO data for the financial year 2022. This places it among the top percentile nationally, contrasting with the Australian Capital Territory's median income of $68,678 and average income of $83,634. By September 2025, estimated incomes would be approximately $92,976 (median) and $110,609 (average), based on a 13.6% growth since the financial year 2022 as per the Wage Price Index. Census 2021 income data shows Wright's household, family, and personal incomes all rank highly nationally, between the 91st and 97th percentiles. In Wright, 39.7% of individuals (1,736 people) fall within the $1,500-$2,999 income range, mirroring the surrounding region where 34.3% occupy this bracket. Wright demonstrates affluence with 42.2% earning over $3,000 per week. High housing costs consume 16.2% of income, but strong earnings place disposable income at the 90th percentile nationally. The area's SEIFA income ranking places it in the 9th decile.
Frequently Asked Questions - Income
Housing
Wright features a more urban dwelling mix with significant apartment living, with above-average rates of outright home ownership
In Wright, as per the latest Census evaluation, 39.6% of dwellings were houses while 60.4% consisted of other types such as semi-detached homes, apartments, and 'other' dwellings. This is compared to the Australian Capital Territory's figures of 40.9% houses and 59.2% other dwellings. Home ownership in Wright stood at 8.7%, with mortgaged dwellings at 59.3% and rented dwellings at 32.0%. The median monthly mortgage repayment in the area was $1,950, lower than the Australian Capital Territory average of $2,099. The median weekly rent figure in Wright was $461, compared to the Australian Capital Territory's $472. Nationally, Wright's mortgage repayments were higher at $1,950 versus the Australian average of $1,863, while rents were substantially higher at $461 compared to the national figure of $375.
Frequently Asked Questions - Housing
Household Composition
Wright features high concentrations of group households, with a lower-than-average median household size
Family households account for 67.0% of all households, including 32.5% couples with children, 25.5% couples without children, and 7.9% single parent families. Non-family households constitute the remaining 33.0%, with lone person households at 26.9% and group households comprising 6.0%. The median household size is 2.5 people, which is smaller than the Australian Capital Territory average of 2.7.
Frequently Asked Questions - Households
Local Schools & Education
The educational profile of Wright exceeds national averages, with above-average qualification levels and academic performance metrics
Wright's educational attainment exceeds broader benchmarks significantly. Among residents aged 15+, 58.6% hold university qualifications, compared to Australia's 30.4% and the SA4 region's 46.8%. This advantage positions Wright strongly for knowledge-based opportunities. Bachelor degrees lead at 34.4%, followed by postgraduate qualifications (19.8%) and graduate diplomas (4.4%).
Vocational pathways account for 21.1%, with advanced diplomas at 9.5% and certificates at 11.6%. Educational participation is notably high, with 33.2% of residents currently enrolled in formal education. This includes 10.5% in primary education, 9.6% in tertiary education, and 5.3% pursuing secondary education.
Frequently Asked Questions - Education
Schools Detail
Nearby Services & Amenities
Transport
Transport servicing is moderate compared to other areas nationally based on assessment of service frequency, route connectivity and accessibility
Transport analysis shows eight active transport stops operating in Wright, comprising a mix of bus services. These stops are served by two individual routes, collectively providing 677 weekly passenger trips. Transport accessibility is rated as good, with residents typically located 240 meters from the nearest transport stop.
Service frequency averages 96 trips per day across all routes, equating to approximately 84 weekly trips per individual stop.
Frequently Asked Questions - Transport
Transport Stops Detail
Health
Wright's residents boast exceedingly positive health performance metrics with very low prevalence of common health conditions across all age groups
Wright demonstrates excellent health outcomes, with a very low prevalence of common health conditions across all age groups. Approximately 70% of its total population of 3,053 people have private health cover, compared to the national average of 55.3%.
Mental health issues and asthma are the most common medical conditions in the area, affecting 9.0% and 7.6% of residents respectively. Overall, 76.9% of residents report being completely clear of medical ailments, compared to 80.0% across the Australian Capital Territory. Wright has 4.3% of its population aged 65 and over, comprising 185 people. Health outcomes among seniors in Wright are particularly strong, broadly aligning with the general population's health profile.
Frequently Asked Questions - Health
Cultural Diversity
Wright is among the most culturally diverse areas in the country based on AreaSearch assessment of a range of language and cultural background related metrics
Wright has a high level of cultural diversity, with 39.5% of its population born overseas and 38.6% speaking a language other than English at home. Christianity is the predominant religion in Wright, accounting for 33.5% of the population. Hinduism is notably overrepresented in Wright compared to the Australian Capital Territory, making up 12.0% of the population versus 12.7%.
The top three represented ancestry groups in Wright are Australian at 20.7%, Other at 18.5%, and English at 17.7%. There are also notable differences in the representation of certain ethnic groups: Indian is overrepresented at 8.5% compared to 9.0% regionally, Hungarian is overrepresented at 0.5% compared to 0.3%, and Sri Lankan is slightly underrepresented at 0.8% compared to 0.9%.
Frequently Asked Questions - Diversity
Age
Wright hosts a very young demographic, ranking in the bottom 10% of areas nationwide
At an age of 33 years, Wright's median age is slightly below the Australian Capital Territory average of 35 years and significantly lower than the national median of 38 years. Compared to the Australian Capital Territory, Wright has a higher proportion of residents aged 35-44 (22.7%) but fewer residents aged 65-74 (2.9%). This concentration of residents aged 35-44 is notably higher than the national average of 14.2%. Between the years 2021 and present, demographic aging has occurred with the median age increasing from 32 to 33 years. During this period, the proportion of residents aged 45-54 has grown from 10.1% to 11.6%, while the proportion of those aged 55-64 has increased from 6.2% to 7.7%. Conversely, the proportion of residents aged 25-34 has decreased from 26.6% to 22.1%. By the year 2041, population forecasts indicate significant demographic changes for Wright. The age cohort of 45-54 is projected to experience substantial growth, increasing by 178 people (35%) from 508 to 687. Conversely, the cohorts aged 5-14 and 35-44 are expected to experience population declines.
