Chart Color Schemes
This analysis uses ABS Statistical Areas Level 2 (SA2) boundaries, which can materially differ from Suburbs and Localities (SAL) even when sharing similar names.
SA2 boundaries are defined by the Australian Bureau of Statistics and are designed to represent communities for statistical reporting (e.g., census and ERP).
Suburbs and Localities (SAL) represent commonly-used suburb/locality names (postal-style areas) and may use different geographic boundaries. For comprehensive analysis, consider reviewing both boundary types if available.
est. as @ -- *
ABS ERP | -- people | --
2021 Census | -- people
Sales Activity
Curious about local property values? Filter the chart to assess the volume and appreciation (including resales) trends and regional comparisons, or scroll to the map below view this information at an individual property level.
Find a Recent Sale
Sales Detail
Population
Weston lies within the top quartile of areas nationally for population growth performance according to AreaSearch analysis of recent, and medium to long-term trends
Weston's population is approximately 3,997 as of November 2025. This figure reflects a decrease of 3 people since the 2021 Census, which reported a population of 4,000. The change is inferred from the estimated resident population of 3,987 in June 2024 and an additional 8 validated new addresses since the Census date. This results in a population density ratio of 1,038 persons per square kilometer, comparable to averages seen across locations assessed by AreaSearch. Over the past decade, Weston has shown resilient growth patterns with a compound annual growth rate of 1.1%, outperforming the SA3 area. Population growth was primarily driven by overseas migration during recent periods.
AreaSearch adopts ABS/Geoscience Australia projections for each SA2 area, released in 2024 with a base year of 2022. For areas not covered and years post-2032, age group growth rates from the ACT Government's SA2 area projections are used, also with a base year of 2022. By 2041, Weston is forecast to experience significant population growth, increasing by 1,058 persons to reach a total of 5,055, reflecting an increase of 26.2% over the 17-year period.
Frequently Asked Questions - Population
Development
Residential development activity is lower than average in Weston according to AreaSearch's national comparison of local real estate markets
Weston has received approximately three dwelling approvals per year over the past five financial years, totaling 19 homes. In FY-26, four approvals have been recorded to date. On average, each home built between FY-21 and FY-25 accommodates around 6.5 new residents annually. This imbalance between demand and supply often leads to price growth and increased buyer competition.
The average construction cost of new homes is $276,000. In the current financial year, there have been $4.3 million in commercial approvals, indicating Weston's primarily residential nature. Compared to the Australian Capital Territory, Weston has significantly less development activity, 60.0% below the regional average per person. This scarcity typically strengthens demand and prices for existing properties. Relative to national averages, Weston also reflects an area of maturity with possible planning constraints.
Recent building activity consists solely of detached houses, preserving Weston's suburban character and attracting space-seeking buyers. Developers are constructing more traditional houses than the current mix suggests (74.0% at Census), indicating strong demand for family homes. With around 2488 people per dwelling approval, Weston demonstrates a highly mature market. Future projections estimate an addition of 1,046 residents by 2041 (latest AreaSearch quarterly estimate). If current construction levels persist, housing supply may lag population growth, potentially intensifying buyer competition and supporting price growth.
Frequently Asked Questions - Development
Infrastructure
Weston has emerging levels of nearby infrastructure activity, ranking in the 21stth percentile nationally
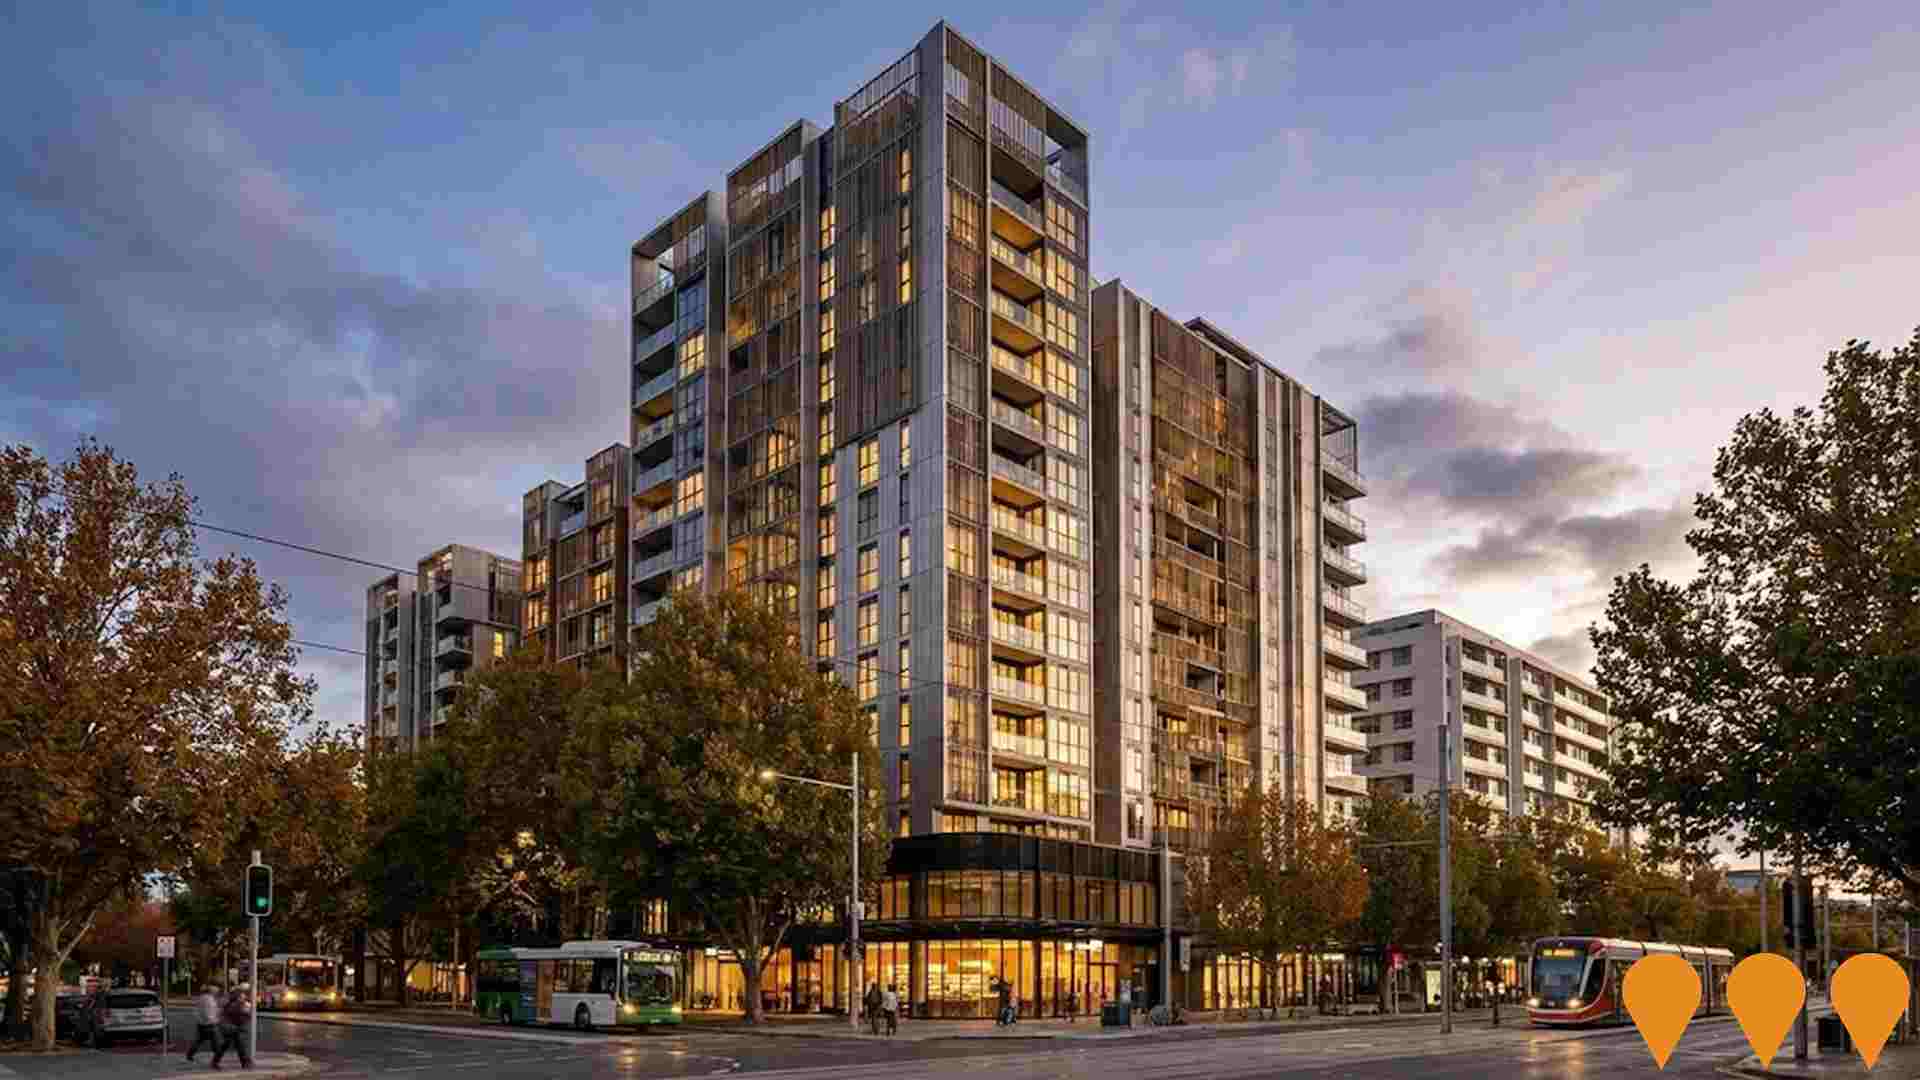
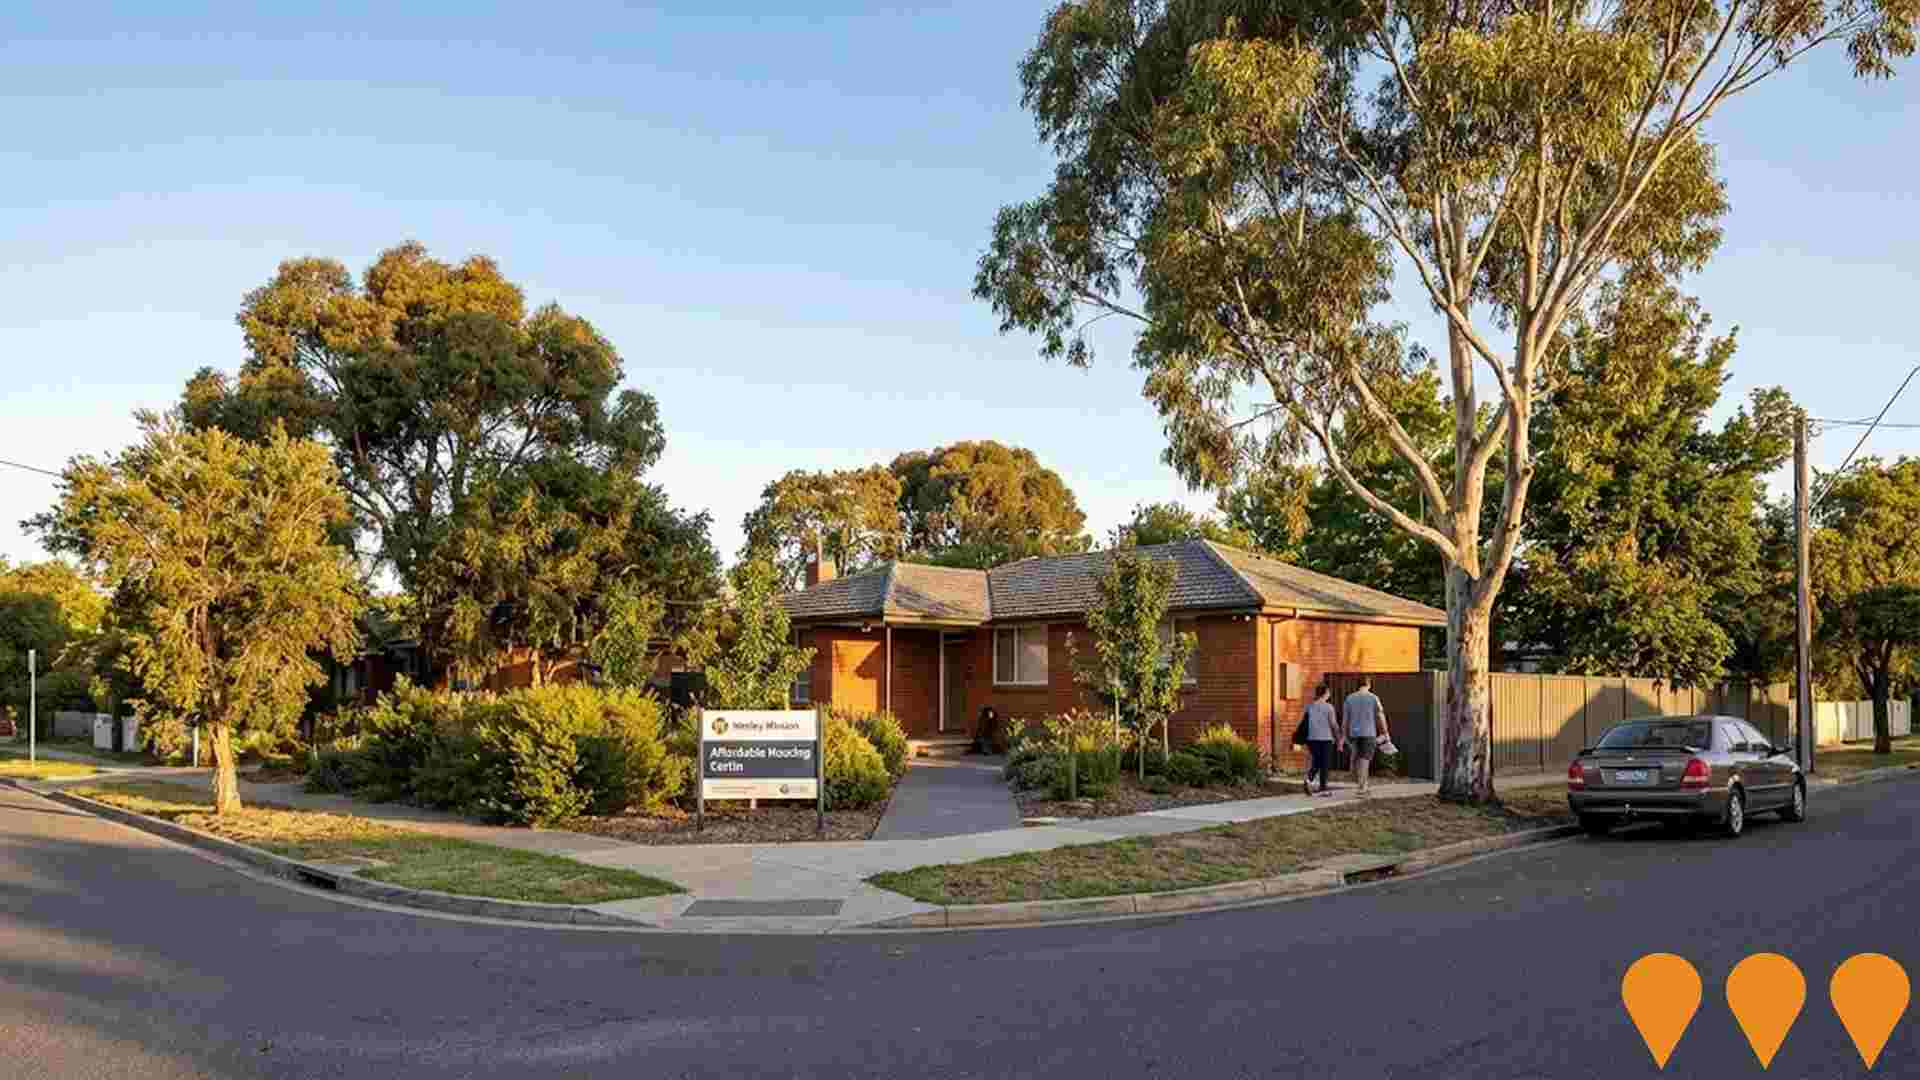
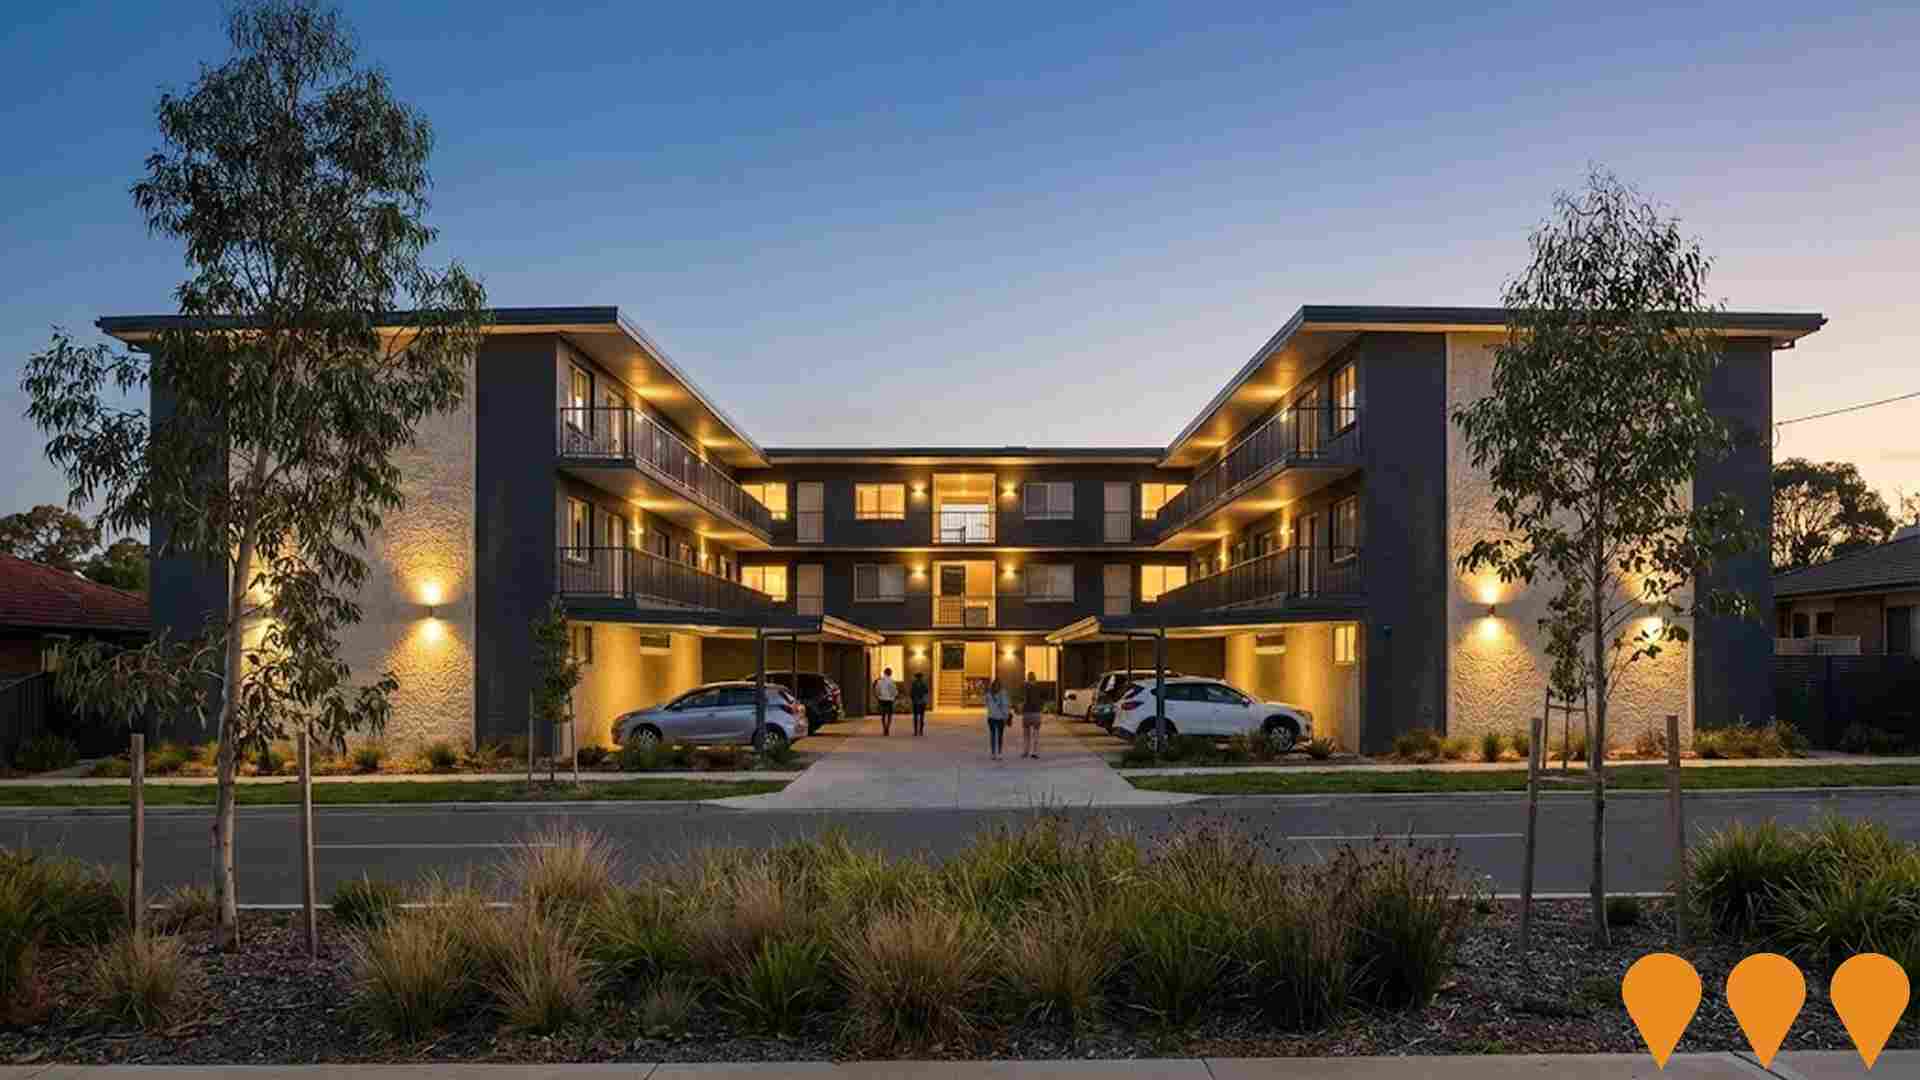
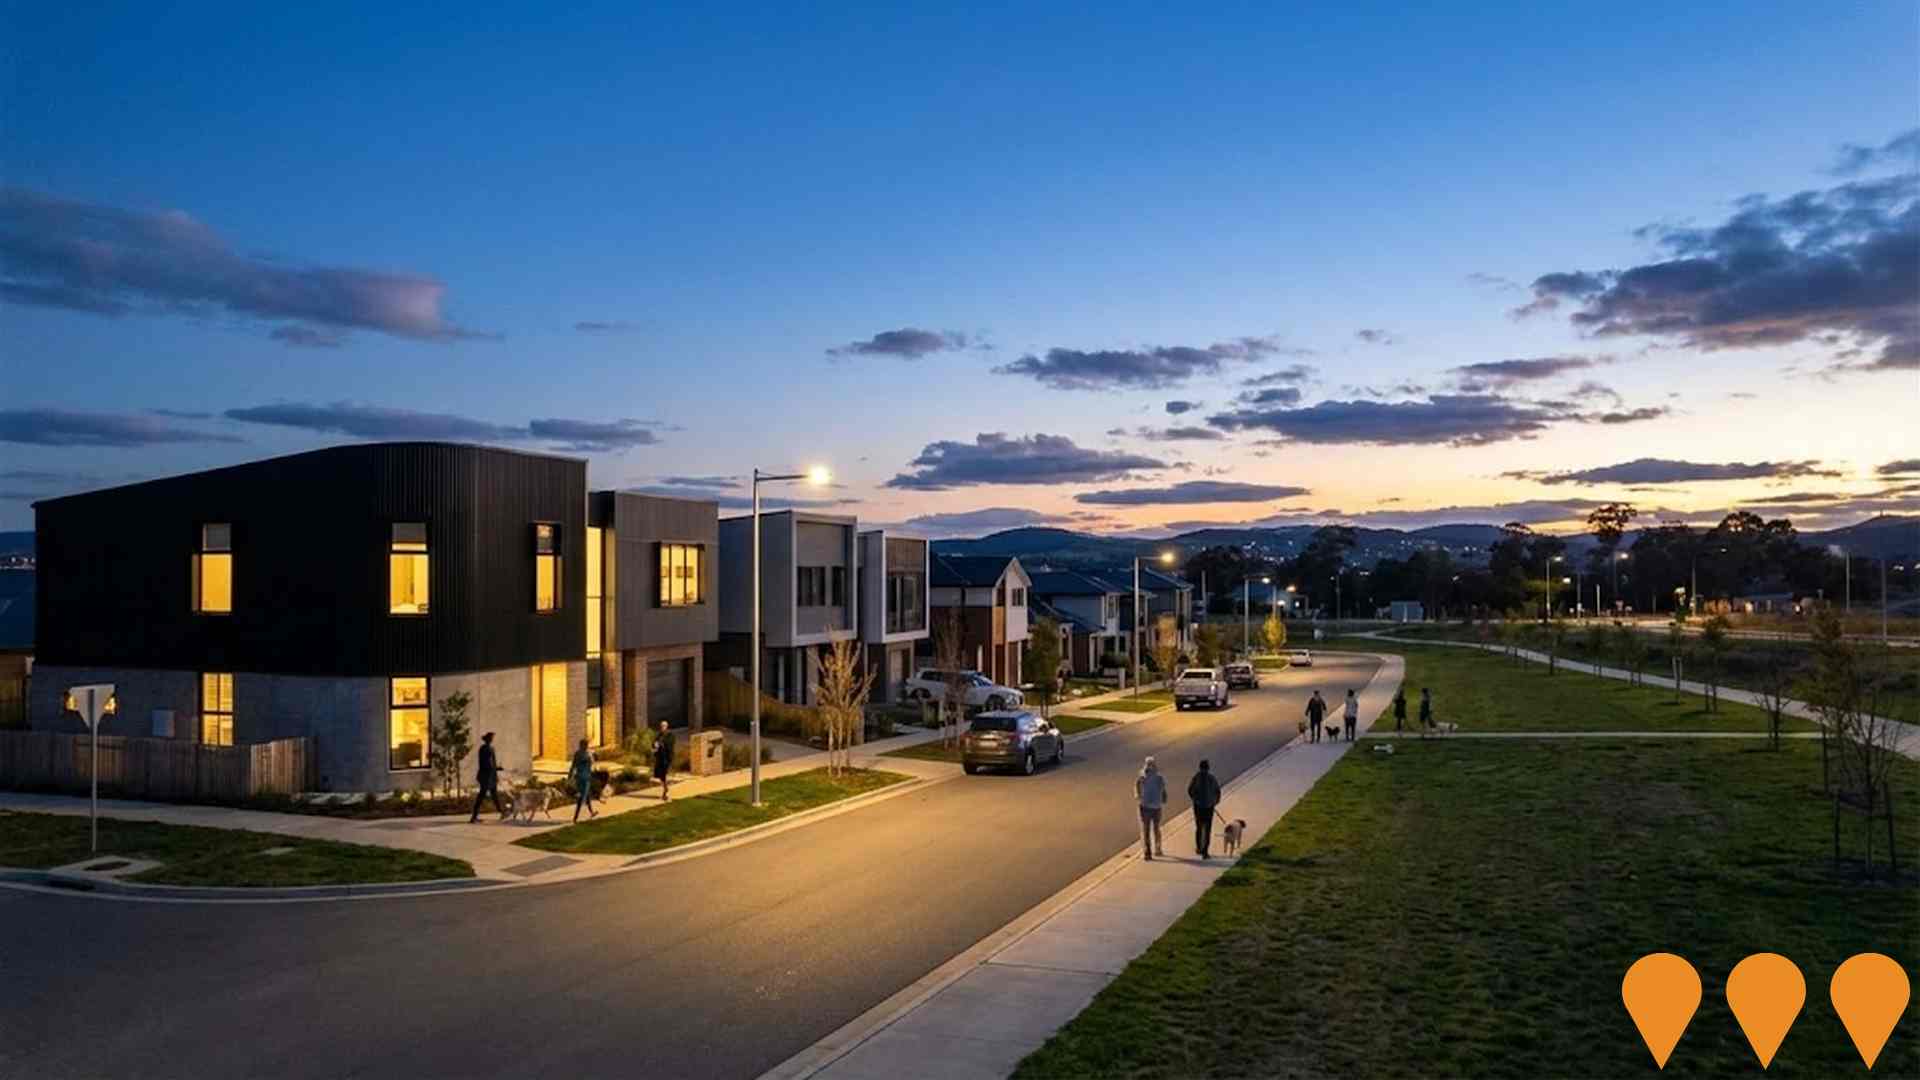
Changes to local infrastructure significantly influence an area's performance. AreaSearch has identified four projects expected to impact the area: Molonglo Group Centre to Town Centre Transition, Fetherston Weston, The Hunter, and Wesley Mission Affordable Housing Curtin. Relevant details are provided below.
Professional plan users can use the search below to filter and access additional projects.
INFRASTRUCTURE SEARCH
 Denotes AI-based impression for illustrative purposes only, not to be taken as definitive under any circumstances. Please follow links and conduct other investigations from the project's source for actual imagery. Developers and project owners wishing us to use original imagery please Contact Us and we will do so.
Frequently Asked Questions - Infrastructure
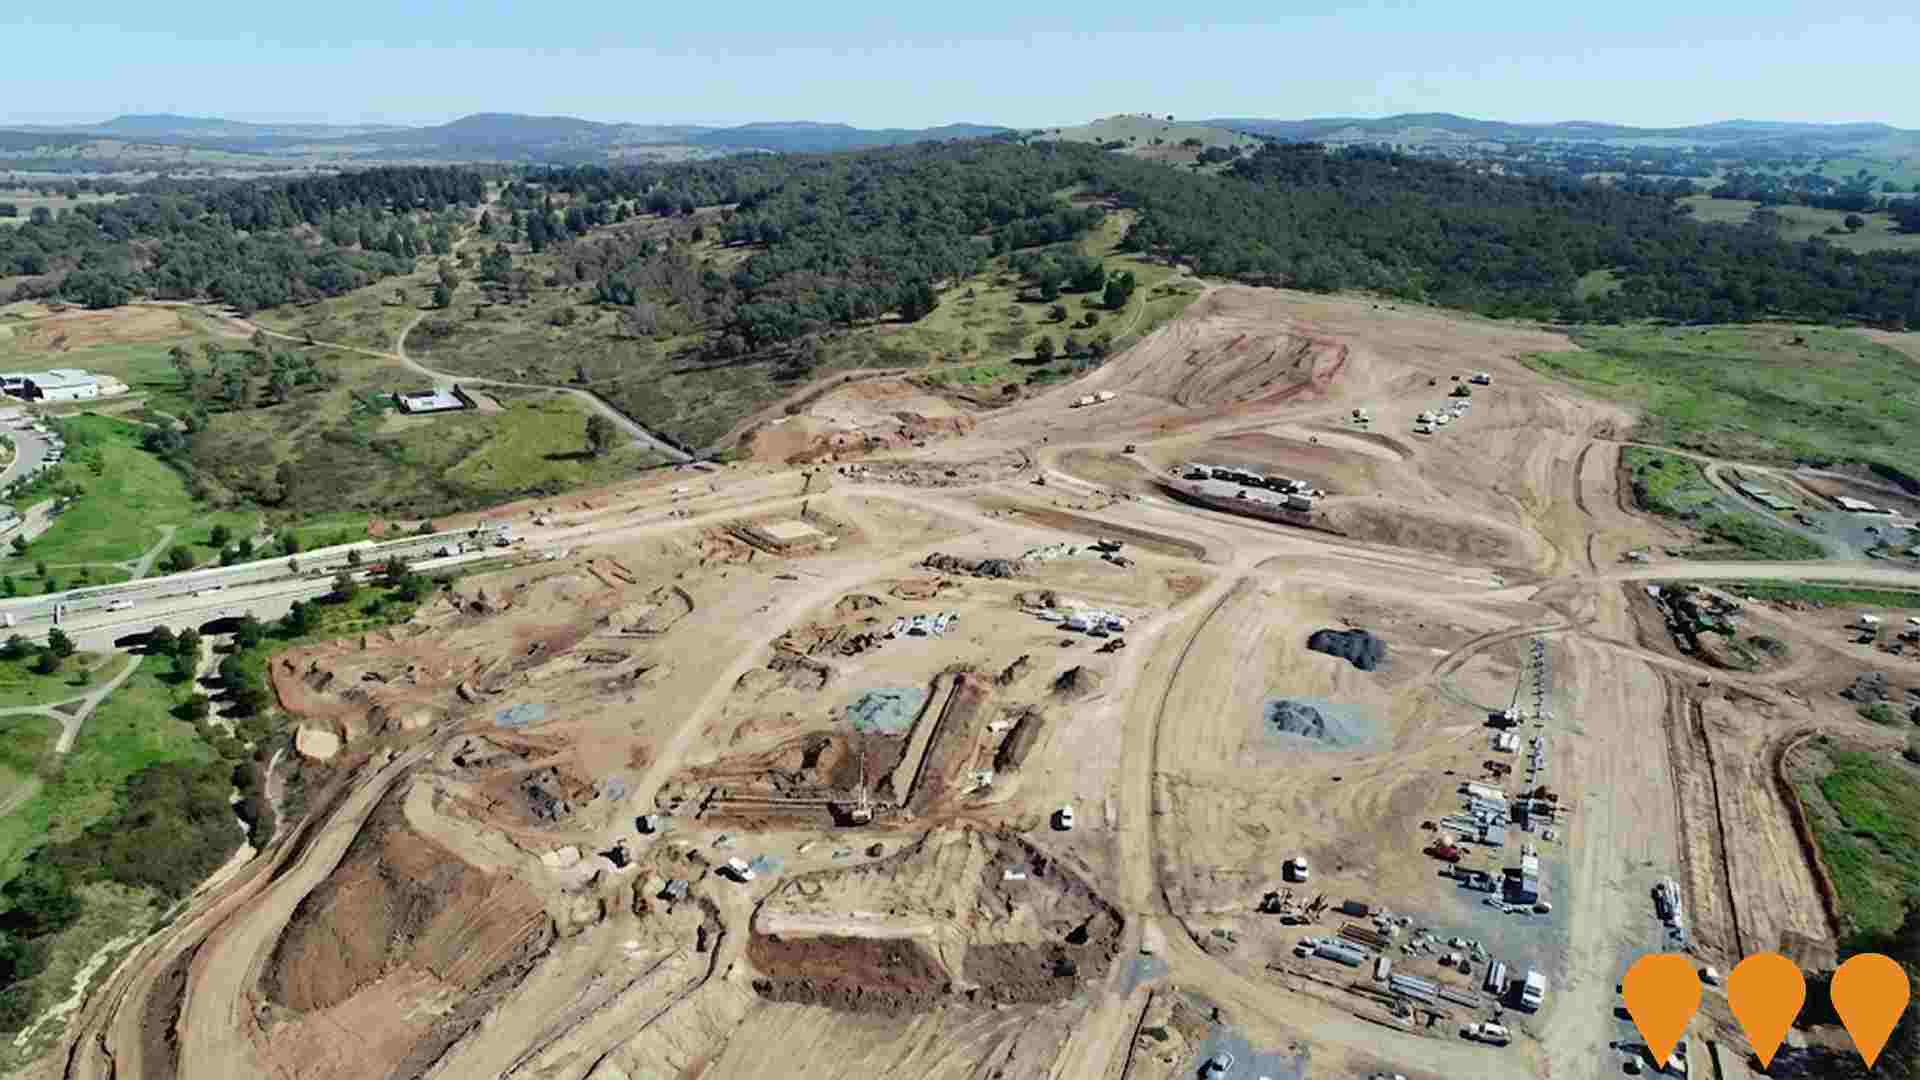
Molonglo Town Centre
Molonglo Town Centre is the future primary commercial, civic and community hub for the Molonglo Valley district in Canberra. This 97-hectare mixed-use centre along the Molonglo River will include a major shopping precinct, homemaker centre, community facilities, library, schools, sports fields, district park, central playground and up to 7,500 new dwellings, ultimately serving approximately 70,000 residents by 2050.
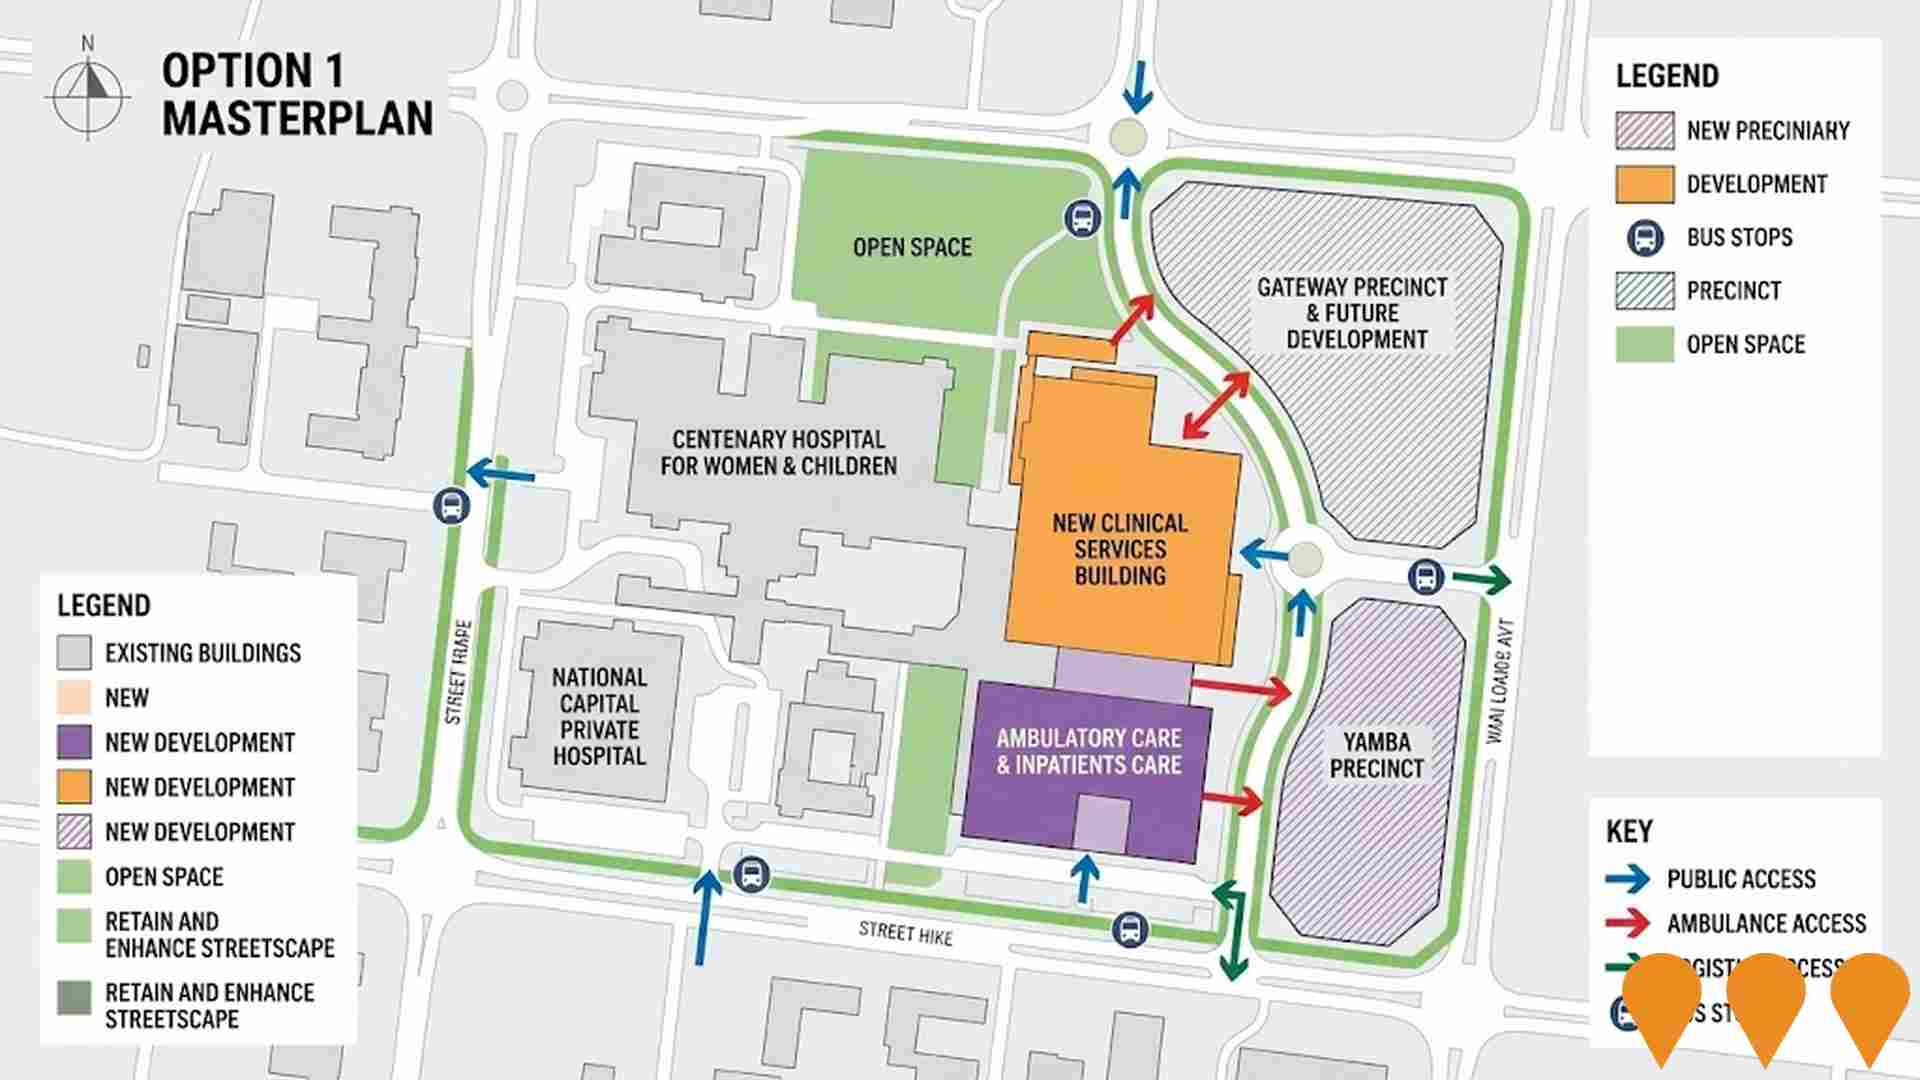
Canberra Hospital Master Plan
Long-term transformation of Canberra Hospital campus (2021-2041). The new Critical Services Building (Building 5) opened in 2023. Multiple stages are now in construction or detailed planning, including SPIRE Stage 1 (new emergency, surgical and intensive care facilities) and ongoing campus renewal works to deliver modern clinical facilities.
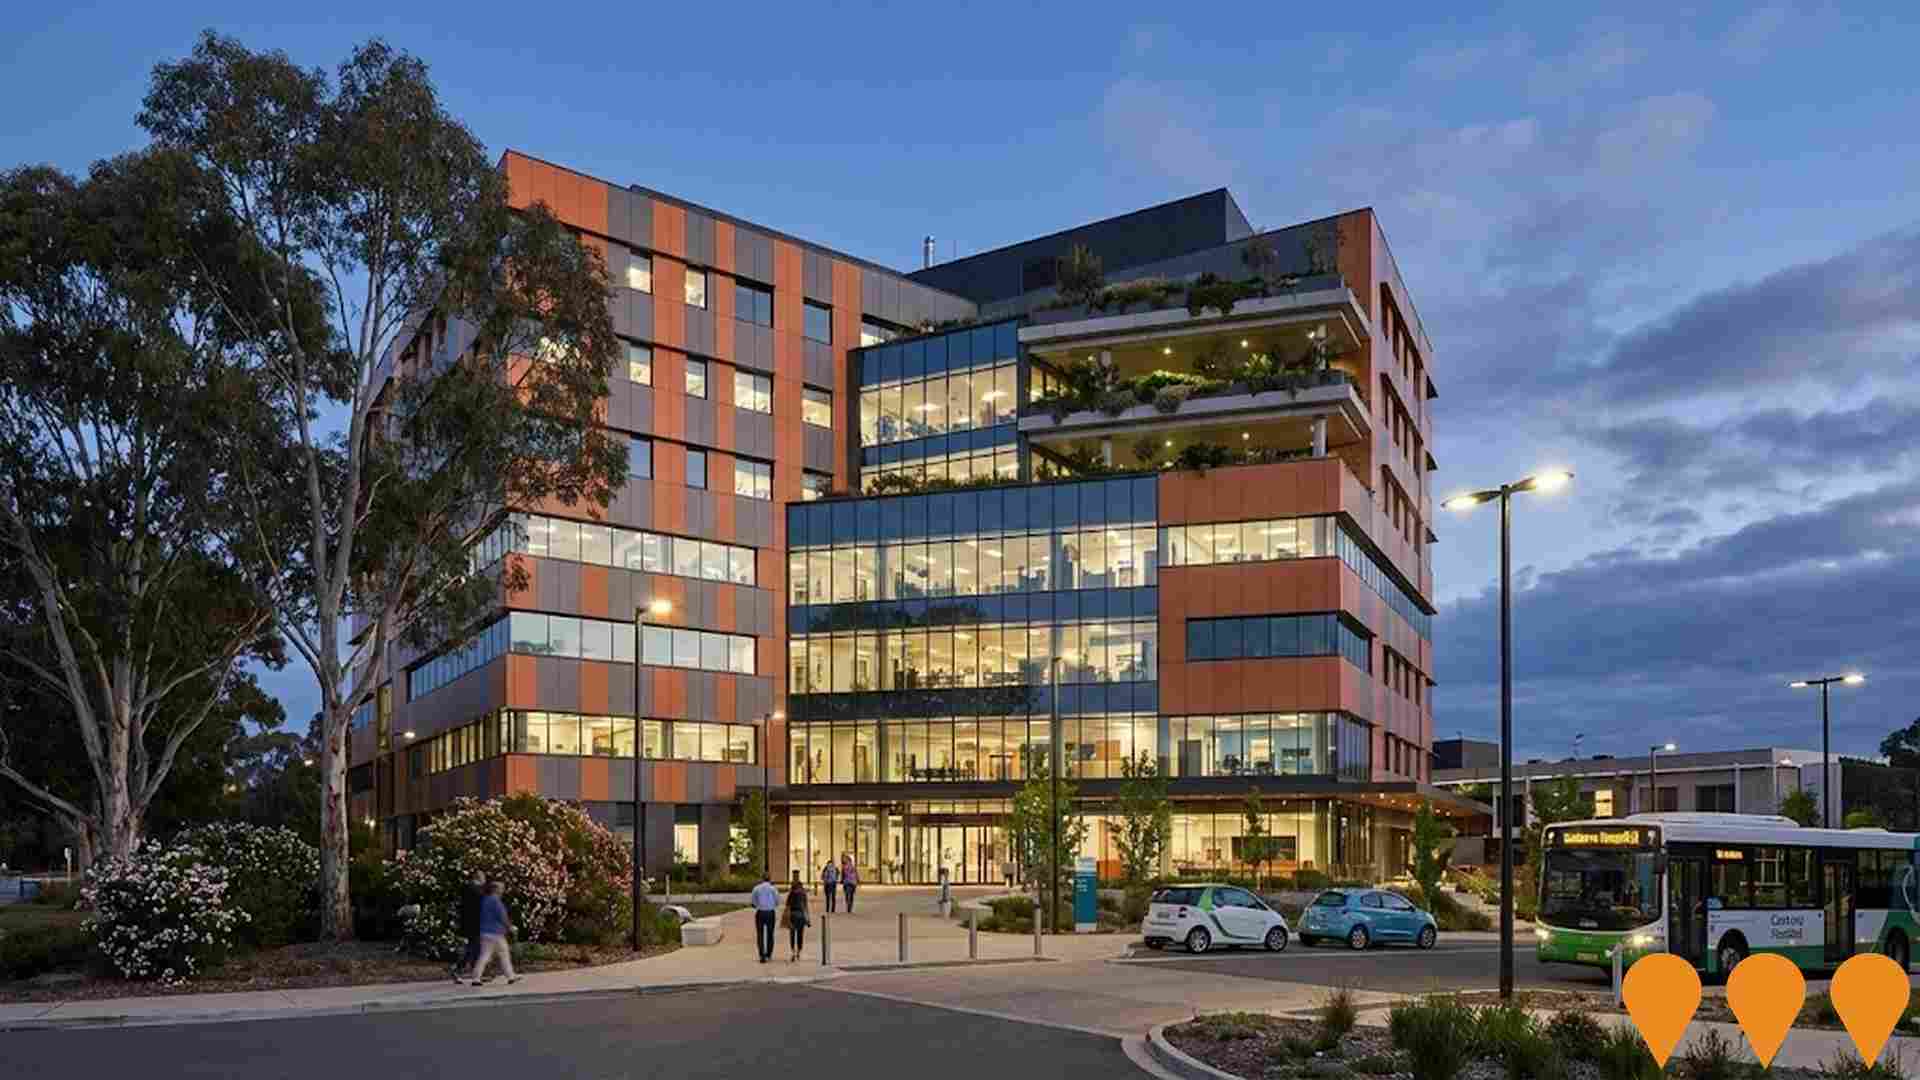
Canberra Hospital Critical Services Building (SPIRE Centre)
Australia's first fully-electric hospital building, the Canberra Hospital Critical Services Building (also known as SPIRE Centre), is an eight-storey, 45,000 square metre facility. It includes a new Emergency Department with 128 treatment spaces, a 48-bed Intensive Care Unit with two outdoor terraces, 22 operating theatres, 148 inpatient beds, cardiac catheter laboratories, and enhanced radiology and pathology services. The largest healthcare infrastructure project in ACT history, it was built by Multiplex with a 5 Star Green Star design rating, featuring innovative sustainability measures. Completed and opened August 2024.
Molonglo Group Centre to Town Centre Transition
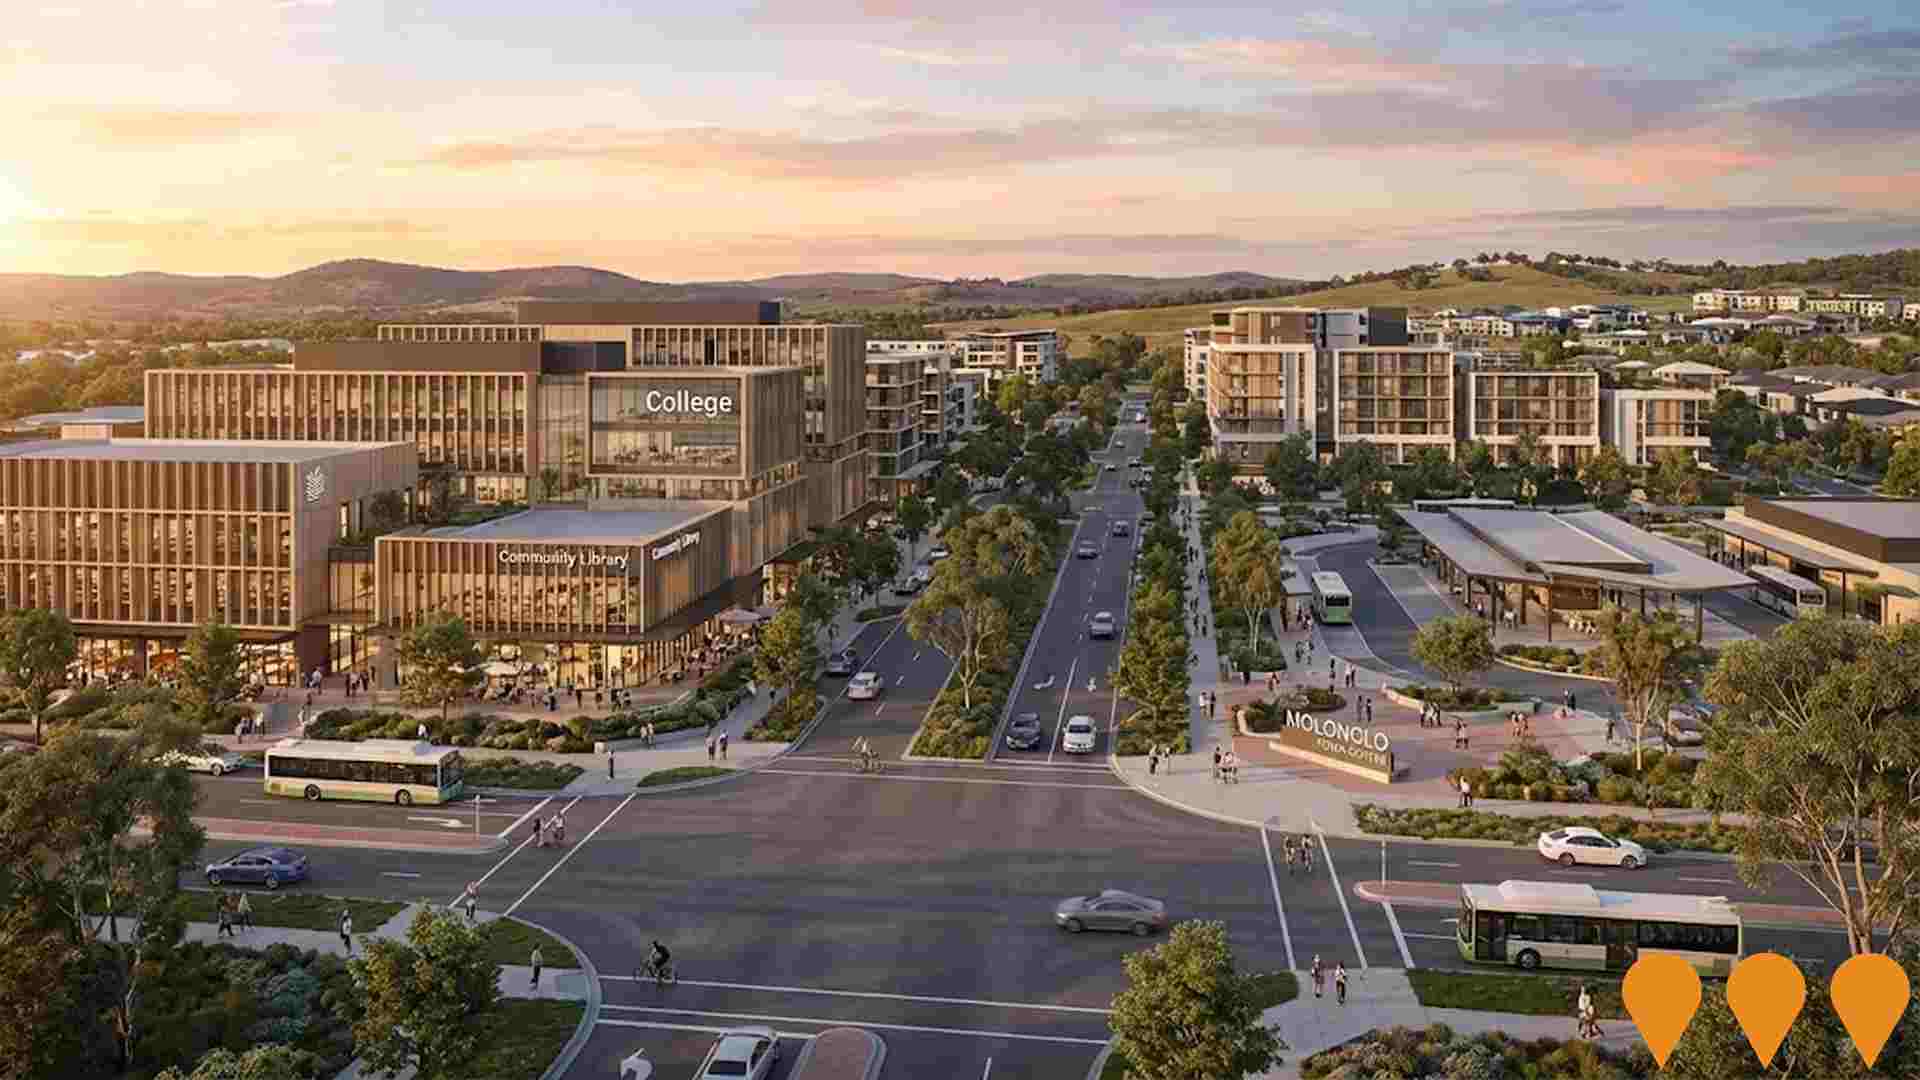
Transition of Molonglo Group Centre to Town Centre status to accommodate 70,000+ residents by 2050. Will include college, library, community centre, transport interchange and major commercial centre development.
Molonglo River Bridge and John Gorton Drive Extension
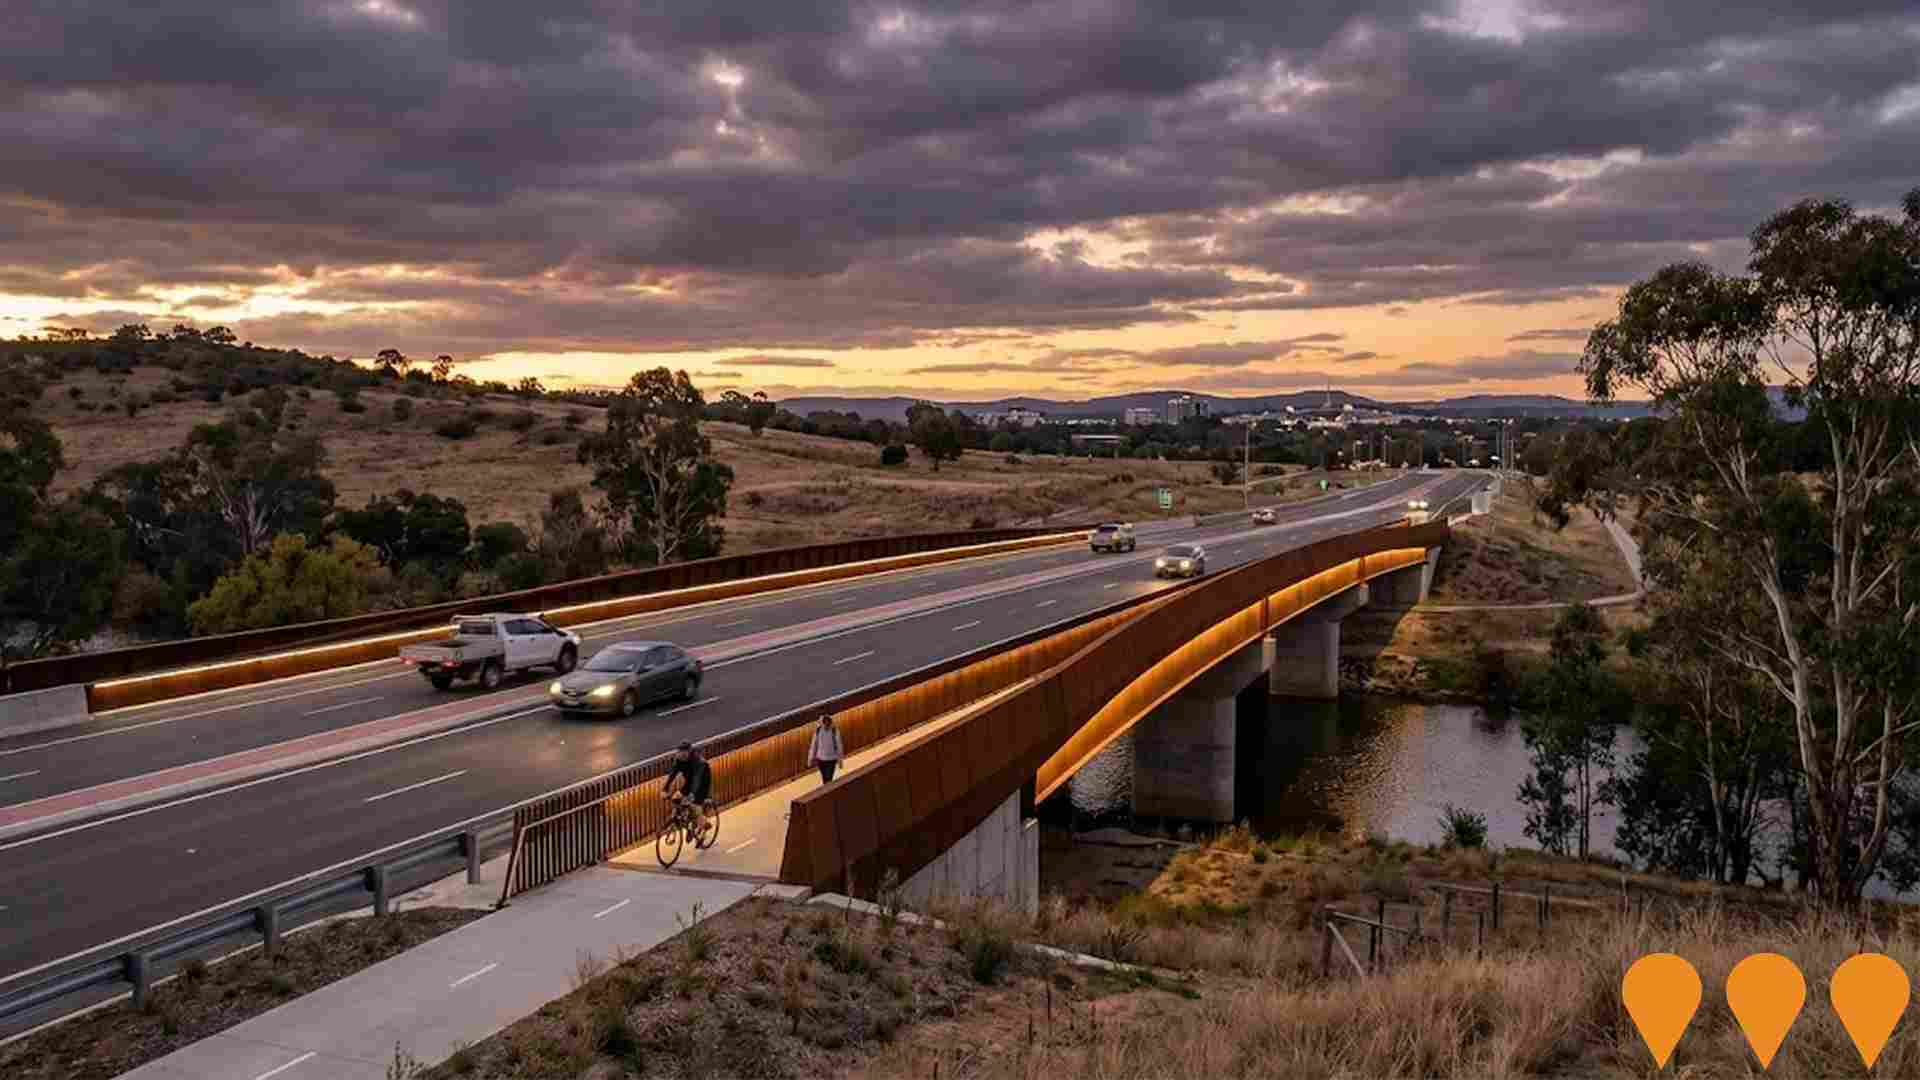
The Molonglo River Bridge is a major infrastructure project consisting of a 200-metre long weathering steel bridge over the Molonglo River and approximately 1.7 kilometres of new arterial roads as part of the John Gorton Drive extension. The bridge will be the longest weathering steel bridge in Australia and the tallest road bridge in Canberra. It will significantly improve connectivity for the Molonglo Valley suburbs, including Denman Prospect and Whitlam, to the rest of Canberra, replacing the flood-prone Coppins Crossing and ensuring all-weather access. The project includes new intersections, provisions for public transport (including future light rail), dedicated paths for pedestrians and cyclists, and planned habitat for native fauna including platypus nesting sites.
Bandler and Sulman New Suburbs
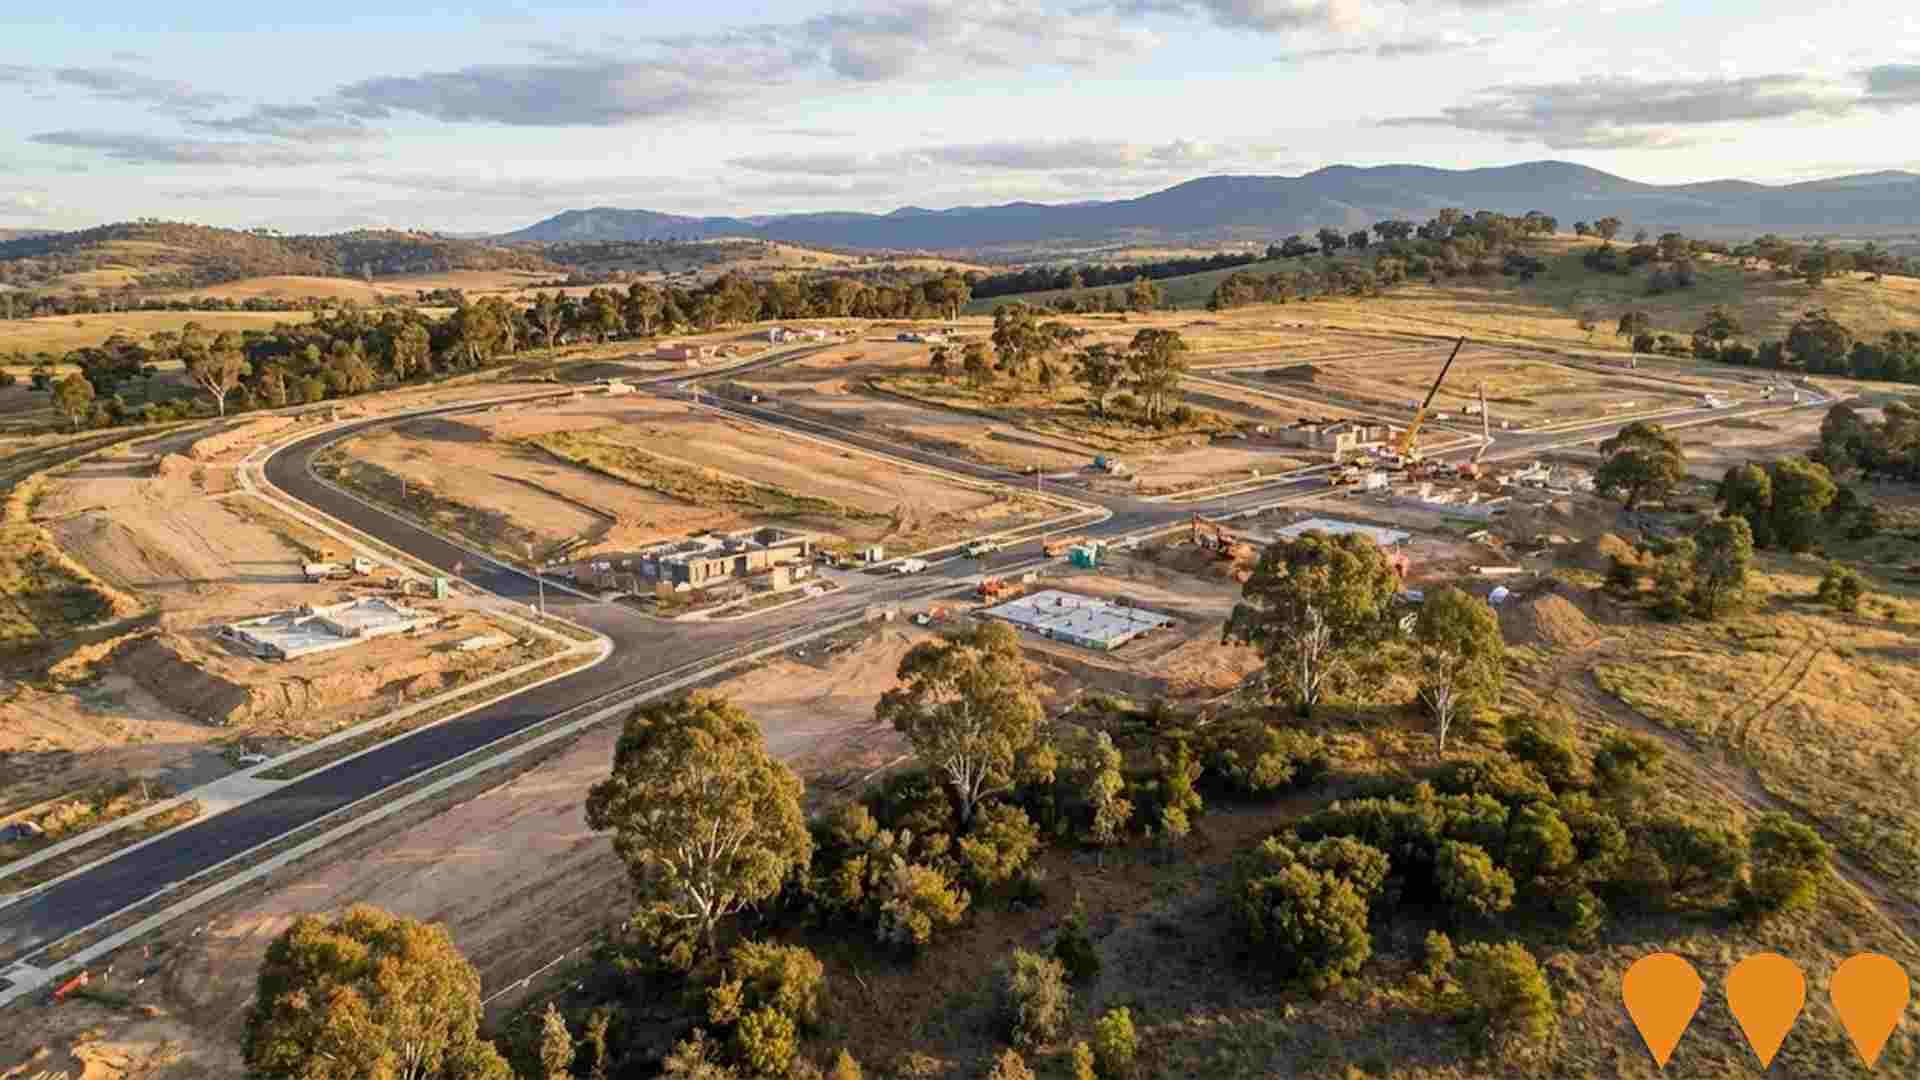
Development of two new suburbs in the Molonglo Valley - Bandler and Sulman - as part of the Molonglo Valley 3 East planning area. The project will provide approximately 2,500 new dwellings with supporting infrastructure, parks, schools, and community facilities. Planning is in early stages with potential delays due to infrastructure requirements like the Bindubi Street Extension.
Deakin Private Hospital
Deakin Private Hospital offers premium and integrated inpatient, day therapy, and hospital-in-the-home services, focusing on individualised and high-quality mental health treatment. It includes a Specialised PTSD & Trauma Support Unit for military and first responders, and services such as Repetitive Transcranial Magnetic Stimulation (rTMS) for depression. The hospital also features co-located clinics and is supported by a multidisciplinary team of Psychiatrists, Medical, Nursing, and Allied Health professionals.

Fetherston Weston
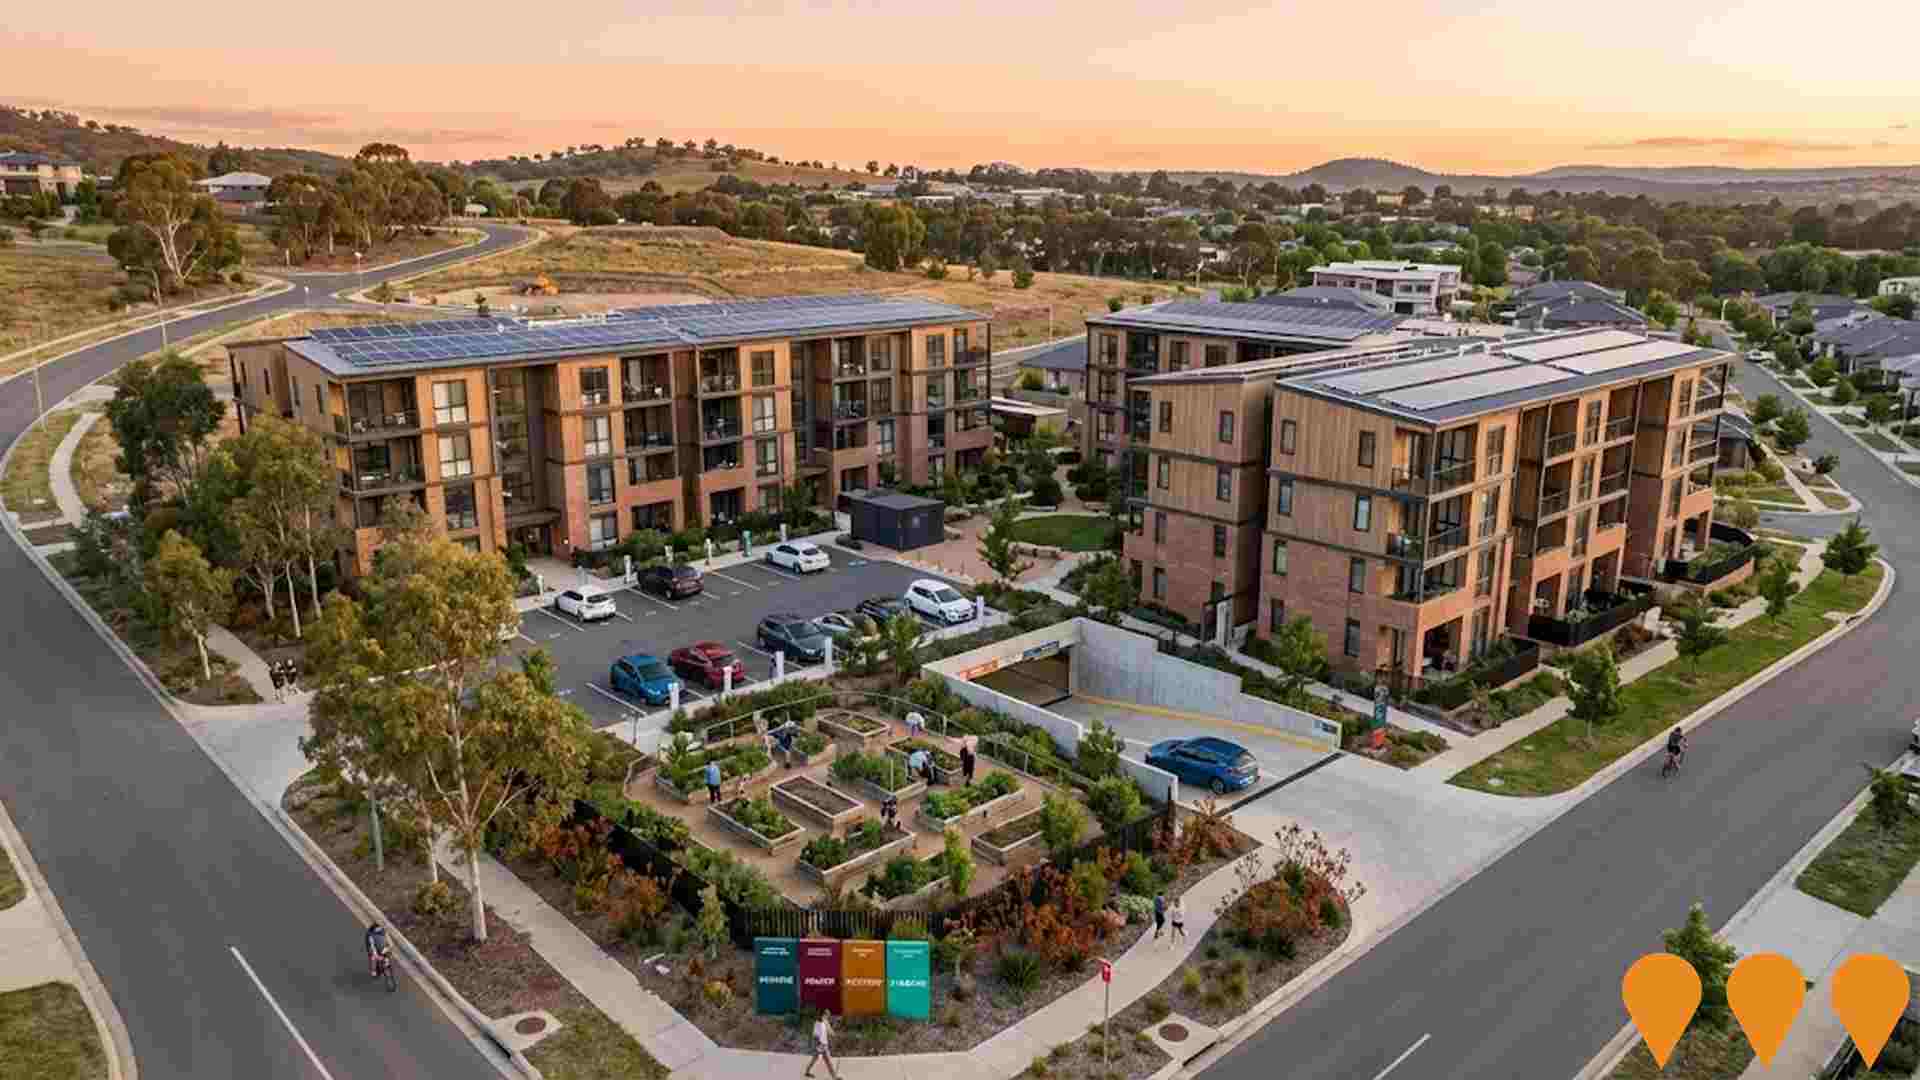
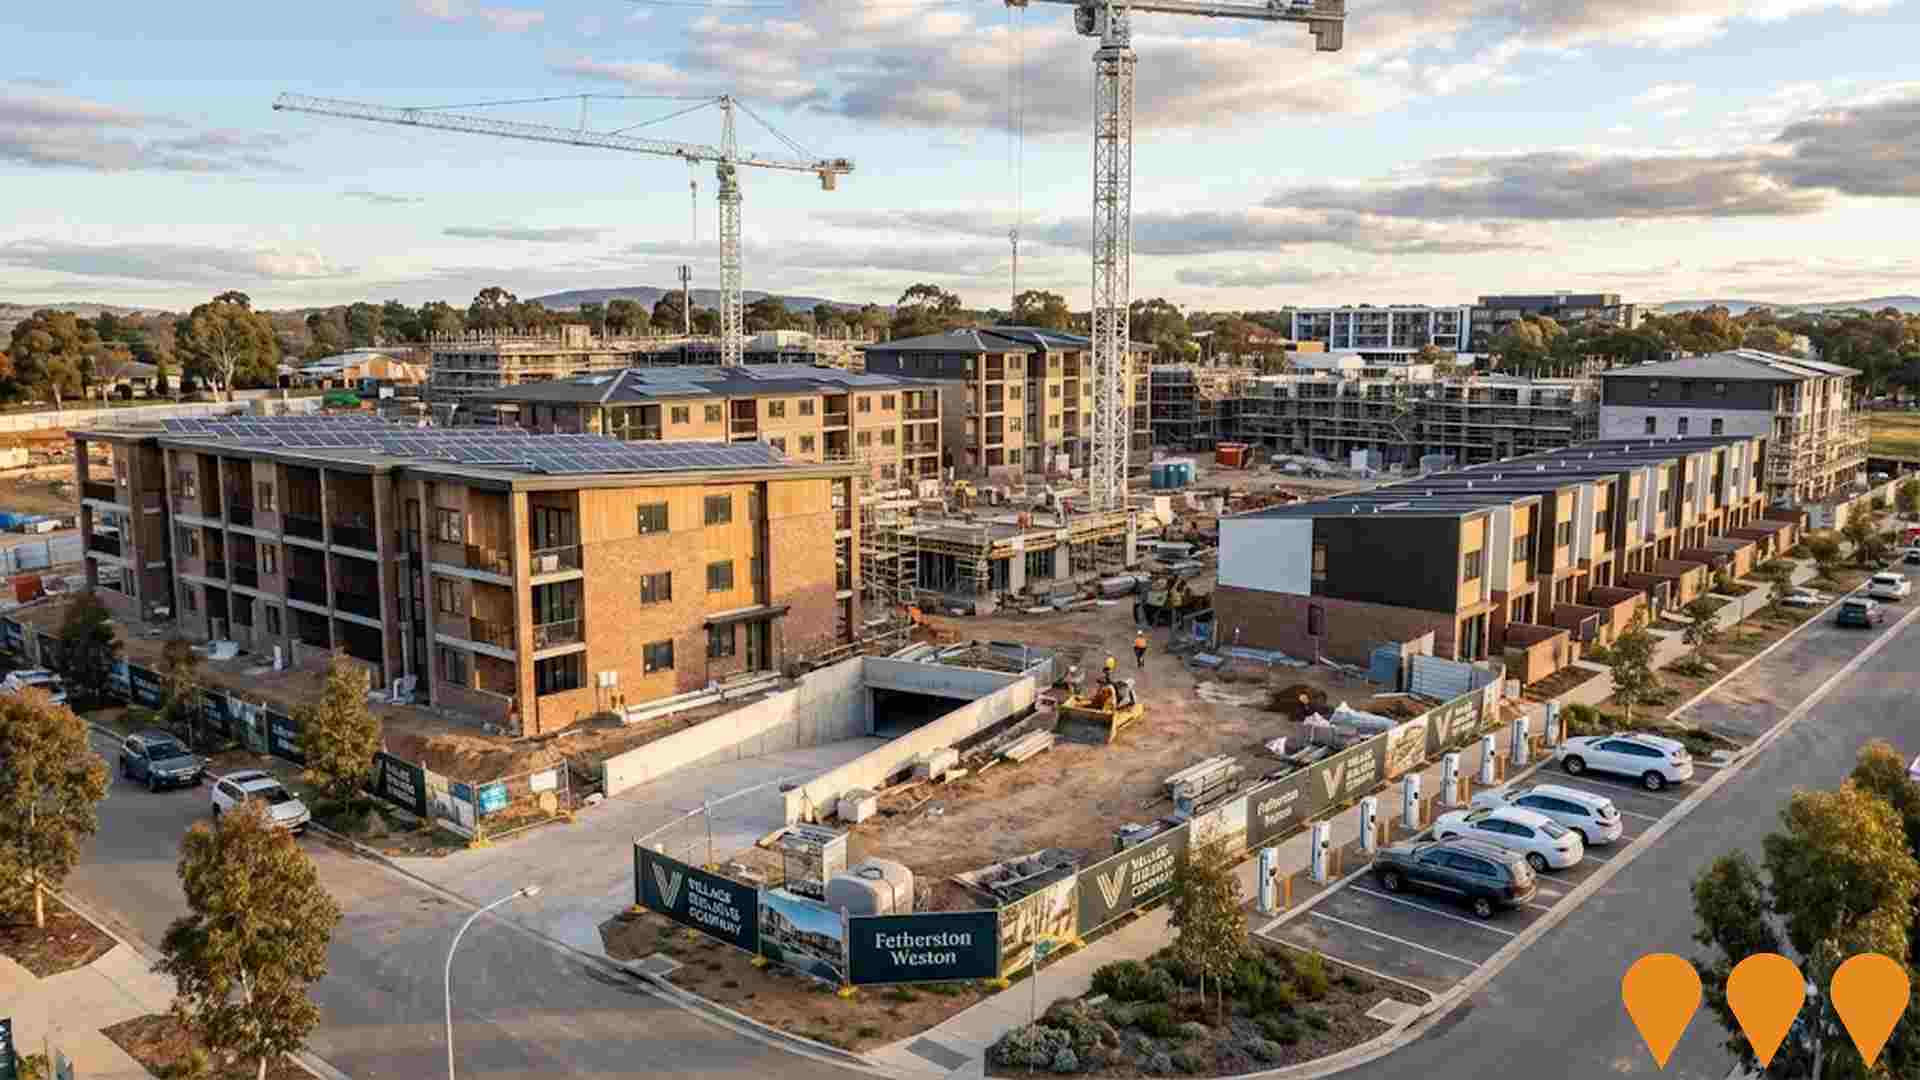
Village Building Company plans a medium-density development of 337 homes on former AFP site with sustainable features like solar panels and EV charging stations. Construction of 26 new buildings comprising 11 three-storey apartment buildings, 5 walk-up apartment buildings and 15 two-storey townhouses to accommodate a total of 337 new dwellings, with new basement car parking. Amendment for changes to the roof on building L, M, N, O, P and Z, and changes to building levels for buildings N and Z.
Employment
Employment performance in Weston exceeds national averages across key labour market indicators
Weston has a highly educated workforce with strong representation in professional services. Its unemployment rate was 2.6% as of September 2025, with an estimated employment growth of 2.4% over the past year.
As of this date, 2,042 residents were employed while the unemployment rate was 1.0% below the Australian Capital Territory's (ACT) rate of 3.6%. Workforce participation in Weston was 60.8%, significantly lower than ACT's 69.6%. Leading employment industries among Weston residents included public administration & safety, health care & social assistance, and professional & technical services.
Retail trade had limited presence with 4.4% employment compared to the regional average of 6.6%. Employment opportunities exist locally, but many residents commute elsewhere for work based on Census data. Over the 12 months to September 2025, Weston's employment increased by 2.4%, while labour force grew by 1.1%, causing the unemployment rate to fall by 1.3 percentage points. In contrast, ACT saw employment rise by 1.4%, labour force grow by 1.2%, and unemployment fall by 0.2 percentage points. State-level data as of 25-Nov-25 showed ACT employment grew by 1.19% year-on-year (adding 710 jobs), with the state unemployment rate at 4.5%, compared to the national rate of 4.3%. National employment forecasts from May-25 suggest growth of 6.6% over five years and 13.7% over ten years, but industry-specific projections for Weston indicate local employment should increase by 6.7% over five years and 13.6% over ten years. These projections are simple extrapolations based on current employment mix and do not account for localized population projections.
Frequently Asked Questions - Employment
Income
The economic profile demonstrates exceptional strength, placing the area among the top 10% nationally based on comprehensive AreaSearch income analysis
AreaSearch's aggregation of latest postcode level ATO data released for financial year 2022 shows Weston SA2 had a median income among taxpayers of $70,298 and an average income of $83,630. These figures are among the highest in Australia, compared to $68,678 and $83,634 across Australian Capital Territory respectively. Based on Wage Price Index growth of 13.6% since financial year 2022, current estimates for median income would be approximately $79,859 and average income around $95,004 as of September 2025. According to 2021 Census figures, household, family and personal incomes in Weston rank highly nationally, between the 86th and 93rd percentiles. Distribution data shows that 28.1% of residents (1,123 people) fall within the $1,500 - 2,999 weekly income bracket, reflecting patterns seen in metropolitan regions where 34.3% occupy this range. Higher earners represent a substantial presence with 40.4% exceeding $3,000 weekly, indicating strong purchasing power within the community. After housing costs, residents retain 87.5% of their income, reflecting strong purchasing power and the area's SEIFA income ranking places it in the 9th decile.
Frequently Asked Questions - Income
Housing
Weston is characterized by a predominantly suburban housing profile, with a higher proportion of rental properties than the broader region
The dwelling structure in Weston, as evaluated at the latest Census, consisted of 74.4% houses and 25.6% other dwellings (semi-detached, apartments, 'other' dwellings). This compares to the Australian Capital Territory's figures of 81.7% houses and 18.2% other dwellings. Home ownership in Weston was at 37.6%, similar to the Australian Capital Territory figure. The remaining dwellings were either mortgaged (38.9%) or rented (23.5%). The median monthly mortgage repayment in Weston was $2,200, below the Australian Capital Territory average of $2,251. The median weekly rent figure in Weston was $420, matching the Australian Capital Territory figure. Nationally, Weston's mortgage repayments were significantly higher than the Australian average of $1,863, while rents were substantially above the national figure of $375.
Frequently Asked Questions - Housing
Household Composition
Weston has a typical household mix, with a lower-than-average median household size
Family households constitute 71.3% of all households, including 32.8% couples with children, 27.7% couples without children, and 9.6% single parent families. Non-family households comprise the remaining 28.7%, with lone person households at 25.8% and group households making up 3.1%. The median household size is 2.5 people, which is smaller than the Australian Capital Territory average of 2.6.
Frequently Asked Questions - Households
Local Schools & Education
Educational achievement in Weston places it within the top 10% nationally, reflecting strong academic performance and high qualification levels across the community
Weston's residents aged 15+ have a higher proportion with university qualifications (52.0%) compared to Australia (30.4%) and the SA3 area (46.6%). Bachelor degrees are most common (27.8%), followed by postgraduate qualifications (17.8%) and graduate diplomas (6.4%). Vocational pathways account for 21.2%, with advanced diplomas at 9.8% and certificates at 11.4%. Educational participation is high, with 31.6% of residents currently enrolled in formal education: 10.2% in primary, 7.9% in secondary, and 7.4% in tertiary education.
Educational participation is notably high, with 31.6% of residents currently enrolled in formal education. This includes 10.2% in primary education, 7.9% in secondary education, and 7.4% pursuing tertiary education.
Frequently Asked Questions - Education
Schools Detail
Nearby Services & Amenities
Transport
Transport servicing is good compared to other areas nationally based on assessment of service frequency, route connectivity and accessibility
Weston has 36 active public transport stops. These are served by a mix of buses along 12 different routes. The total weekly passenger trips across all routes is 1,773.
Residents have excellent accessibility to these stops, with an average distance of 182 meters to the nearest one. Each route makes about 49 weekly trips per stop, with service frequency averaging 253 trips daily across all routes.
Frequently Asked Questions - Transport
Transport Stops Detail
Health
Health performance in Weston is lower than average with common health conditions somewhat prevalent across both younger and older age cohorts
Weston faces significant health challenges, with common health conditions somewhat prevalent across both younger and older age cohorts. The rate of private health cover is exceptionally high at approximately 61% of the total population (2,450 people), compared to the national average of 55.3%.
The most common medical conditions in the area are arthritis and mental health issues, impacting 8.6 and 8.3% of residents respectively. However, 67.5% of residents declare themselves completely clear of medical ailments, compared to 66.3% across Australian Capital Territory. The area has 22.5% of residents aged 65 and over (897 people), which is higher than the 20.6% in Australian Capital Territory. Health outcomes among seniors present some challenges, broadly in line with the general population's health profile.
Frequently Asked Questions - Health
Cultural Diversity
The level of cultural diversity witnessed in Weston was found to be above average when compared nationally for a number of language and cultural background related metrics
Weston's population showed high cultural diversity, with 26.2% born overseas and 19.5% speaking languages other than English at home. Christianity dominated as the main religion in Weston, accounting for 42.4%. Islam was overrepresented compared to Australian Capital Territory figures (3.5% vs 1.8%).
The top three ancestral groups were English (25.0%), Australian (24.1%), and Other (11.1%). Hungarian (0.5%), French (0.8%), and Russian (0.5%) showed notable overrepresentation compared to regional figures of 0.6%, 0.7%, and 0.3% respectively.
Frequently Asked Questions - Diversity
Age
Weston's median age exceeds the national pattern
Weston's median age is 42, which is higher than the Australian Capital Territory figure of 35 and significantly higher than Australia's median age of 38. The 75-84 age group is notably over-represented in Weston at 10.2%, while the 25-34 age group is under-represented at 10.2%. From 2021 to present, the 15-24 age group has grown from 9.9% to 11.3% of the population, and the 35-44 cohort increased from 14.2% to 15.2%. Conversely, the 65-74 age group declined from 10.0% to 8.3%, and the 45-54 group dropped from 13.7% to 12.6%. By 2041, demographic modeling suggests Weston's age profile will evolve significantly. The 55-64 age cohort is projected to expand by 178 people (45%), growing from 400 to 579. Meanwhile, the 25-34 cohort grows by a modest 8% (34 people).
