Chart Color Schemes
This analysis uses ABS Statistical Areas Level 2 (SA2) boundaries, which can materially differ from Suburbs and Localities (SAL) even when sharing similar names.
SA2 boundaries are defined by the Australian Bureau of Statistics and are designed to represent communities for statistical reporting (e.g., census and ERP).
Suburbs and Localities (SAL) represent commonly-used suburb/locality names (postal-style areas) and may use different geographic boundaries. For comprehensive analysis, consider reviewing both boundary types if available.
est. as @ -- *
ABS ERP | -- people | --
2021 Census | -- people







Curious about local property values? Filter the chart to assess the volume and appreciation (including resales) trends and regional comparisons, or scroll to the map below view this information at an individual property level.


Find a Recent Sale

Sales Detail
Majura has an estimated 276 residents. Fewer than ten people live on each square kilometre, across a boundary that takes in surrounding rural land. Population is estimated from ABS Estimated Resident Population releases and GNAF address data, re-based from the 2021 Census and updated annually.
Detail
Based on AreaSearch's analysis, Majura's population is around 276 as of Nov 25. This reflects a decrease of 20 people (6.8%) since the 2021 Census, which reported a population of 296 people. The change is inferred from the estimated resident population of 270 from the ABS as of June 2024 and an additional 1 validated new addresses since the Census date. This level of population equates to a density ratio of 3.1 persons per square kilometer, a level providing ample space per person. Over the past decade, Majura has demonstrated resilient growth patterns with a 4.7% compound annual growth rate, outpacing the SA3 area.
Population growth for the area was primarily driven by overseas migration, which was essentially the sole driver of population gains during recent periods. AreaSearch is adopting ABS/Geoscience Australia projections for each SA2 area, as released in 2024 with 2022 as the base year. For any SA2 areas not covered by this data, and for years post-2032, age group growth rates from the ACT Government's SA2 area projections, with 2022 as a base, are adopted. Moving forward with demographic trends, Over this period, projections indicate a decline in overall population, with the area's population expected to reduce by 14 persons by 2041 according to this methodology. However, growth across specific age cohorts is anticipated, led by the 85 and over age group, which is projected to grow by 1 people. <i>See the age section for more details.</i>
Frequently Asked Questions - Population
Detail
Majura experiences very limited development activity averaging less than 1 approvals per year (totalling 3 across the past five years). Such low development levels are characteristic of rural areas where housing needs are modest and construction activity is naturally limited by local demand and infrastructure capacity. Note; given the small number of approvals, individual development projects can significantly impact annual growth and relativity statistics. Majura shows significantly less construction activity than Australian Capital Territory. Development levels are likewise under national averages. With population projections showing stability or decline, Majura should see reduced housing demand pressures, benefiting potential buyers.
Frequently Asked Questions - Development
Development applications around Majura
Loading development applications…
| Lodged | Address | Description | Type | Distance | Status |
|---|
SOURCE: Planning portals and council registers, compiled by AreaSearch. Distance & bearing measured from the suburb midpoint.
AreaSearch tracks 55 current infrastructure and development projects close to Majura, worth an estimated $13.9 billion. 19 are already under construction and 28 are due for completion within three years. The pipeline spans residential development, communities, precincts & urban renewal and transport & logistics. Records are compiled from Infrastructure Australia, state agencies, council planning portals and public announcements, reviewed and updated daily, then ranked by proximity, construction stage, completion horizon and project scale.
Detail
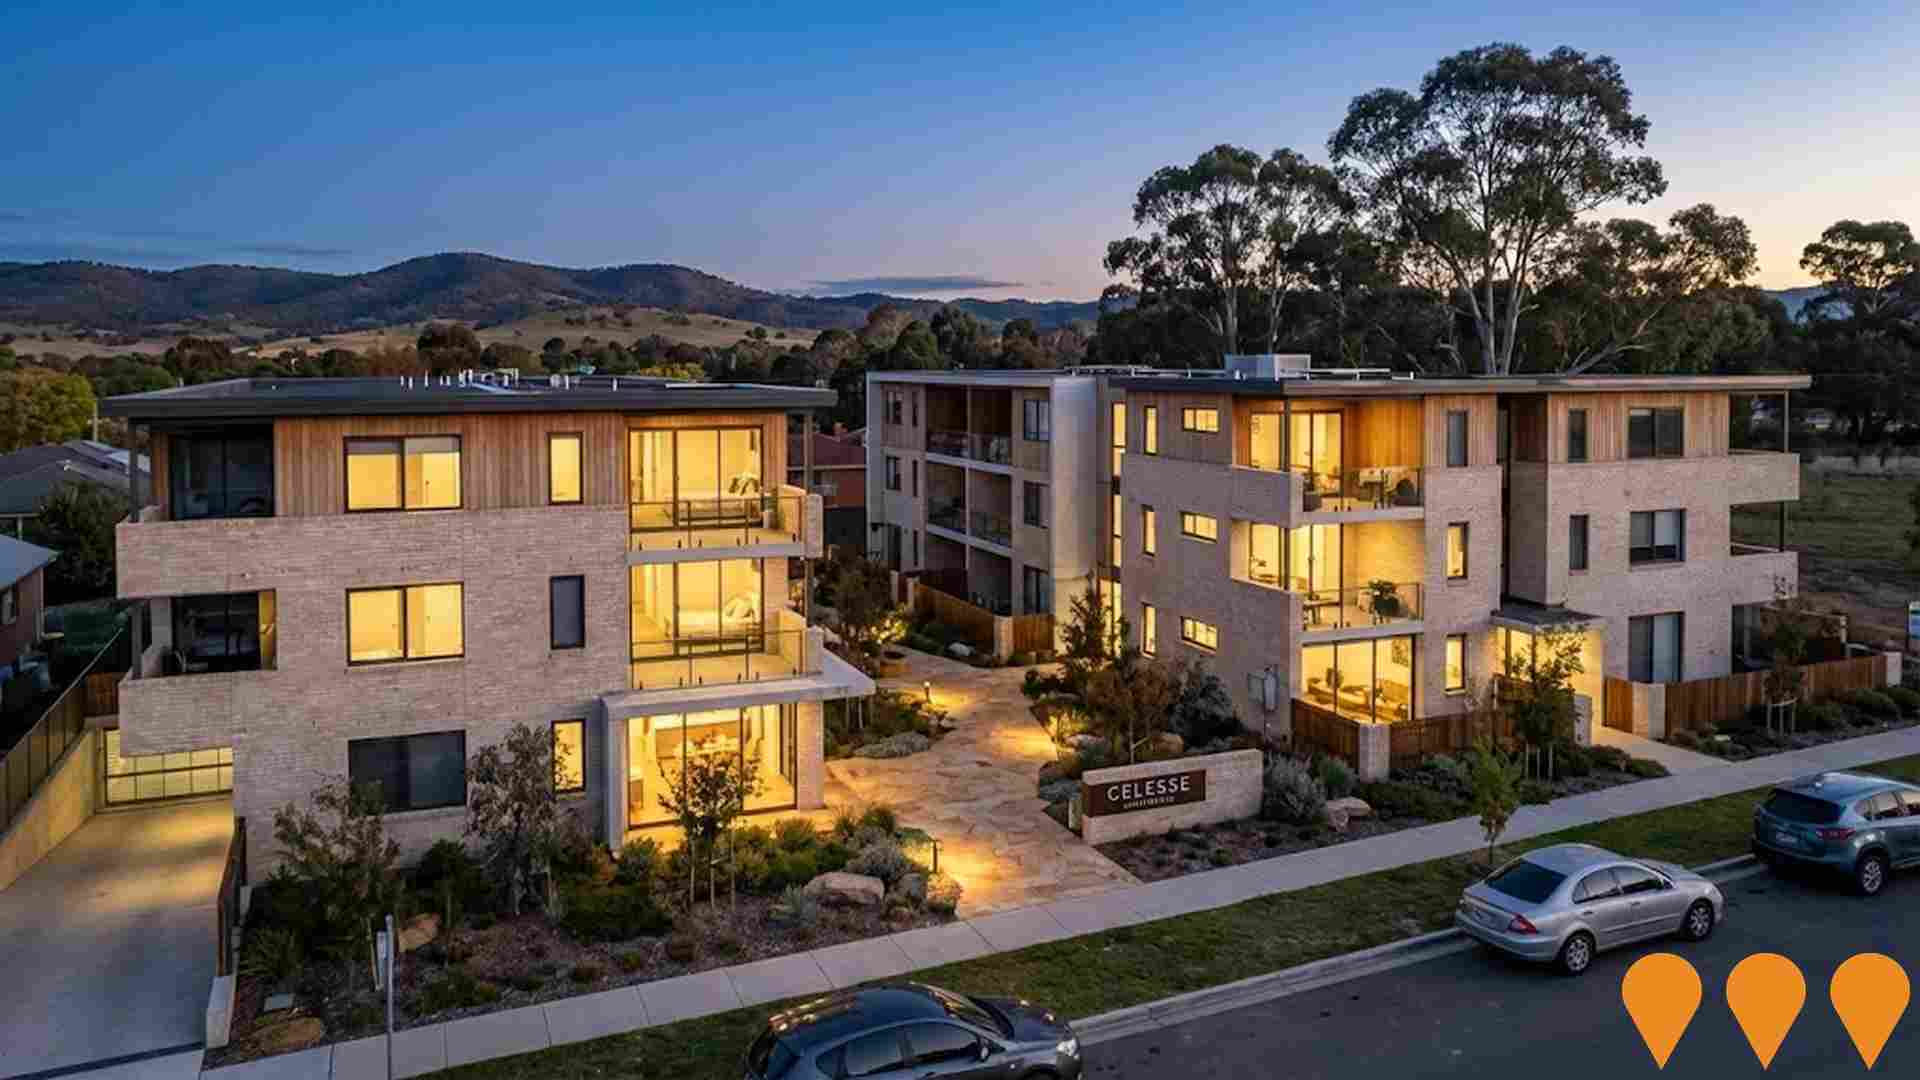
Nothing can influence an area's performance as much as changes to local infrastructure, major projects and planning initiatives. In total 37 projects have been identified by AreaSearch that are likely to have an impact on the area. Key projects include Enhanced bus and light rail corridors (Belconnen & Queanbeyan to Central Canberra), Australian Defence Force Academy Living-In Accommodation, Dairy Rd, Fyshwick, and Celesse Apartments, with the below list detailing those likely to be of most relevance. Majura has limited levels of nearby infrastructure activity, ranking in the 0thth percentile nationally
Professional plan users can use the search below to filter and access additional projects.
INFRASTRUCTURE SEARCH
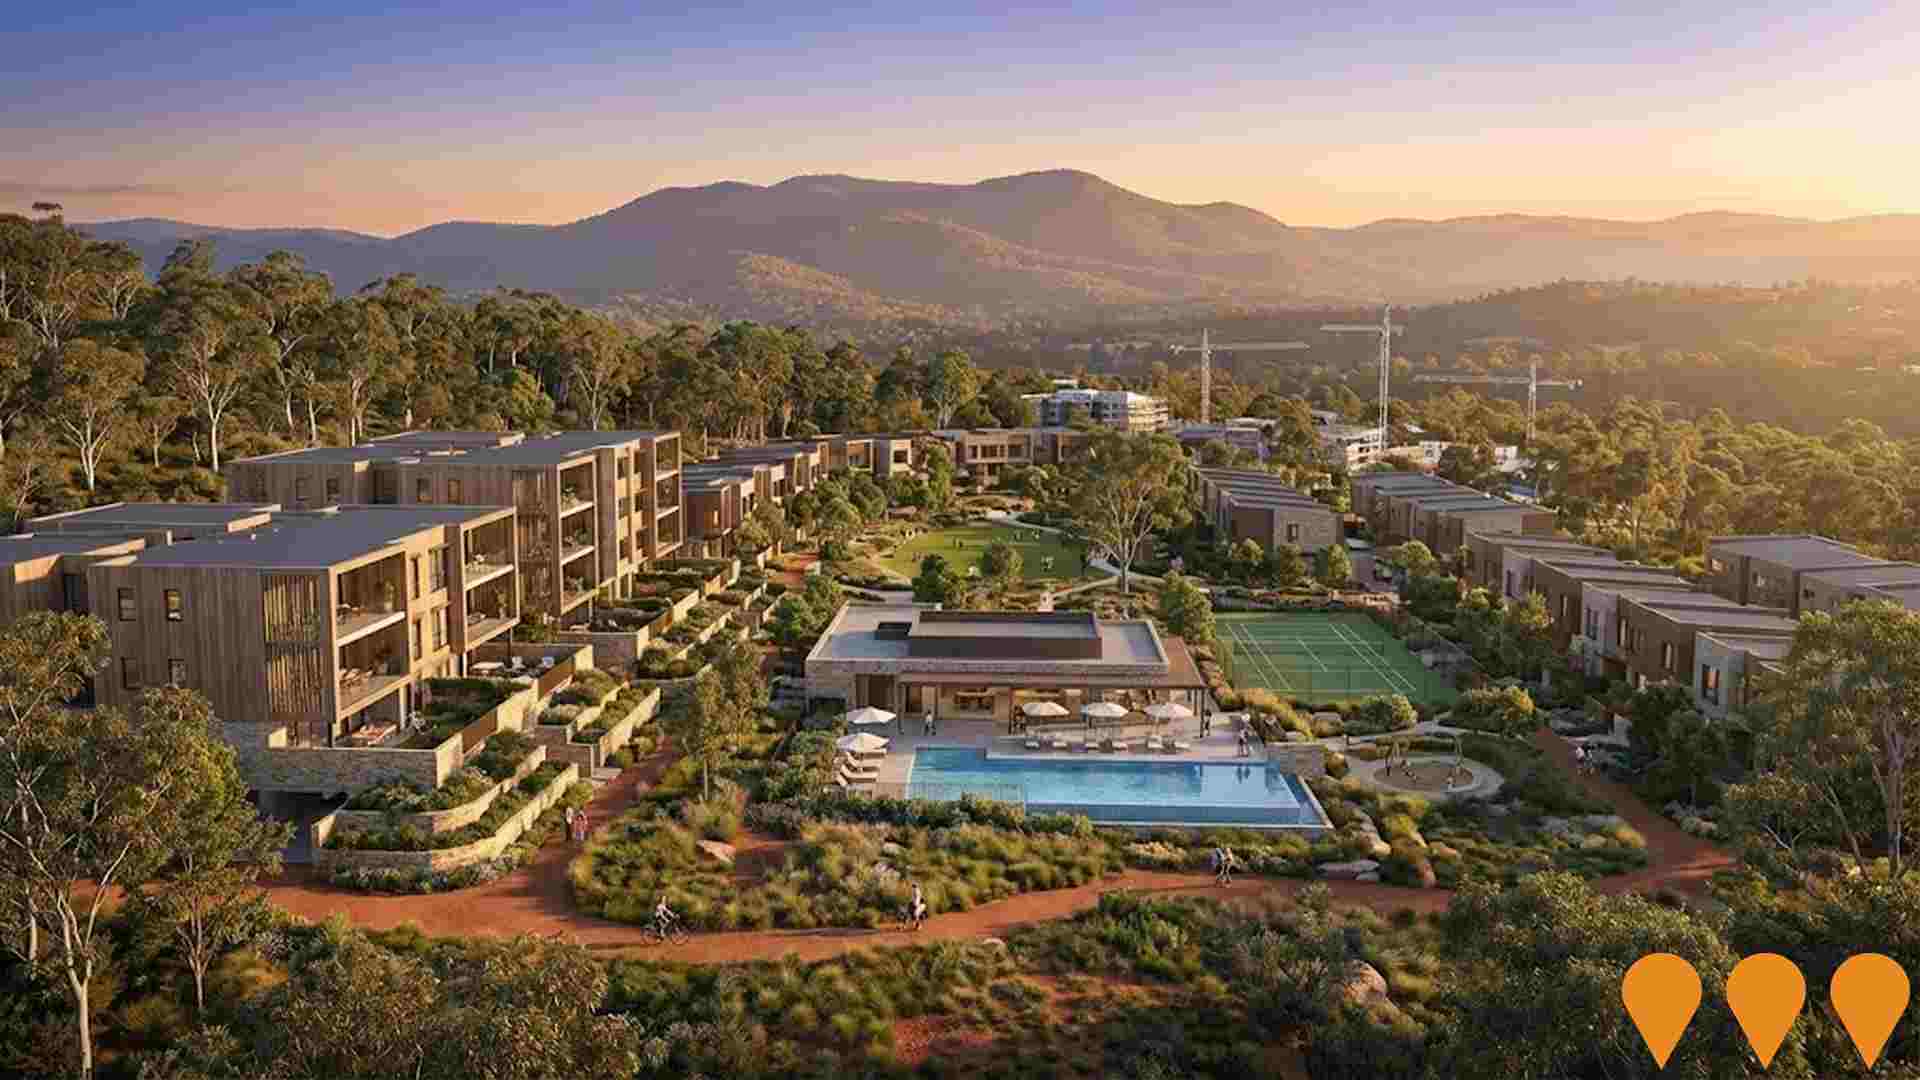
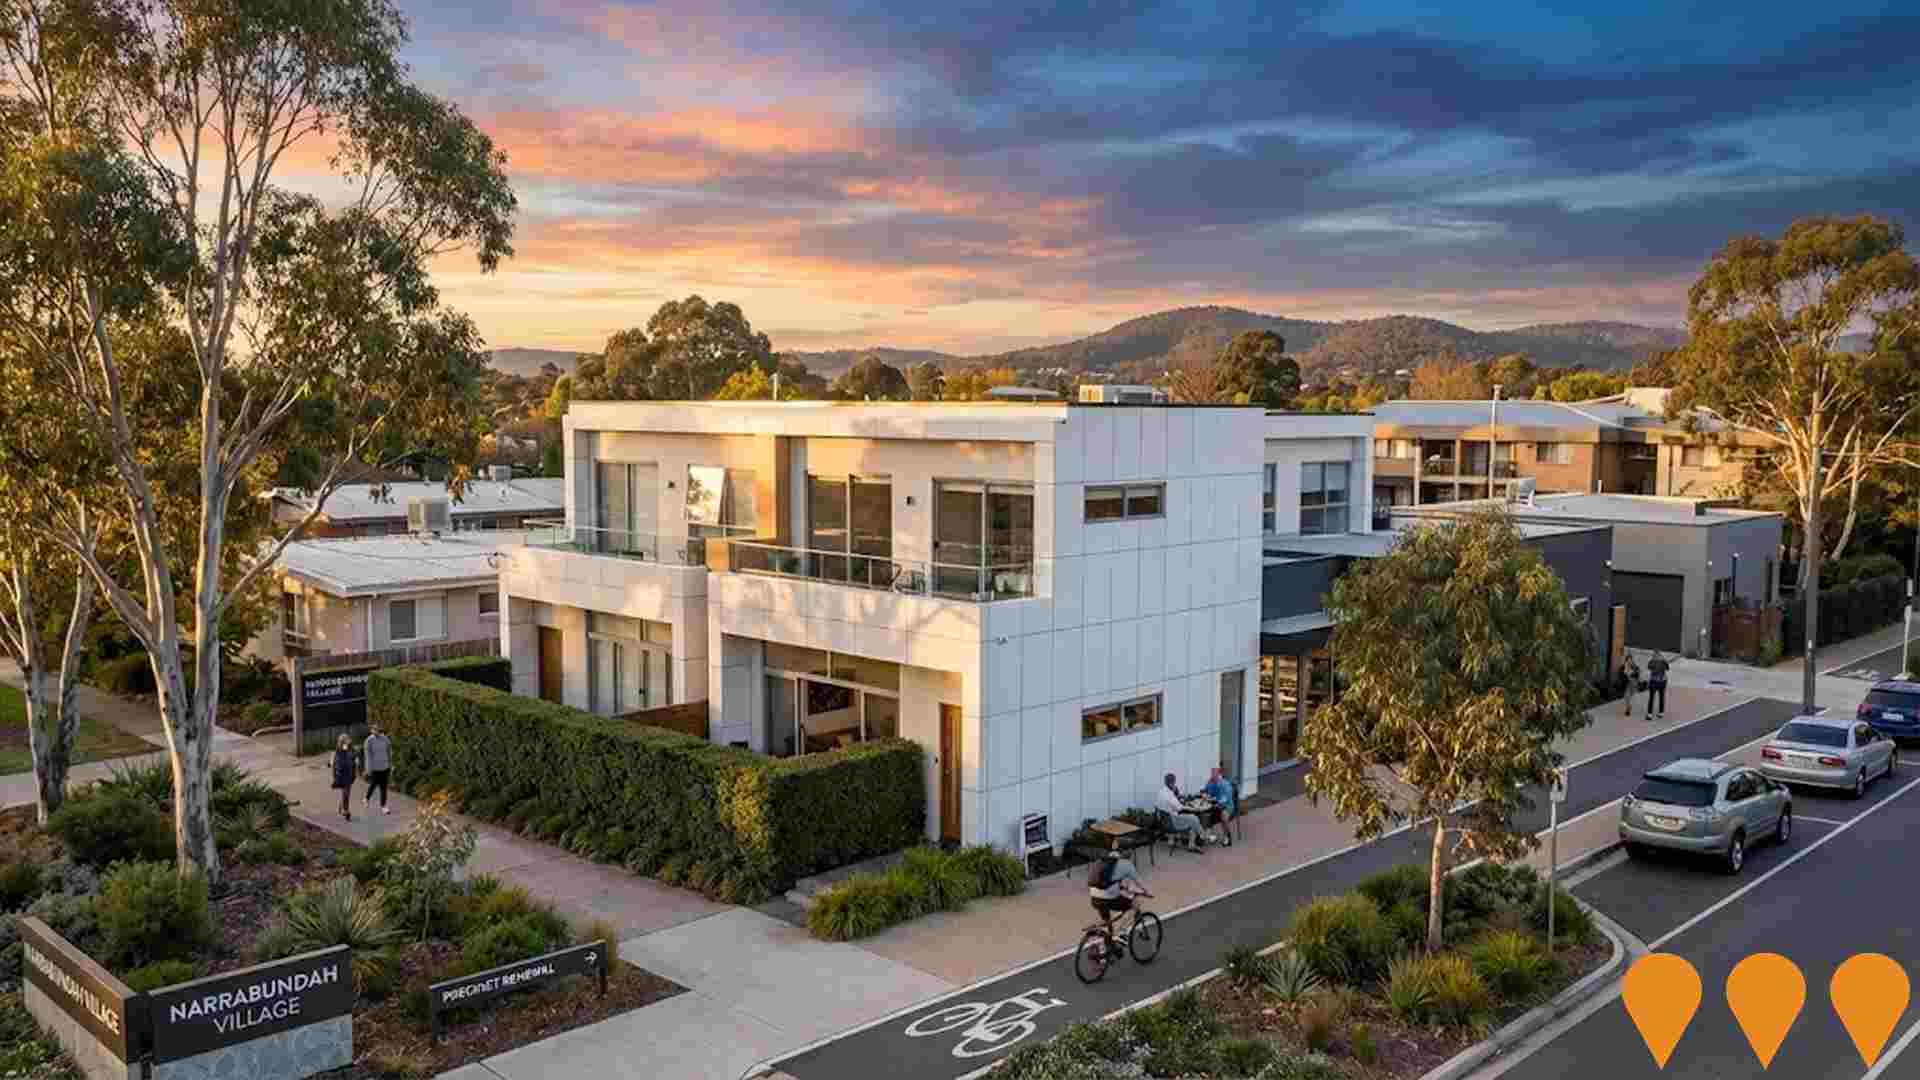
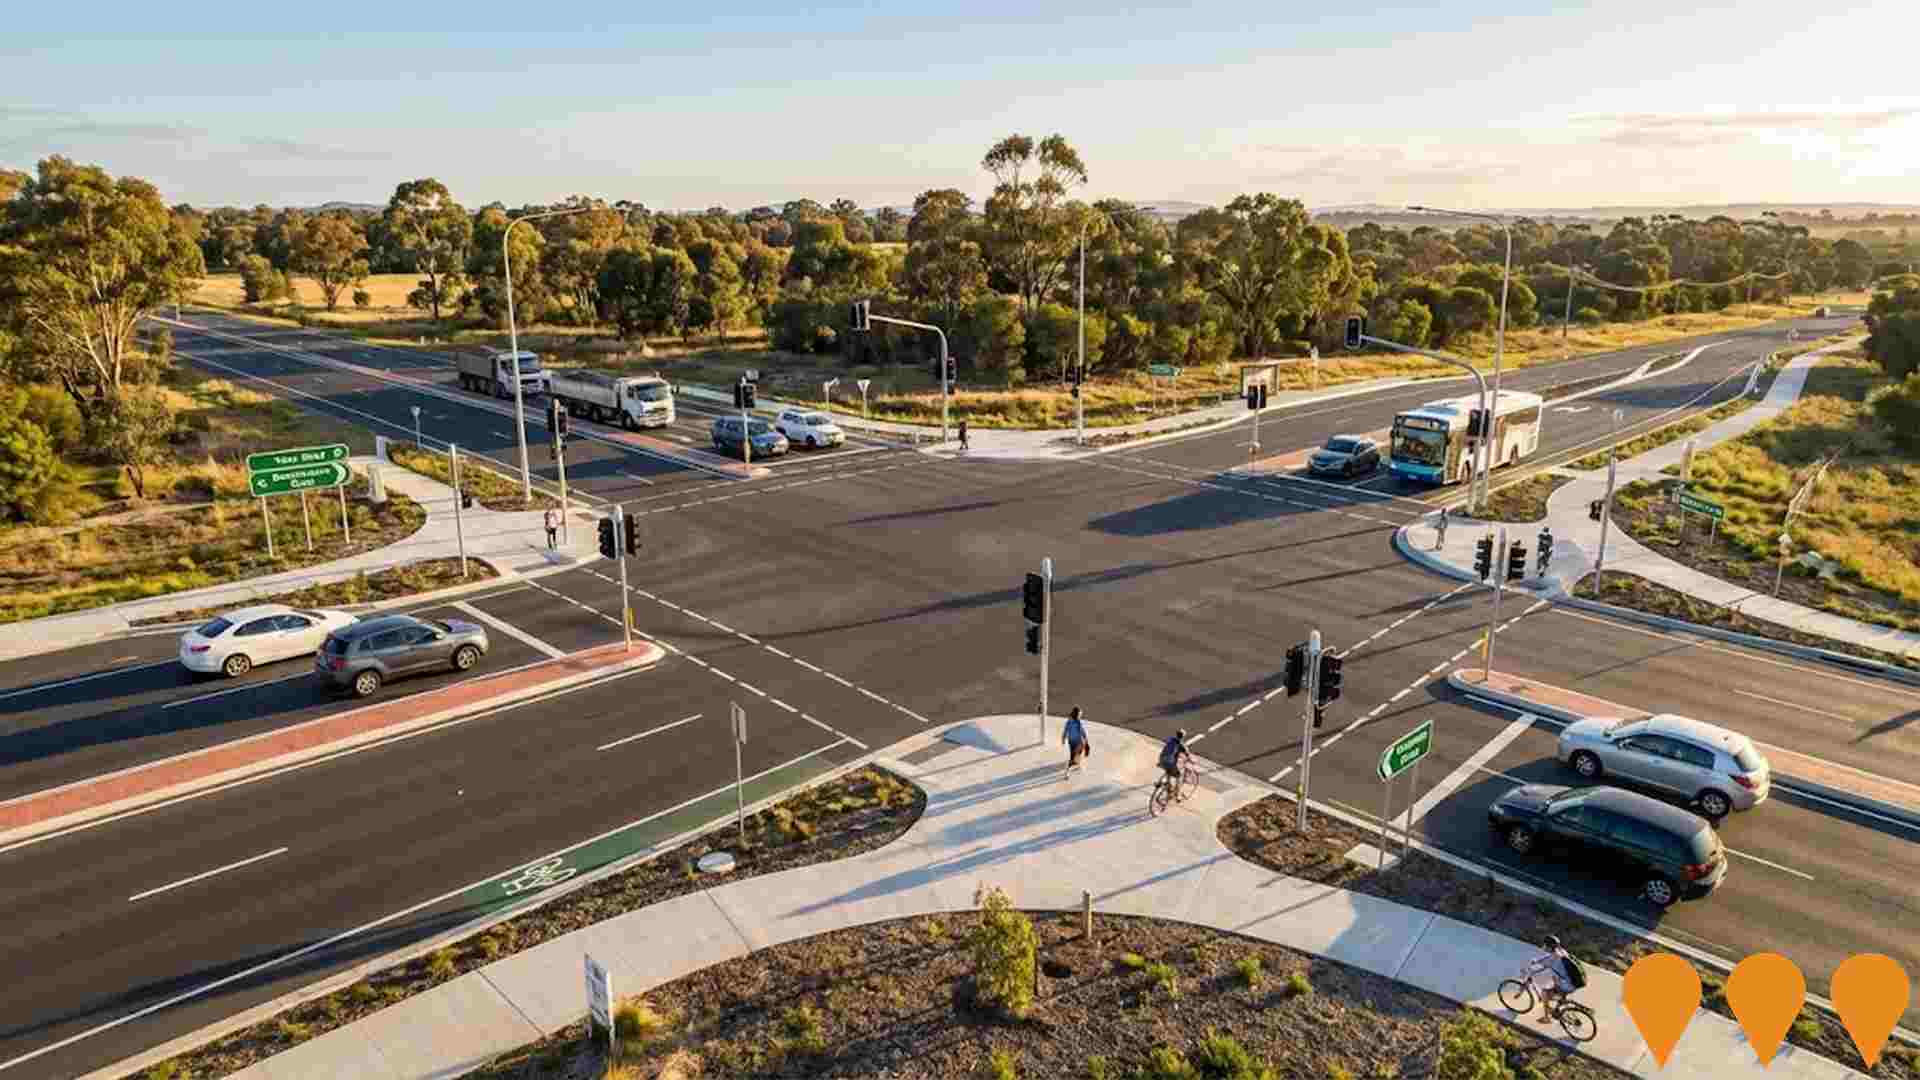
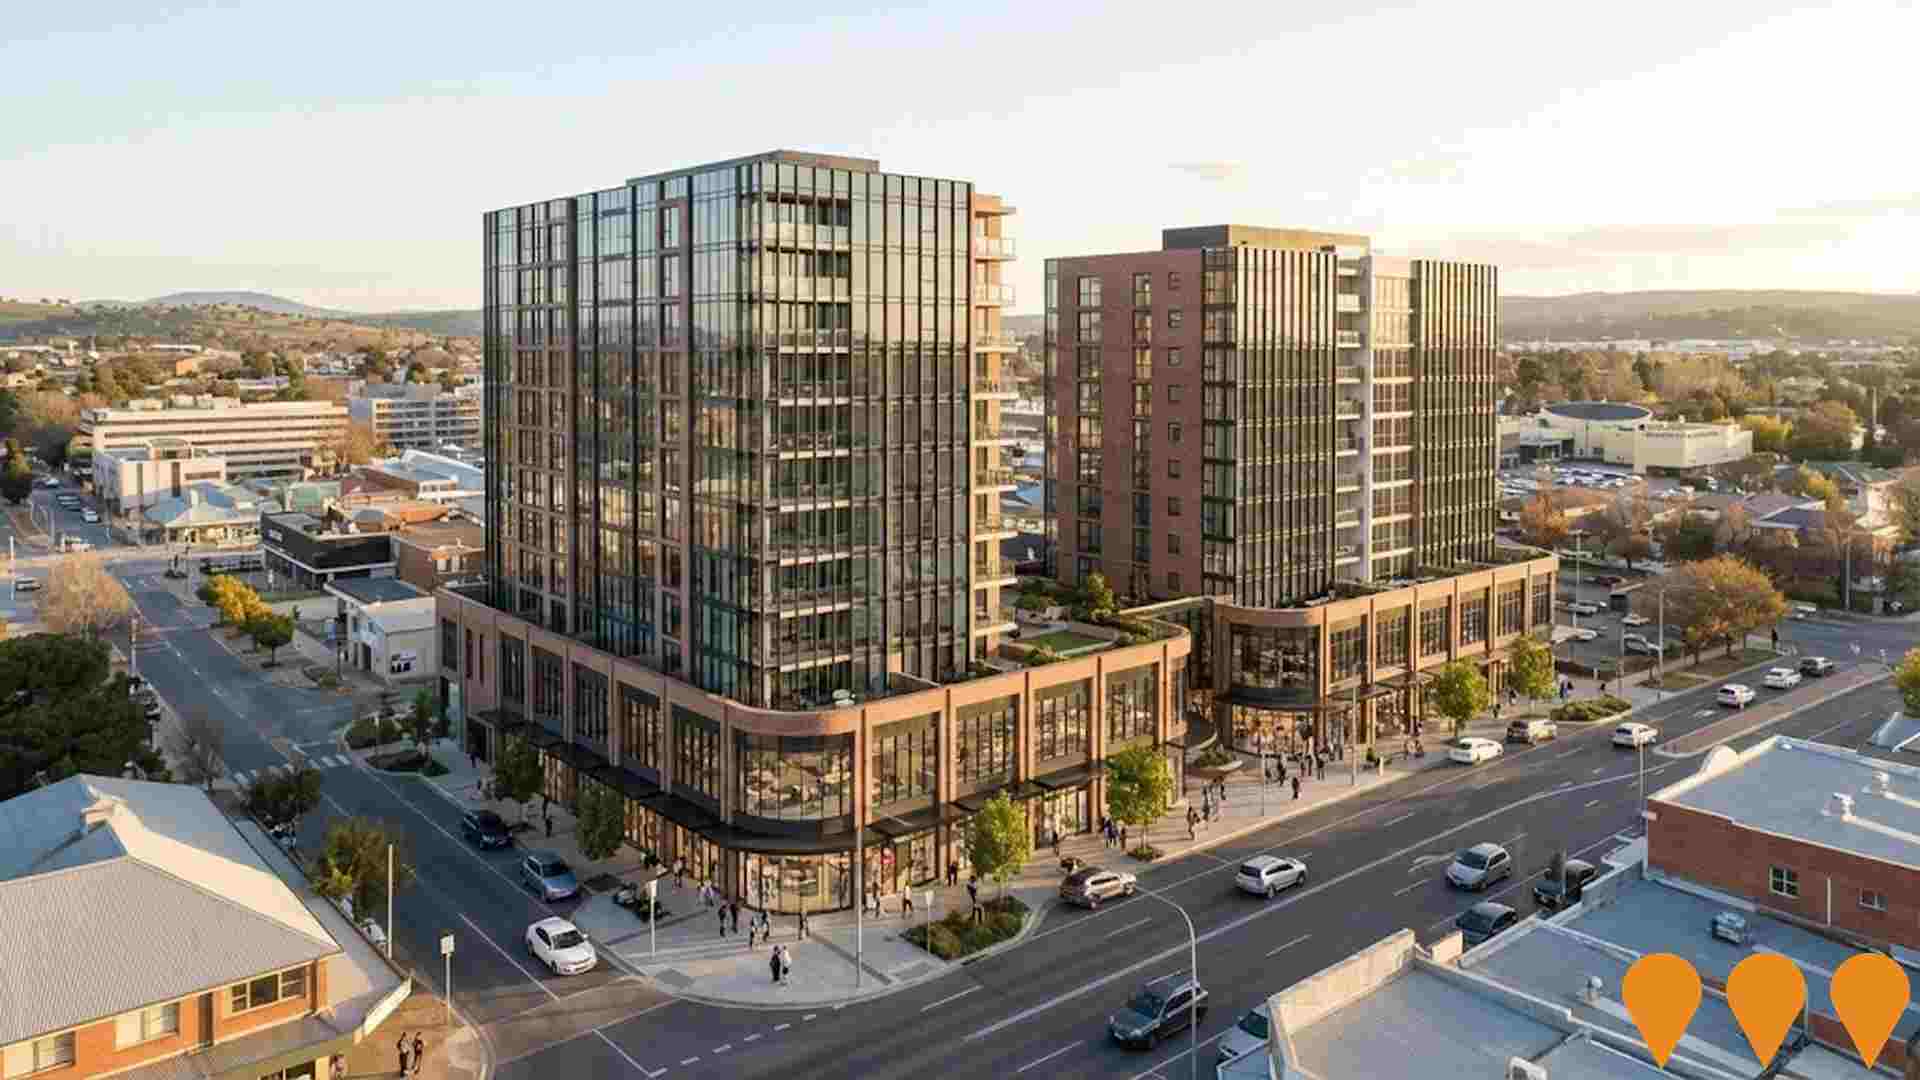
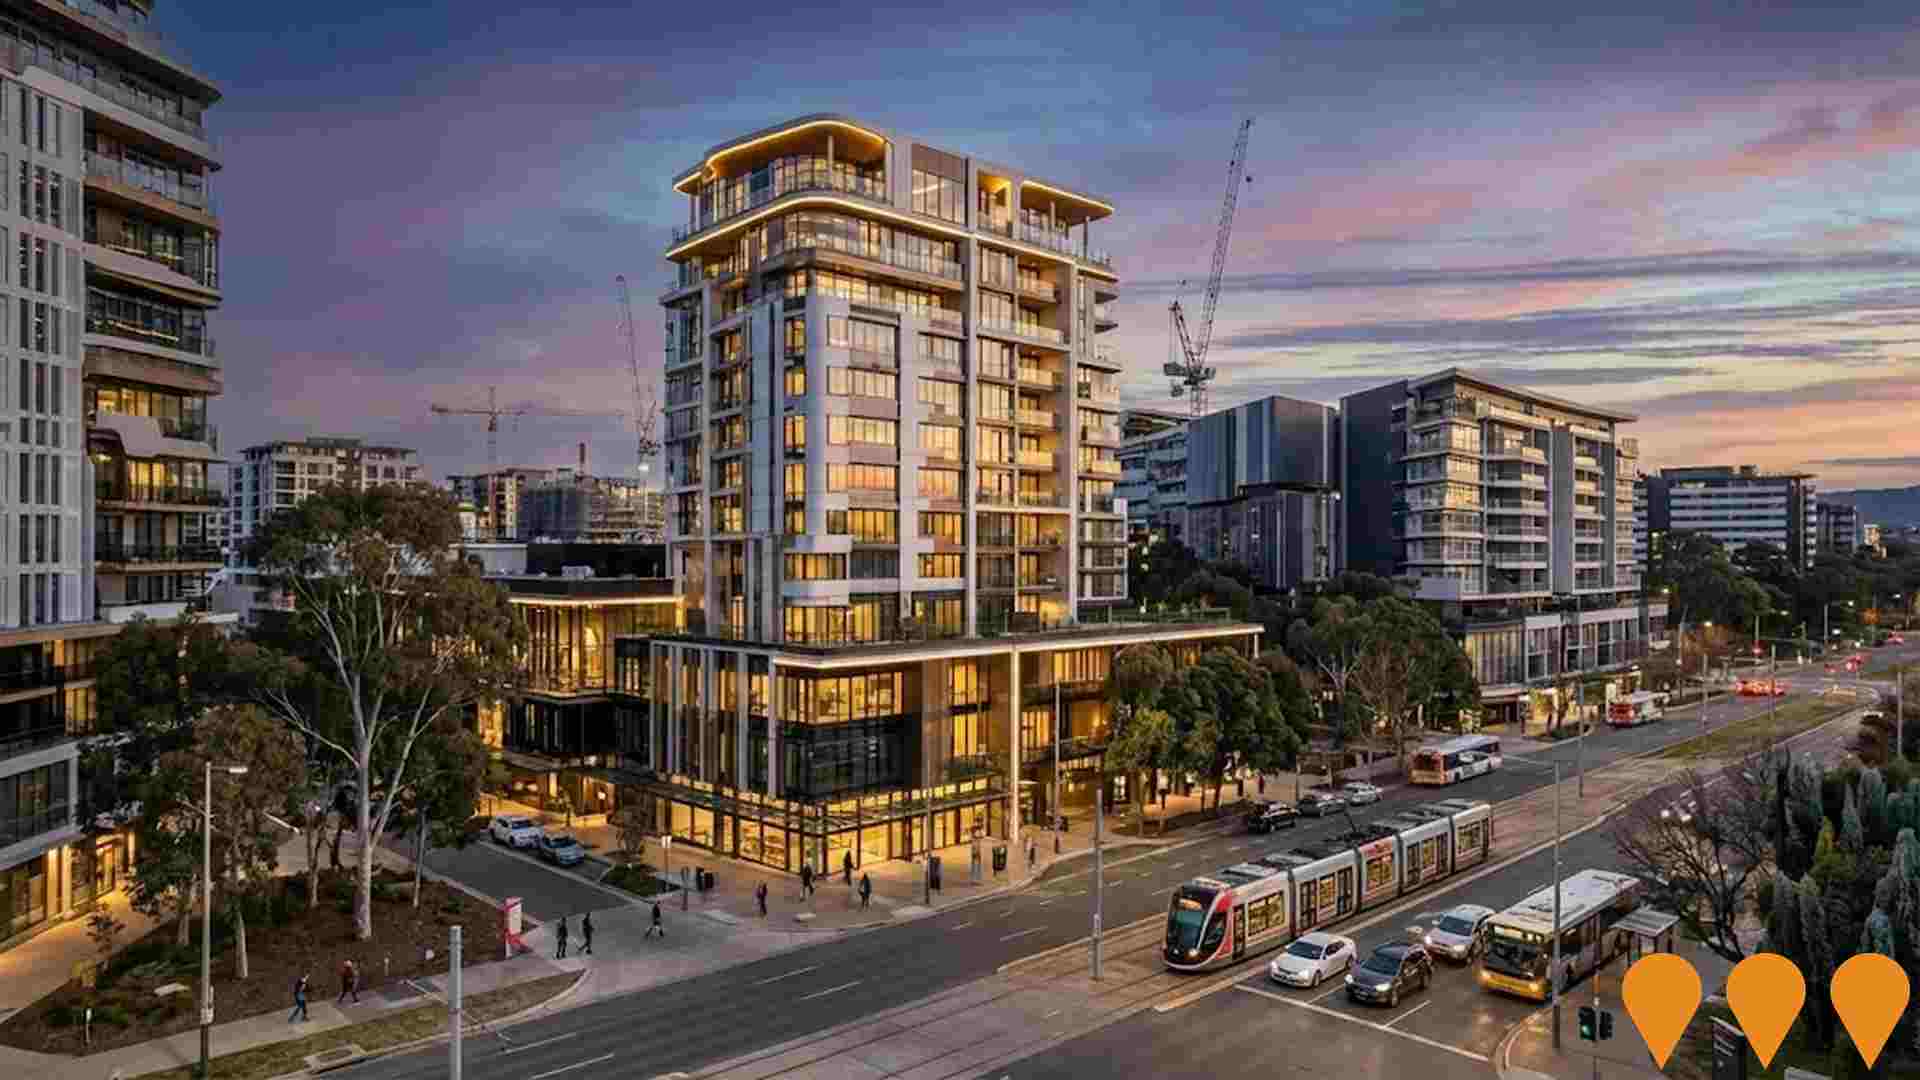
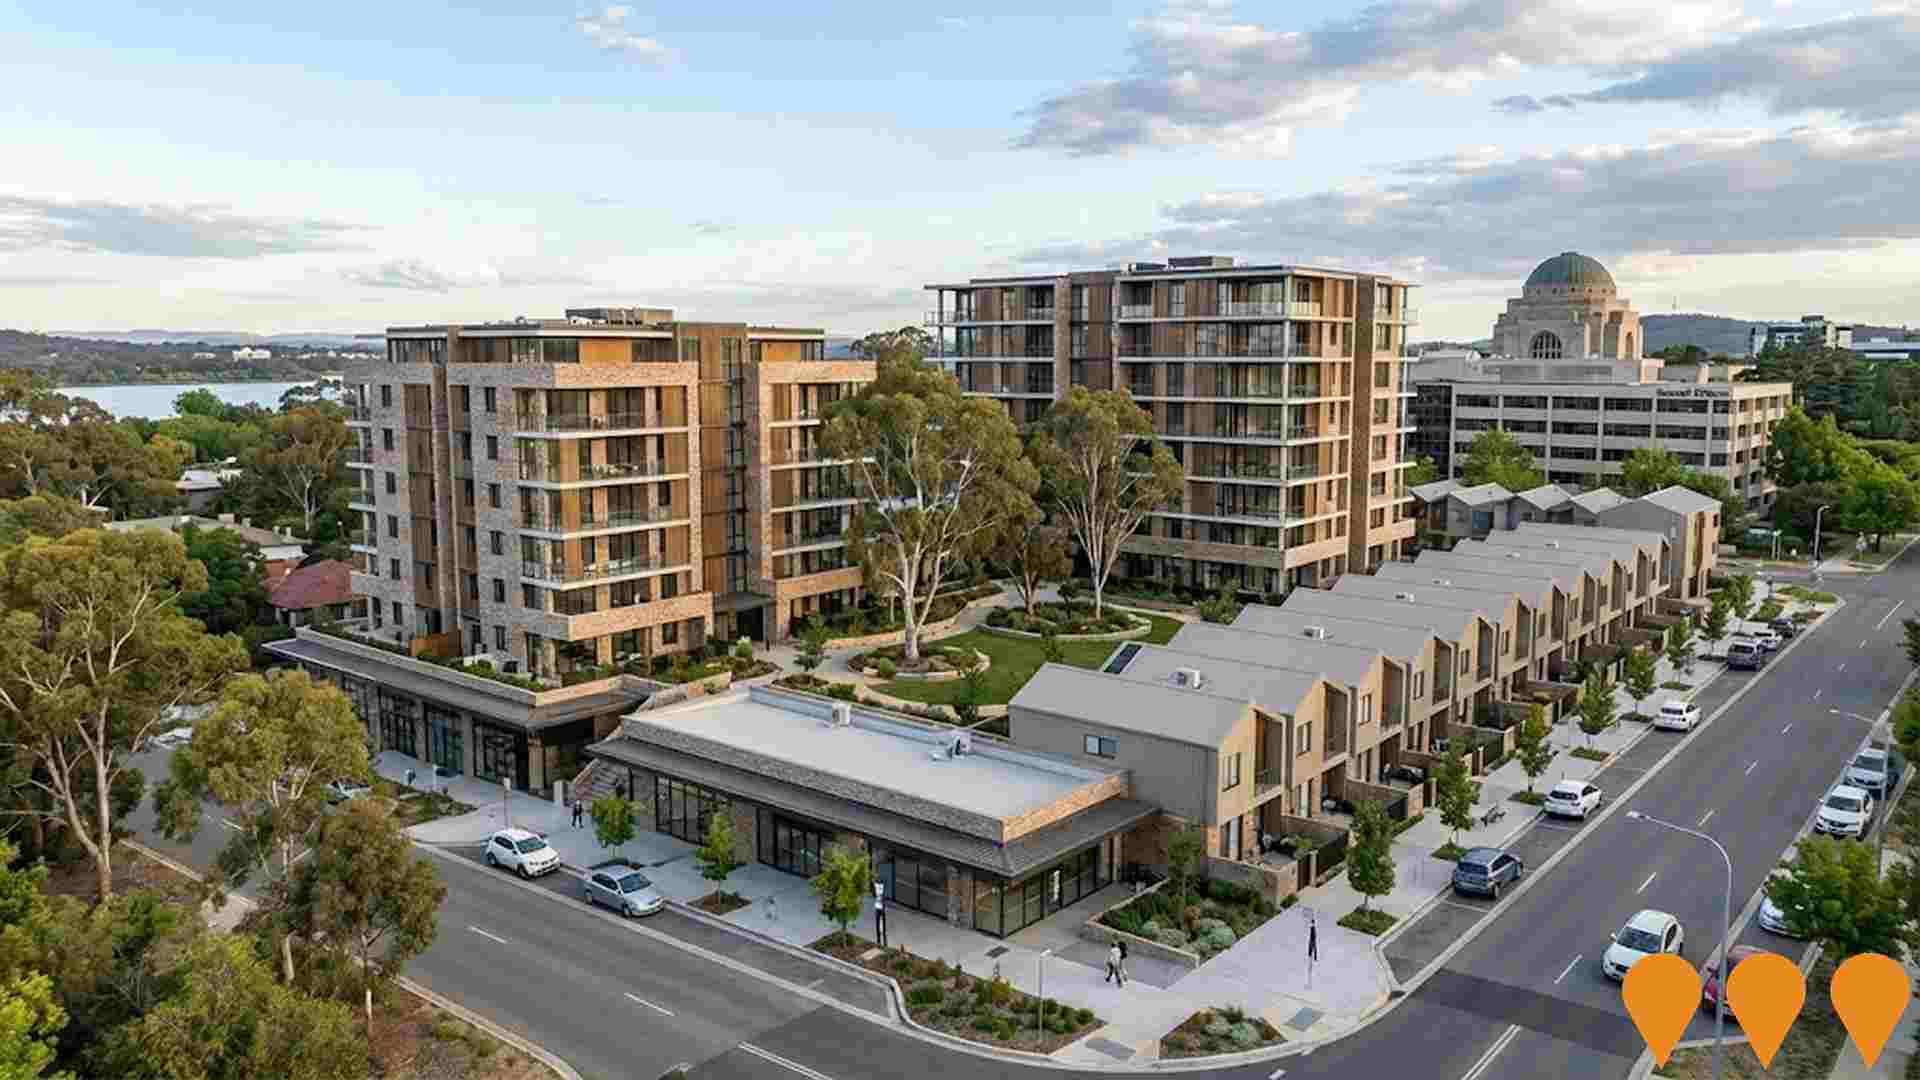
 Denotes AI-based impression for illustrative purposes only, not to be taken as definitive under any circumstances. Please follow links and conduct other investigations from the project's source for actual imagery. Developers and project owners wishing us to use original imagery please Contact Us and we will do so.
Frequently Asked Questions - Infrastructure
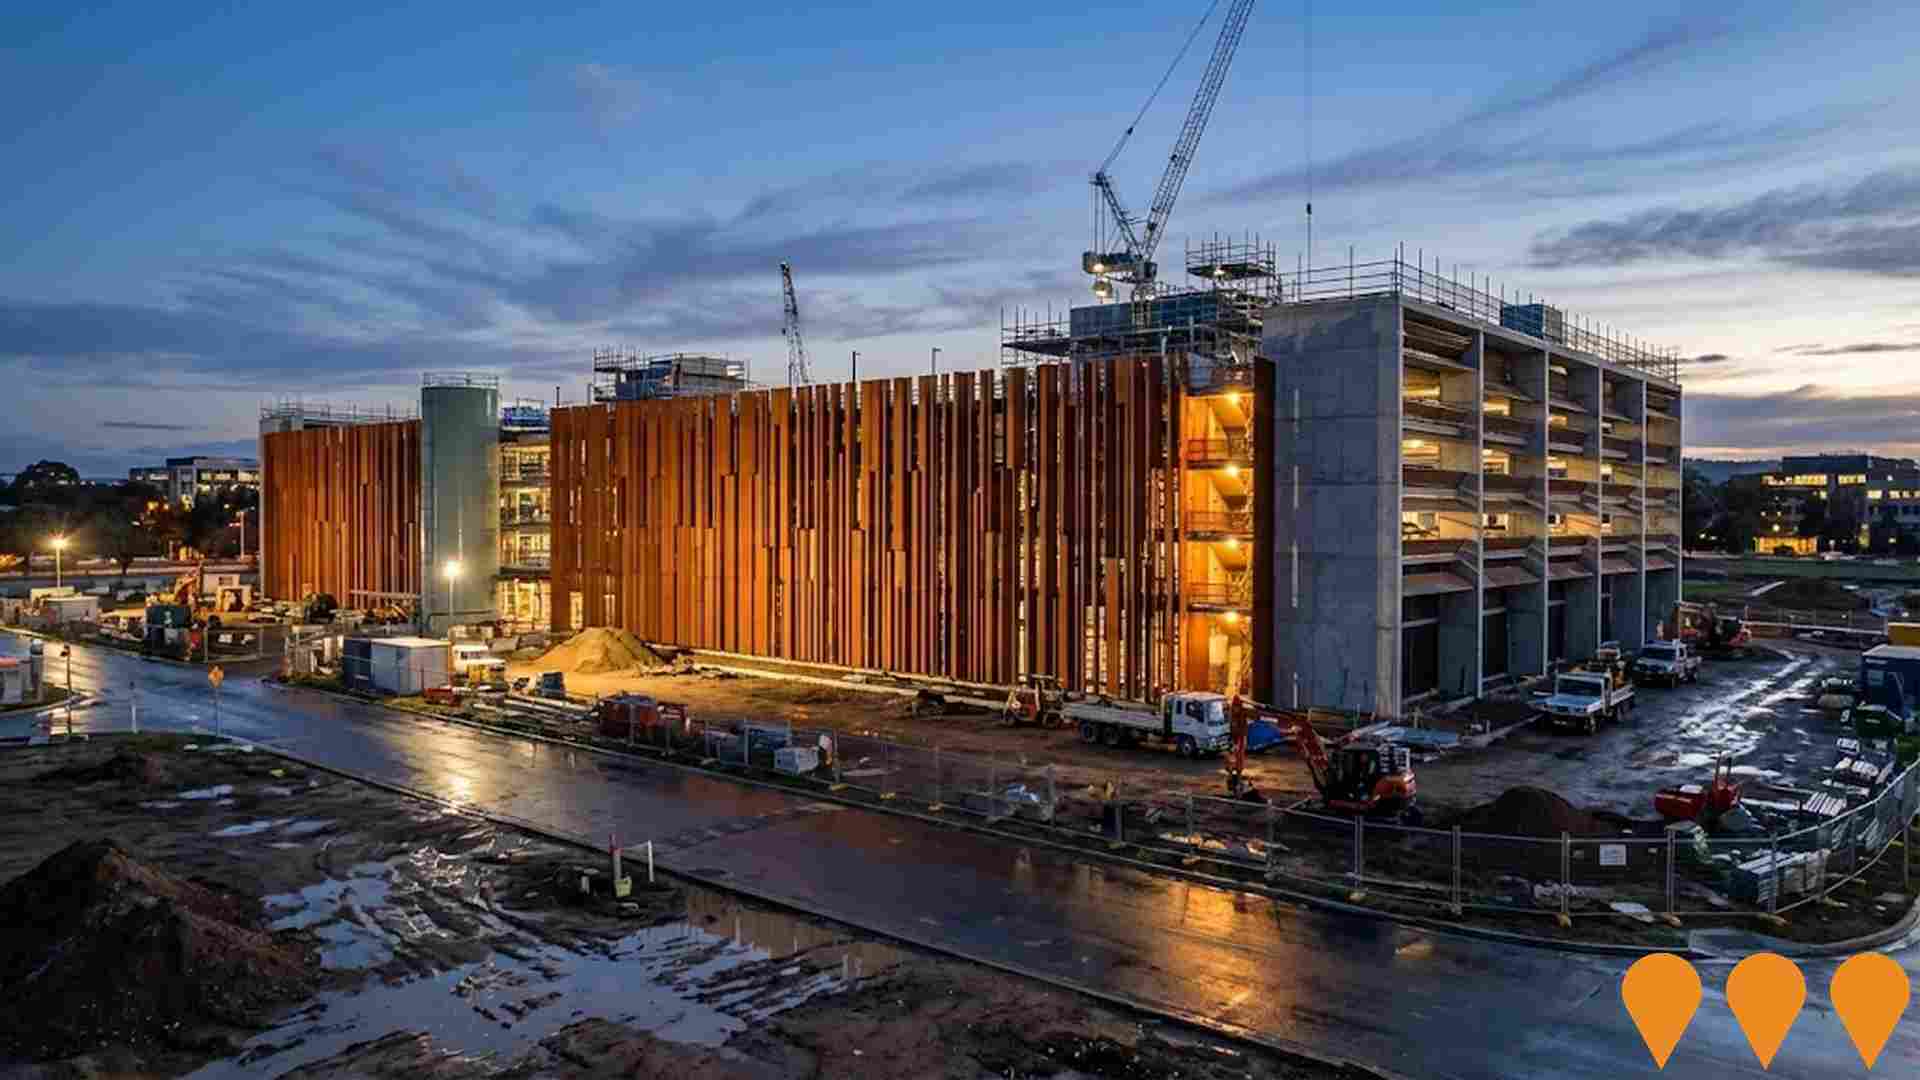
Canberra Defence Precinct Tranche 1: ADFA Living-in Accommodation
A billion-dollar redevelopment at the Australian Defence Force Academy (ADFA) to replace aging living-in accommodation facilities. The project delivers 1,500 contemporary rooms for Trainee Officers, offices for supervisory staff, and a multi-level car park with electric vehicle charging infrastructure.

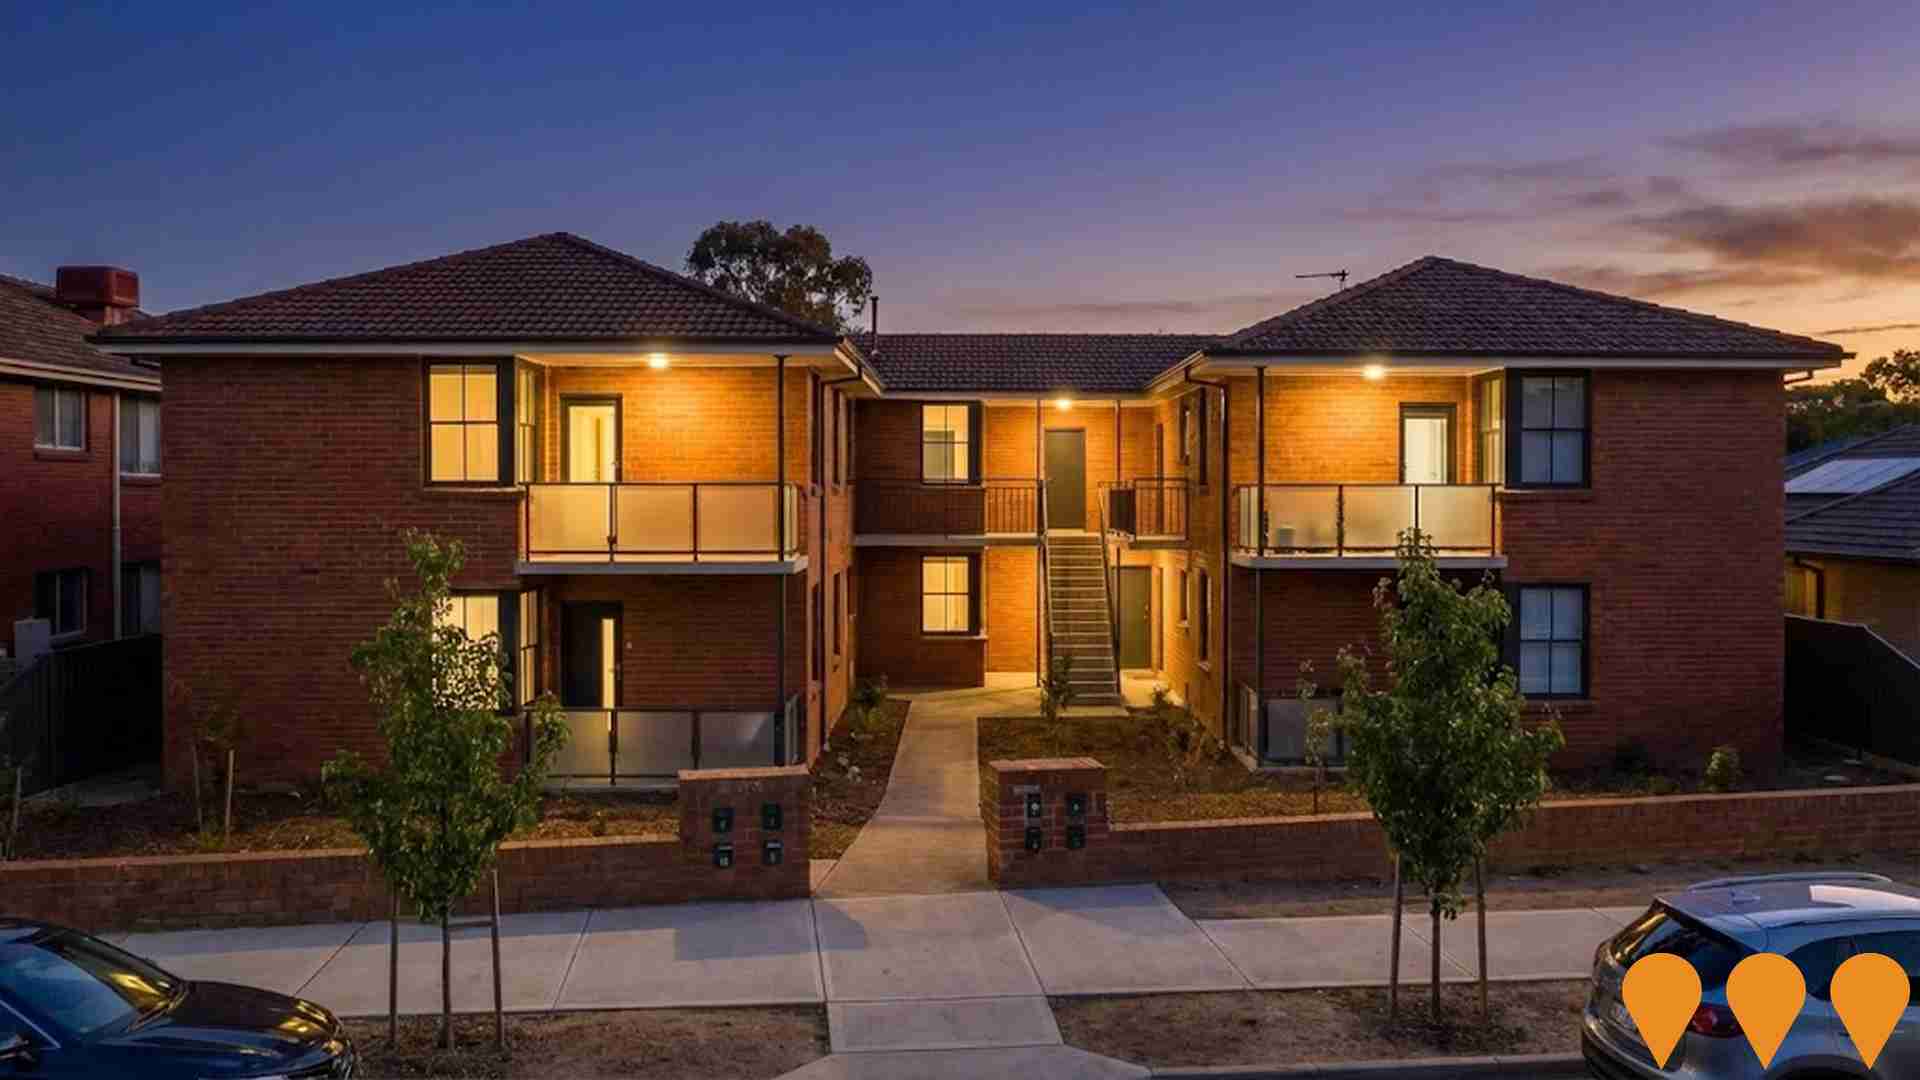
52 Derrima Road Townhouses
New townhouse development in Queanbeyan. Part of urban infill and densification strategy for the region.

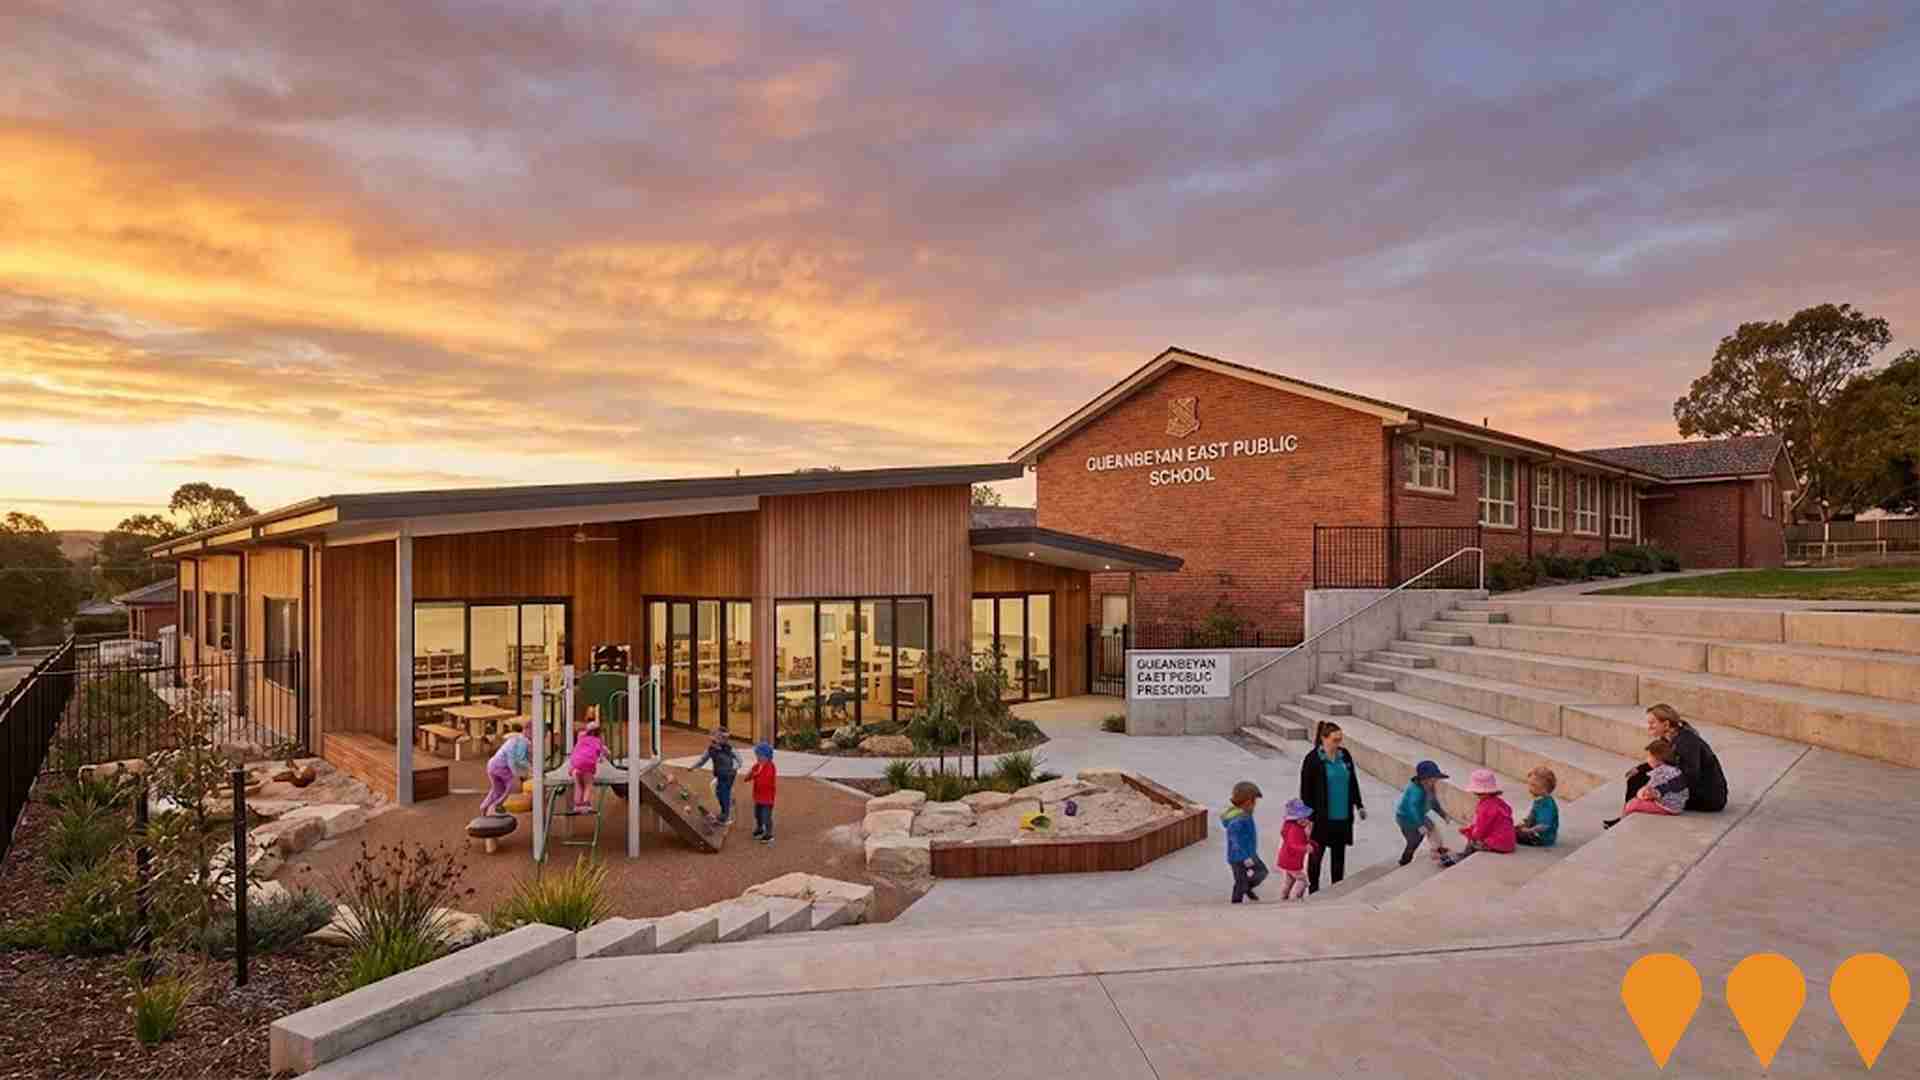
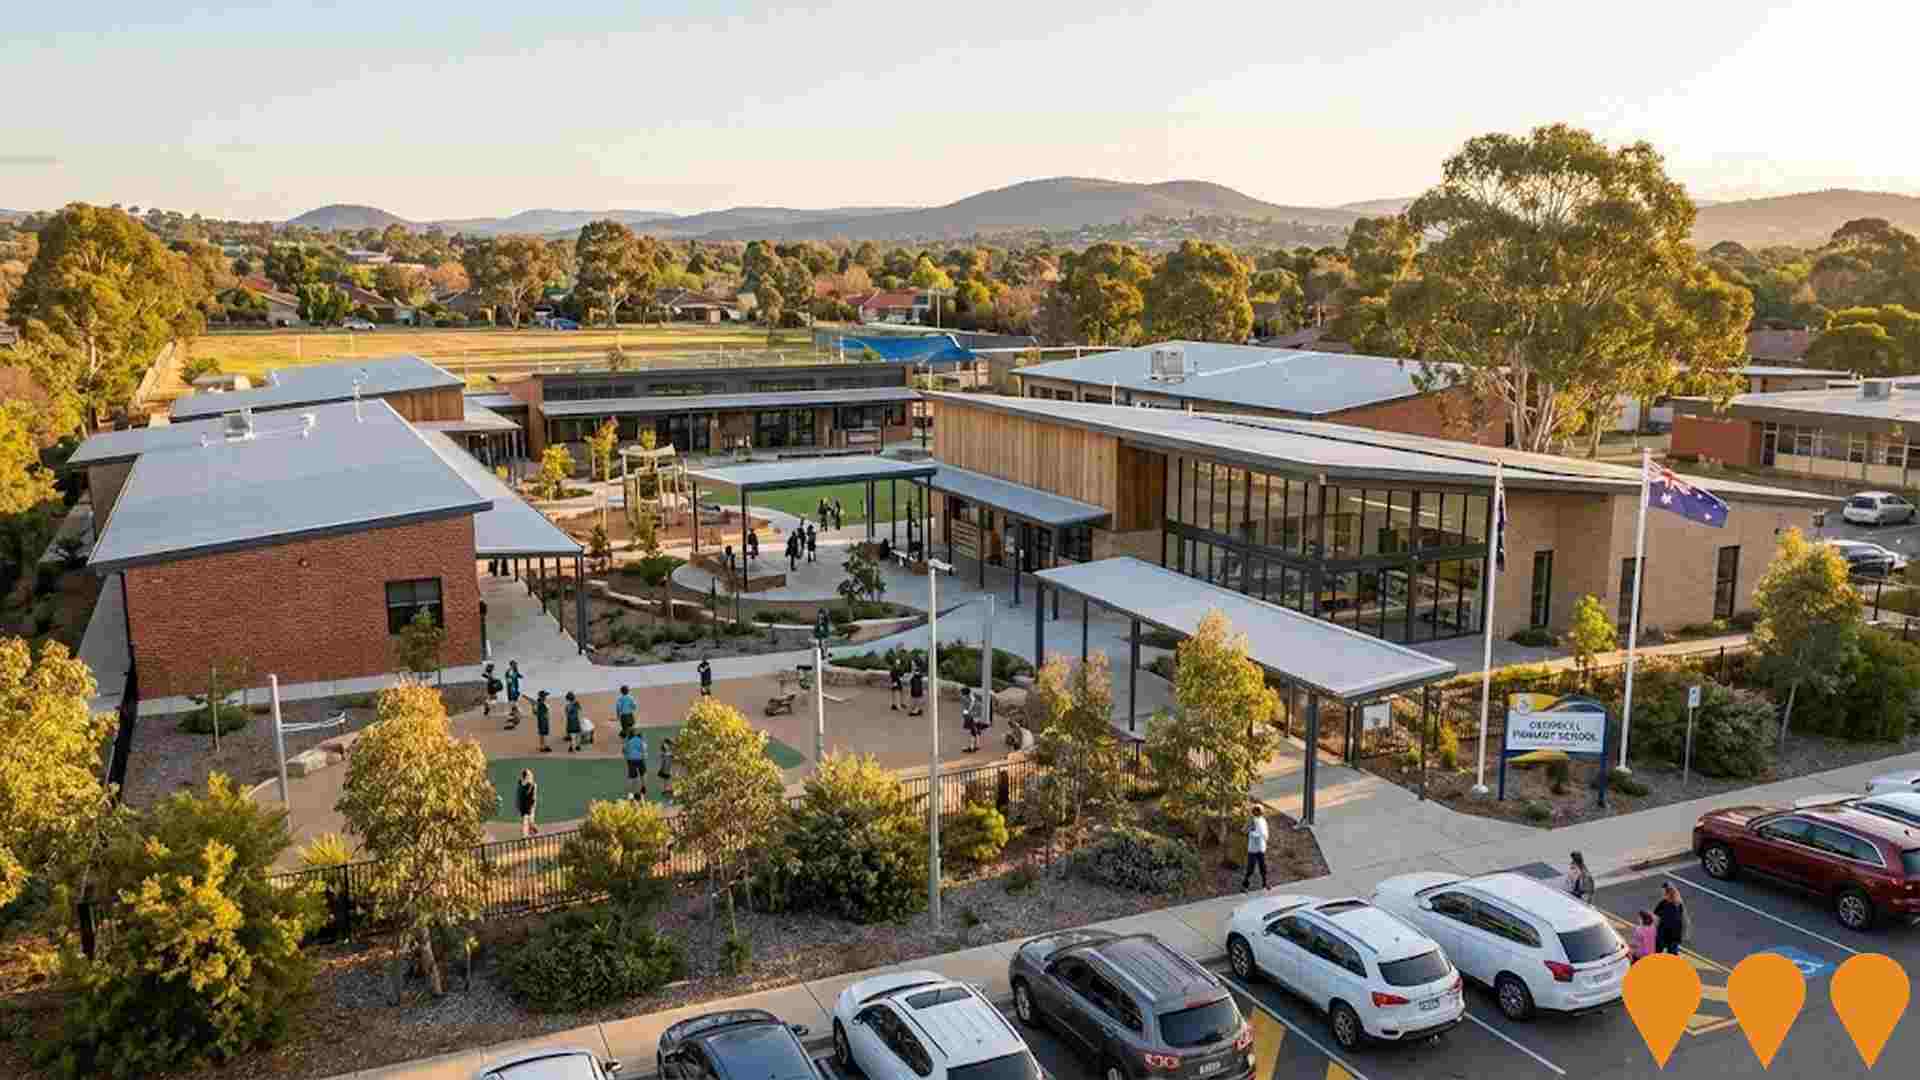
Queanbeyan East Public Preschool
A new public preschool is under construction at Queanbeyan East Public School as part of the NSW Government's 769 million dollar plan to deliver 100 new public preschools across the state. Retaining wall and earthworks are complete, internal fit-out of the building and play space construction are underway, and landscaping works are progressing. The preschool will feature two preschool rooms, an outdoor play area, and an administration and amenities area, accommodating up to 40 children per day.Designed by Pedavoli Architects and built by Zauner Construction Pty Limited, the preschool is anticipated to open in Term 3 2026, pending planning and regulatory approvals. Expressions of interest for enrolment are now open through the school office.
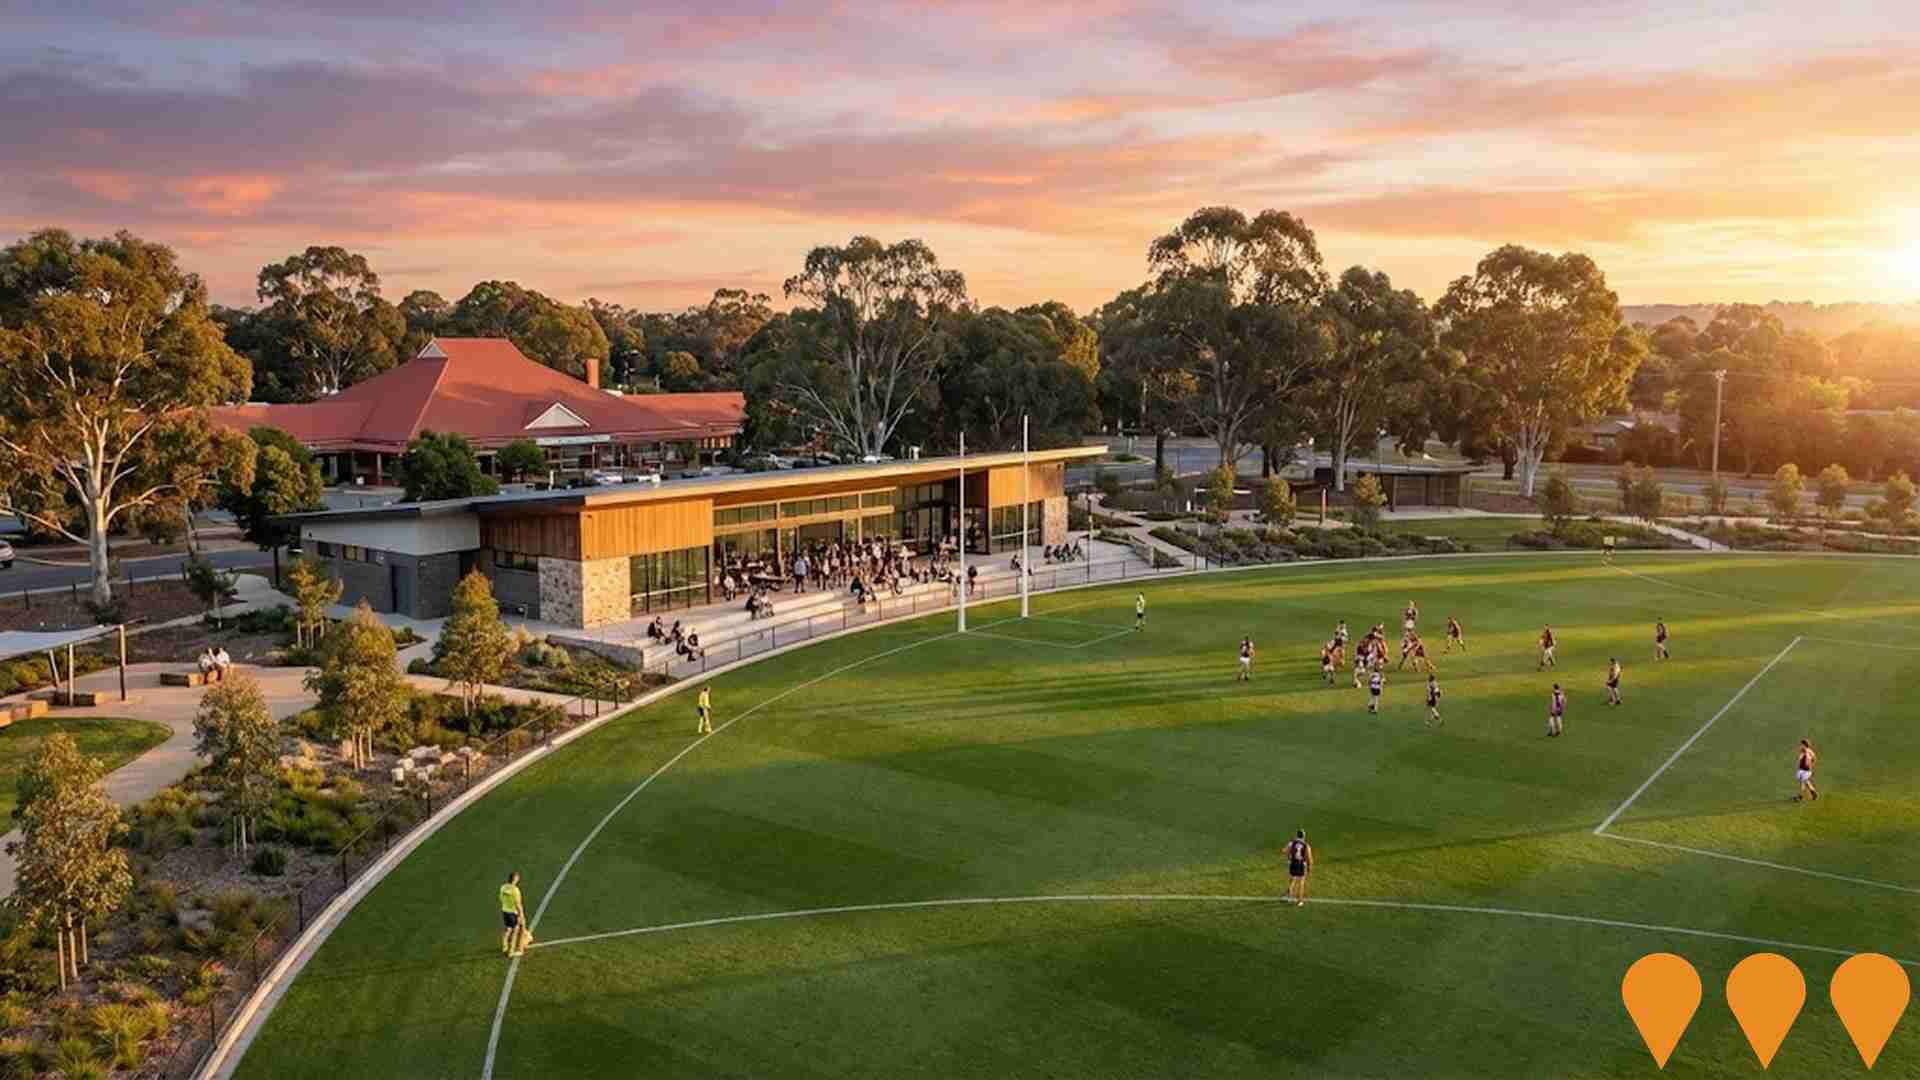
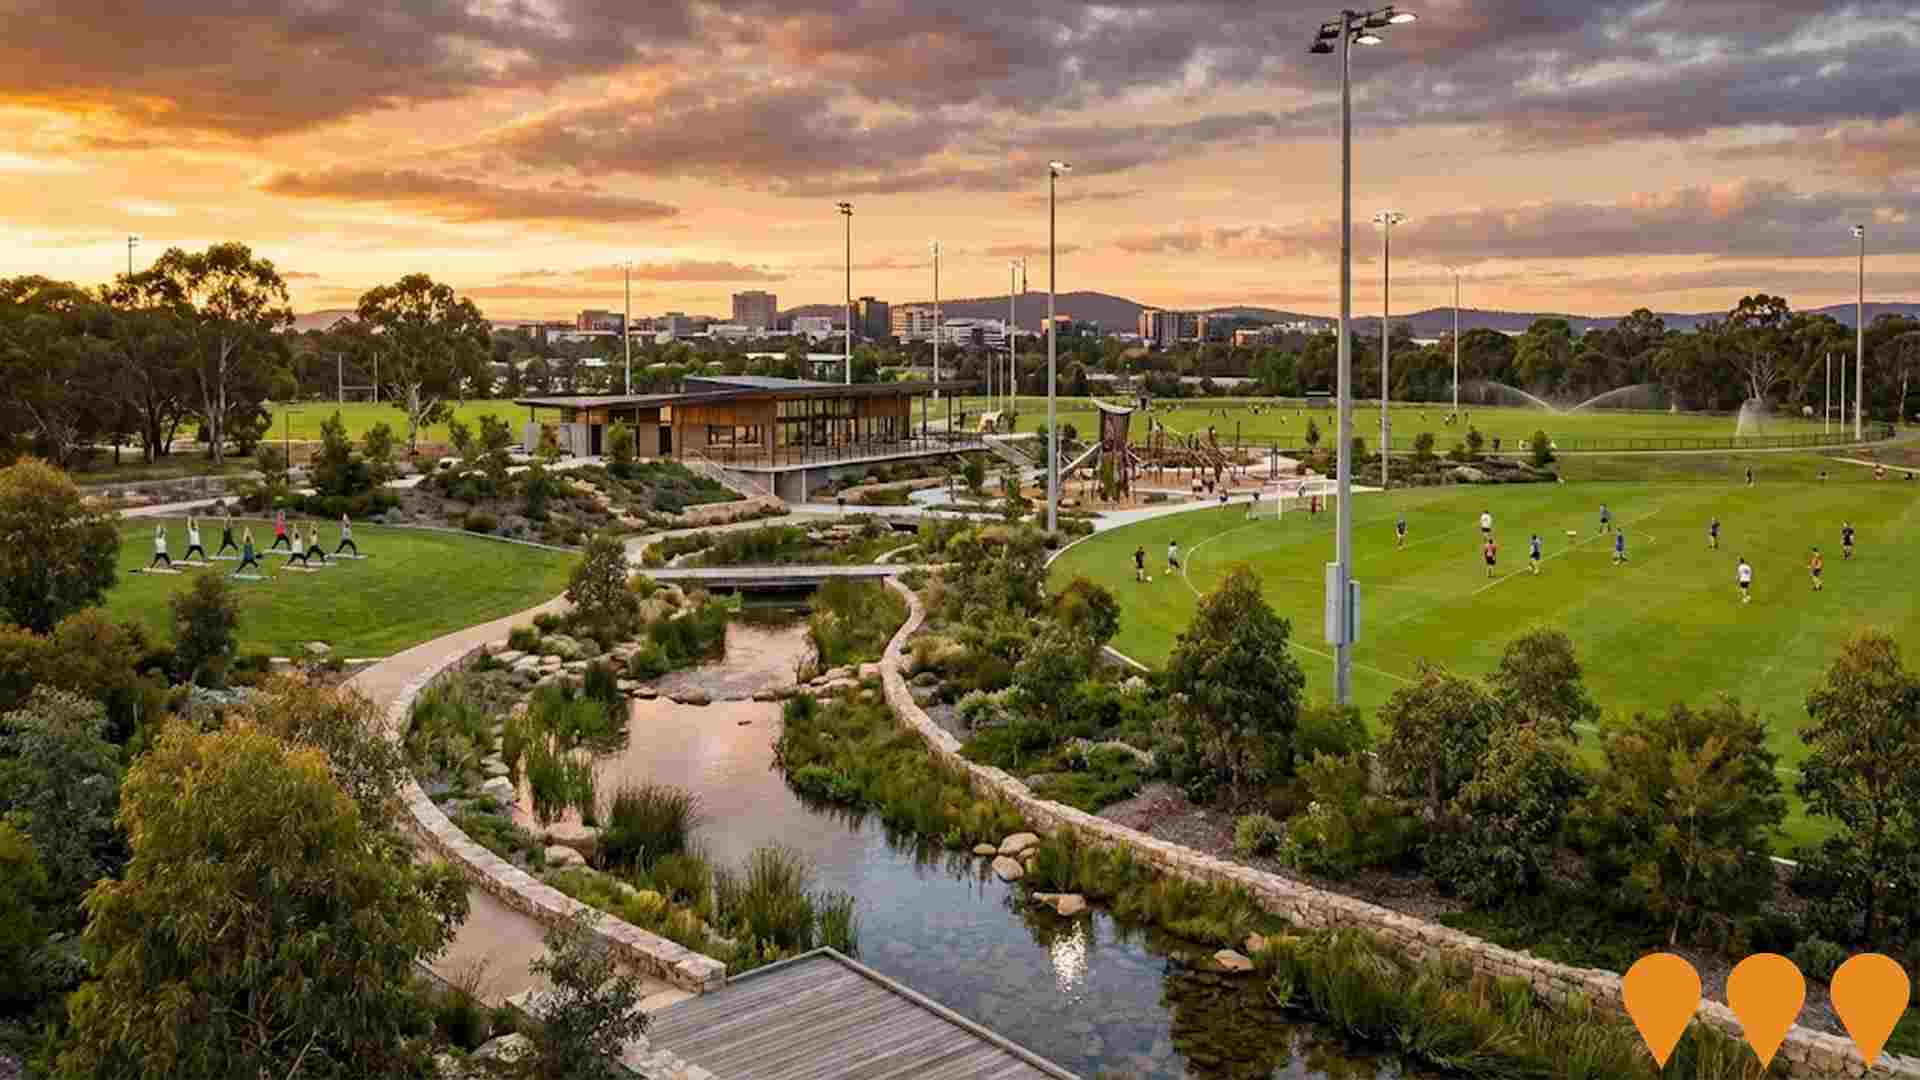
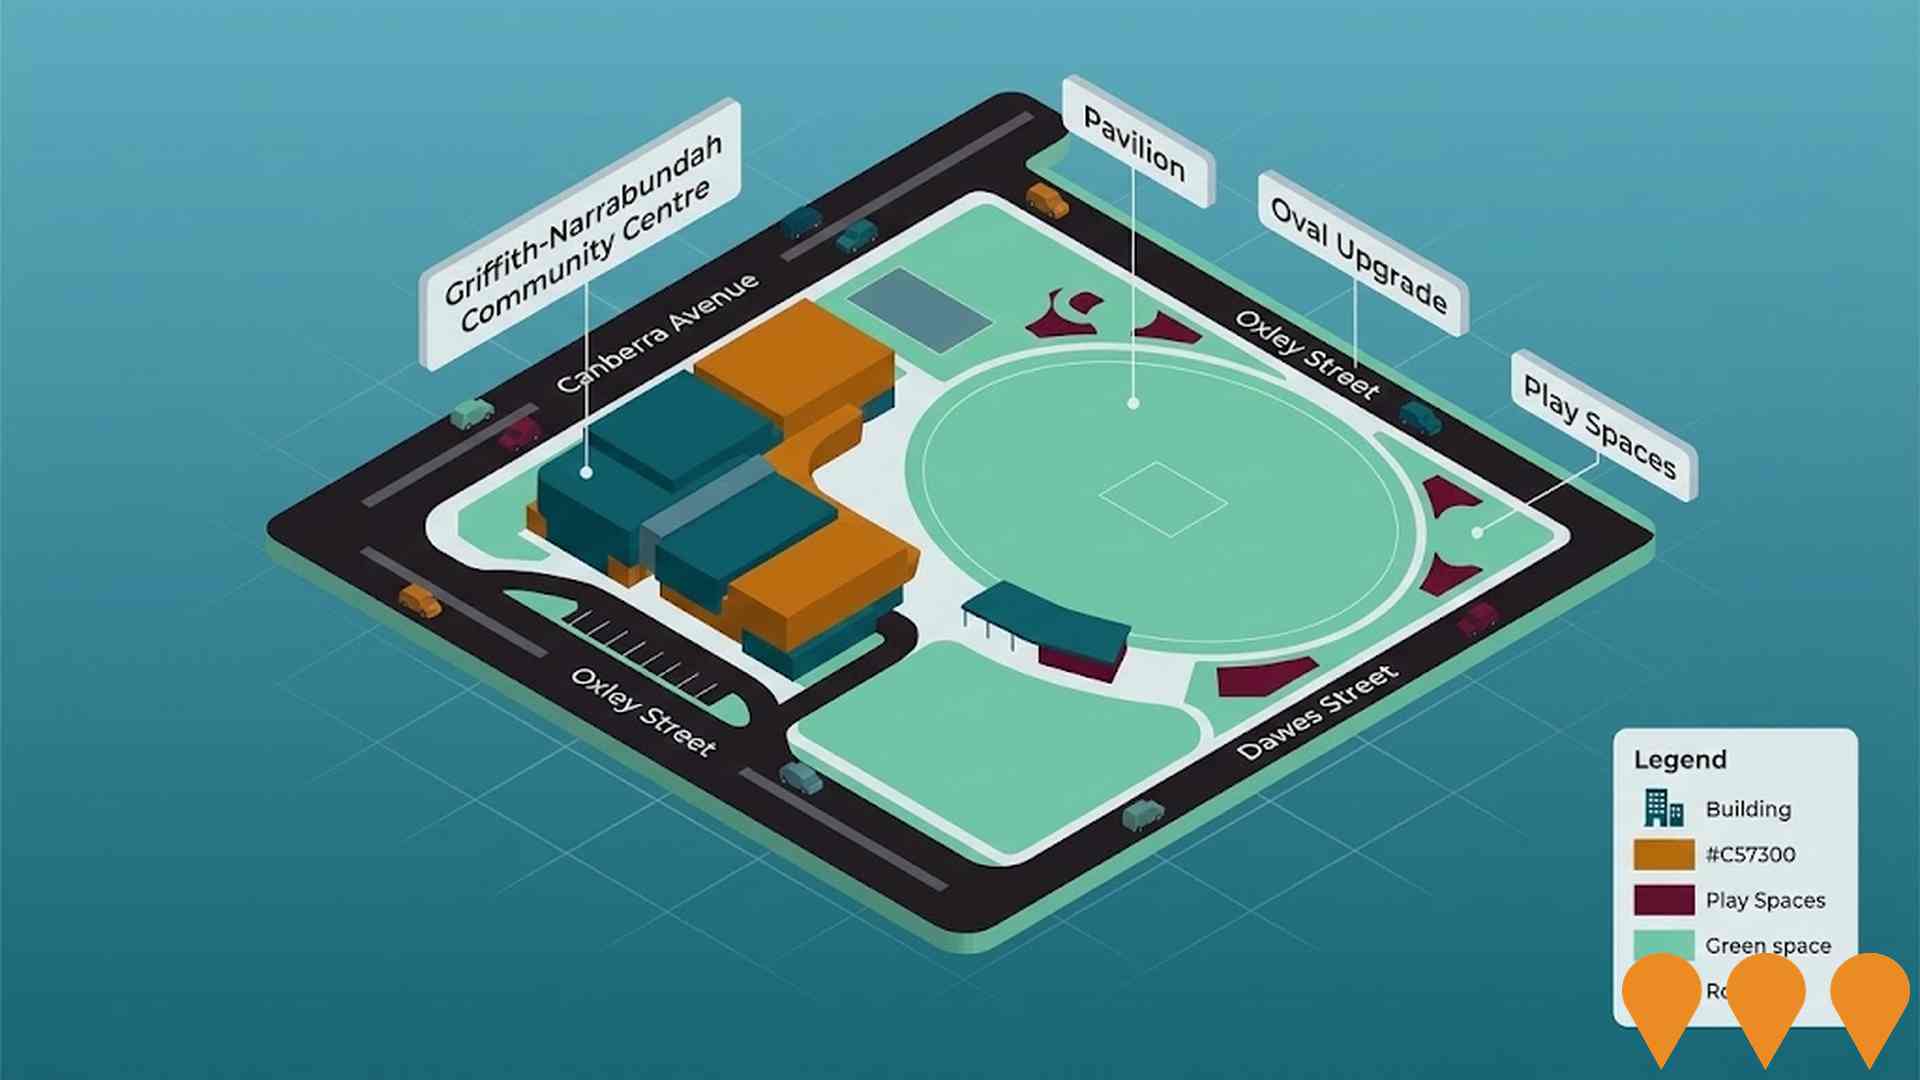
Campbell Neighbourhood Oval Upgrade
This project involves major improvements to the Campbell Neighbourhood Oval, including upgraded irrigation and drainage systems, turf resurfacing, and the addition of community-focused sports facilities. The works are designed to enhance the playing surface for local sports clubs and ensure the oval remains a high-quality recreational asset for the Central Canberra region.
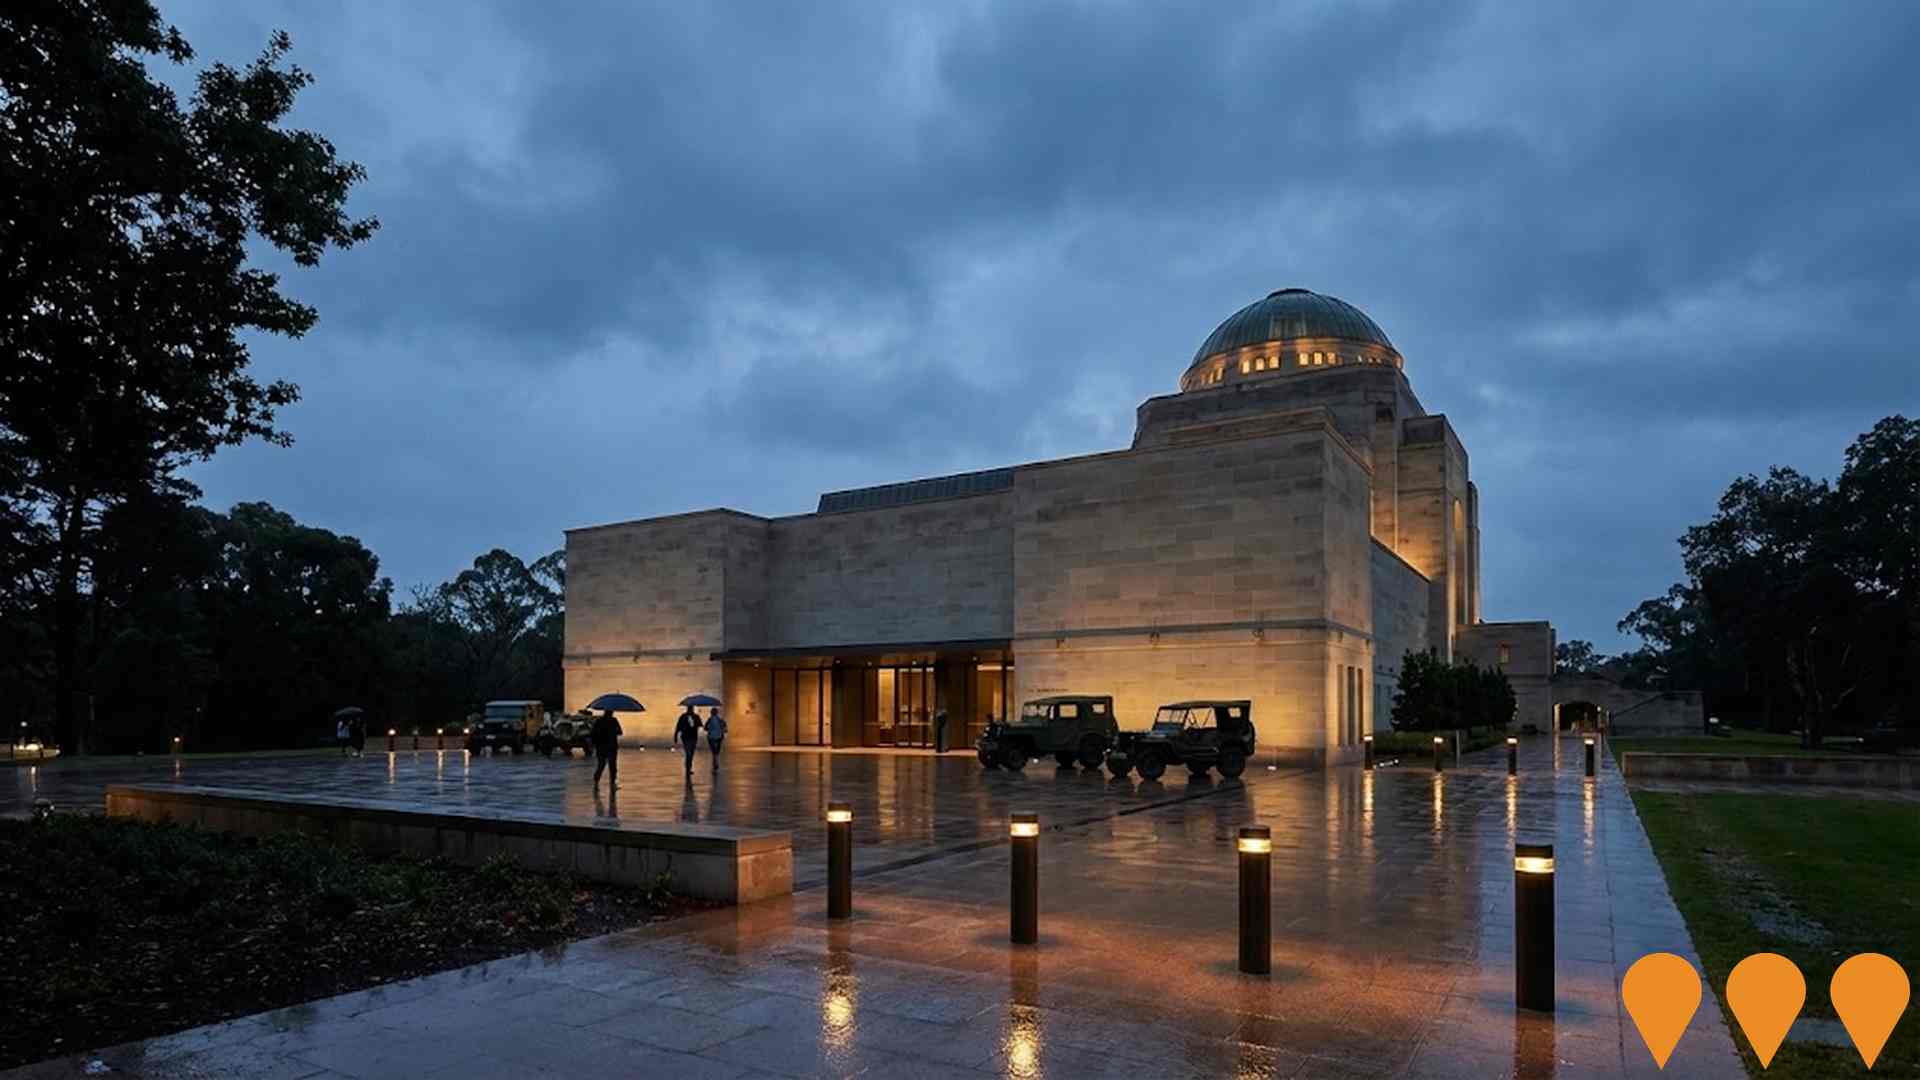
Australian War Memorial Redevelopment
A $500 million expansion of the Australian War Memorial to tell more modern stories of Australian service and sacrifice. The project increases exhibition space by 83 percent, adding approximately 10,000 square meters. Key components include a new Southern Entrance, the expansion of the Bean Building, and a new Anzac Hall linked to the main building by a glazed atrium.
50 Morisset Street Apartments
Proposed 9-storey shop-top housing on a 5,800sqm CBD site fronting the Queanbeyan River. The scheme includes ground-floor retail and about 160 dwellings above. The site is controlled by Elanor Investors Group via its Riverside Mixed-Use Development Fund in joint venture with Lockbridge. The development application has been referred to the Southern Regional Planning Panel for assessment.

202 Crawford Street Apartments
New apartment development in central Queanbeyan CBD area. Part of urban densification initiatives.
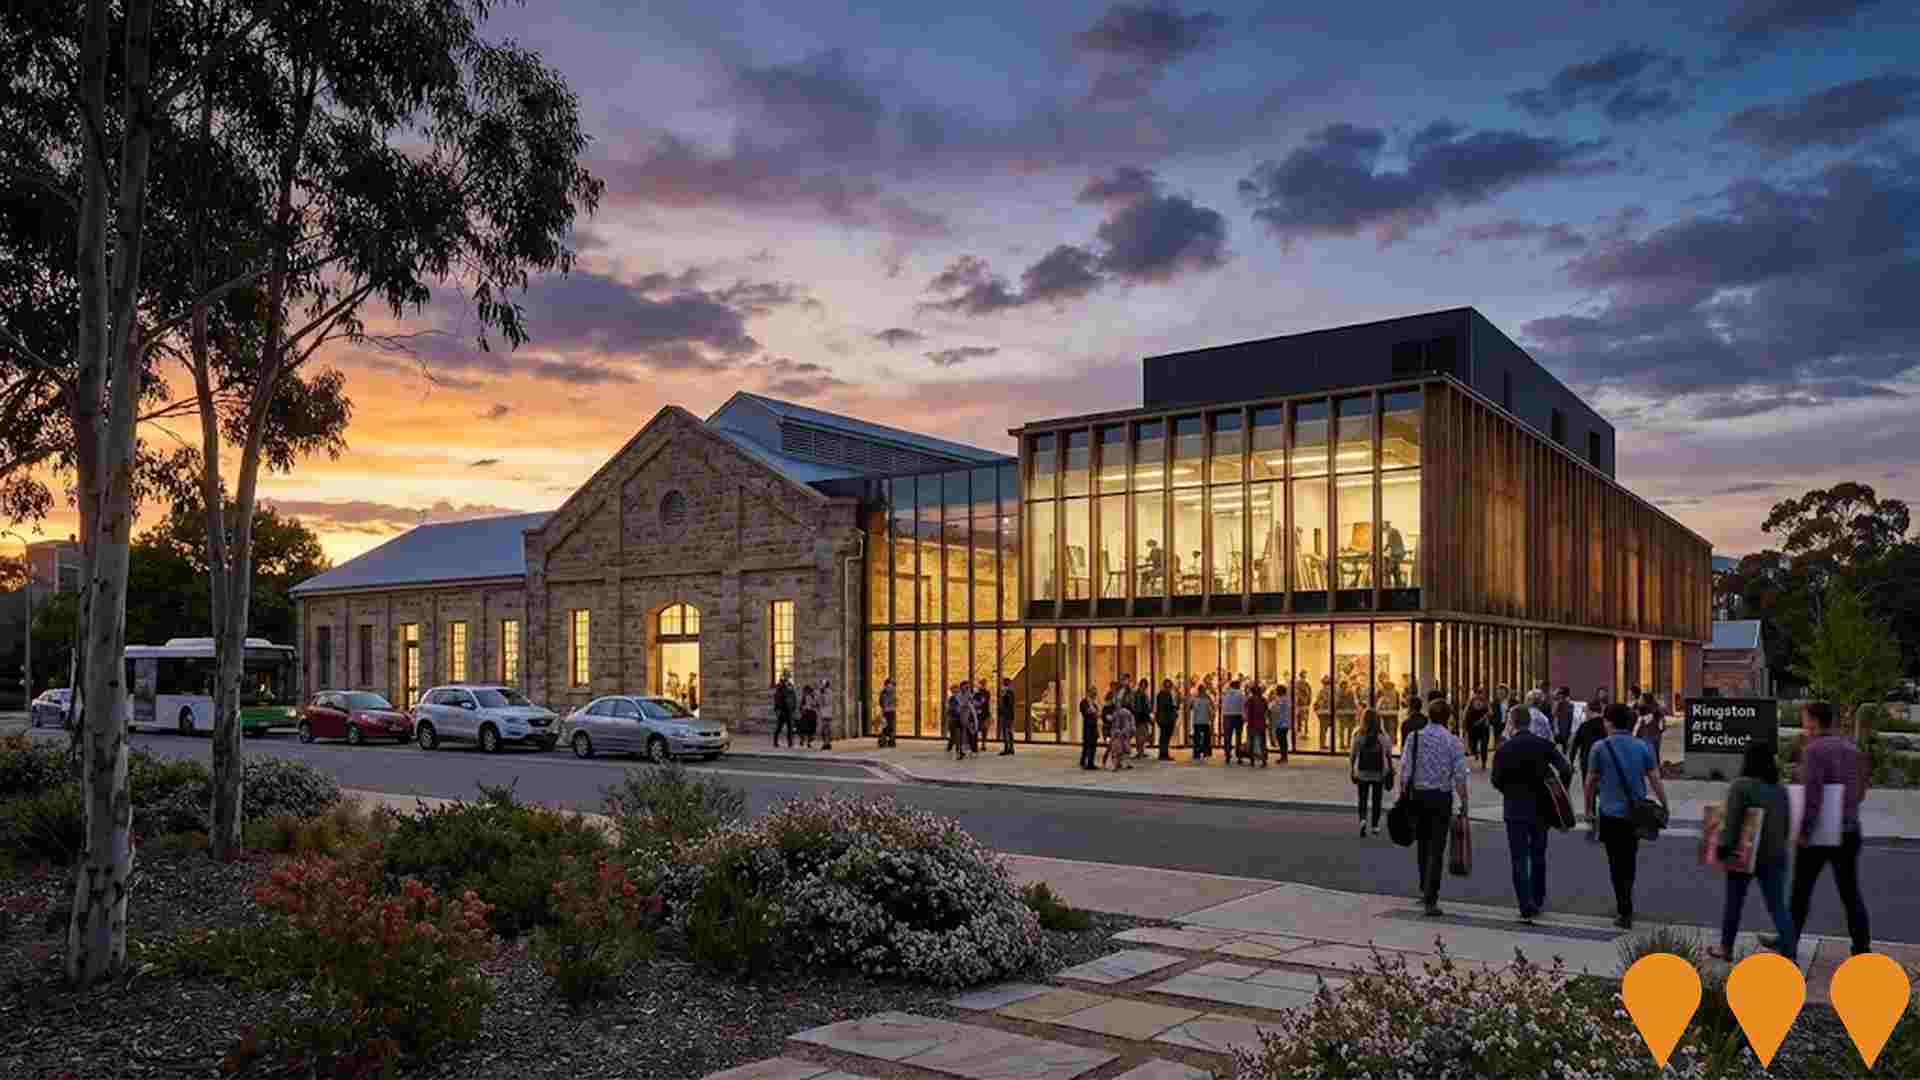
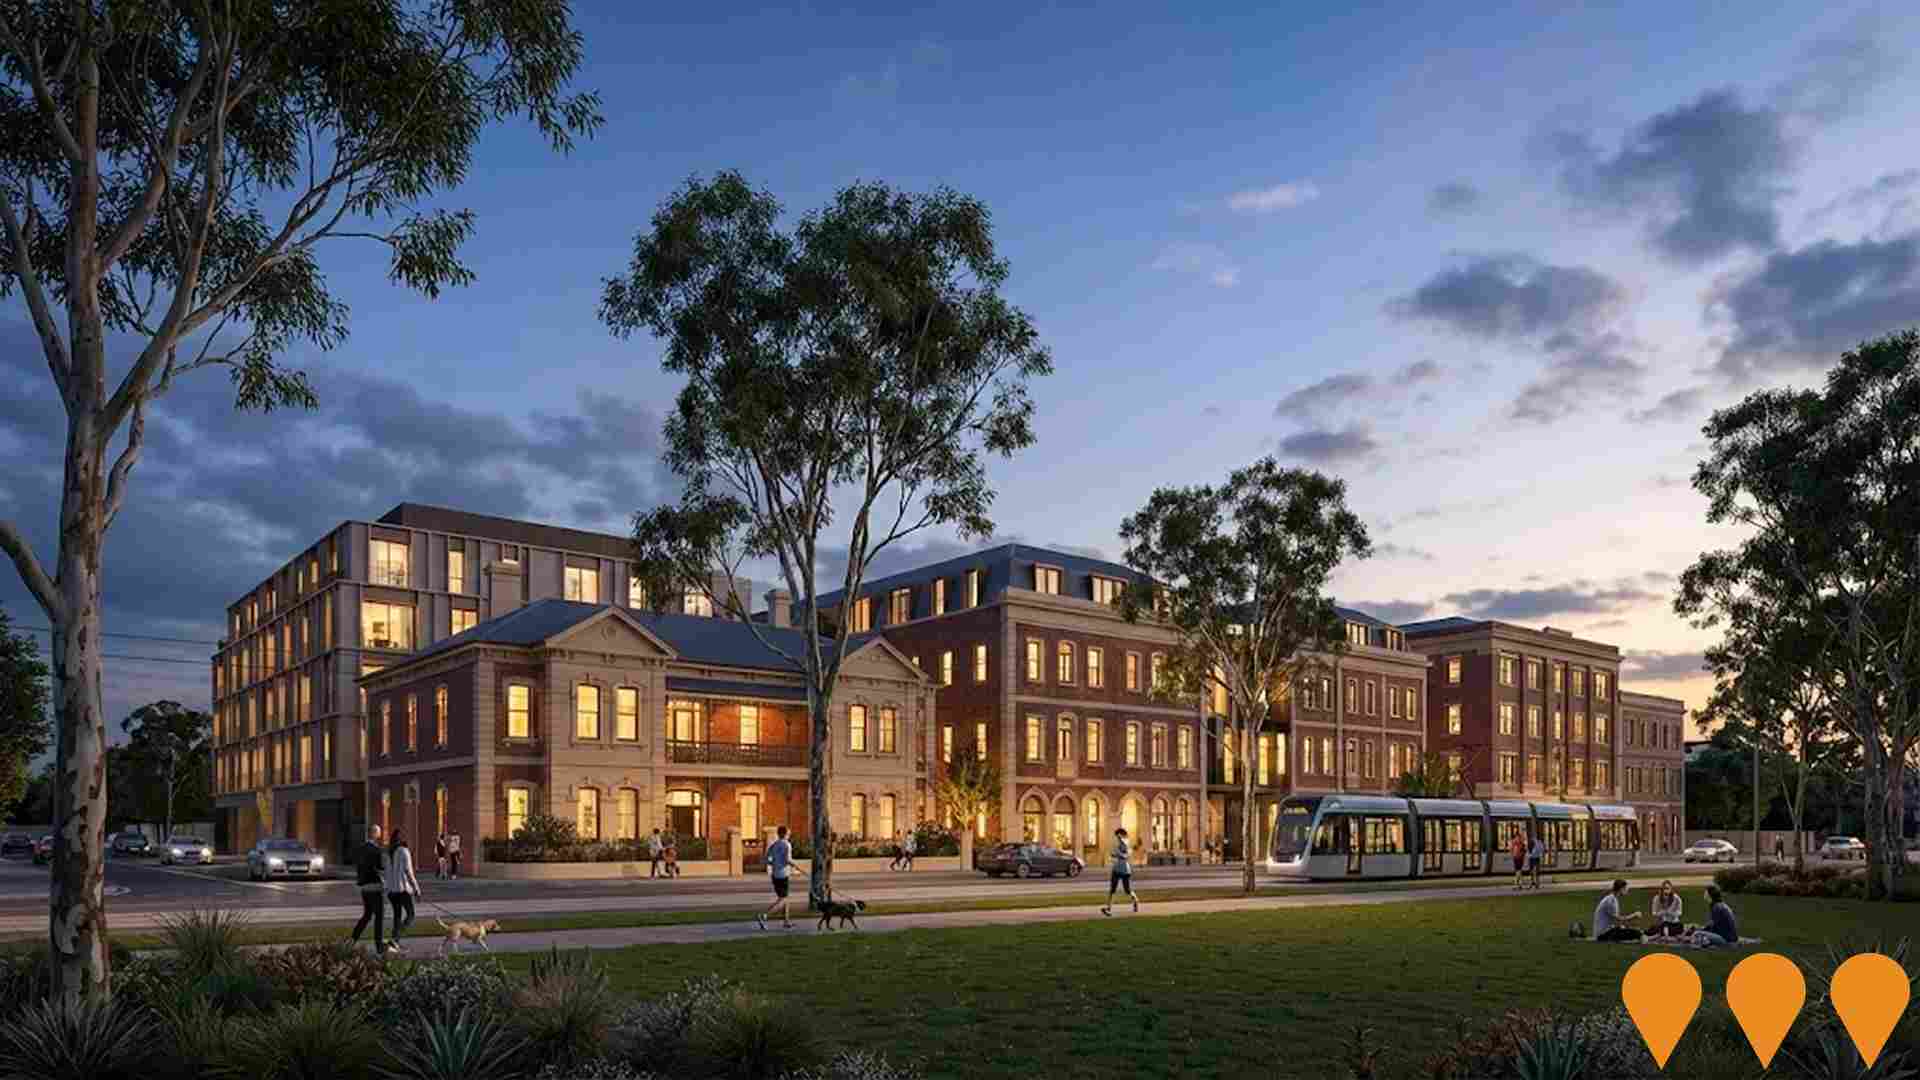
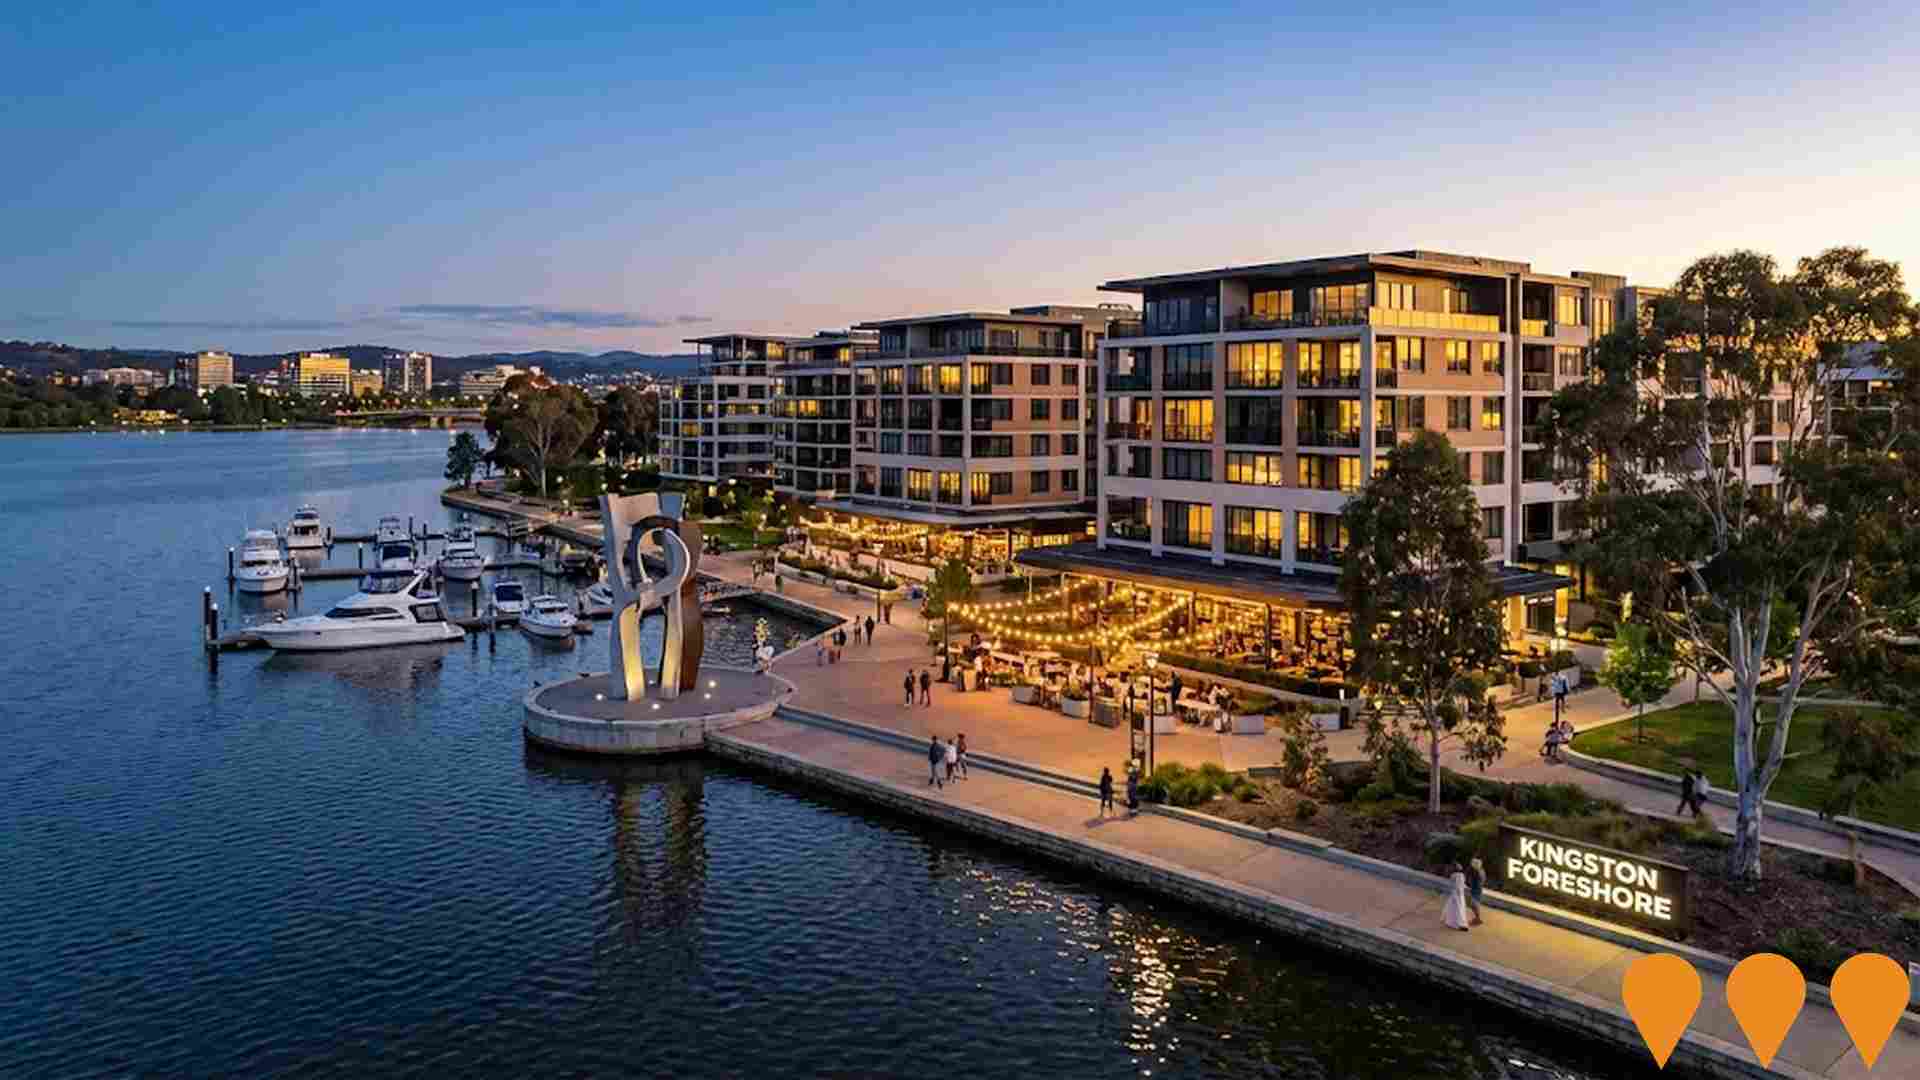
Kingston Arts Precinct
A $146 million redevelopment of Section 49 in Kingston to create a premier visual arts and culture destination. The project involves the adaptive reuse of the historic Fitters Workshop, Powerhouse, and Former Transport Depot to house major arts organisations like Canberra Glassworks and Megalo Print Studio. It includes an Aboriginal and Torres Strait Islander art space, artist studios, and a 346-space carpark. Construction is currently expected to begin in 2027.

219 residents of Majura are employed, from a labour force of 220. Unemployment sits at 0.5%, with participation at 68.5%. Weighted for its industry mix, the area's sectors are forecast to grow about 6.1% nationally over five years. That reflects industry composition only and makes no allowance for local population growth. Unemployment and labour force come from ABS Small Area Labour Markets, updated quarterly; the industry and occupation profile is from the 2021 Census.
Detail
Majura features a well-educated workforce, with essential services sectors well represented, an unemployment rate of just 0.5%, and 1.9% in estimated employment growth over the past year. As of June 2025, 219 residents are in work while the unemployment rate is 3.0% below Australian Capital Territory's rate of 3.4%, and workforce participation is broadly similar to Australian Capital Territory's 69.6%. Leading employment industries among residents comprise public administration & safety, construction, and health care & social assistance. The area has particular employment specialization in public administration & safety, with an employment share of 1.5 times the regional level.
On the other hand, professional & technical is under-represented, with only 6.1% of Majura's workforce compared to 11.1% in Australian Capital Territory. With 10.4 workers for every resident, as at the Census, the area functions as an employment hub, hosting more jobs than residents and attracting workers from surrounding areas. Based on AreaSearch analysis of SALM and ABS data, over the 12 months to June 2025, employment increased by 1.9% while labour force increased by 1.4%, causing the unemployment rate to fall by 0.5 percentage points. By comparison, Australian Capital Territory recorded employment growth of 1.9%, labour force growth of 1.6%, with unemployment falling 0.3 percentage points. Jobs and Skills Australia's national employment forecasts from May 2025 can offer further insight into potential future demand within Majura. These projections, covering five and ten-year periods, have been mapped against the local employment profile to estimate growth patterns. While national employment is forecast to expand by 6.6% over five years and 13.7% over ten years, growth rates differ significantly between industry sectors. Applying these industry-specific projections to Majura's employment mix suggests local growth of approximately increase by 6.1%% over five years and 12.4% over ten years (please note this is a simple weighting extrapolation for illustrative purposes and does not take into account localised population projections).
Frequently Asked Questions - Employment
Median household income in Majura is $3,156 a week (about $164,000 a year), with median personal income at $1,161 a week. ATO records put median taxable income at $59,387 a year against an average of $100,290. The average runs 69% above the median, a wider spread than most areas and a sign of a concentrated group of high earners. Household income is from the 2021 Census; taxable income is from ATO Taxation Statistics for the latest financial year available, indexed forward using the ABS Wage Price Index.
Detail
Majura shows a median taxpayer income of $59,387 and an average of $100,290 according to the latest postcode level ATO data aggregated by AreaSearch for FY-22. This is exceptionally high nationally, contrasting with Australian Capital Territory's median income of $68,678 and average income of $83,634. Based on Wage Price Index growth of 13.6% since FY-22, current estimates would be approximately $67,464 (median) and $113,929 (average) as of September 2025. Census 2021 income data shows household, family and personal incomes all rank highly in Majura, between the 89th and 98th percentiles nationally.
Income analysis reveals the predominant cohort spans 27.4% of locals (75 people) in the $1,500 - 2,999 category, mirroring the metropolitan region where 34.3% occupy this bracket. Higher earners represent a substantial presence with 46.8% exceeding $3,000 weekly, indicating strong purchasing power within the community. After housing costs, residents retain 89.7% of income, reflecting strong purchasing power and the area's SEIFA income ranking places it in the 5th decile.
Frequently Asked Questions - Income
Majura had 56 occupied dwellings at the 2021 Census, 100% detached houses and 0% apartments. 28% are owned with a mortgage, 36% rented and 36% owned outright. At that Census the median rent was $365 a week and the median mortgage repayment $3,033 a month. Rent absorbs 11.6% of household income here and mortgage repayments 22.2%. Dwelling stock, tenure and housing costs are 2021 Census measures — the only source that counts dwellings at this boundary size.
Detail
Dwelling structure within Majura, as evaluated at the latest Census, comprised 100.0% houses and 0.0% other dwellings (semi-detached, apartments, 'other' dwellings), in comparison to Australian Capital Territory's 45.8% houses and 54.2% other dwellings. Meanwhile, the level of home ownership within Majura was lagging that of Australian Capital Territory, at 36.2%, with the remainder of dwellings either mortgaged (27.7%) or rented (36.2%). The median monthly mortgage repayment in the area was well above the Australian Capital Territory average at $3,033, while the median weekly rent figure was recorded at $365, compared to Australian Capital Territory's $1,712 and $290.
Nationally, Majura's mortgage repayments are significantly higher than the Australian average of $1,863, while rents are less than the national figure of $375.
Frequently Asked Questions - Housing
Majura counted 56 households at the 2021 Census, averaging 3.0 people each. 45% are couples with children, against 29% couples without children. 18% of households are people living alone, and families average 1.3 children. Household and family composition is measured only by the Census, so these are 2021 figures.
Detail
Family households dominate at 80.4% of all households, comprising 44.6% couples with children, 28.6% couples without children, and 8.9% single parent families. Non-family households make up the remaining 19.6%, with lone person households at 17.9% and group households comprising 0.0% of the total. The median household size of 3.0 people is larger than the Australian Capital Territory average of 2.0.
Frequently Asked Questions - Households
30.8% of adults in Majura hold a university qualification, including 20.5% with a bachelor degree and 5.7% with postgraduate qualifications. A further 29.6% hold a vocational qualification. Qualifications come from the 2021 Census.
Detail
The area faces educational challenges, with university qualification rates (30.8%) substantially below the SA4 region average of 46.8%. This represents both a challenge and an opportunity for targeted educational initiatives. Bachelor degrees lead at 20.5%, followed by postgraduate qualifications (5.7%) and graduate diplomas (4.6%). Trade and technical skills feature prominently, with 38.7% of residents aged 15+ holding vocational credentials – advanced diplomas (9.1%) and certificates (29.6%). Educational participation is notably high, with 48.3% of residents currently enrolled in formal education. This includes 9.6% in tertiary education, 5.1% in primary education, and 4.5% pursuing secondary education.
Educational facilities appear to be located outside the immediate catchment boundaries, requiring families to access schools in neighboring areas.
Frequently Asked Questions - Education
Schools Detail
Public transport in Majura reaches 7 stops on 3 routes, timetabled for about 280 services a week. Stop and service counts are built from operators' published GTFS timetables and refresh with each timetable release; vehicle ownership is from the 2021 Census.
Detail
Public transport analysis reveals 7 active transport stops operating within Majura comprising a mix of buses. These stops are serviced by 3 individual routes, collectively providing 280 weekly passenger trips. Service frequency averages 40 trips per day across all routes, equating to approximately 40 weekly trips per individual stop.
Frequently Asked Questions - Transport
Transport Stops Detail
76.8% of residents in Majura report no long-term health condition, a healthier profile than 79% of areas nationally. 2.7% need daily assistance with core activities, and 71.7% hold private health cover. Health conditions, assistance needs and insurance are 2021 Census measures; the death rate comes from current ABS releases.
Detail
Analysis of health metrics shows strong performance throughout Majura with very low prevalence of common health conditions across all age groups , and the rate of private health cover found to be exceptionally high at approximately 72% of the total population (197 people). This compares to 63.6% across Australian Capital Territory. The national average is 55.3%. The most common medical conditions in the area were found to be arthritis and asthma, impacting 8.6 and 5.2% of residents, respectively, while 76.8% declared themselves as completely clear of medical ailments compared to 66.0% across Australian Capital Territory.
The area has 9.6% of residents aged 65 and over (26 people), which is lower than the 15.5% in Australian Capital Territory. Health outcomes among seniors are particularly strong, performing even better than the general population in health metrics. Overall 2.7% of the total population registered as requiring assistance with day to day activities, which is well below average. In Australian Capital Territory, 3.4% require assistance. Nationally, 5.8% require assistance.
Frequently Asked Questions - Health
Majura is largely Australian-born, at 79.8% of residents, with 9.9% speaking a language other than English at home. The largest reported ancestries are English (30.3%) and Australian (27.2%). Ancestry, language and country of birth are counted only by the Census, so these are 2021 figures.
Detail
Majura was found to be roughly in line with the wider region's average in terms of cultural diversity, with 78.4% of its population being citizens, 79.8% born in Australia, and 90.1% speaking English only at home. The main religion in Majura was found to be Christianity, which makes up 45.6% of people in Majura. However, the most apparent overrepresentation was in Islam, which comprises 2.9% of the population, compared to 3.9% across Australian Capital Territory. In terms of ancestry (country of birth of parents), the top three represented groups in Majura are English, comprising 30.3% of the population, which is substantially higher than the regional average of 24.3%, Australian, comprising 27.2% of the population, and Irish, comprising 8.2% of the population.
Additionally, there are notable divergences in the representation of certain other ethnic groups: New Zealand is notably overrepresented at 2.0% of Majura (vs 0.8% regionally), Welsh at 1.1% (vs 0.4%) and Croatian at 2.0% (vs 0.7%).
Frequently Asked Questions - Diversity
The median resident of Majura is 26, younger than 99% of areas nationally. That is 1 year younger than at the 2021 Census. 55.0% of residents are aged 15 to 34. Age cohorts are not raw Census counts: the Census split is re-based to the latest ABS population estimates and state projections.
Detail
Majura's median age of 26 years stands notably under Australian Capital Territory's 35 as well as significantly lower than the 38-year national average. Relative to Australian Capital Territory, Majura has a higher concentration of 15 - 24 residents (30.7%) but fewer 35 - 44 year-olds (6.1%). This 15 - 24 concentration is well above the national 12.5%. Since the 2021 Census, younger residents have shifted the median age down by 1.3 years to 26. Notable shifts include the 25 to 34 age group has grown from 19.5% to 24.3% of the population, while the 0 to 4 cohort increased from 3.1% to 5.0%.
Conversely, the 45 to 54 cohort has declined from 14.6% to 12.5% and the 5 to 14 group dropped from 4.2% to 2.9%. By 2041, Majura is expected to see notable shifts in its age composition. Leading the demographic shift, the 85+ group will grow by 16% (1 people), reaching 8 from 6. Demographic aging continues as residents 65 and older represent 82% of anticipated growth. Meanwhile, the 55 to 64 and 35 to 44 cohorts are expected to experience population declines.
Frequently Asked Questions - Age
Data & MethodBoundaries, Sources & Method for Majura
9 of 14 data sections on this page were updated within the last 12 months — the newest current to Sep 2026.
Everything is aggregated to the SA2 boundary shown above, on a 2021 Census baseline. Only 3 sections — housing, households and cultural diversity — still wait on the 2026 Census.
The ledger — source, cycle and currency by section
| Section | Source & update cycle | Currency |
|---|---|---|
| Updated within the last 12 months 9 sections | ||
| Population | ABS, GNAF, Geoscience Australia Annual (ABS ERP) | Aug 2026 last month headline measures · 2021 Census baseline |
| Re-based to the ABS Estimated Resident Population (June 2024 release) and updated with new dwellings from GNAF address data. Current to Aug 2026, with the 2021 Census supplying the small-area baseline. | ||
| Age profile | ABS, Geoscience Australia, State governments Annual | Aug 2026 last month headline measures · 2021 Census baseline |
| Age cohorts are re-based to the latest ABS population estimates and state projections, current to Aug 2026. Each cohort is held as a Census baseline and a current estimate. | ||
| Development & approvals | ABS, GNAF Monthly (ABS approvals) | Aug 2026 last month headline measures · Jul 2026 baseline |
| Property sales & rents | Valuer General, Rental Board, ABS Weekly sales, quarterly rents | Sep 2026 this month all 21 measures |
| Sales from the state Valuer General register, refreshed weekly, and rents from quarterly rental bond lodgements. Both are read live each time this page loads, current to Sep 2026. | ||
| Infrastructure projects | Infrastructure Australia, Local governments Daily | May 2026 4 months ago all 2 projects tracked here |
| Project pipeline maintained continuously from Infrastructure Australia, state agencies, local government and public announcements. Records are added and revised daily; this area was last updated May 2026. | ||
| Employment | ABS, DEWR, JSA Quarterly (ABS SALM) | Mar 2026 6 months ago headline measures · 2021 Census baseline |
| Unemployment and labour force from ABS Small Area Labour Markets, current to Mar 2026. The growth outlook applies Department of Employment (now Jobs and Skills Australia) forecasts for all 19 industry divisions to the local industry mix, so it measures sector composition rather than local expansion and makes no allowance for population growth. Job demand comes from the same agency via its Internet Vacancy Index; industry and occupation structure from the 2021 Census. | ||
| Education | ABS, ACARA Annual (ACARA) | Aug 2026 last month headline measures · 2021 Census baseline |
| Transport | ABS, State Transport Departments Each timetable release | Jul 2026 2 months ago headline measures · 2021 Census baseline |
| Services & amenities | Provider directories, ACECQA Continuous | Jul 2026 2 months ago all 14 measures |
| Annual and financial-year sources 2 sections | ||
| Income | ABS, ATO Annual (ATO) | FY 2023 3 years ago headline measures · 2021 Census baseline |
| ATO taxable income statistics for FY 2022, indexed forward using the Wage Price Index. Census household income provides the distribution detail. | ||
| Health | ABS, ATO Annual | 2024 2 years ago headline measures · 2021 Census baseline |
| Census-measured — next update: 2026 Census 3 sections No more current small-area source exists for these, so they are labelled as Census-measured rather than implied to be current. | ||
| Housing | ABS 5-yearly (Census) | 2021 Census next update 2026 all 30 measures |
| Households | ABS 5-yearly (Census) | 2021 Census next update 2026 all 18 measures |
| Cultural diversity | ABS, Geoscience Australia 5-yearly (Census) | 2021 Census next update 2026 all 44 measures |
"Currency" is the most recent release feeding that section. Where the Census supplies the structural baseline underneath a current headline figure, the row says so.
How the numbers are built
Population
The Census provides the small-area baseline, aggregated from mesh blocks to this boundary. It is then re-based to the ABS Estimated Resident Population (June 2024 release), and new dwellings built since Census night are counted from address data — 1 validated new addresses here. The headline figure is therefore a current estimate for Nov 2025, not a 2021 count (296 at the 2021 Census → 276 now). Annual growth rates are compound (CAGR), not simple averages.
Age profile
Cohort shares are not raw Census counts. Every cohort is held as a pair — the Census baseline and a current estimate — and the split is re-based using ERP and state population projections, current to Nov 2025. Median age is the Census median plus modelled change since. Charts that show both are labelled "2021 Census vs Current Estimate".
Property sales
Sourced from the state valuation authority's sales register — current, not Census, and refreshed weekly. Medians are calculated from settled transactions in the period shown; periods with very low transaction counts are flagged or suppressed, because a handful of sales can move a median substantially.
Rents
Derived from state rental bond lodgement data, by dwelling type and bedroom count. Bonds are lodged at the start of a new tenancy, so this reflects new lettings, not the whole rented stock.
Development & infrastructure
Building approvals come from current ABS releases; development applications are collected from council and state planning portals; the infrastructure pipeline is compiled from Infrastructure Australia and local government sources. Applications are matched to this boundary by address or coordinates, so very recent lodgements may not yet appear.
Employment & income
Industry and occupation structure comes from the Census, but the headline labour-market indicators do not. Unemployment and labour force are derived from ABS Small Area Labour Markets (quarterly). The employment outlook applies Department of Employment forecasts for all 19 industry divisions to this area's own industry mix (the agency is now Jobs and Skills Australia), as does the Internet Vacancy Index used for job demand. Because it is weighted on industry composition alone, that outlook carries no allowance for local population growth — in fast-growing areas the real rise in local jobs will typically be higher. Income combines Census household income with ATO taxable-income statistics for FY 2022, indexed forward using the Wage Price Index.
Education, transport & amenities
School enrolments, ICSEA and performance come from ACARA's current release, not the Census. Public transport stops and service frequency are derived from GTFS timetable feeds published by state transport departments. Services and amenities are proximity and count scores built from provider directories, refreshed on their own cycle. The Census contributes only the travel-to-work and qualification measures.
Rankings and benchmarks. Where we rank this area, the comparison set is every area of the same boundary type — suburbs against suburbs, SA2s against SA2s. Benchmarks compare this area against its greater capital city region and the national figure for the same measure and period.
Limits worth knowing. Small areas carry larger error margins, and the ABS introduces small random adjustments to Census counts to protect confidentiality — so totals may not sum exactly. Estimates re-based from regional data describe the area's expected trajectory, not a direct count of it. Figures are indicative for research and are not financial, planning or valuation advice.
Cross-check us. The Census baseline for this boundary is at ABS 2021 Census QuickStats (801031115). QuickStats reports 2021 only — the figures on this page are more current wherever the ledger shows a later date.