Chart Color Schemes
This analysis uses ABS Statistical Areas Level 2 (SA2) boundaries, which can materially differ from Suburbs and Localities (SAL) even when sharing similar names.
SA2 boundaries are defined by the Australian Bureau of Statistics and are designed to represent communities for statistical reporting (e.g., census and ERP).
Suburbs and Localities (SAL) represent commonly-used suburb/locality names (postal-style areas) and may use different geographic boundaries. For comprehensive analysis, consider reviewing both boundary types if available.
est. as @ -- *
ABS ERP | -- people | --
2021 Census | -- people
Sales Activity
Curious about local property values? Filter the chart to assess the volume and appreciation (including resales) trends and regional comparisons, or scroll to the map below view this information at an individual property level.
Find a Recent Sale
Sales Detail
Population
Ainslie is positioned among the lower quartile of areas assessed nationally for population growth based on AreaSearch's assessment of recent, and medium term trends
Ainslie's population, as per AreaSearch's analysis, is around 5,371 as of November 2025. This figure represents a decrease of 5 people since the 2021 Census, which recorded a population of 5,376. The change can be inferred from the estimated resident population of 5,366 in June 2024 and an additional 12 validated new addresses since the Census date. This results in a population density ratio of 1,517 persons per square kilometer, which is higher than the average across national locations assessed by AreaSearch. The primary driver of population growth was overseas migration during recent periods.
AreaSearch adopts ABS/Geoscience Australia projections for each SA2 area, released in 2024 with a base year of 2022. For areas not covered and years post-2032, age group growth rates from the ACT Government's SA2 area projections are used, also with a base year of 2022. According to population projections, lower quartile growth is anticipated for Australian statistical areas. Ainslie is expected to increase by 18 persons to 2041 based on the latest annual ERP population numbers, reflecting an overall increase of 0.1% over the 17 years.
Frequently Asked Questions - Population
Development
AreaSearch assessment of residential development drivers sees a low level of activity in Ainslie, placing the area among the bottom 25% of areas assessed nationally
Ainslie has seen approximately 17 new homes approved annually. Over the past five financial years, from FY21 to FY25, 89 homes were approved, with a further 5 approved in FY26 so far. The average construction value of these properties is $275,000.
This year has also seen $2.0 million in commercial approvals registered, indicating a predominantly residential focus. Compared to the Australian Capital Territory's average, Ainslie has significantly less development activity, 76.0% below the regional per capita average. This scarcity of new dwellings typically strengthens demand and prices for existing properties. The area's market is also lower than national averages, reflecting maturity and possible development constraints. New developments consist of 71.0% detached dwellings and 29.0% attached dwellings, sustaining Ainslie's suburban identity with a concentration of family homes suited to buyers seeking space.
With around 354 people per approval, Ainslie indicates a mature market. By 2041, the latest AreaSearch quarterly estimate projects Ainslie's population to grow by 4 residents. At current development rates, new housing supply should comfortably meet demand, providing good conditions for buyers and potentially supporting growth beyond current population projections.
Frequently Asked Questions - Development
Infrastructure
Ainslie has limited levels of nearby infrastructure activity, ranking in the 15thth percentile nationally
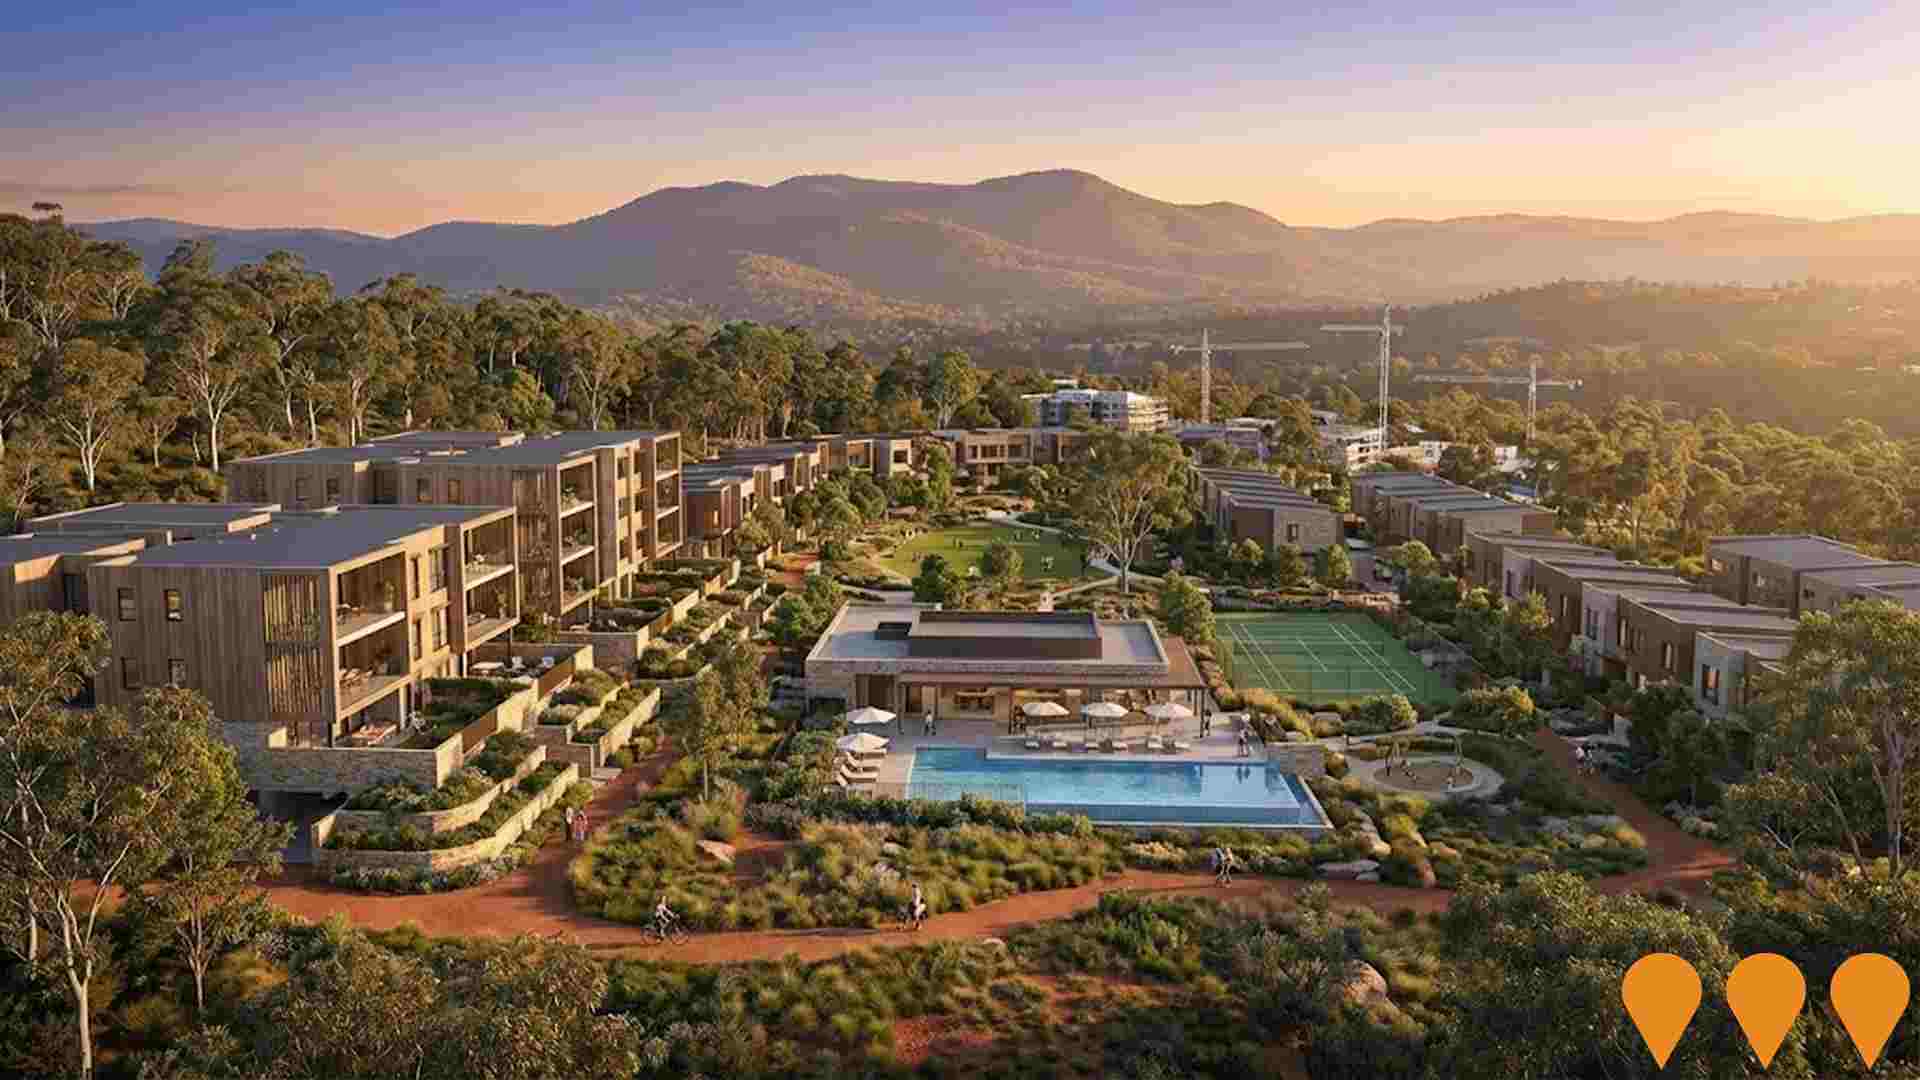
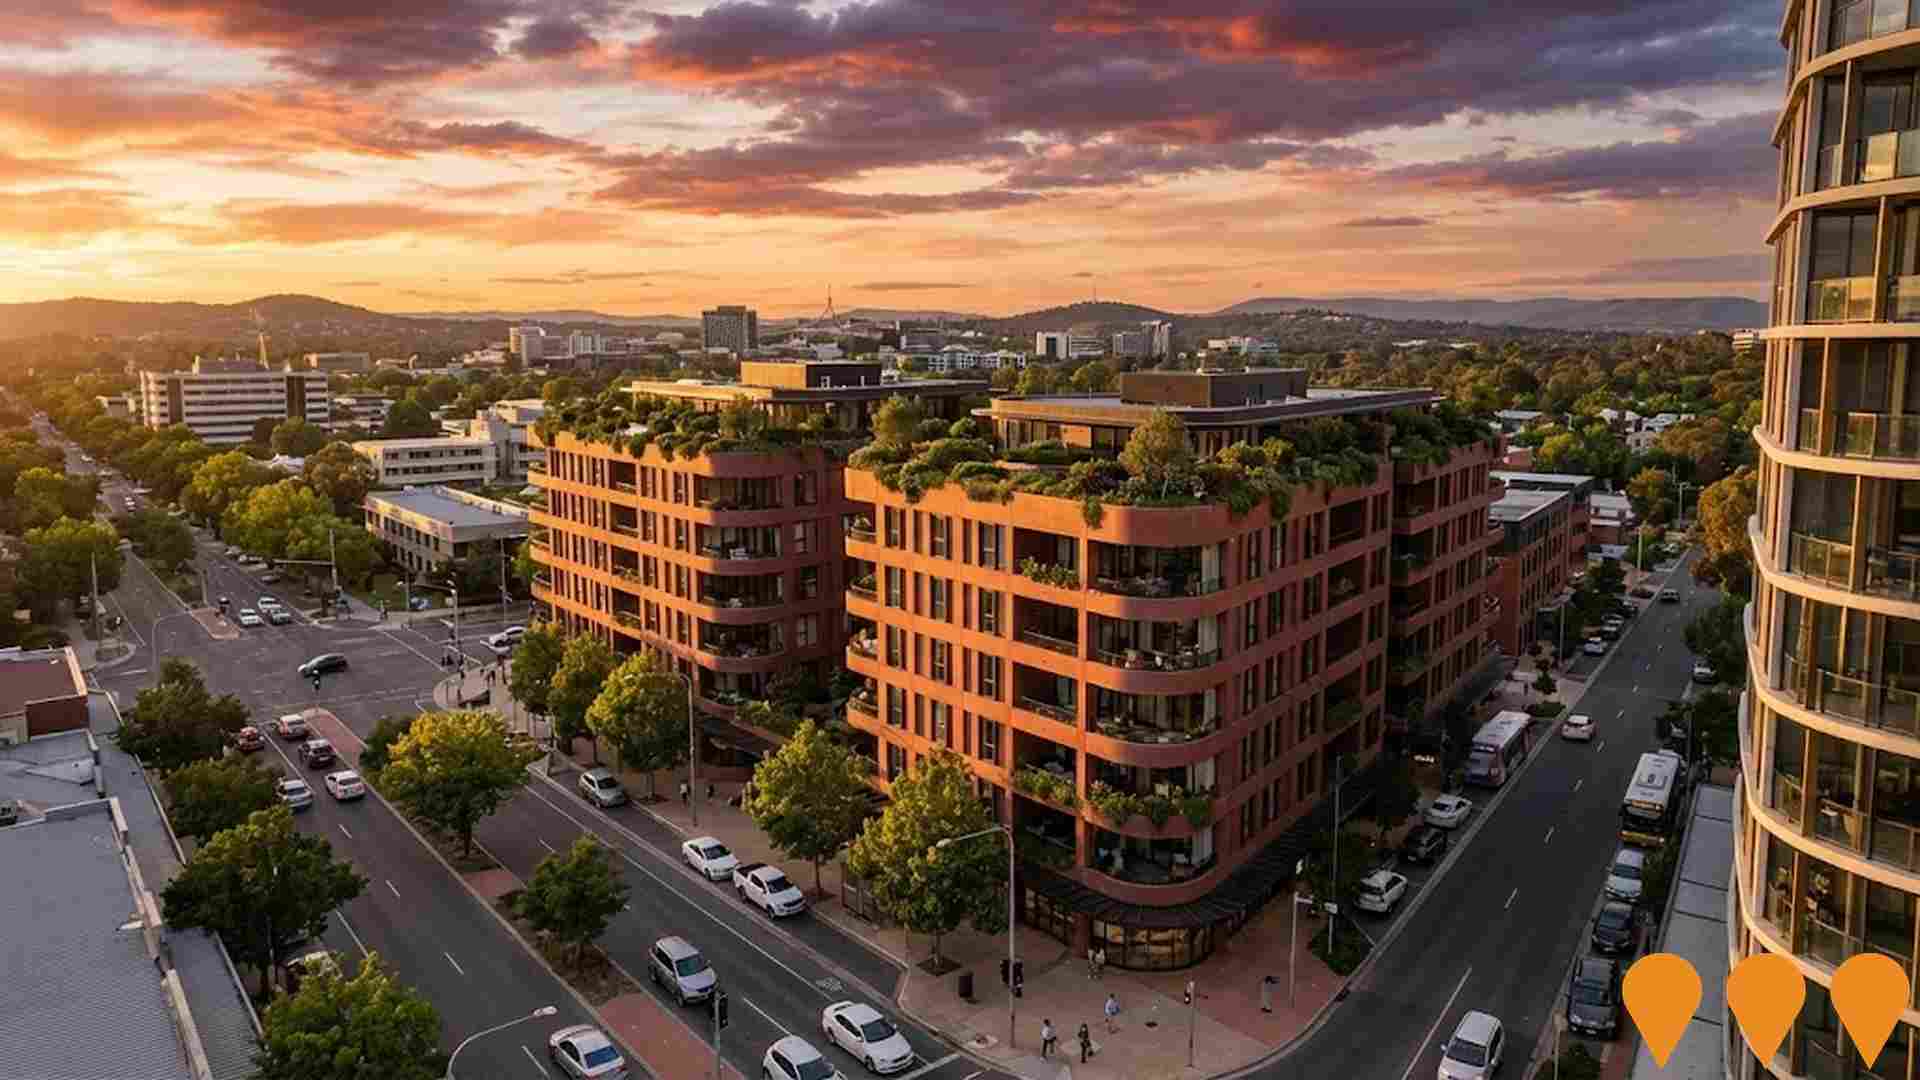
Changes to local infrastructure significantly impact an area's performance. AreaSearch identified 35 projects likely affecting the region. Notable initiatives include The Foothills - Campbell (Former CSIRO Site), Lonsdale & Girrahween - Braddon (Section 34), Marcus Clarke Street Office Complex, and Academy Close Redevelopment - Campbell. Relevant projects are detailed below.
Professional plan users can use the search below to filter and access additional projects.
INFRASTRUCTURE SEARCH
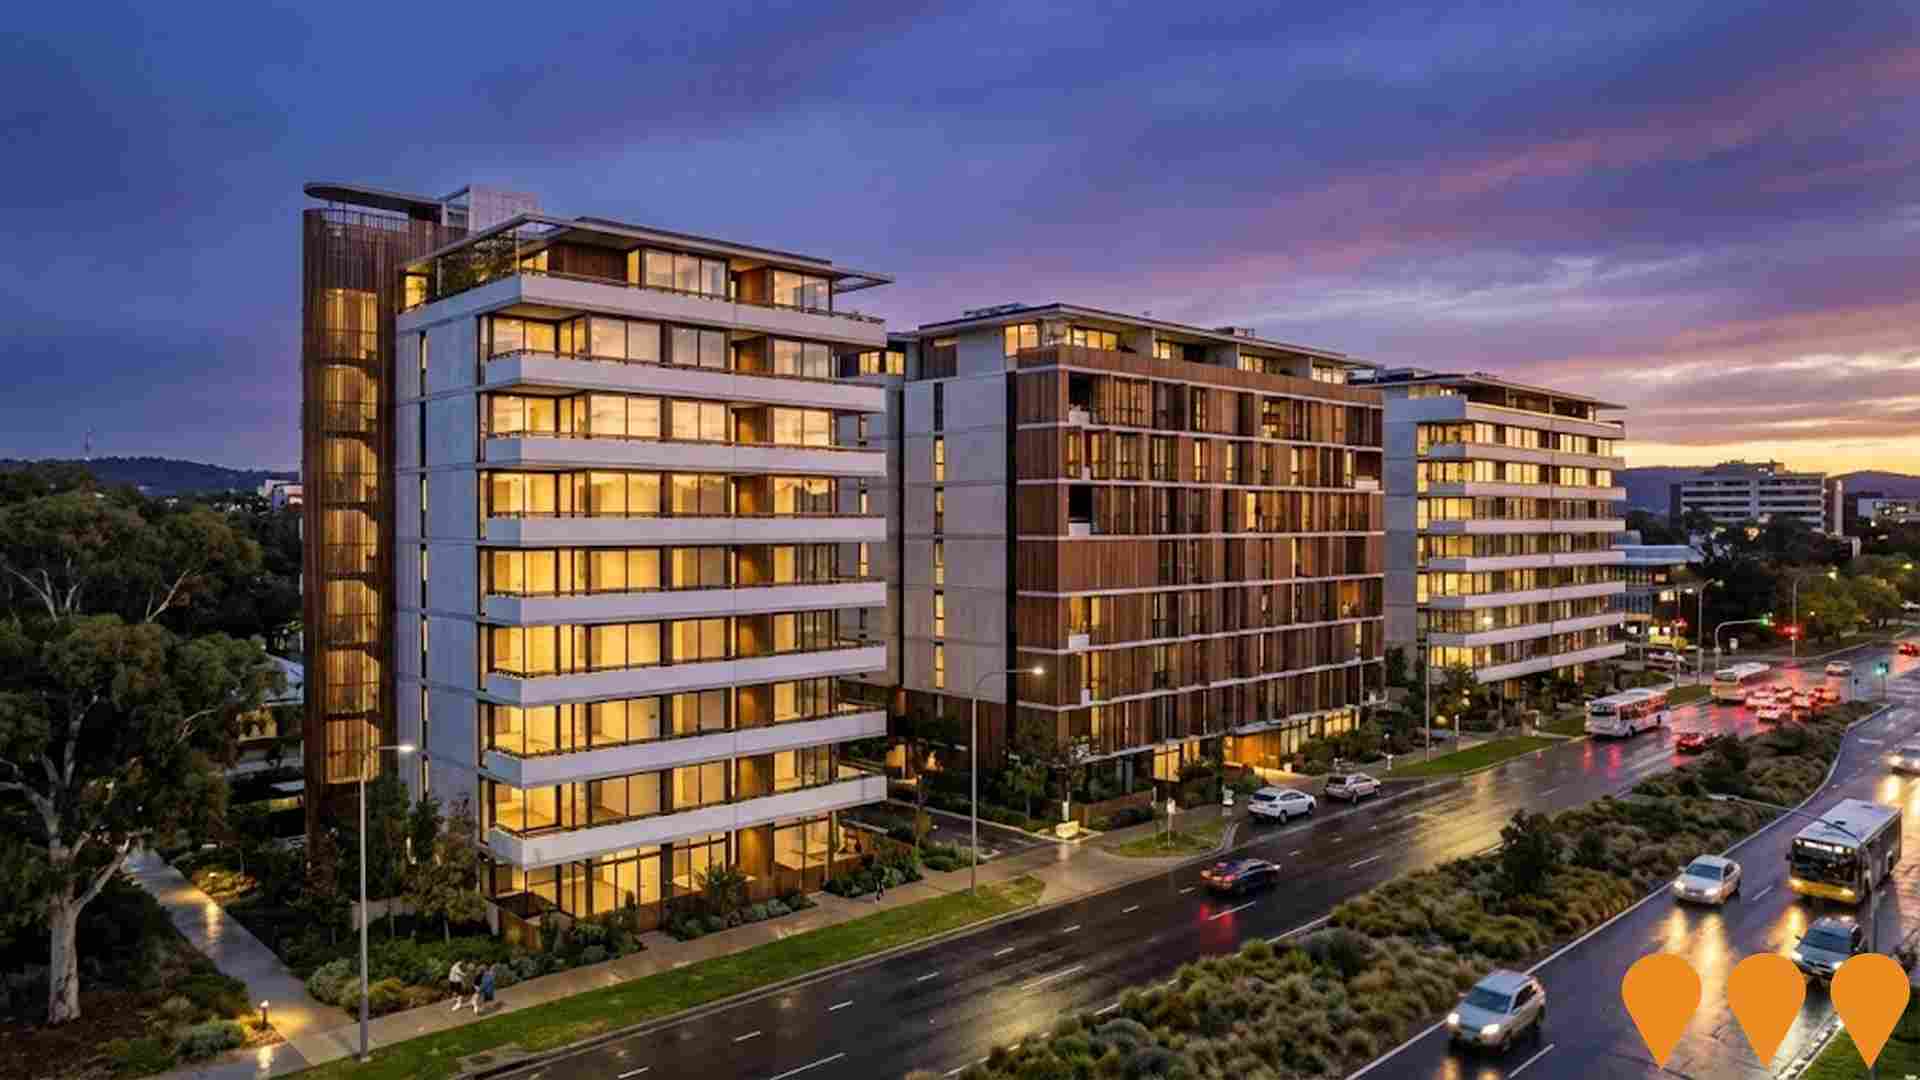
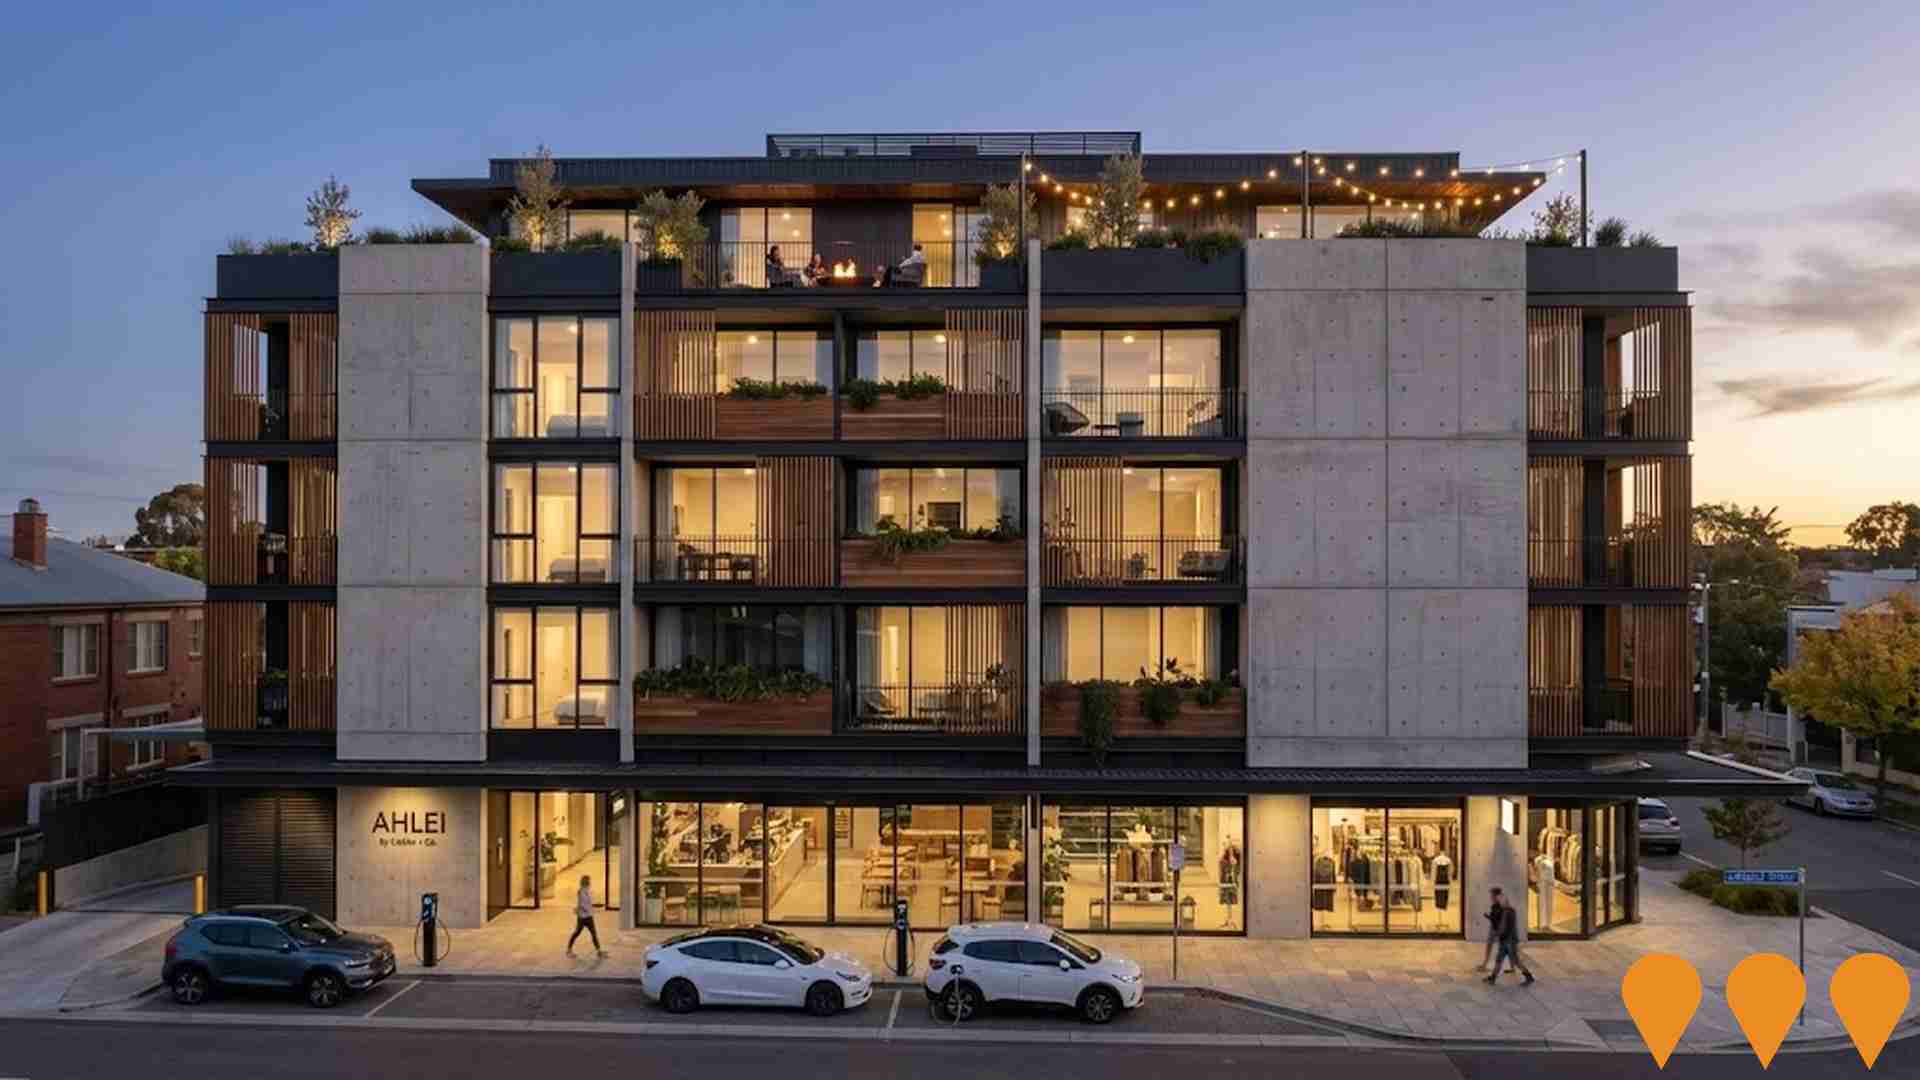
 Denotes AI-based impression for illustrative purposes only, not to be taken as definitive under any circumstances. Please follow links and conduct other investigations from the project's source for actual imagery. Developers and project owners wishing us to use original imagery please Contact Us and we will do so.
Frequently Asked Questions - Infrastructure
Haig Park Place - Braddon East
Major urban renewal precinct adjacent to Haig Park delivering over 1,000 dwellings, retail, and significant new public open space as part of the Braddon East master plan area.
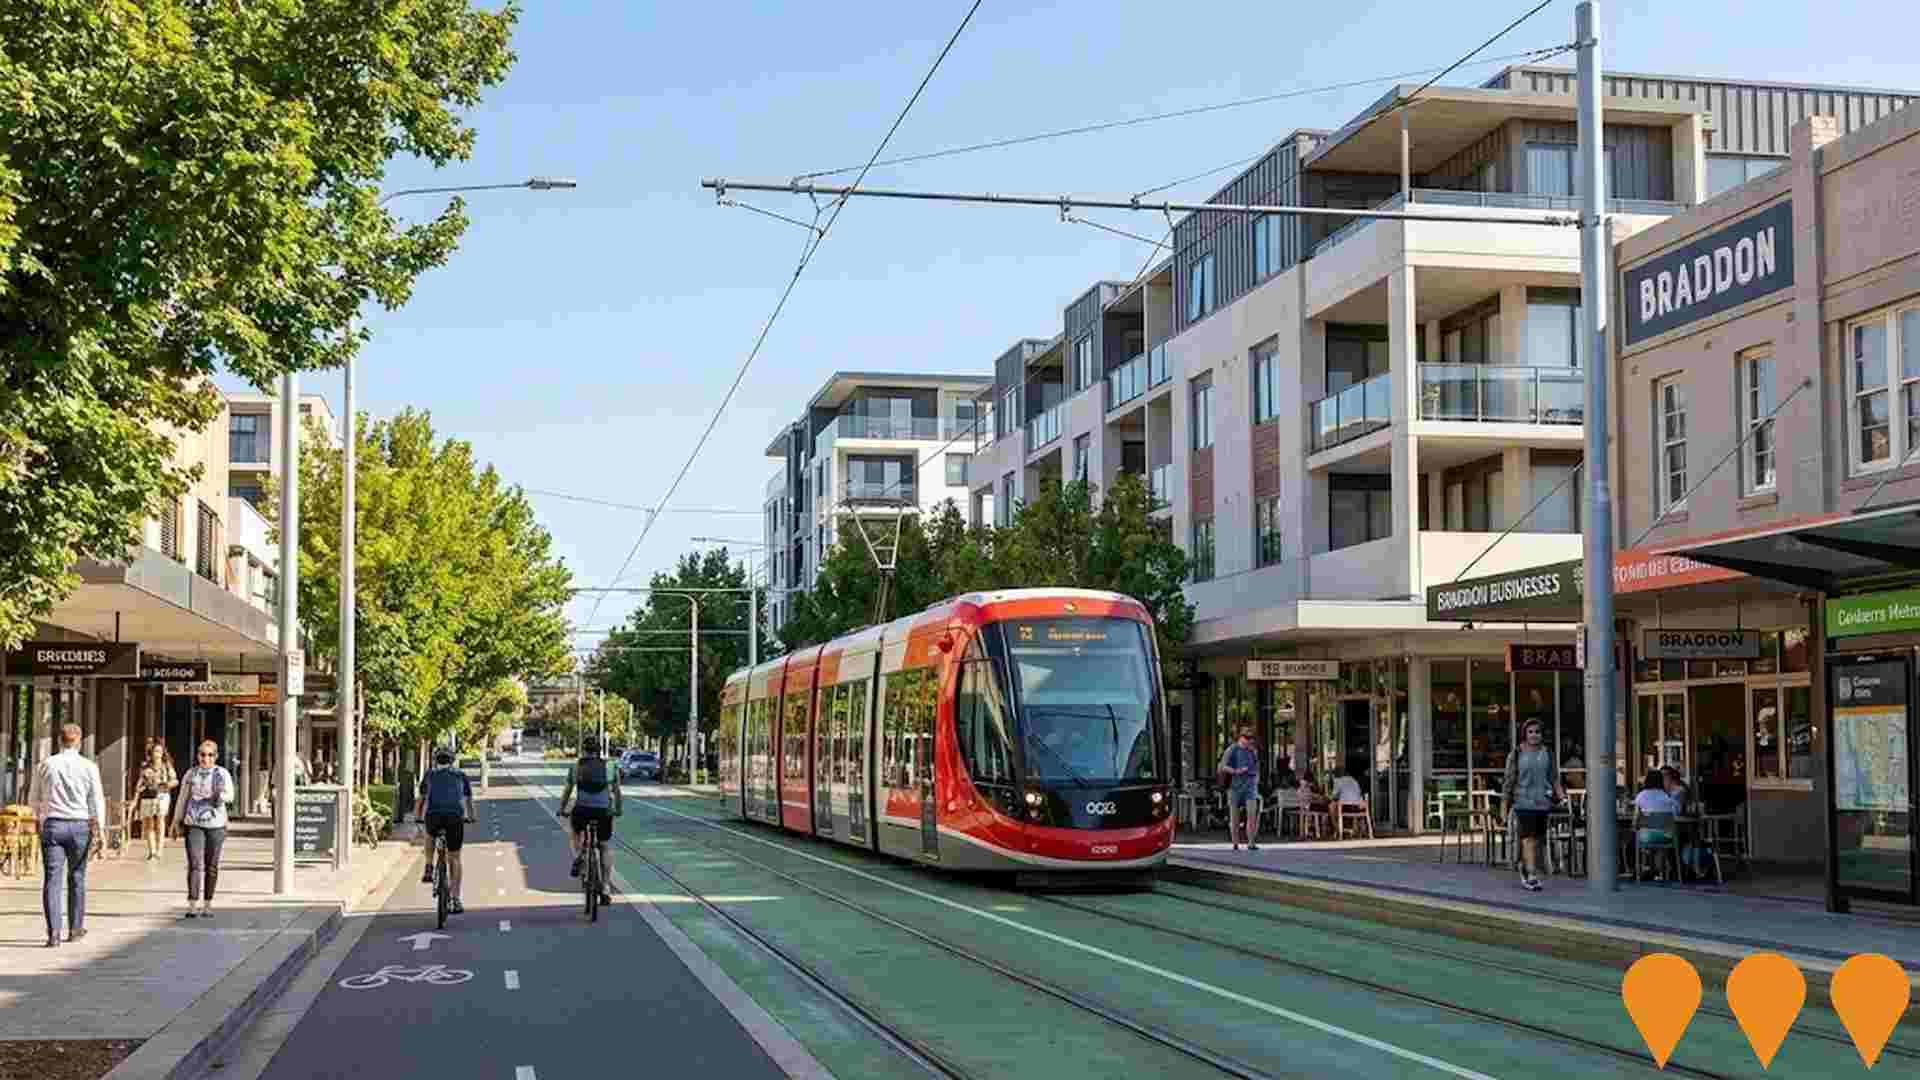
Light Rail Extension Planning - Braddon
Planning and concept work for potential future extensions of the Canberra light rail network that would improve access for Braddon and nearby inner north precincts. The ACT Government is currently focused on delivering Stage 2A from the city to Commonwealth Park and planning Stage 2B from Commonwealth Park to Woden, while longer term network planning identifies future stages to other corridors including Belconnen and the airport. No detailed route, scope or timing has been confirmed for any Braddon specific extension, but the precinct sits within the existing Stage 1 corridor and is included in ongoing light rail network and precinct planning.
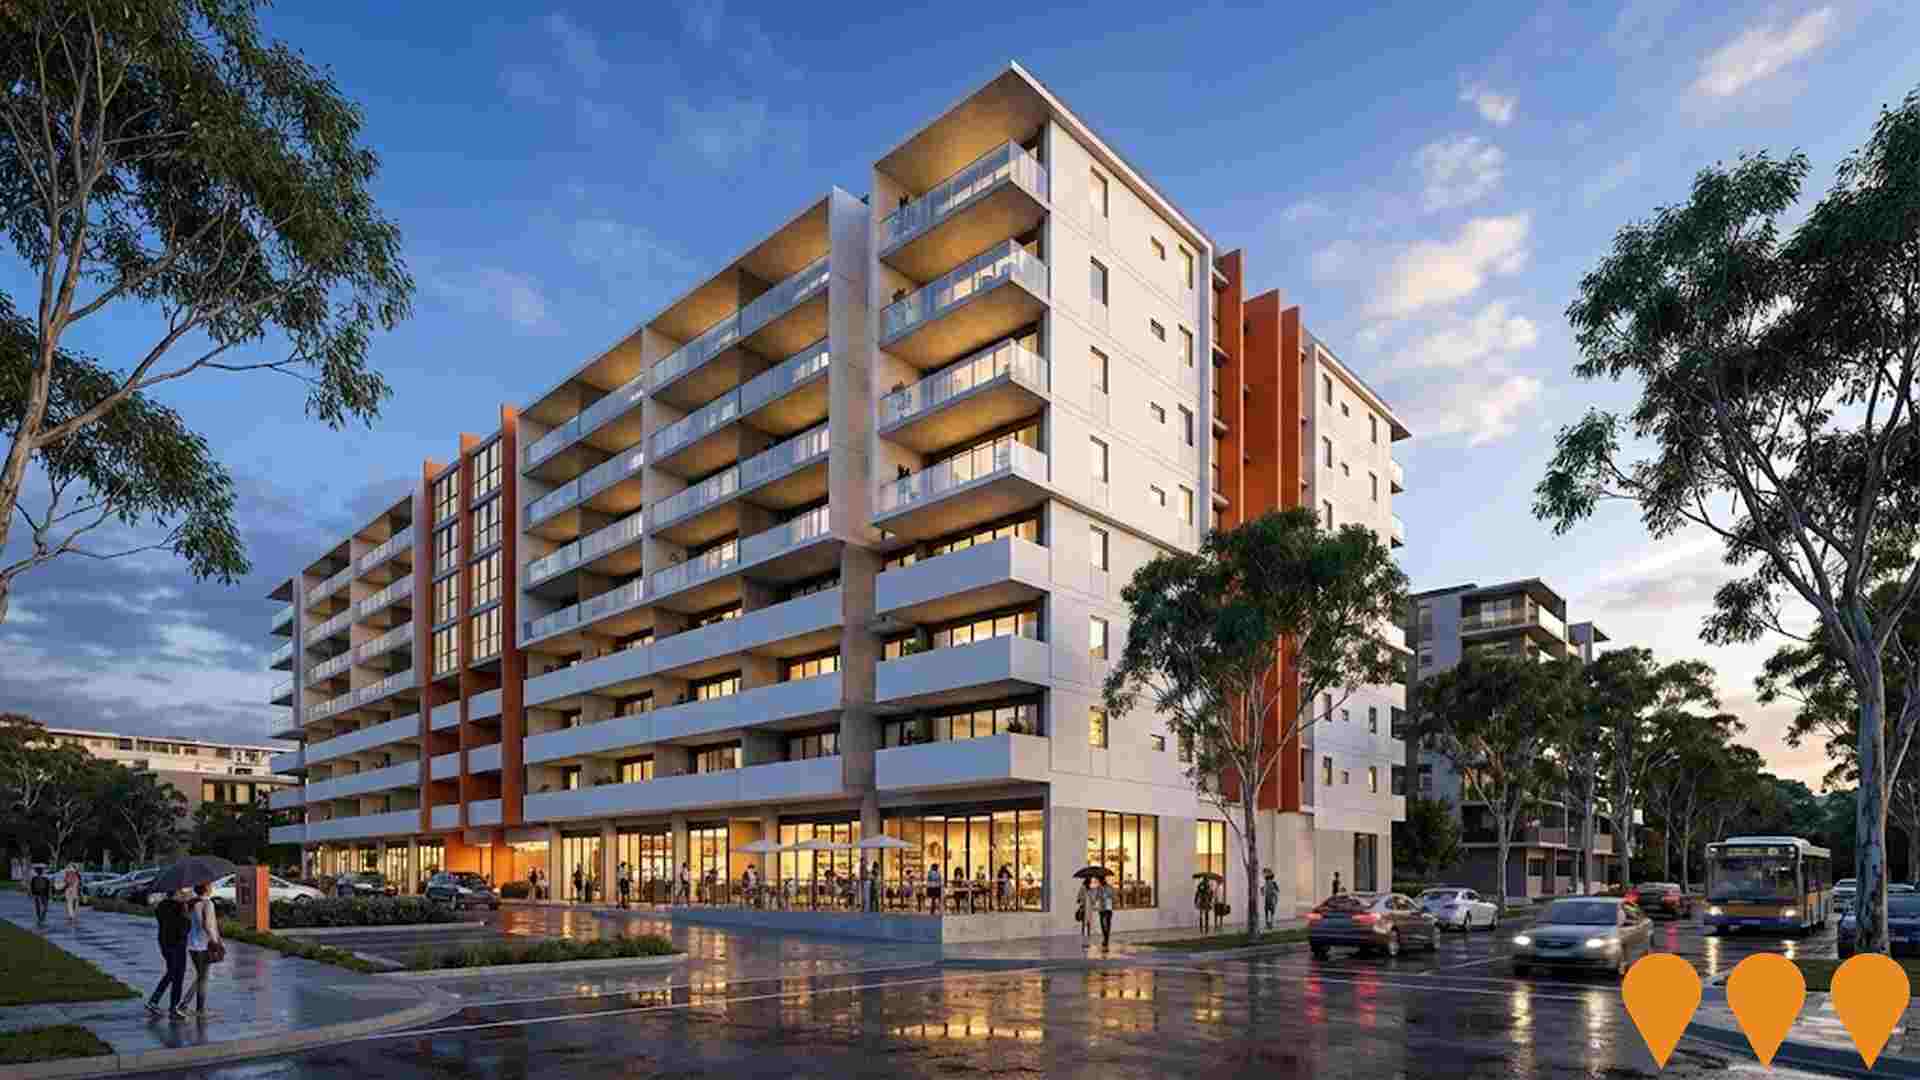
Ikon Place - Section 19 Braddon
Proposed mixed-use precinct on Section 19 Braddon delivering up to 650 apartments across multiple towers with retail and public realm improvements.
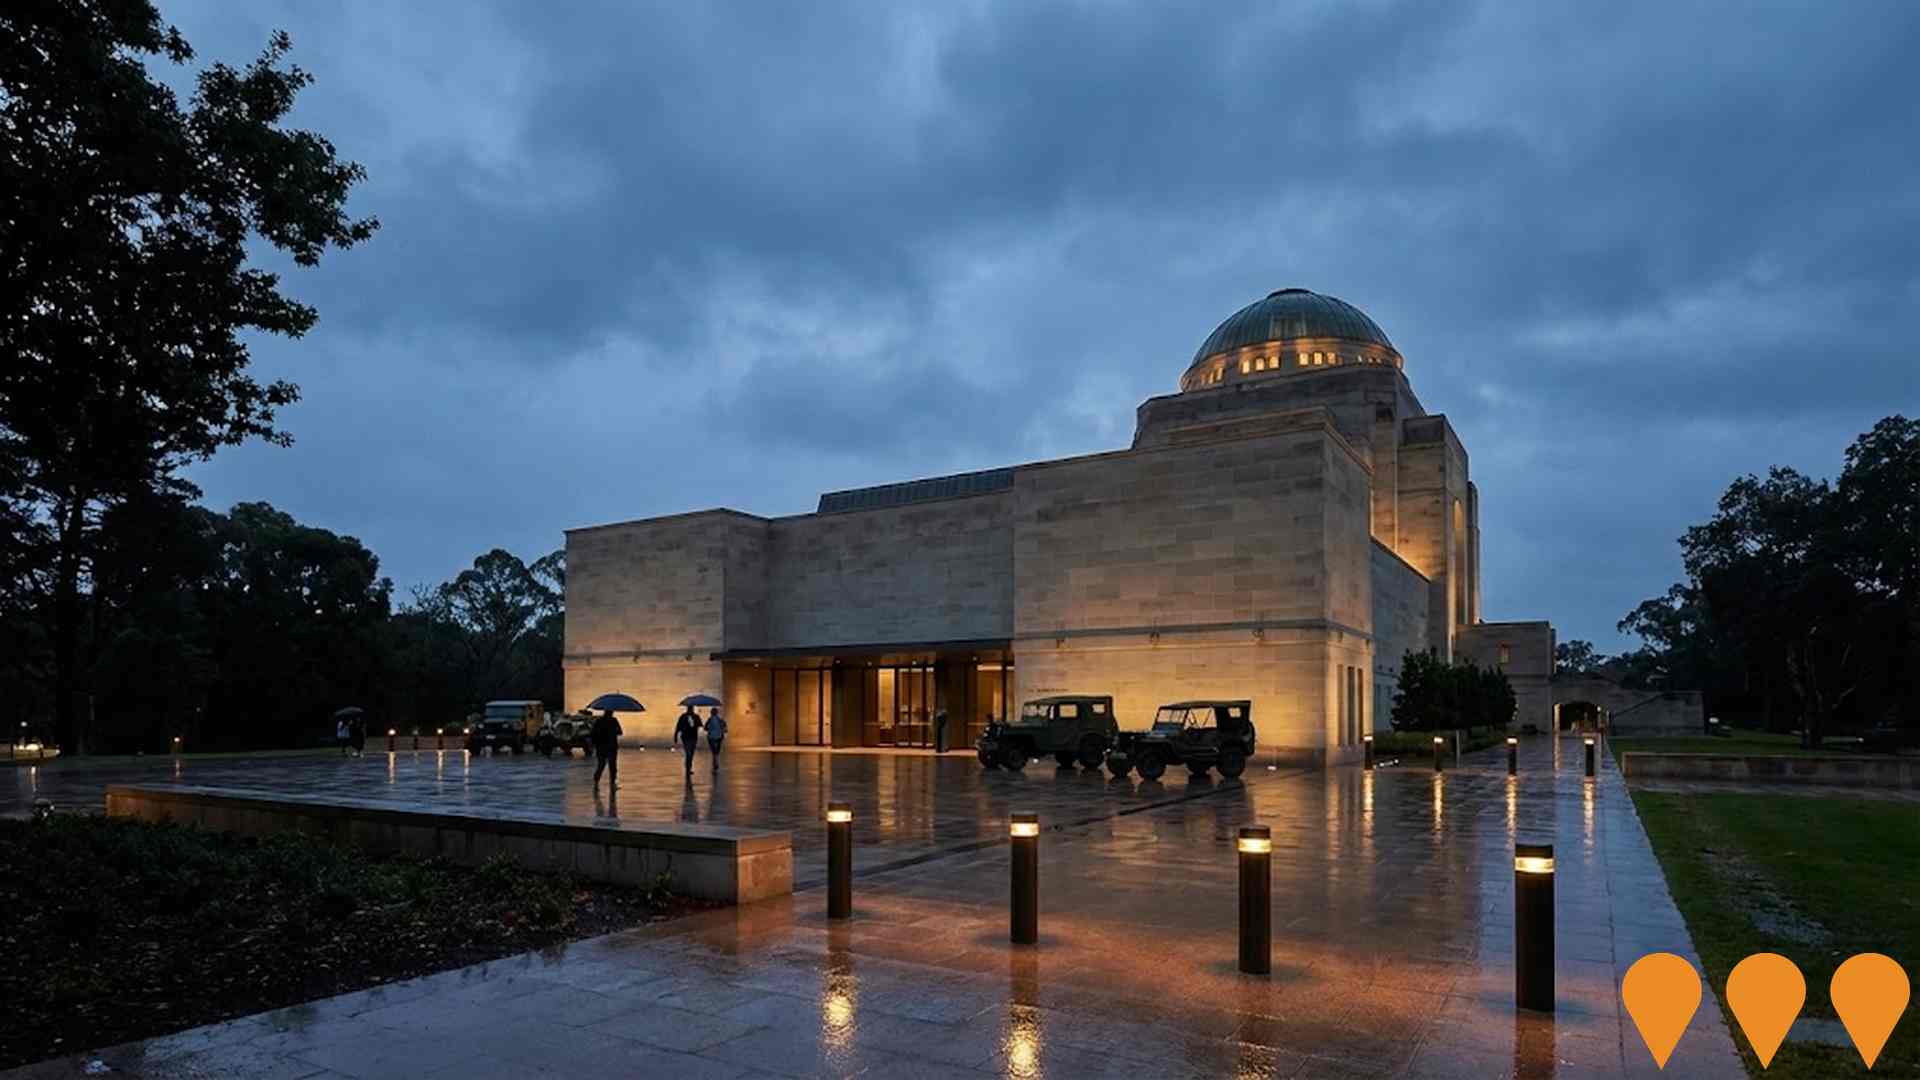
Australian War Memorial Redevelopment
The Australian War Memorial's redevelopment enlarges visitor spaces by 83%, adding 10,000 sqm for exhibitions and programs. Includes a new exhibitions area, better facilities, reflection spaces, education centers, a theatre, veterans' areas, and electronic displays.
Lonsdale & Girrahween - Braddon (Section 34)
Two mixed-use towers delivering approximately 400 apartments plus retail and commercial space on the former Braddon Club site, currently under construction.

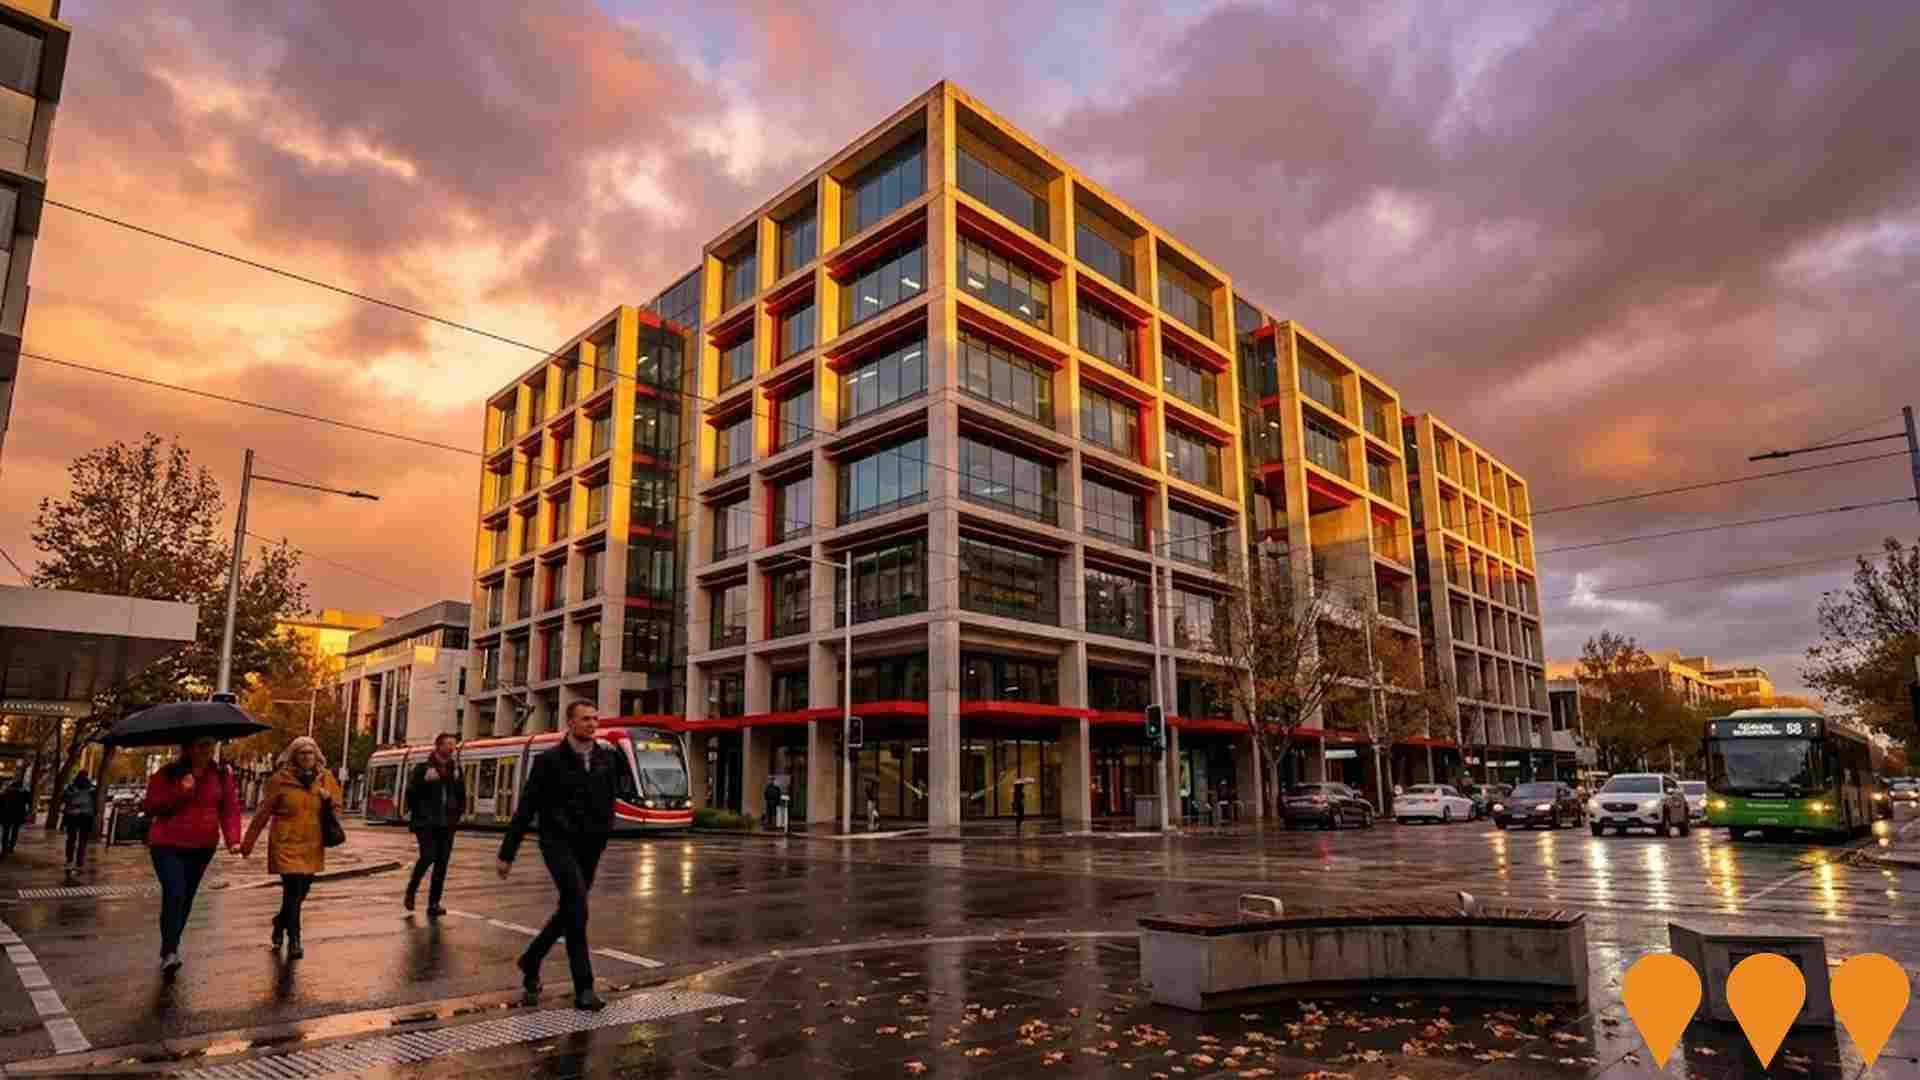
Marcus Clarke Street Office Complex
A 12-storey premium office complex designed to accommodate growing tech and professional services companies. Features flexible floor plates, end-of-trip facilities, and sustainable building technologies.
Academy Close Redevelopment - Campbell
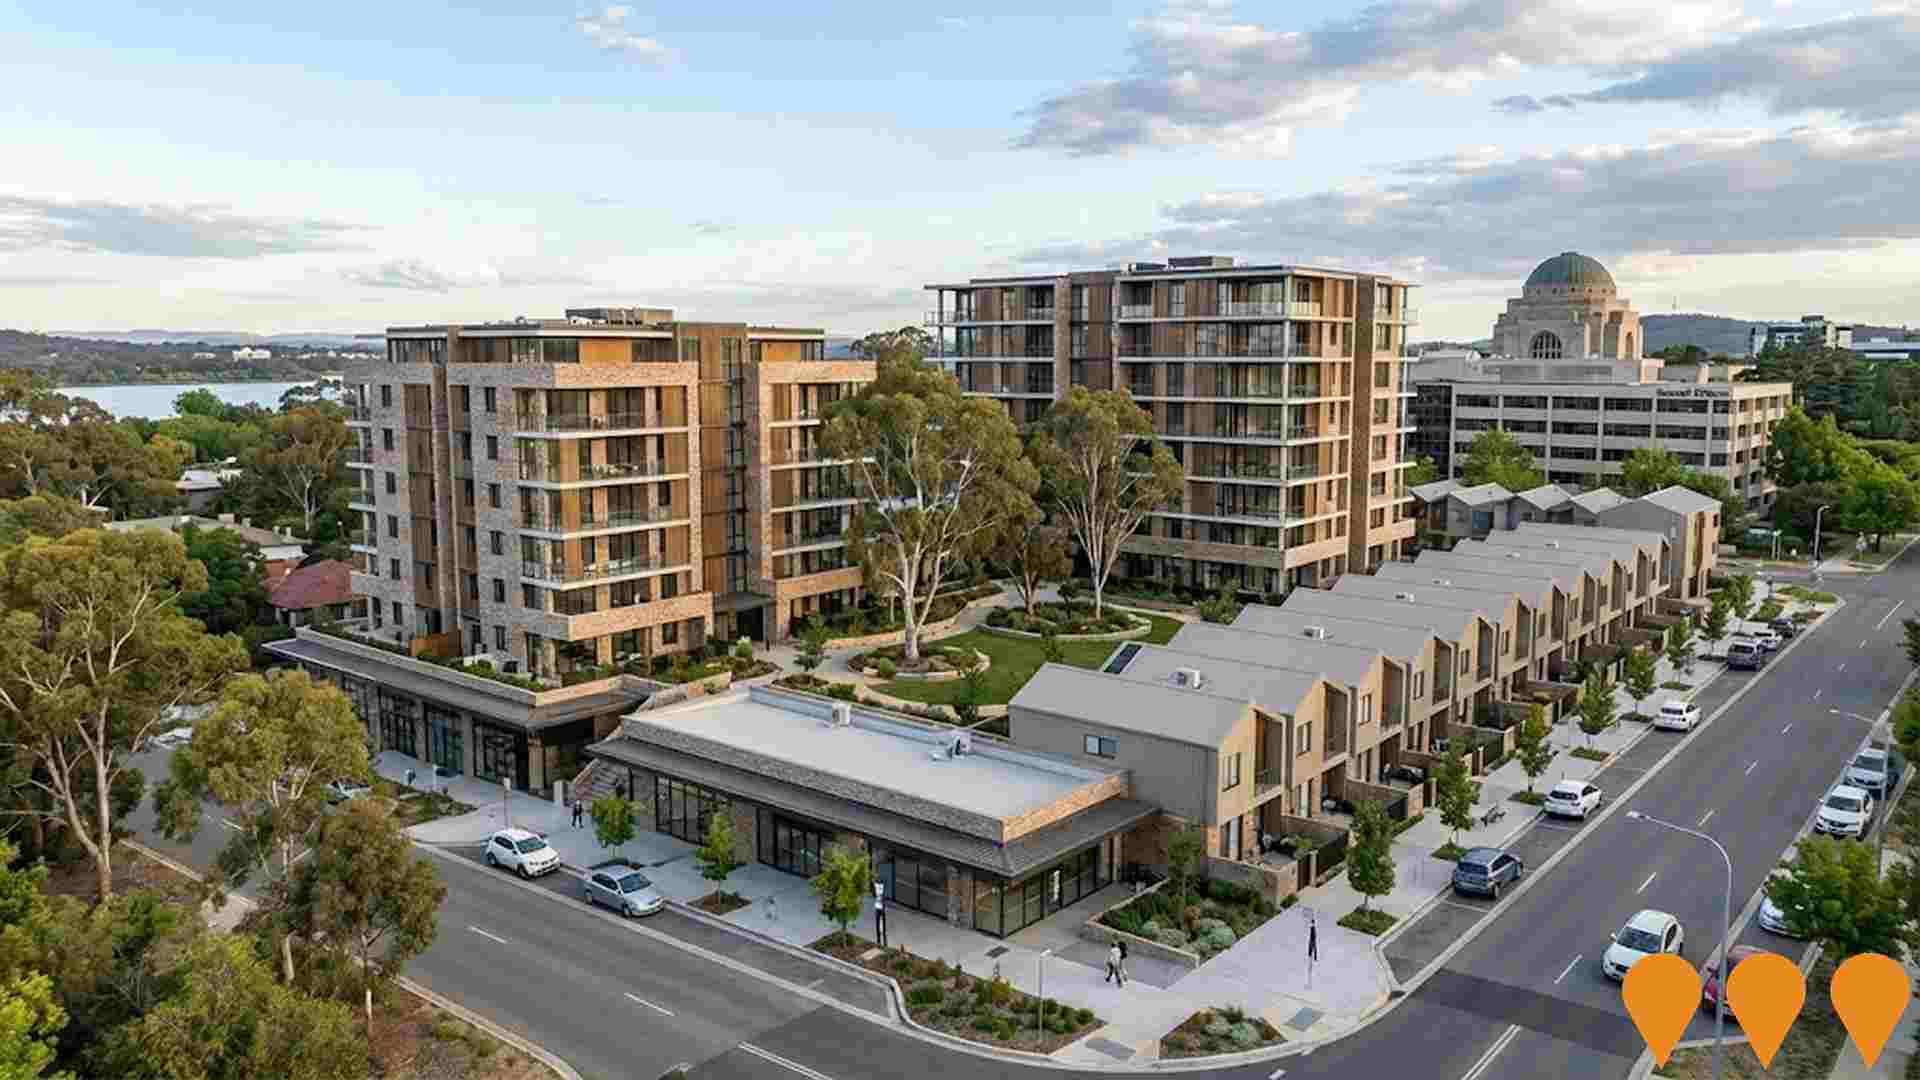
Premium residential development by Geocon featuring 198 apartments across two towers (6 and 7 storeys) plus 28 townhouses. Located near Australian War Memorial and Russell Offices with views of Lake Burley Griffin. Includes ground floor retail, basement parking, and landscaped courtyards.
Hassett Park Master Plan & Sportsground Upgrades, Campbell 5
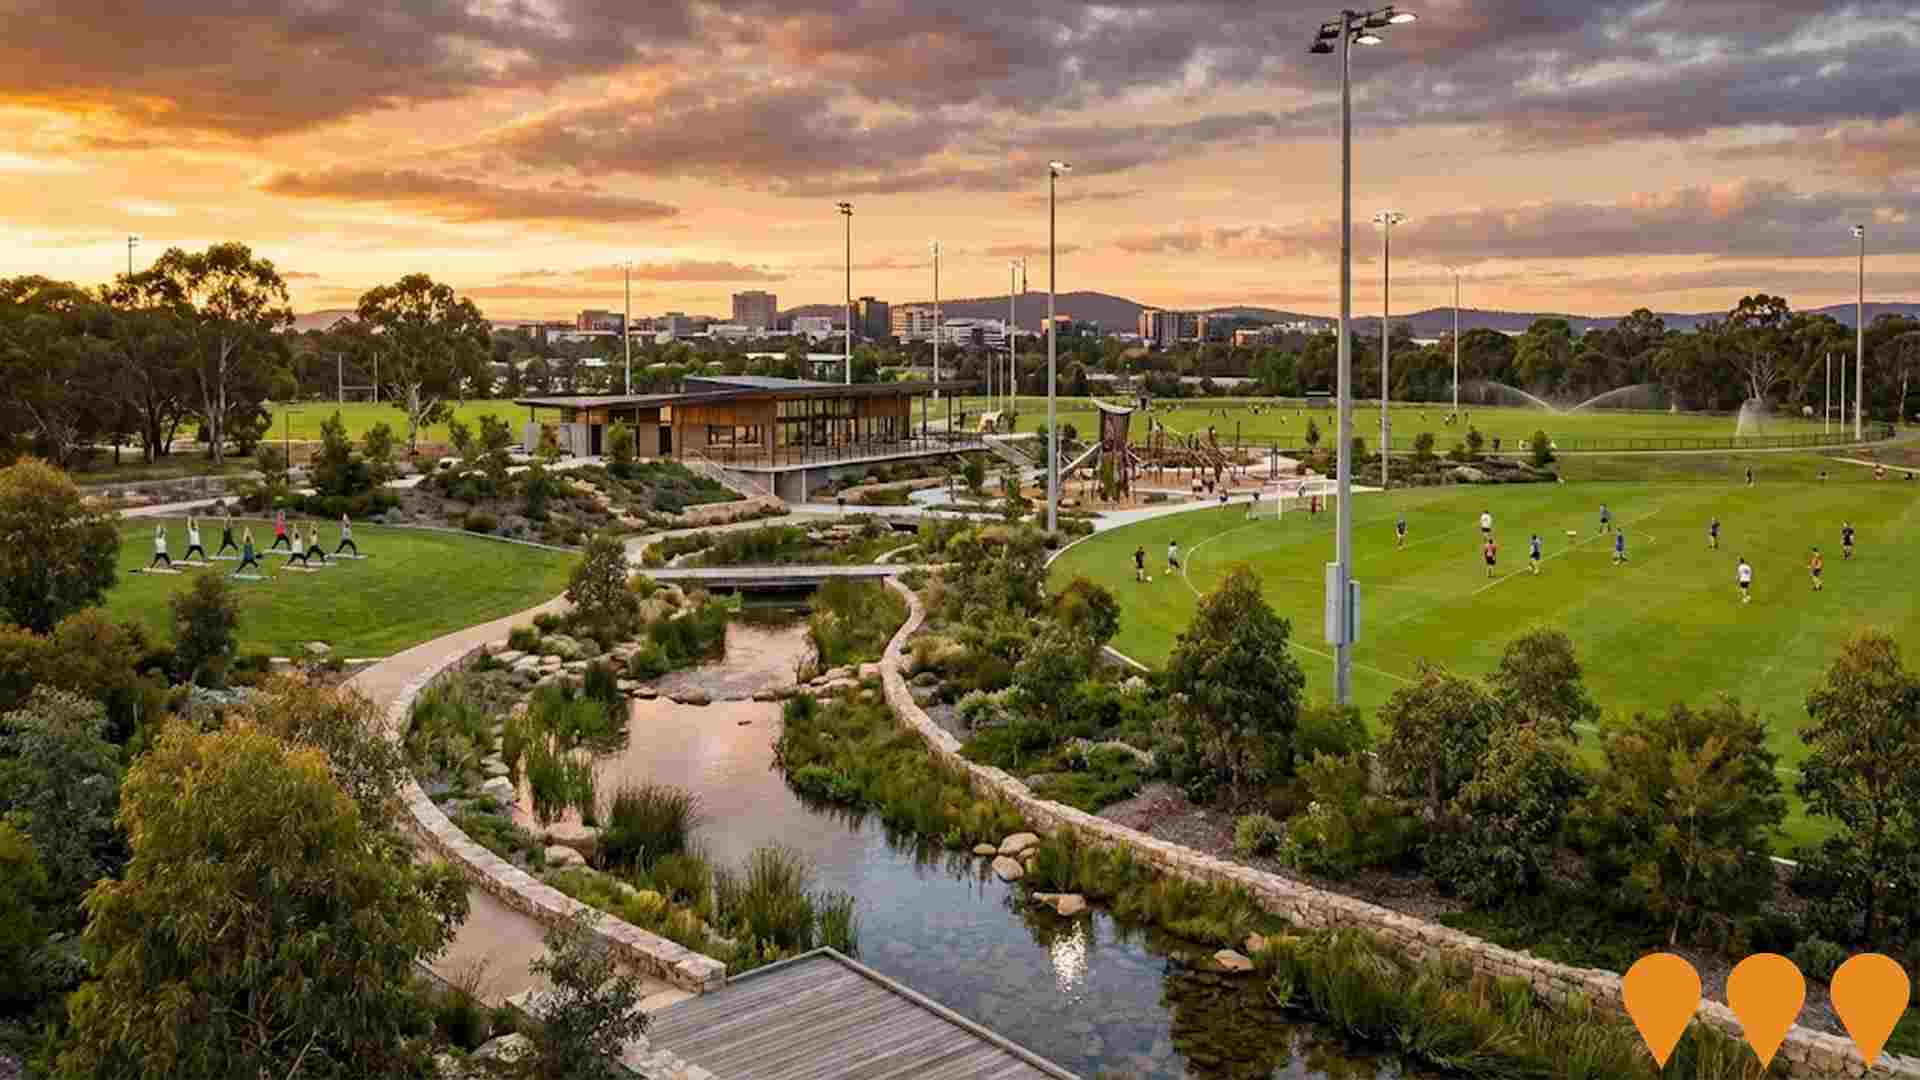
Major upgrade of Hassett Park in Campbell 5 precinct, which sets a new benchmark for public domain design on the urban fringe of Canberra. The park's design is structured around Water Sensitive Urban Design (WSUD) systems, including stormwater harvesting and treatment via a natural creek and wetlands for reuse in irrigation. The project includes new sportsground irrigation and lighting, pavilion refurbishment, and improved community open space. The park has various environments for diverse use, including children's play, exercise, active recreation, and gathering space.
Employment
Employment performance in Ainslie has been below expectations when compared to most other areas nationally
Ainslie has a highly educated workforce with strong representation in professional services. Its unemployment rate was 4.7% in the past year, with an estimated employment growth of 0.7%.
As of September 2025, 2,766 residents were employed, but the unemployment rate was higher than the Australian Capital Territory's (ACT) rate of 3.6%, at 1.1%. Workforce participation in Ainslie lagged behind ACT, at 62.1% compared to ACT's 69.6%. Key industries for employment among residents were public administration & safety, professional & technical, and education & training, while health care & social assistance was under-represented at 7.8%, compared to ACT's 11.7%.
Employment opportunities locally appeared limited based on Census data. Over the past year, employment increased by 0.7% alongside labour force growth of 1.0%, leading to a rise in unemployment rate by 0.3 percentage points. In contrast, ACT saw employment grow by 1.4%, labour force expand by 1.2%, and unemployment fall by 0.2 percentage points. State-level data from November 25 showed ACT employment grew by 1.19% year-on-year, adding 710 jobs, with the state unemployment rate at 4.5%. National employment forecasts from May-25 project national employment growth of 6.6% over five years and 13.7% over ten years. Applying these projections to Ainslie's employment mix suggests local employment should increase by 6.3% over five years and 12.9% over ten years.
Frequently Asked Questions - Employment
Income
The economic profile demonstrates exceptional strength, placing the area among the top 10% nationally based on comprehensive AreaSearch income analysis
According to AreaSearch's aggregation of ATO data released on 15 June 2022 for financial year 2022, the median income among taxpayers in Ainslie SA2 was $69,523 with an average level of $85,943. These figures are among the highest in Australia, compared to ACT levels of $68,678 and $83,634 respectively. Based on Wage Price Index growth of 13.6% since financial year 2022, current estimates for median income would be approximately $78,978 and average income would be around $97,631 as of September 2025. Census data shows that household, family and personal incomes in Ainslie rank highly nationally, between the 88th and 92nd percentiles. The earnings profile indicates that 32.9% of individuals earn above $4,000 weekly (1,767 individuals), differing from metropolitan regions where the $1,500 - $2,999 category is predominant at 34.3%. Notably, 43.9% of residents earn above $3,000 weekly, reflecting areas of prosperity that contribute to robust local economic activity. After housing costs, residents retain 86.8% of their income, indicating strong purchasing power and the area's SEIFA income ranking places it in the 9th decile.
Frequently Asked Questions - Income
Housing
Ainslie is characterized by a predominantly suburban housing profile, with above-average rates of outright home ownership
In Ainslie, as per the latest Census evaluation, 72.9% of dwellings were houses, with the remaining 27.1% comprising semi-detached homes, apartments, and other types. This contrasts with the Australian Capital Territory's figures of 39.3% houses and 60.7% other dwellings. Home ownership in Ainslie stood at 33.1%, with mortgaged properties accounting for 32.0% and rented dwellings making up 34.9%. The median monthly mortgage repayment in the area was $2,600, exceeding the Australian Capital Territory average of $2,080. The median weekly rent in Ainslie was recorded at $367, compared to the Australian Capital Territory's figure of $476. Nationally, Ainslie's mortgage repayments were significantly higher than the Australian average of $1,863, while rents were lower than the national figure of $375.
Frequently Asked Questions - Housing
Household Composition
Ainslie features high concentrations of group households, with a higher-than-average median household size
Family households account for 63.3% of all households, consisting of 29.6% couples with children, 23.4% couples without children, and 9.4% single parent families. Non-family households make up the remaining 36.7%, with lone person households at 29.9% and group households comprising 6.7% of the total. The median household size is 2.5 people, which is larger than the Australian Capital Territory average of 2.2.
Frequently Asked Questions - Households
Local Schools & Education
Ainslie shows strong educational performance, ranking in the upper quartile nationally when assessed across multiple qualification and achievement indicators
Educational attainment in Ainslie is notable with 59.1% of residents aged 15+ holding university qualifications, exceeding the national average of 30.4% and the SA4 region's 46.8%. Bachelor degrees are the most prevalent at 29.8%, followed by postgraduate qualifications (21.9%) and graduate diplomas (7.4%). Vocational pathways account for 15.7% of qualifications, with advanced diplomas at 7.0% and certificates at 8.7%. Educational participation is high, with 31.6% of residents currently enrolled in formal education, including 10.2% in tertiary, 9.4% in primary, and 6.8% in secondary education.
Educational participation is notably high, with 31.6% of residents currently enrolled in formal education. This includes 10.2% in tertiary education, 9.4% in primary education, and 6.8% pursuing secondary education.
Frequently Asked Questions - Education
Schools Detail
Nearby Services & Amenities
Transport
Transport servicing is moderate compared to other areas nationally based on assessment of service frequency, route connectivity and accessibility
Transport analysis indicates 35 active stops operating in Ainslie, with a mix of bus services. These stops are served by 6 individual routes, collectively offering 380 weekly passenger trips. Transport accessibility is rated excellent, with residents typically located 179 meters from the nearest stop.
Service frequency averages 54 trips per day across all routes, equating to approximately 10 weekly trips per individual stop.
Frequently Asked Questions - Transport
Transport Stops Detail
Health
Health performance in Ainslie is lower than average with common health conditions somewhat prevalent across both younger and older age cohorts
Ainslie has notable health challenges, with common conditions prevalent across various age groups. Private health cover is high at approximately 63% of its total population (3,399 people), compared to the national average of 55.3%.
Mental health issues and asthma are the most common medical conditions, affecting 11.1 and 8.3% of residents respectively. However, 64.5% of residents report being completely clear of medical ailments, compared to 70.8% in the Australian Capital Territory. The area has a higher proportion of seniors aged 65 and over at 21.5% (1,154 people), compared to the Australian Capital Territory's 11.4%. Health outcomes among seniors present challenges broadly similar to those of the general population.
Frequently Asked Questions - Health
Cultural Diversity
In terms of cultural diversity, Ainslie records figures broadly comparable to the national average, as found in AreaSearch's assessment of a number of language and cultural background related metrics
Ainslie's population showed above-average cultural diversity, with 22.7% born overseas and 13.1% speaking a language other than English at home. Christianity was the predominant religion in Ainslie, comprising 33.8% of its population. Notably, Judaism was overrepresented in Ainslie compared to the Australian Capital Territory, making up 0.8% versus 0.5%.
The top three ancestral groups were English (27.4%), Australian (23.6%), and Irish (11.2%). Some ethnic groups showed notable divergences: Hungarian was at 0.5%, Scottish at 9.5%, and Welsh at 0.8%, compared to regional figures of 0.3%, 8.1%, and 0.7% respectively.
Frequently Asked Questions - Diversity
Age
Ainslie's median age exceeds the national pattern
Ainslie has a median age of 42, which is higher than the Australian Capital Territory figure of 35 and also significantly higher than Australia's median age of 38 years. Compared to the Australian Capital Territory average, the 65-74 cohort is notably over-represented in Ainslie at 10.7%, while the 25-34 year-olds are under-represented at 11.8%. Between 2021 and present day, the 75 to 84 age group has grown from 5.8% to 7.0% of the population, and the 65 to 74 cohort increased from 9.6% to 10.7%. Conversely, the 85+ cohort has declined from 4.6% to 3.8%. Demographic modeling suggests that Ainslie's age profile will evolve significantly by 2041. The 75 to 84 age cohort is projected to see notable expansion, with an increase of 100 people (27%) from 377 to 478. Notably, the combined 65+ age groups are expected to account for 83% of total population growth, reflecting the area's aging demographic profile. Meanwhile, the 0 to 4 and 35 to 44 cohorts are expected to experience population declines.
