Chart Color Schemes
This analysis uses ABS Statistical Areas Level 2 (SA2) boundaries, which can materially differ from Suburbs and Localities (SAL) even when sharing similar names.
SA2 boundaries are defined by the Australian Bureau of Statistics and are designed to represent communities for statistical reporting (e.g., census and ERP).
Suburbs and Localities (SAL) represent commonly-used suburb/locality names (postal-style areas) and may use different geographic boundaries. For comprehensive analysis, consider reviewing both boundary types if available.
est. as @ -- *
ABS ERP | -- people | --
2021 Census | -- people
Sales Activity
Curious about local property values? Filter the chart to assess the volume and appreciation (including resales) trends and regional comparisons, or scroll to the map below view this information at an individual property level.
Find a Recent Sale
Sales Detail
Population
Lyneham lies within the top quartile of areas nationally for population growth performance according to AreaSearch analysis of recent, and medium to long-term trends
Lyneham's population is approximately 6,517 as of November 2025. From the 2021 Census, which reported a population of 5,703 people, there has been an increase of 814 people (14.3%). This growth is inferred from the estimated resident population of 5,877 in June 2024 and an additional 454 validated new addresses since the Census date. The population density ratio is 1,189 persons per square kilometer, comparable to averages seen across locations assessed by AreaSearch. Lyneham's growth rate of 14.3% since the 2021 census exceeds both the state average (5.9%) and the SA4 region, making it a growth leader in the area. Overseas migration was the primary driver of population gains during recent periods.
AreaSearch uses ABS/Geoscience Australia projections for each SA2 area, released in 2024 with a base year of 2022. For areas not covered by this data and years post-2032, age group growth rates from the ACT Government's SA2 area projections are adopted, using 2022 as a base year. Future population trends indicate a significant increase in the top quartile of national statistical areas. By 2041, based on the latest annual ERP population numbers, Lyneham is expected to expand by 2,513 persons, reflecting an overall increase of 28.7% over the 17-year period.
Frequently Asked Questions - Population
Development
AreaSearch assessment of residential development activity positions Lyneham among the top 25% of areas assessed nationwide
Lyneham has averaged approximately 122 new dwelling approvals per year. Over the past five financial years, from FY-21 to FY-25, a total of 614 homes were approved, with an additional 50 approved so far in FY-26. The average number of people moving to Lyneham for each dwelling built over these years is 0.3 per year.
This suggests that new supply is meeting or exceeding demand, providing ample buyer choice and creating capacity for population growth beyond current forecasts. The average construction value of new homes is $331,000, which is moderately above regional levels, indicating an emphasis on quality construction. In FY-26, $7.8 million in commercial development approvals have been recorded, reflecting the area's residential character. Compared to the Australian Capital Territory, Lyneham shows 55.0% higher new home approvals per person, offering buyers greater choice. This activity is well above the national average, reflecting strong developer confidence in the area. Recent construction comprises approximately 2.0% detached houses and 98.0% townhouses or apartments, marking a significant shift from existing housing patterns (currently 27.0% houses). This focus on higher-density living creates more affordable entry points for downsizers, investors, and first-home buyers.
With around 109 people per dwelling approval, Lyneham exhibits characteristics of a growth area. Looking ahead, the latest AreaSearch quarterly estimate projects that Lyneham will grow by approximately 1,871 residents through to 2041. At current development rates, new housing supply should comfortably meet demand, providing good conditions for buyers and potentially supporting growth beyond current population projections.
Frequently Asked Questions - Development
Infrastructure
Lyneham has emerging levels of nearby infrastructure activity, ranking in the 27thth percentile nationally
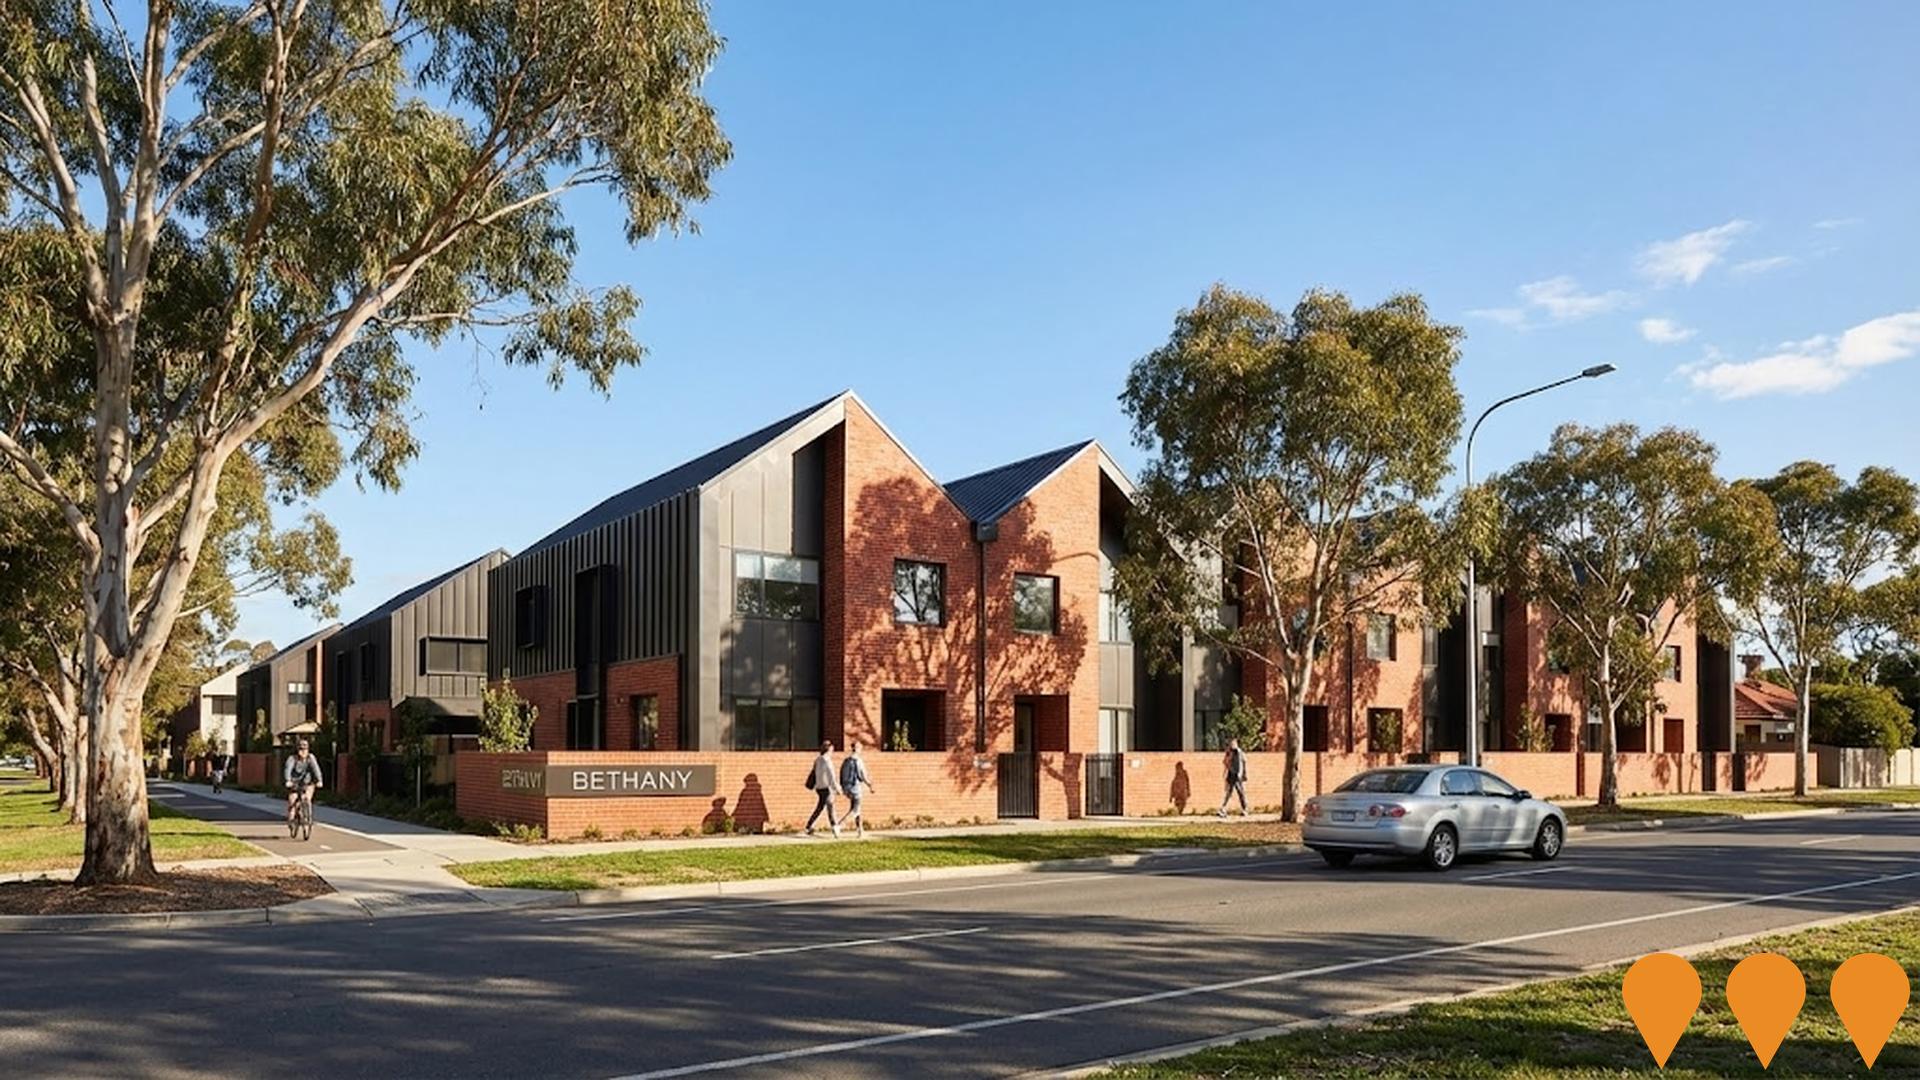
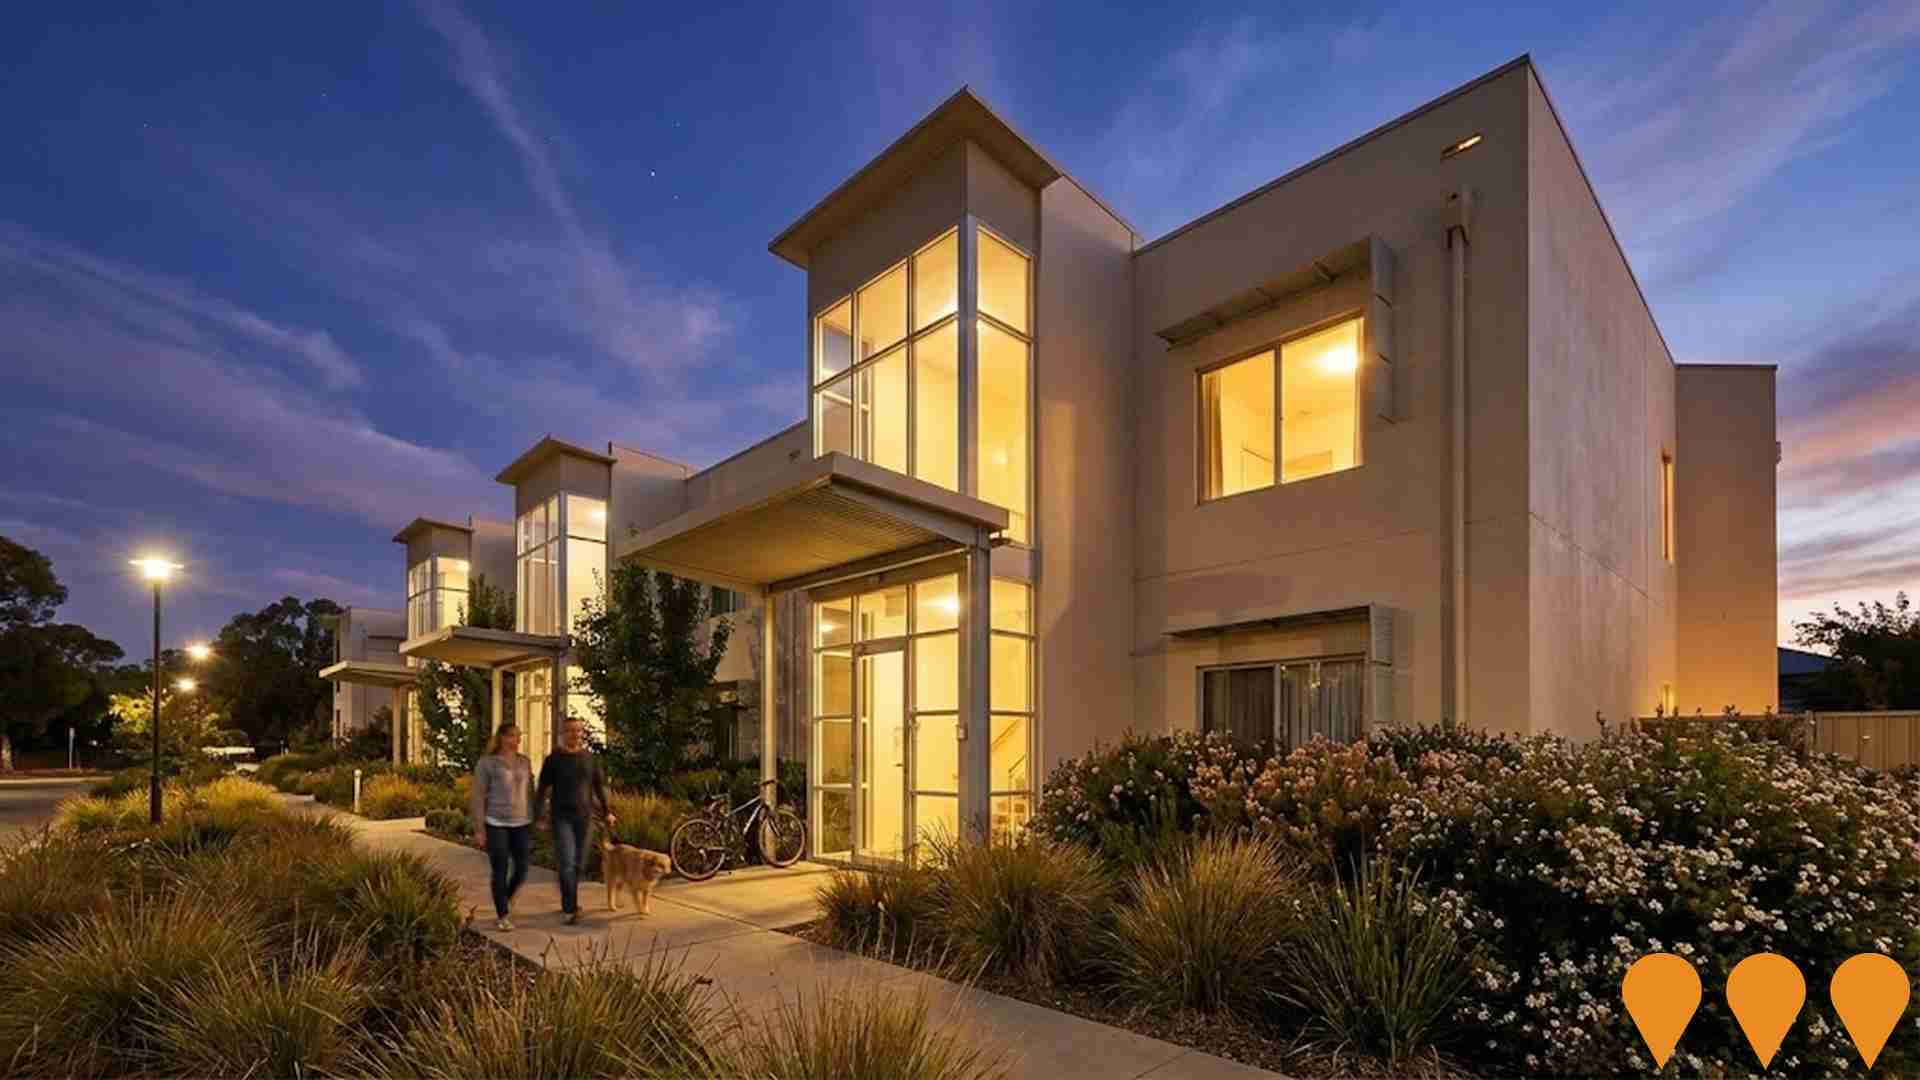
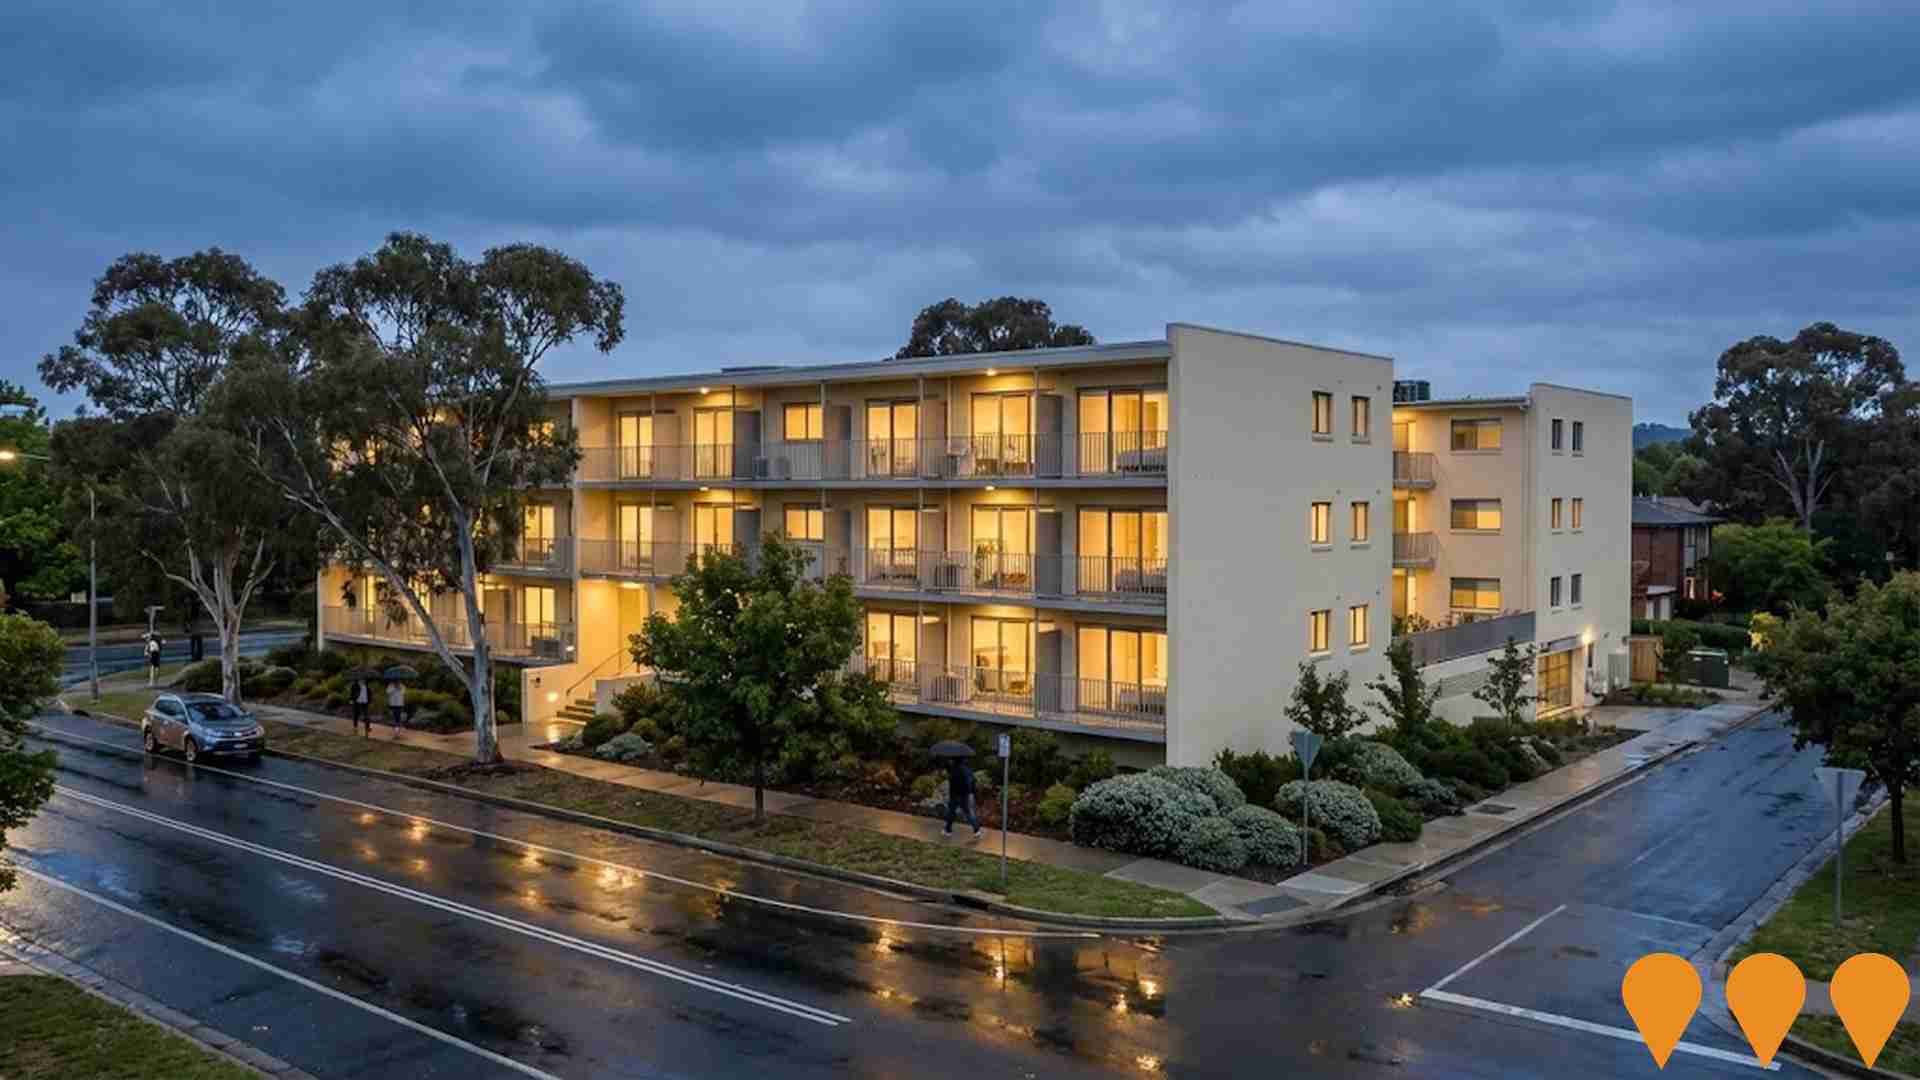
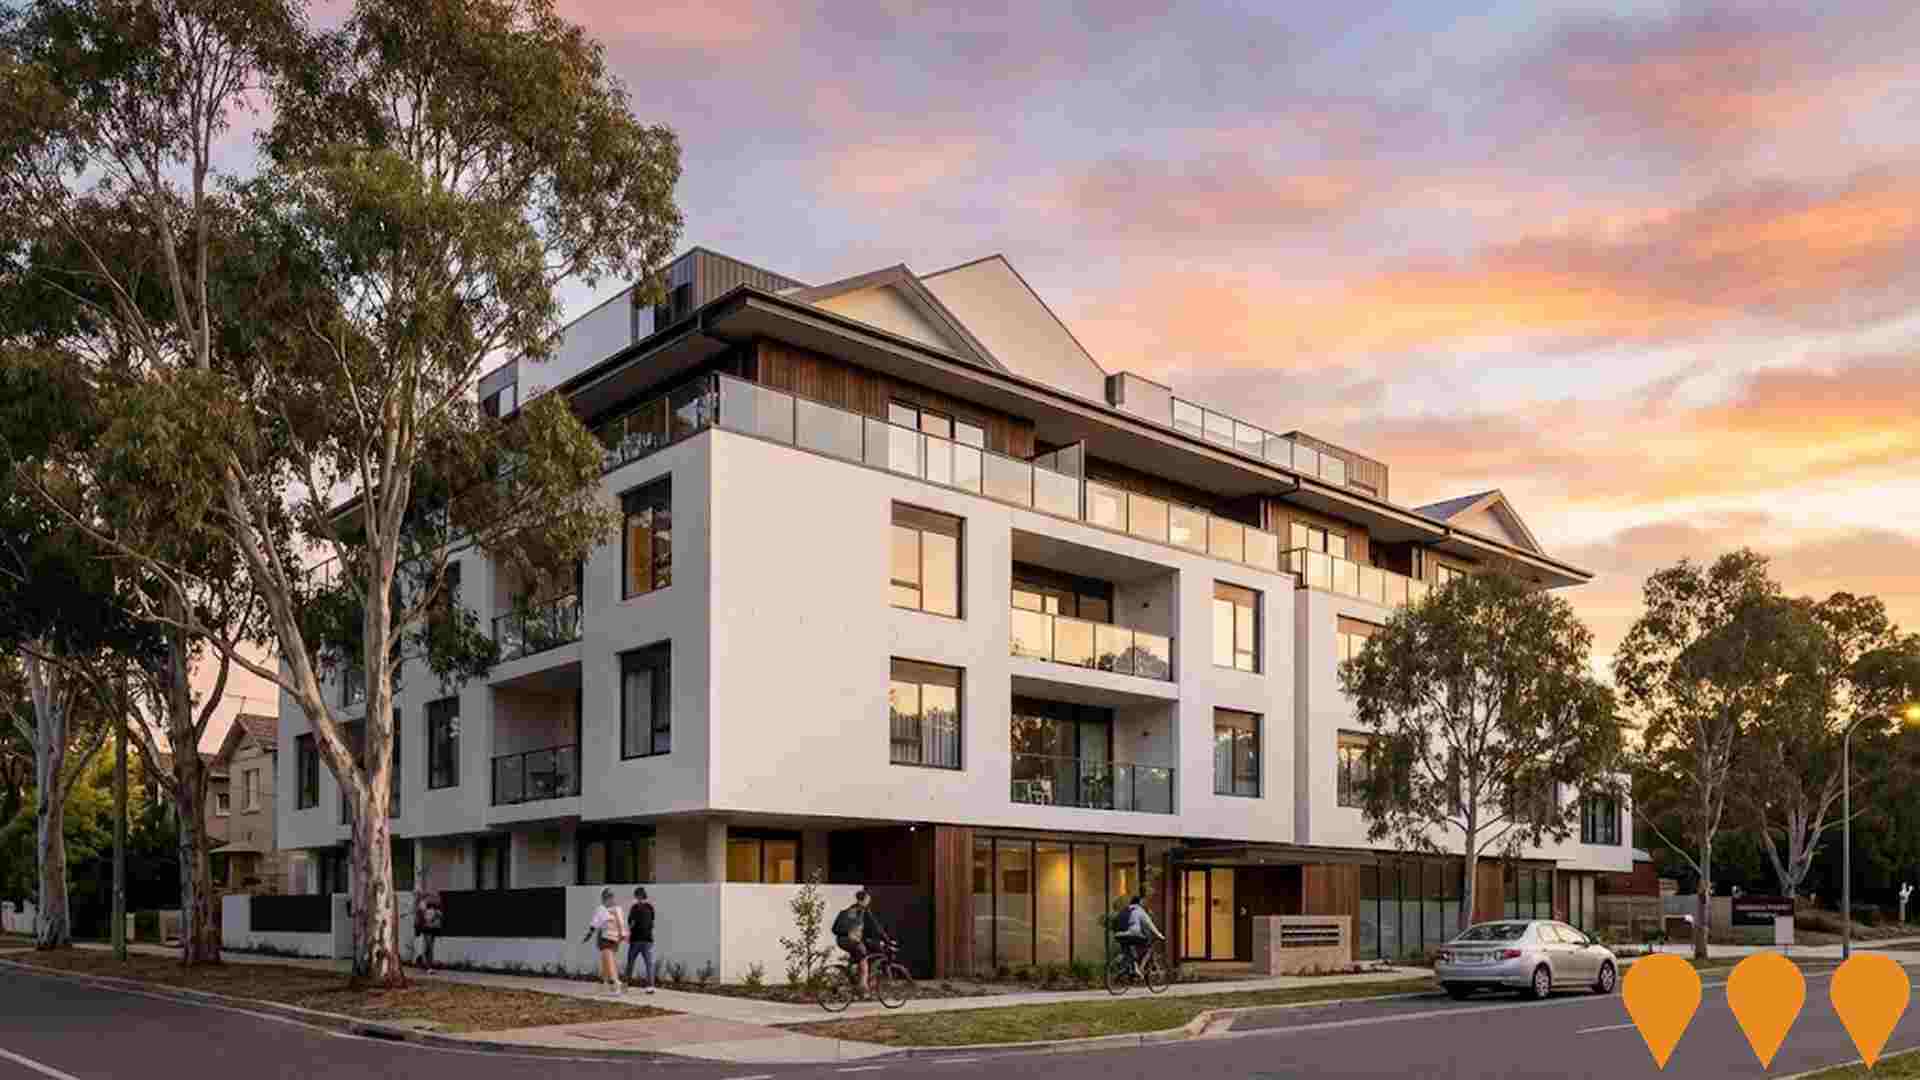
Changes to local infrastructure significantly impact an area's performance. AreaSearch has identified 32 projects likely affecting the region. Notable ones include Yowani Grounds Estate Development, Residential Project In Lyneham, Fox Place Multi-Unit Development, and Watson Solar Farm. The following list details those most relevant.
Professional plan users can use the search below to filter and access additional projects.
INFRASTRUCTURE SEARCH
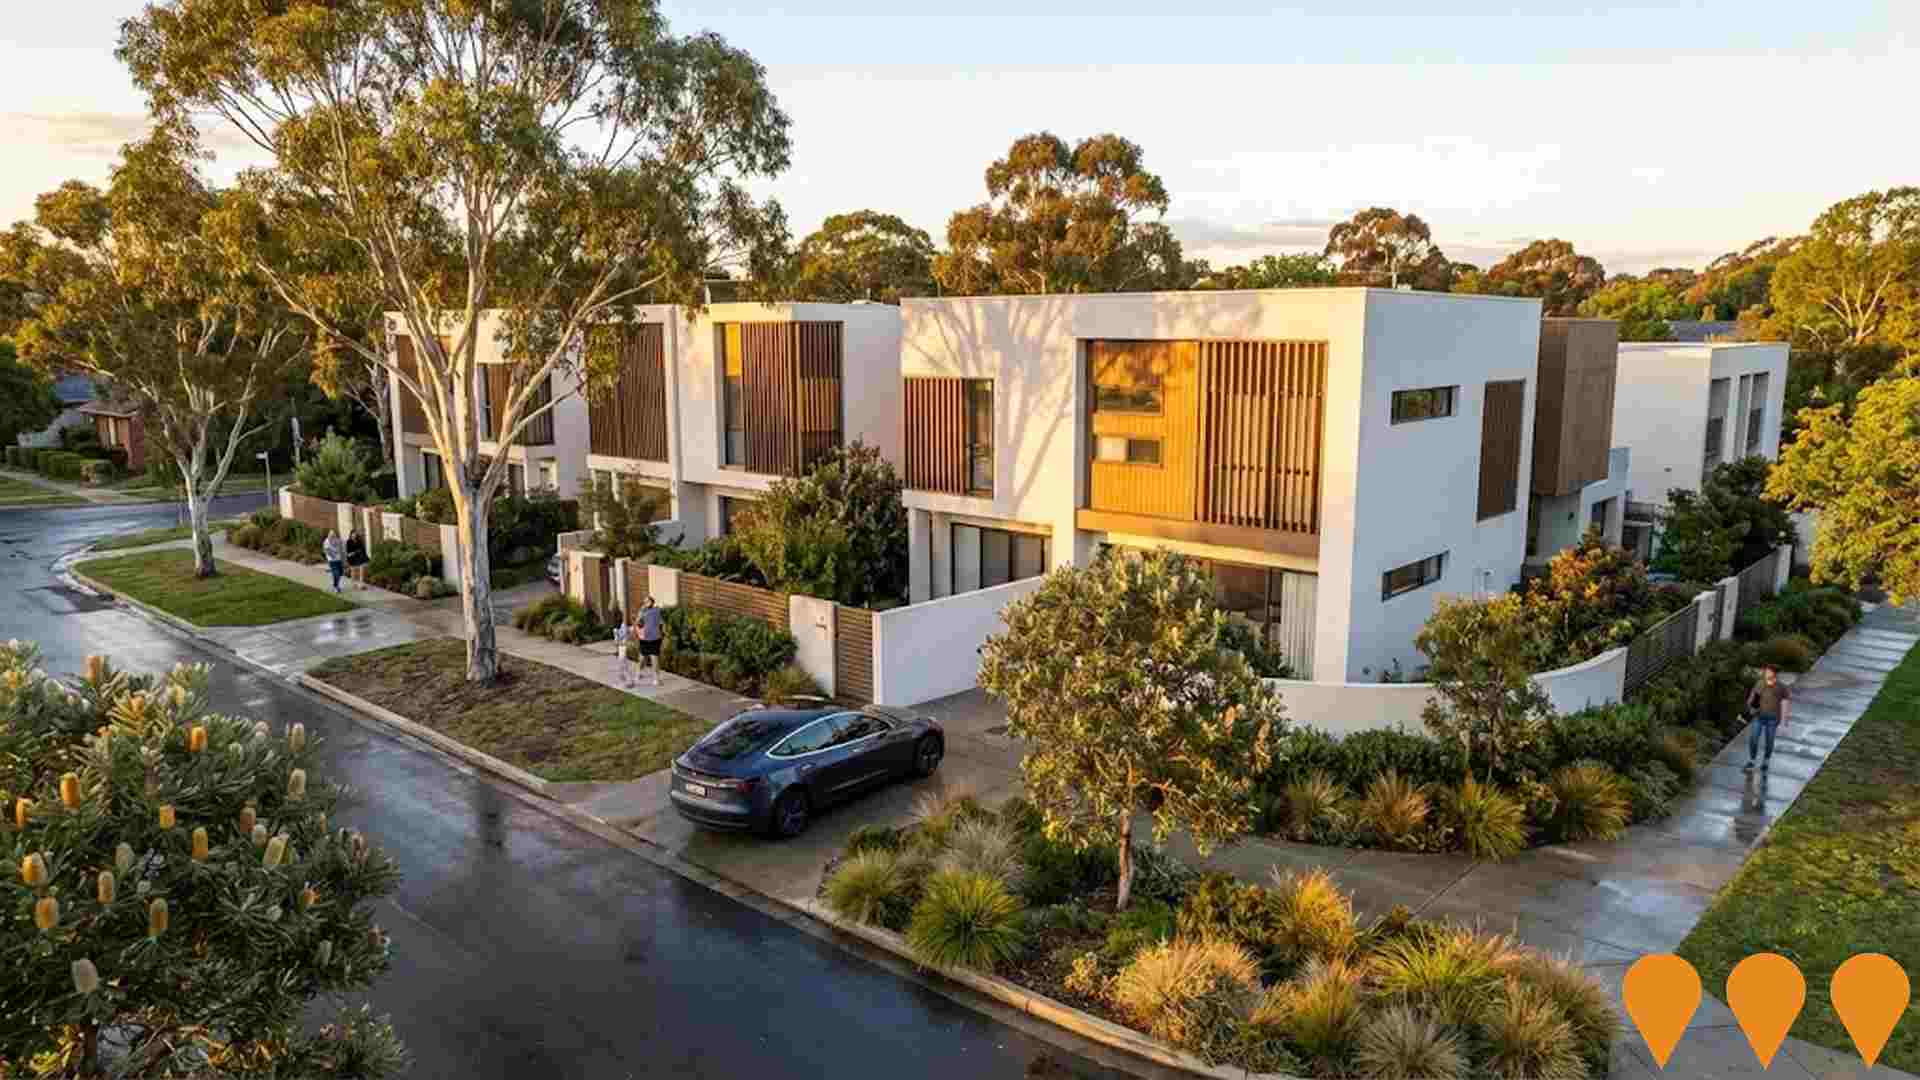
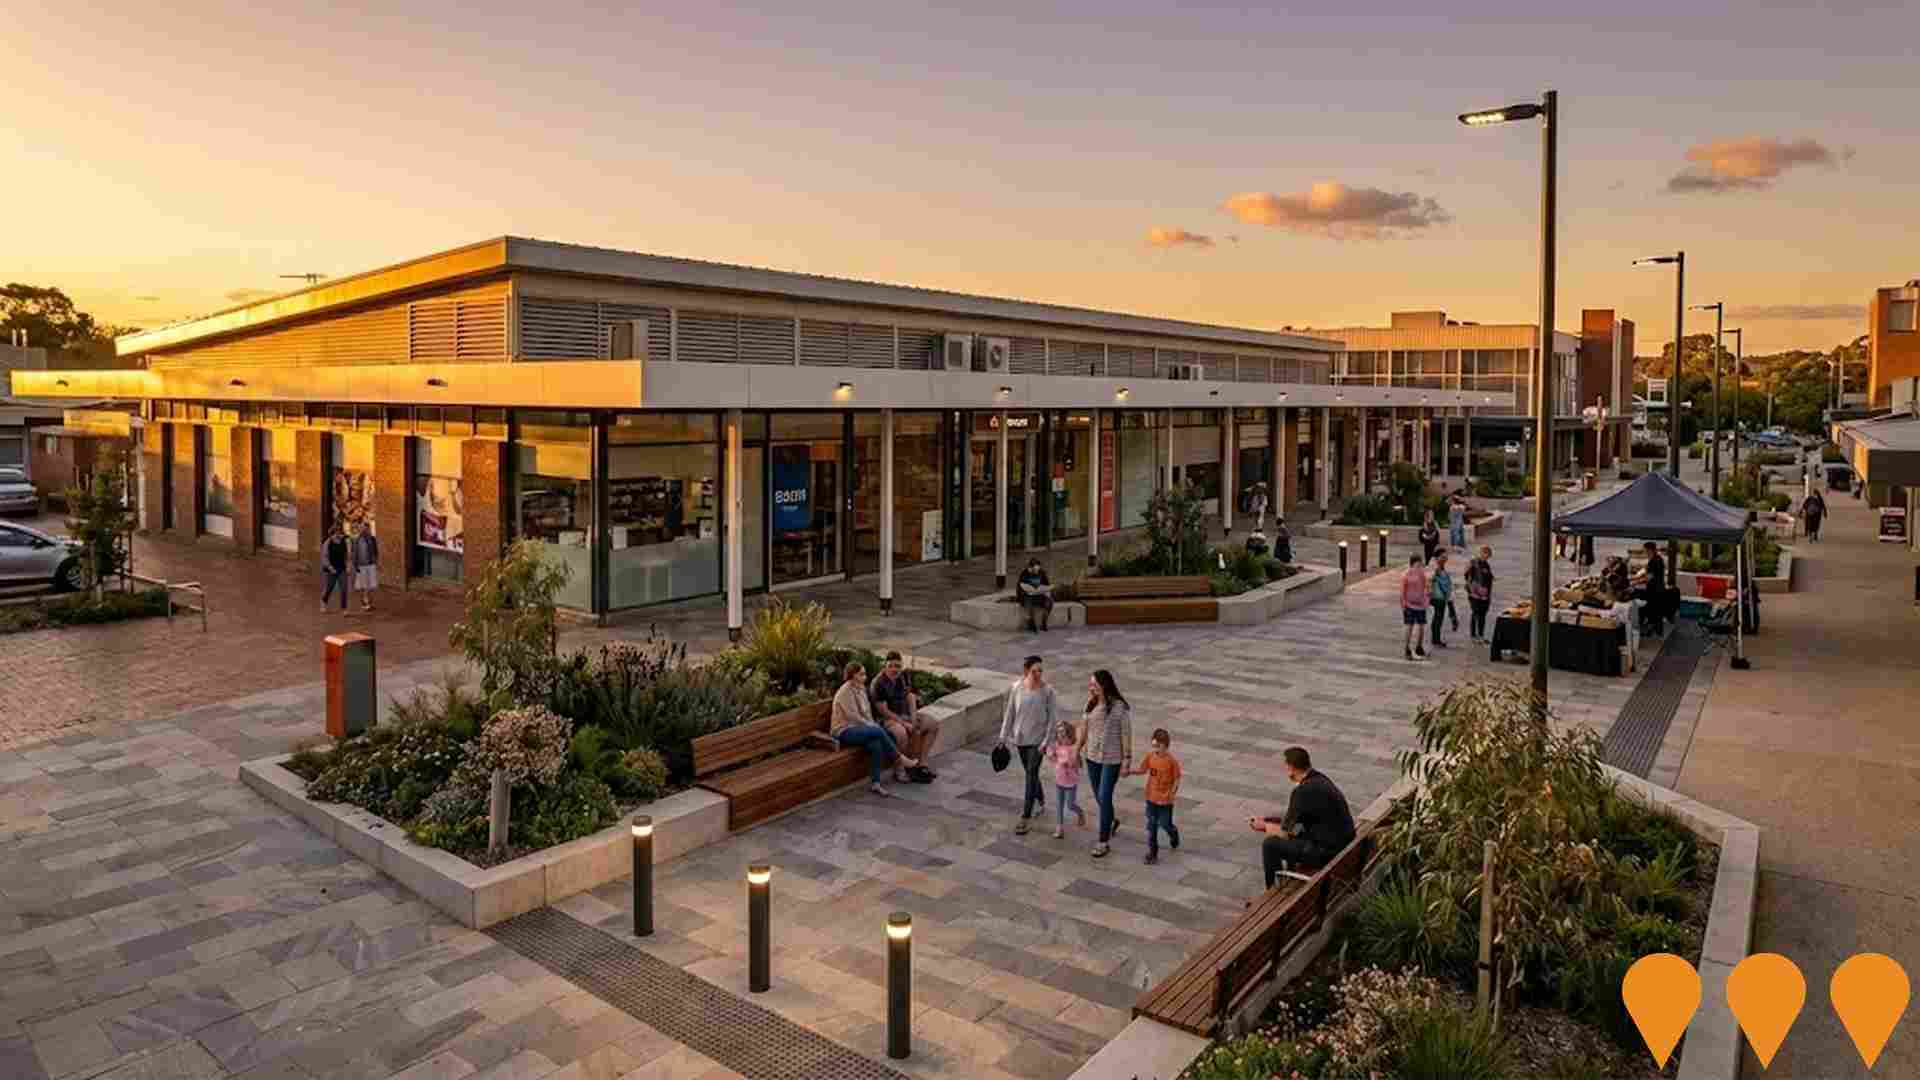
 Denotes AI-based impression for illustrative purposes only, not to be taken as definitive under any circumstances. Please follow links and conduct other investigations from the project's source for actual imagery. Developers and project owners wishing us to use original imagery please Contact Us and we will do so.
Frequently Asked Questions - Infrastructure
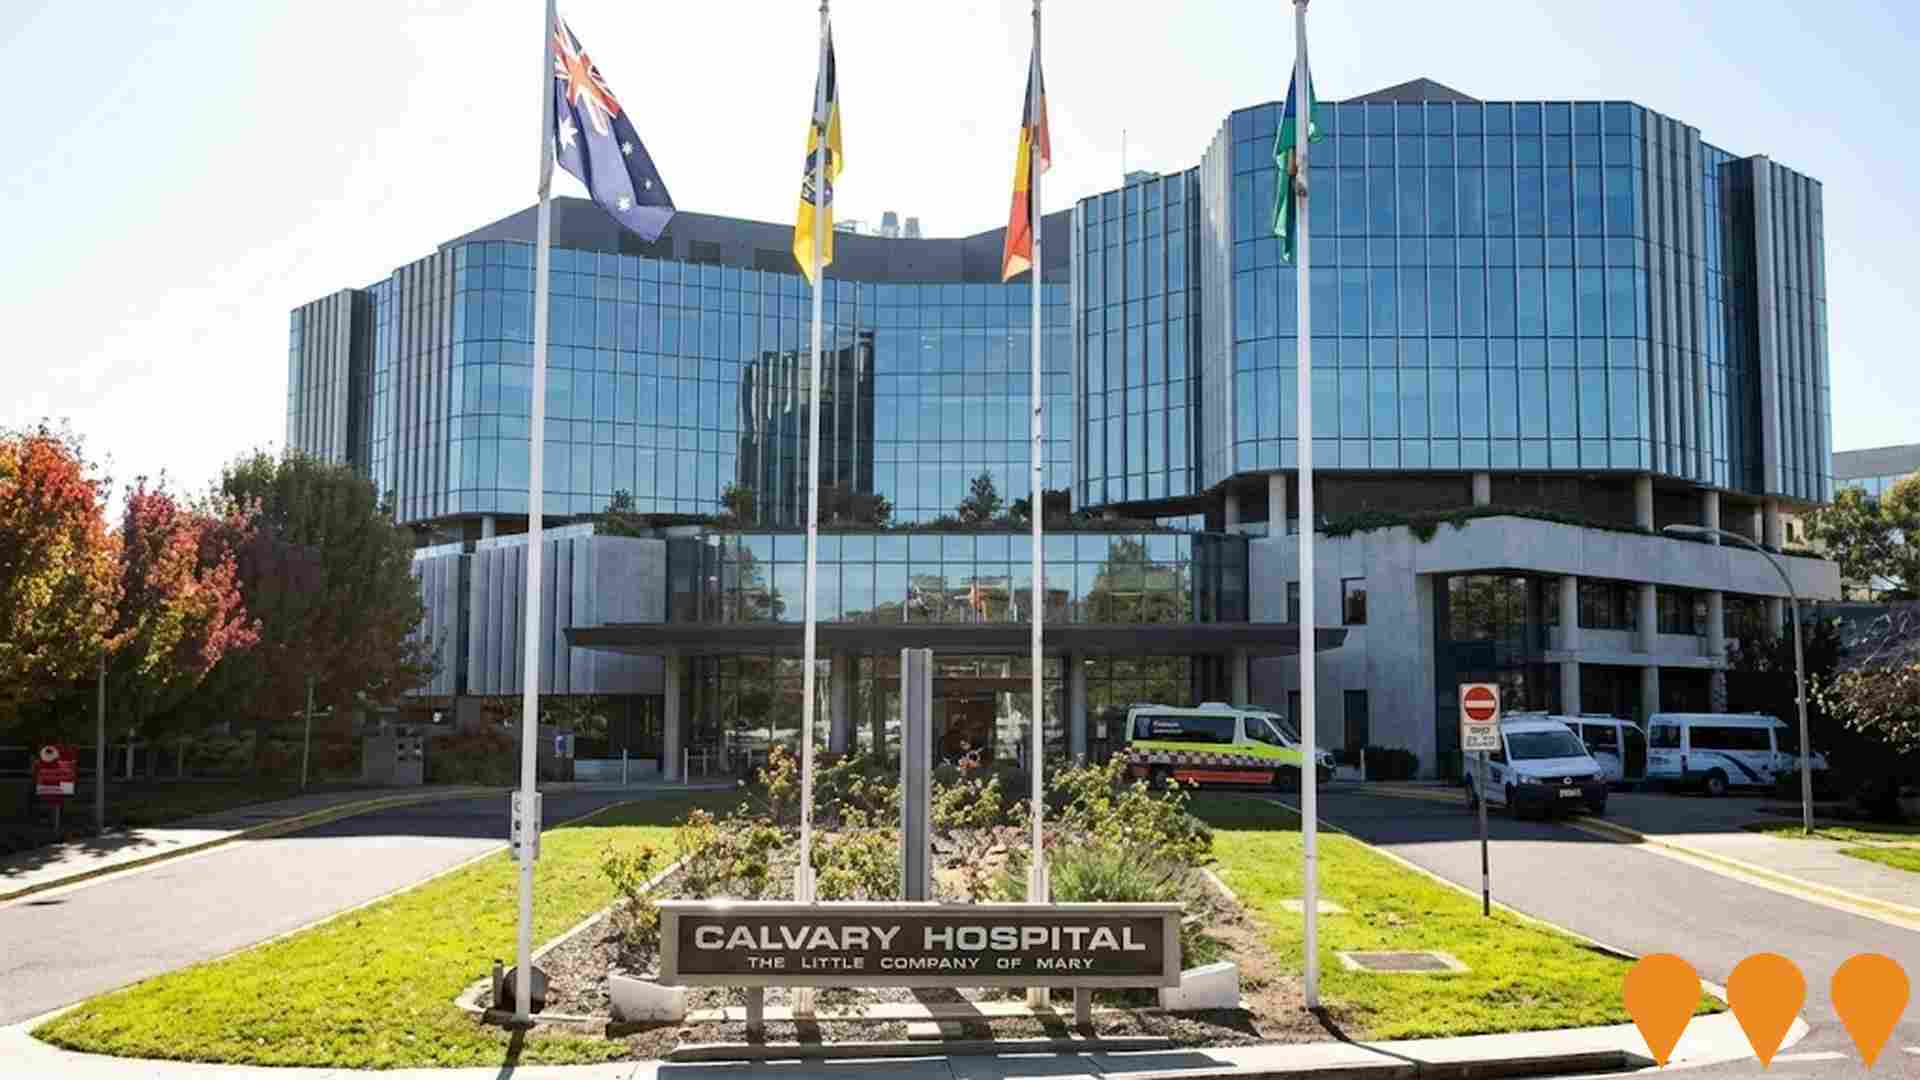
New Northside Hospital (North Canberra Hospital Redevelopment)
Development of a new major tertiary hospital on the existing North Canberra Hospital campus (formerly Calvary Public Hospital). The project involves an investment of over $1 billion to construct a new state-of-the-art clinical services building, expanded emergency department, and modern inpatient facilities to replace aging infrastructure.
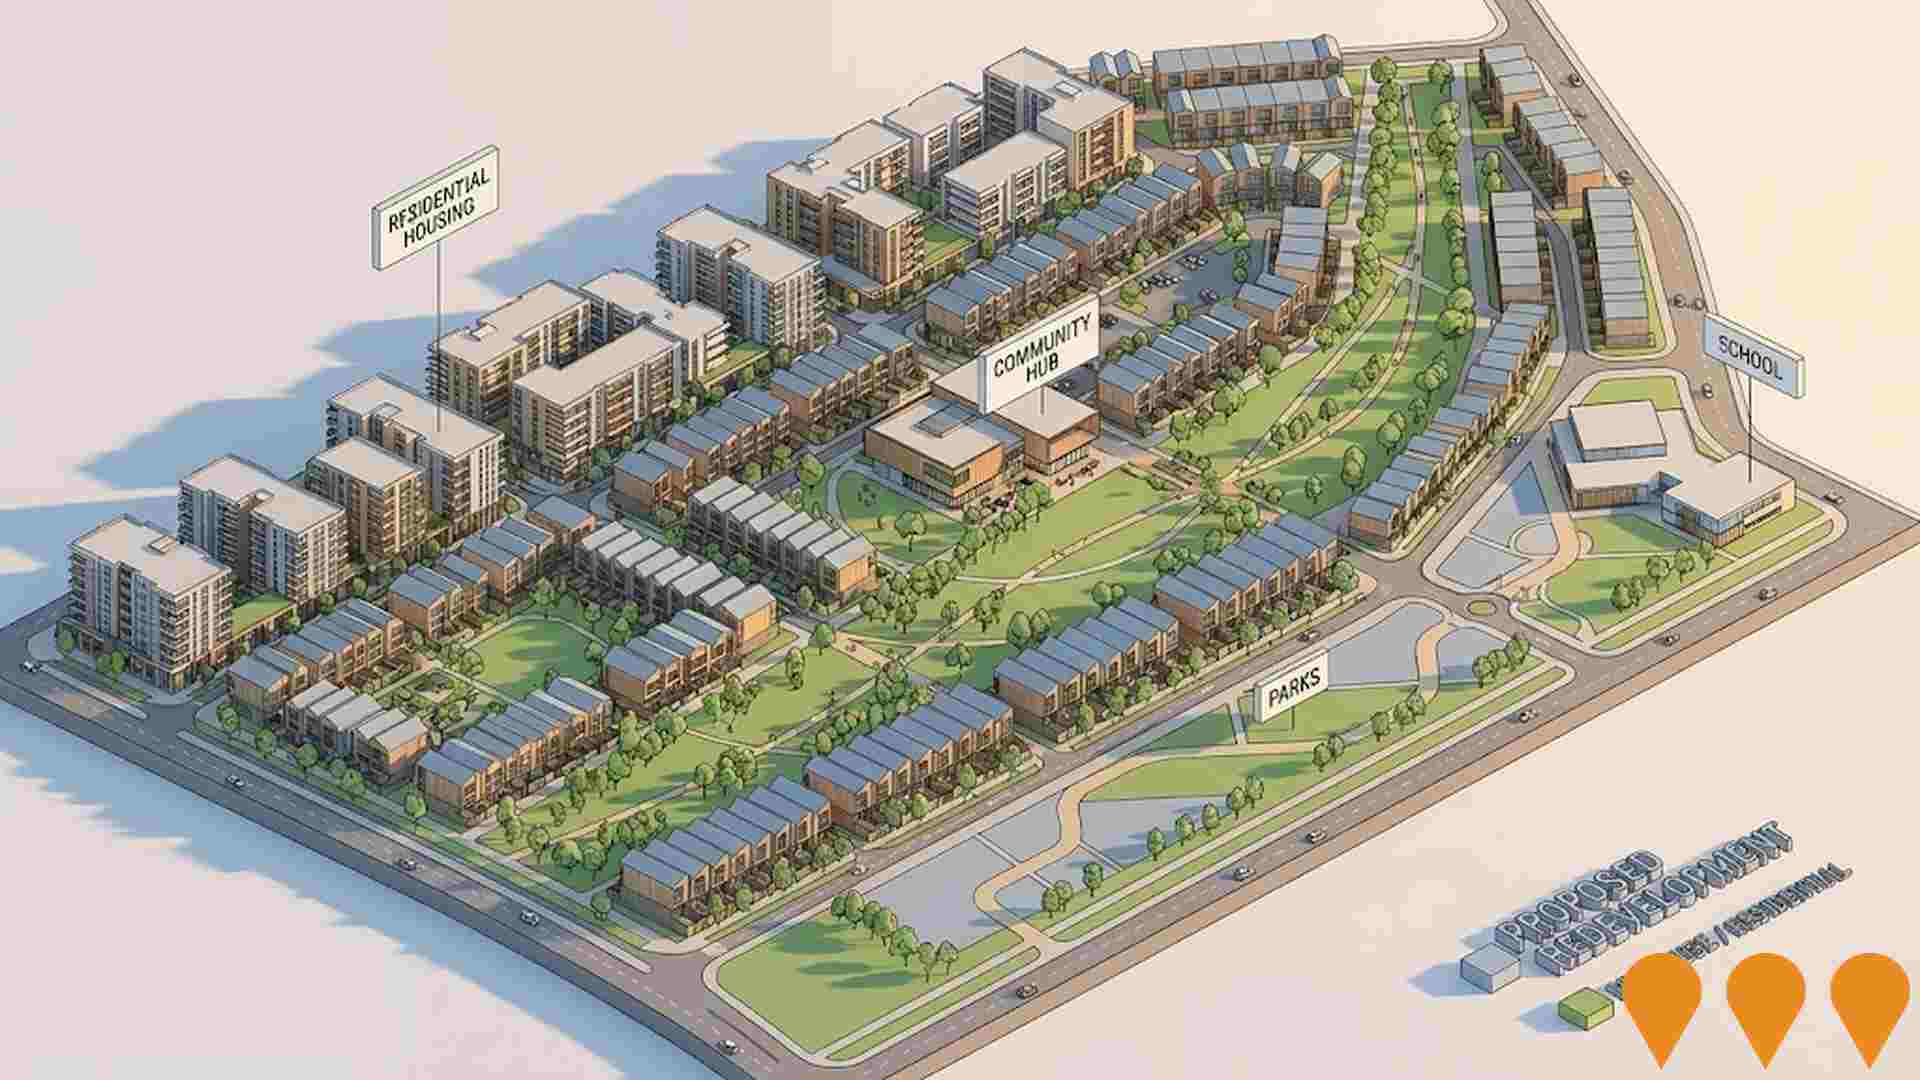
Thoroughbred Park Redevelopment Proposal
Political proposal by the ACT Greens (2024 election policy) to compulsorily acquire Thoroughbred Park (Canberra Racecourse) in Lyneham and redevelop the 58-hectare site into a new residential suburb for approximately 10,000 residents. The plan includes up to 5,000 new homes (with 540 public/community housing dwellings), Common Ground supportive housing, a retirement village, school, health facilities, community hall, environmental hub, parks, local shops and offices. Racing would be relocated elsewhere in the ACT.
Yowani Grounds Estate Development
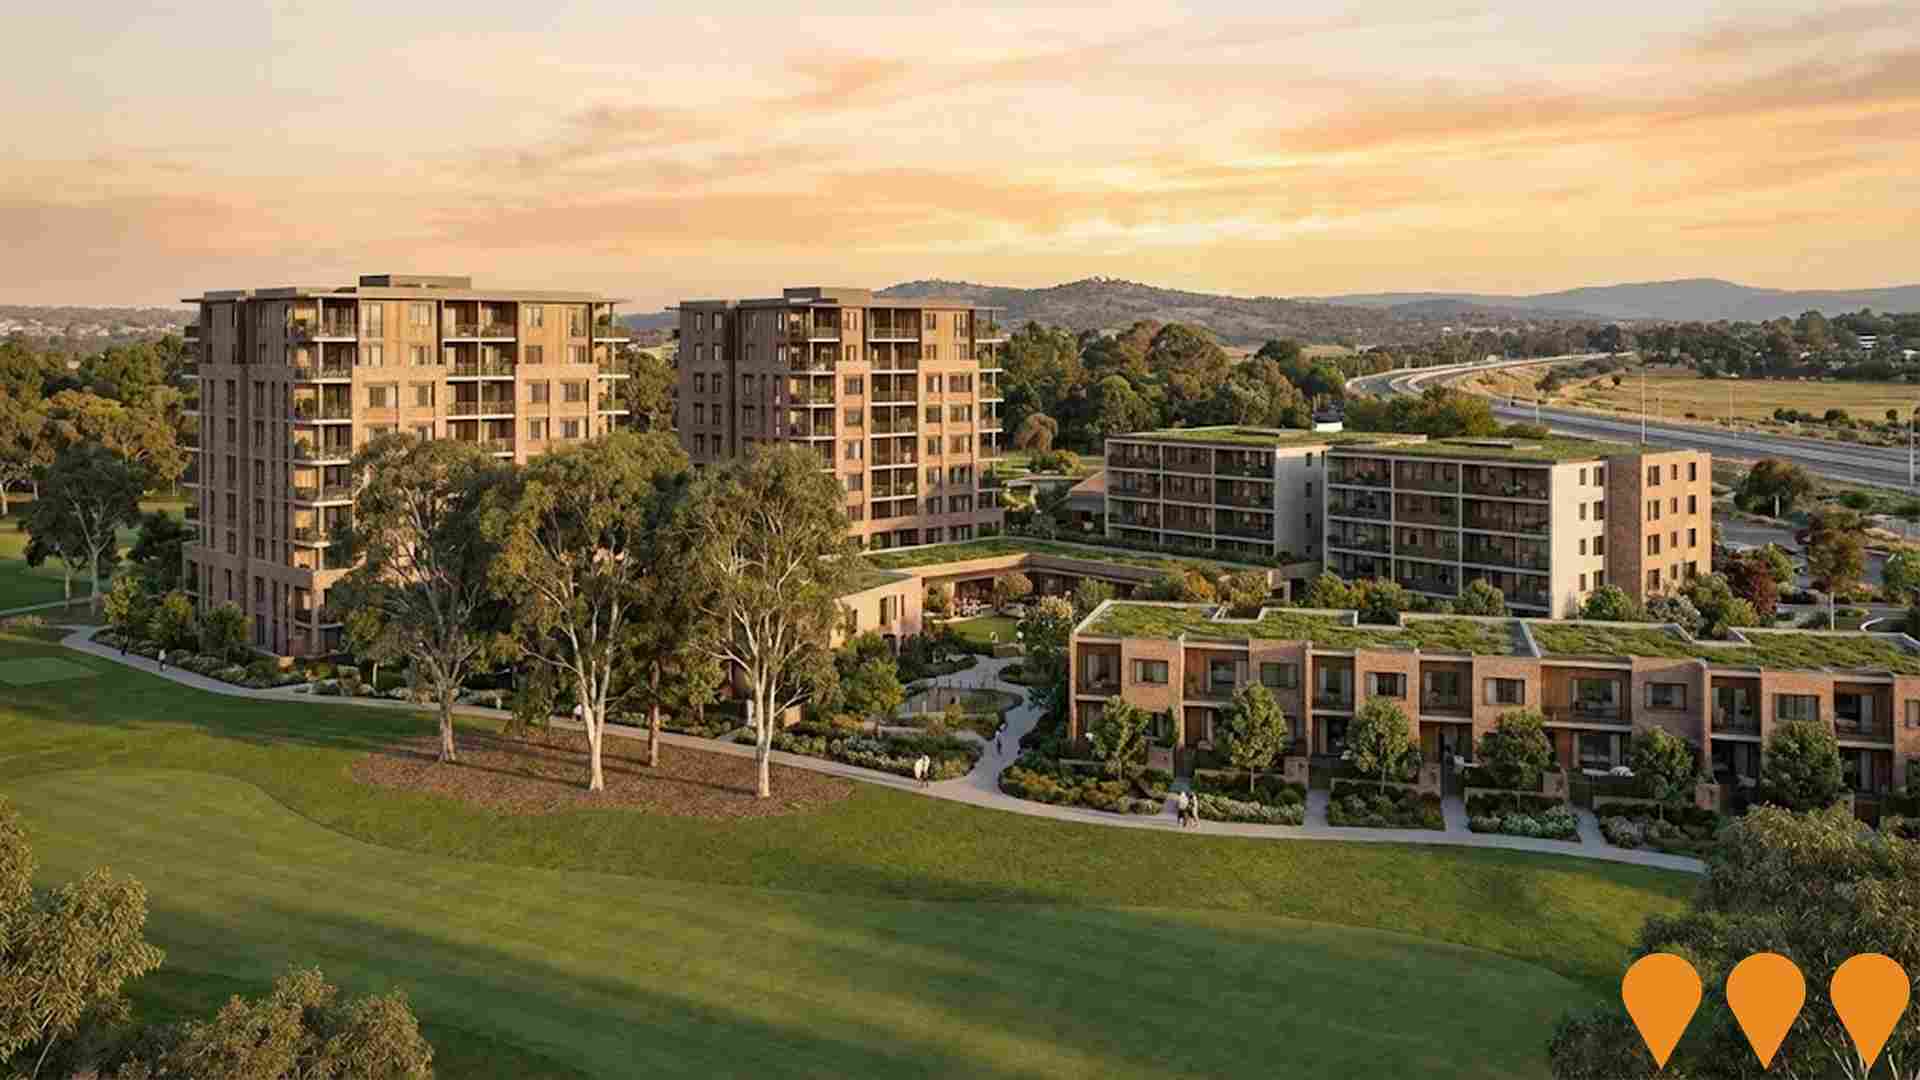
A mixed-use precinct redevelopment of Yowani Country Club, featuring two six-storey residential towers with 72 apartments and a central courtyard, plus a two-building six-storey apartment complex with 94 dwellings including apartments, townhouses, and penthouses, and 10 adjacent two-storey townhouses. Includes two basement parking levels, golf course views, and proximity to paths and open spaces. Designed by AMC Architecture and Cox Architecture.
Watson Place Precinct Redevelopment
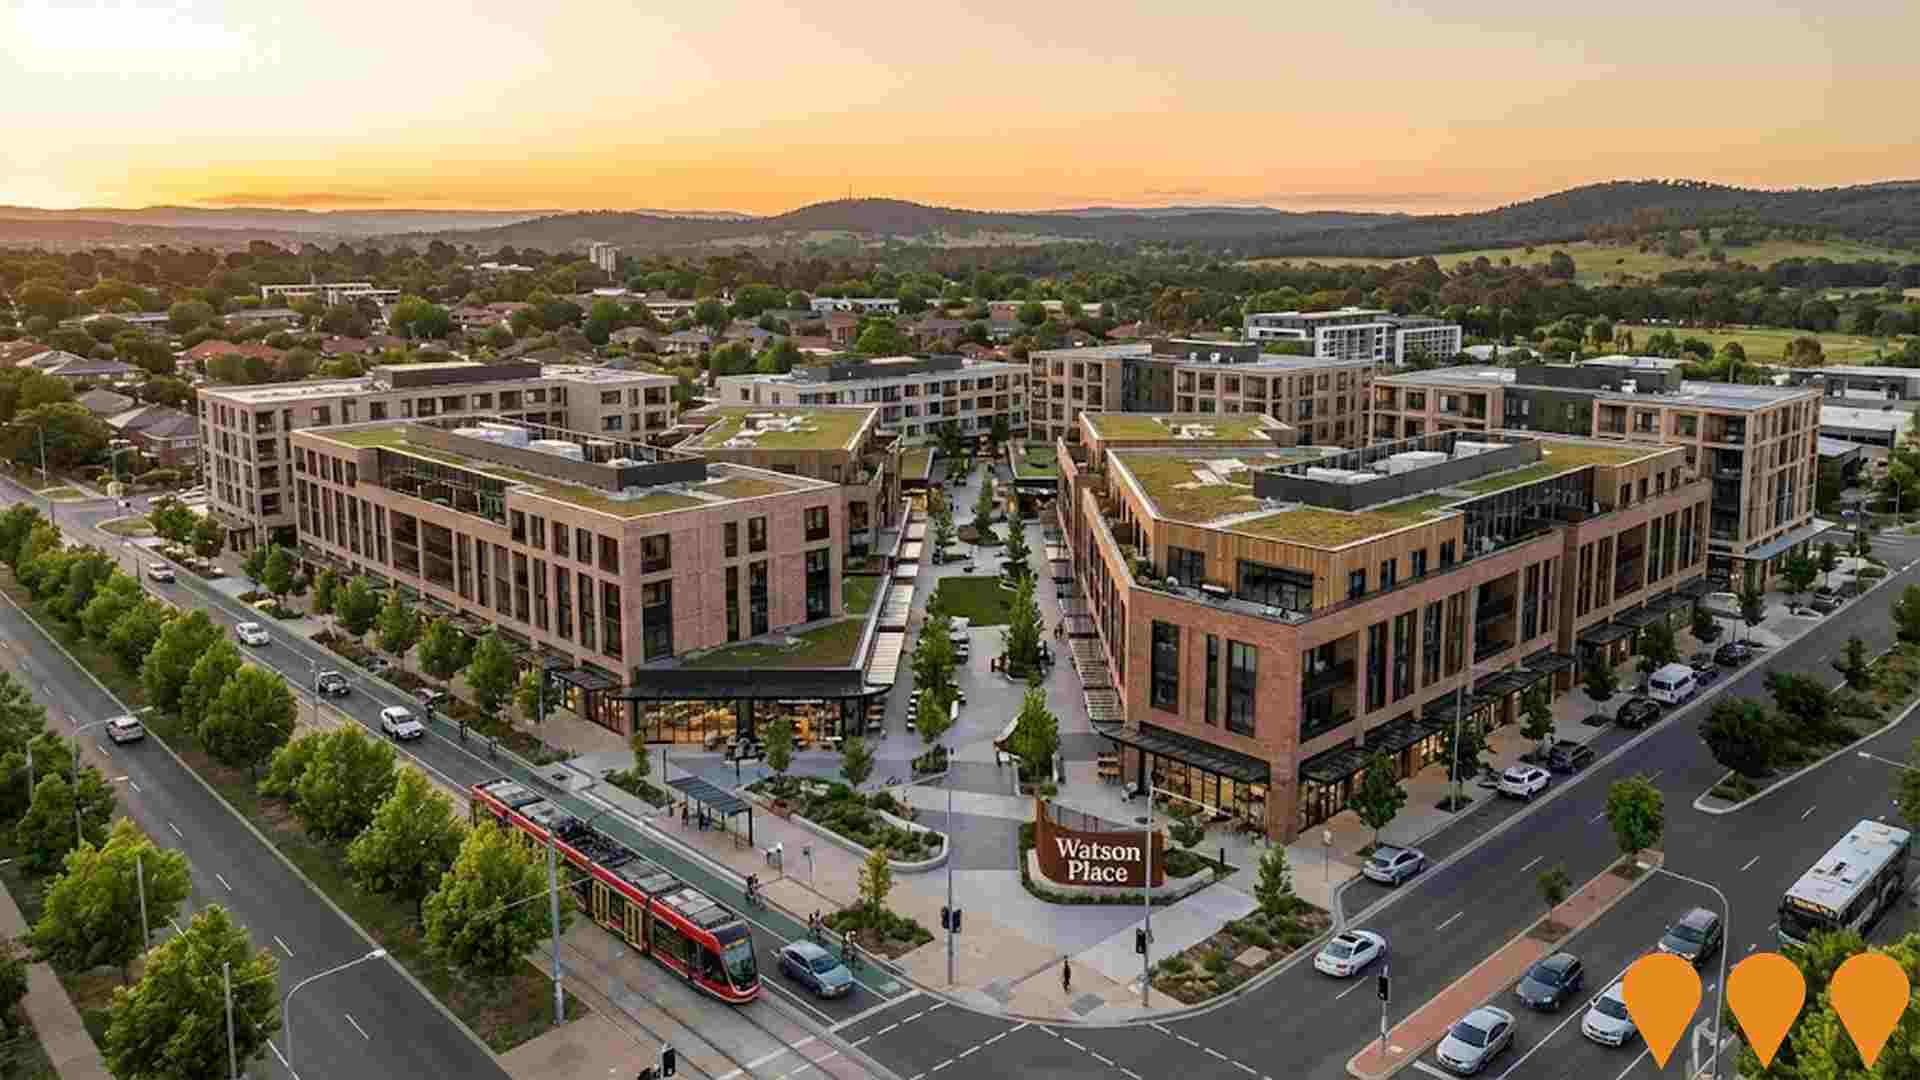
ACT Government-led master-planned renewal of the Watson local centre including new mixed-use buildings, upgraded public realm, additional retail and up to 200 new dwellings.
Watson Solar Farm
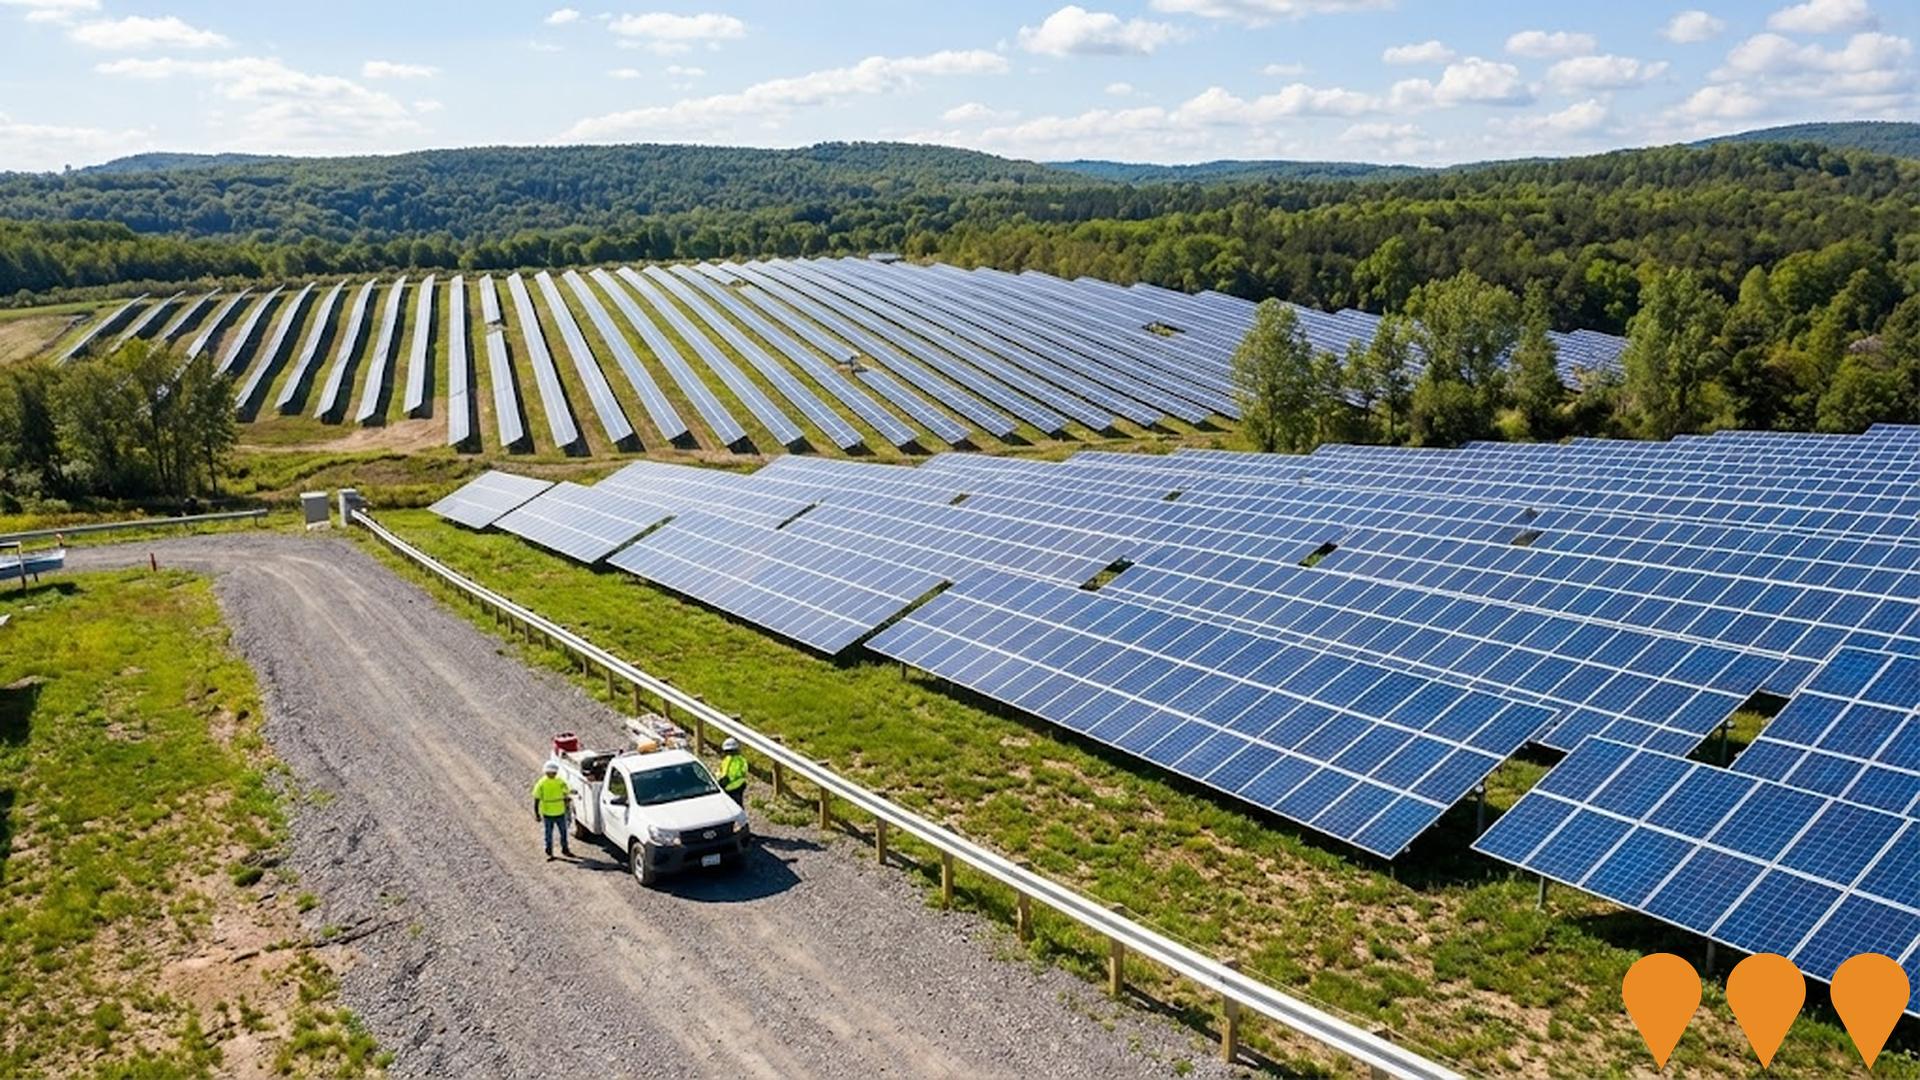
Proposed large-scale solar photovoltaic facility to contribute to ACT's renewable energy targets. The project includes battery storage capabilities and will connect to the existing electrical grid. Environmental impact assessments are currently underway.
Northbourne Village - De Burgh
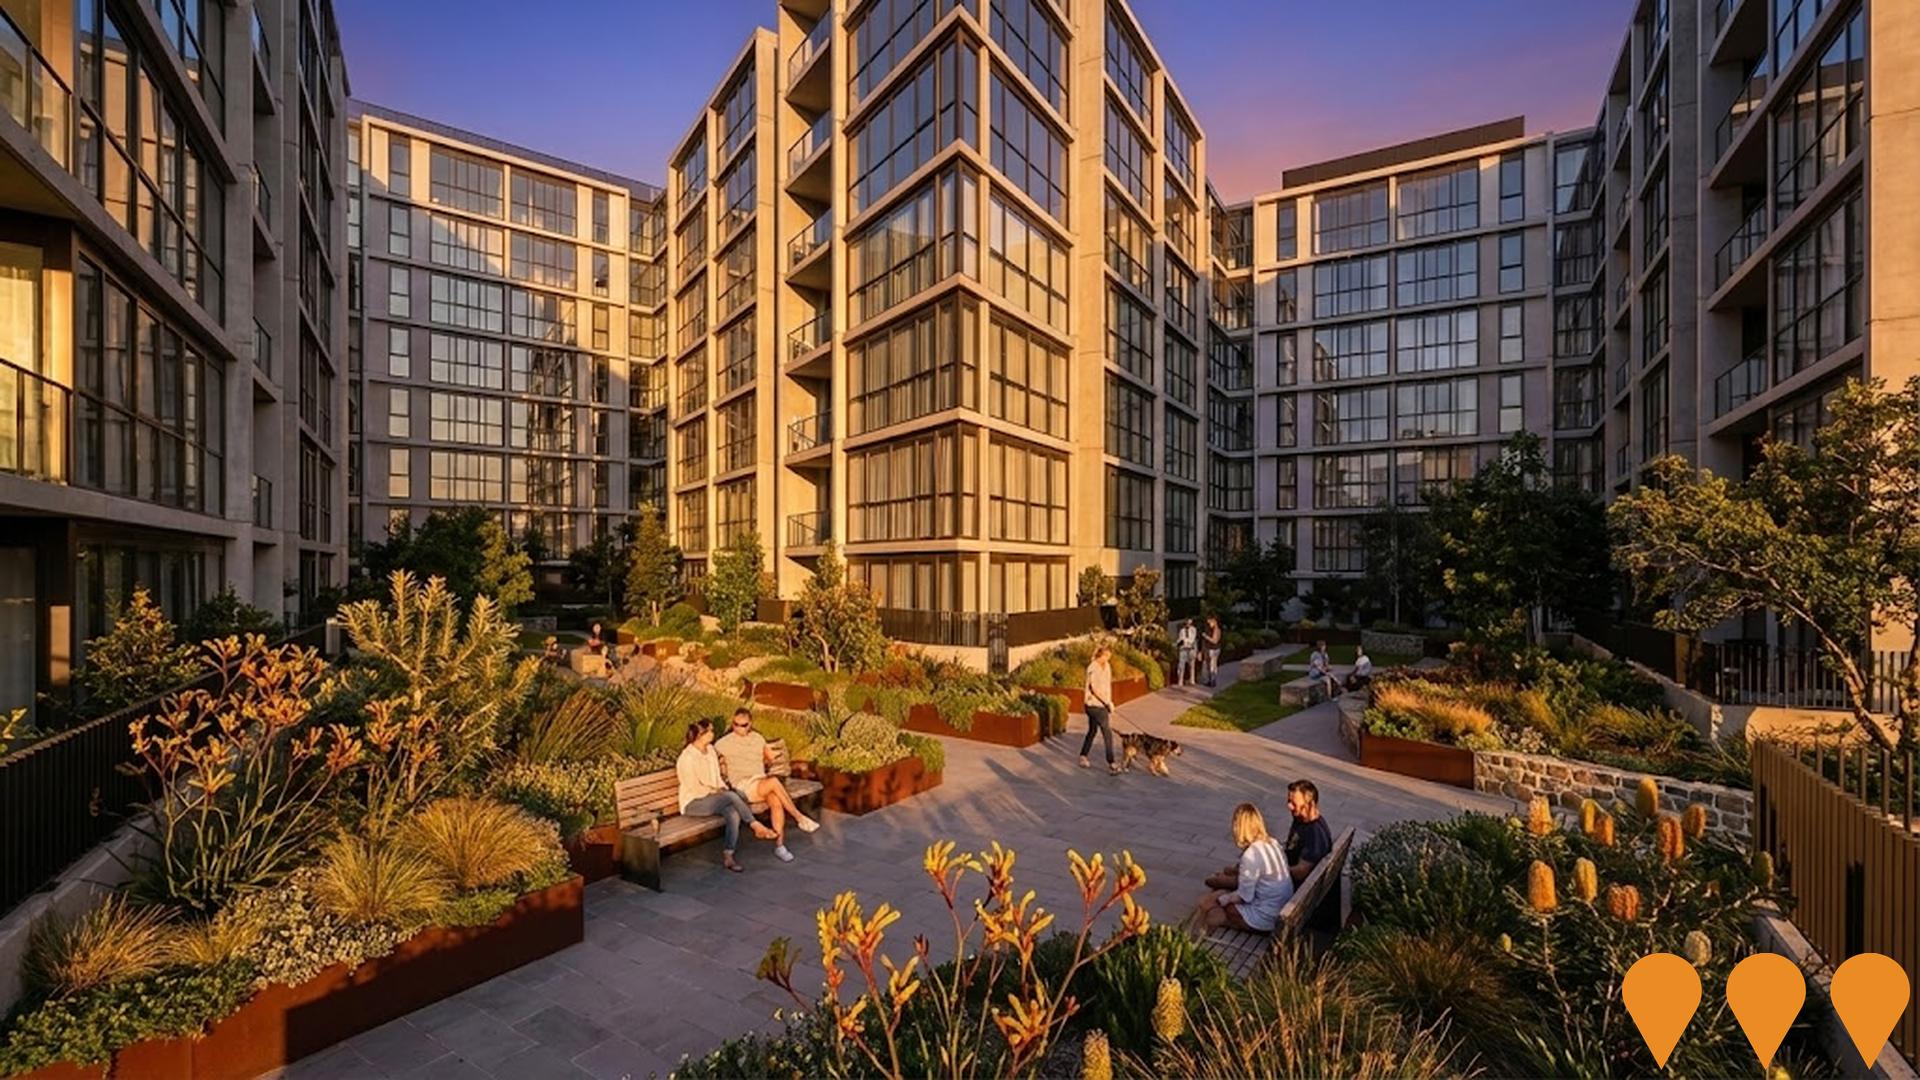
The third and final residential release at Northbourne Village, featuring central position with commanding presence on Northbourne Avenue. Mixed-use development with one, two and three-bedroom apartments, sustainable design, double glazing, and smart home technology. Part of $300 million Northbourne Village precinct.
Watson Section 76 North Housing Development
Comprehensive urban renewal project developing 200 new dwellings including 90 townhouses, 2 apartment blocks, demonstration housing project (20-30 co-housing dwellings), and a 1-hectare neighbourhood park. Located between Aspinall Street and Federal Highway, next to Starlight Apartments. Features 30% tree canopy coverage, protected wildlife habitat for Superb Parrot, and new pedestrian/cycling connections.
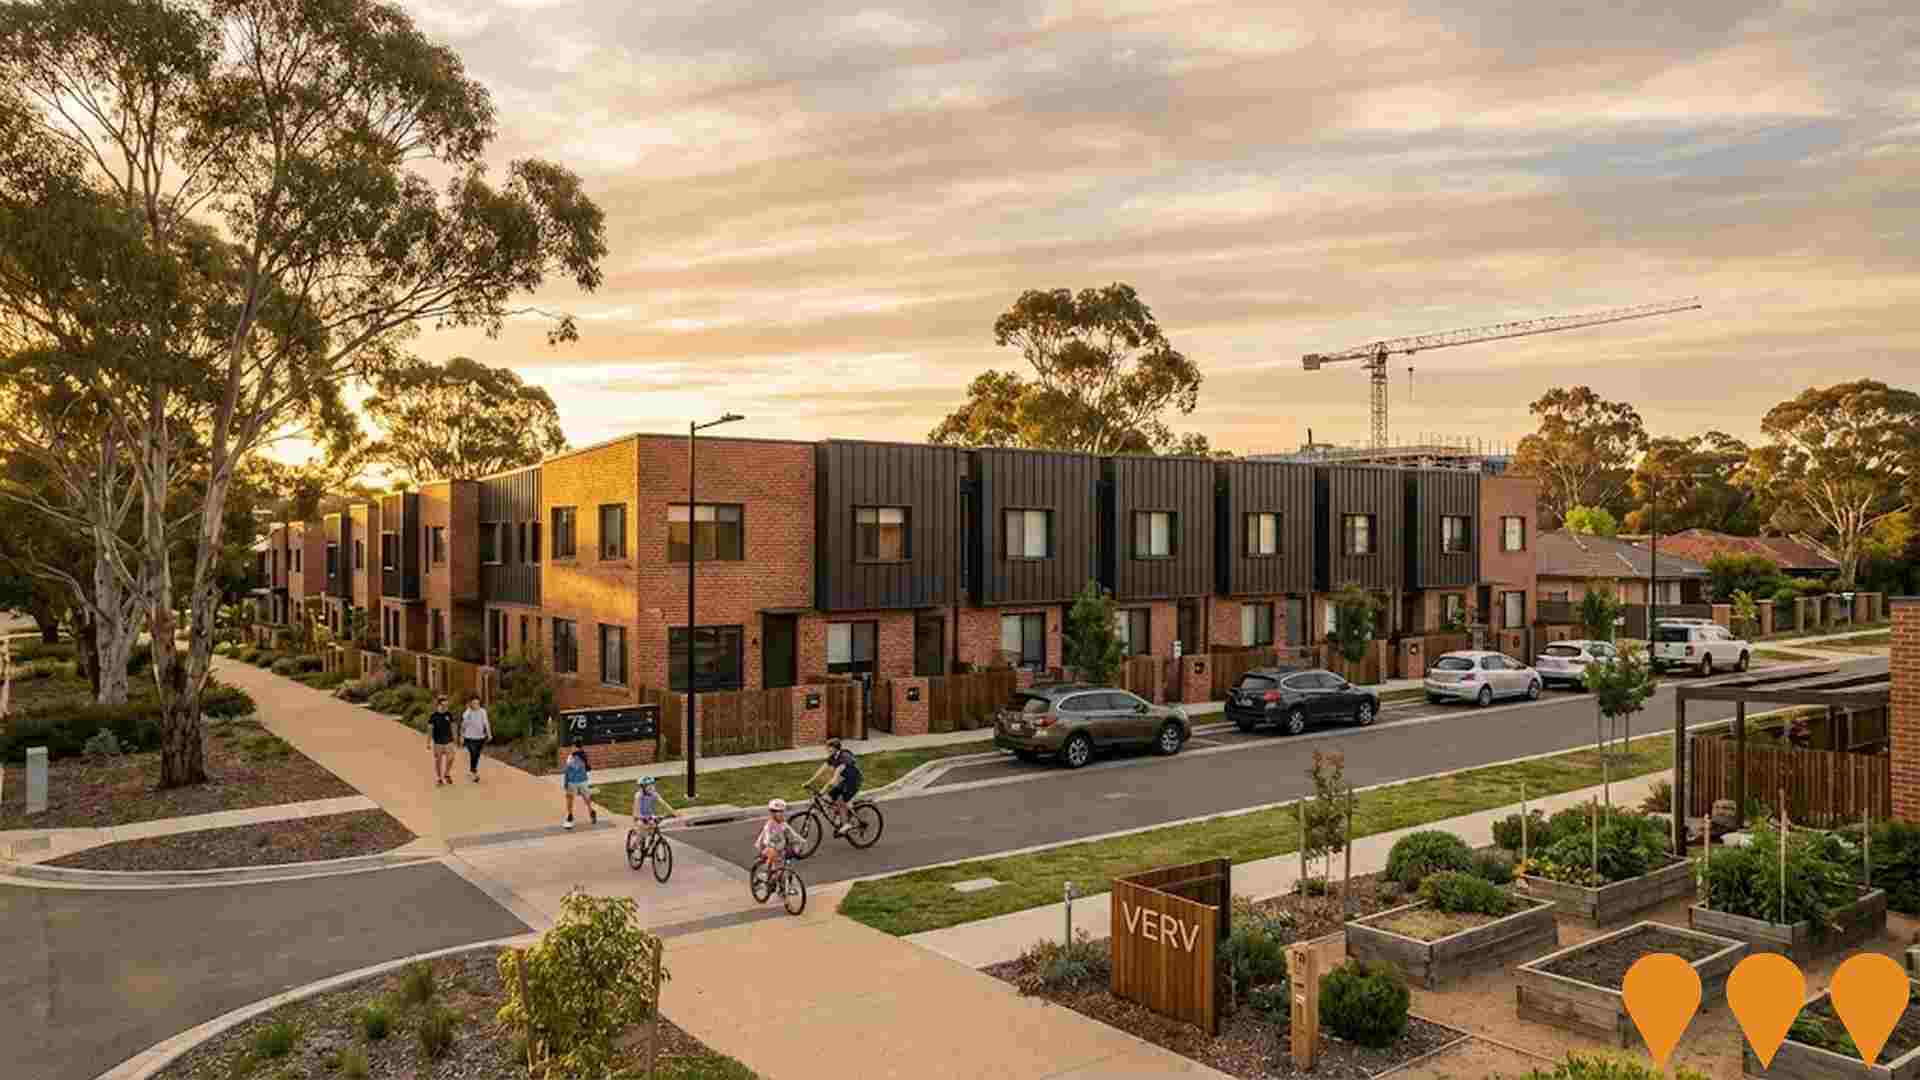
The Establishment Watson
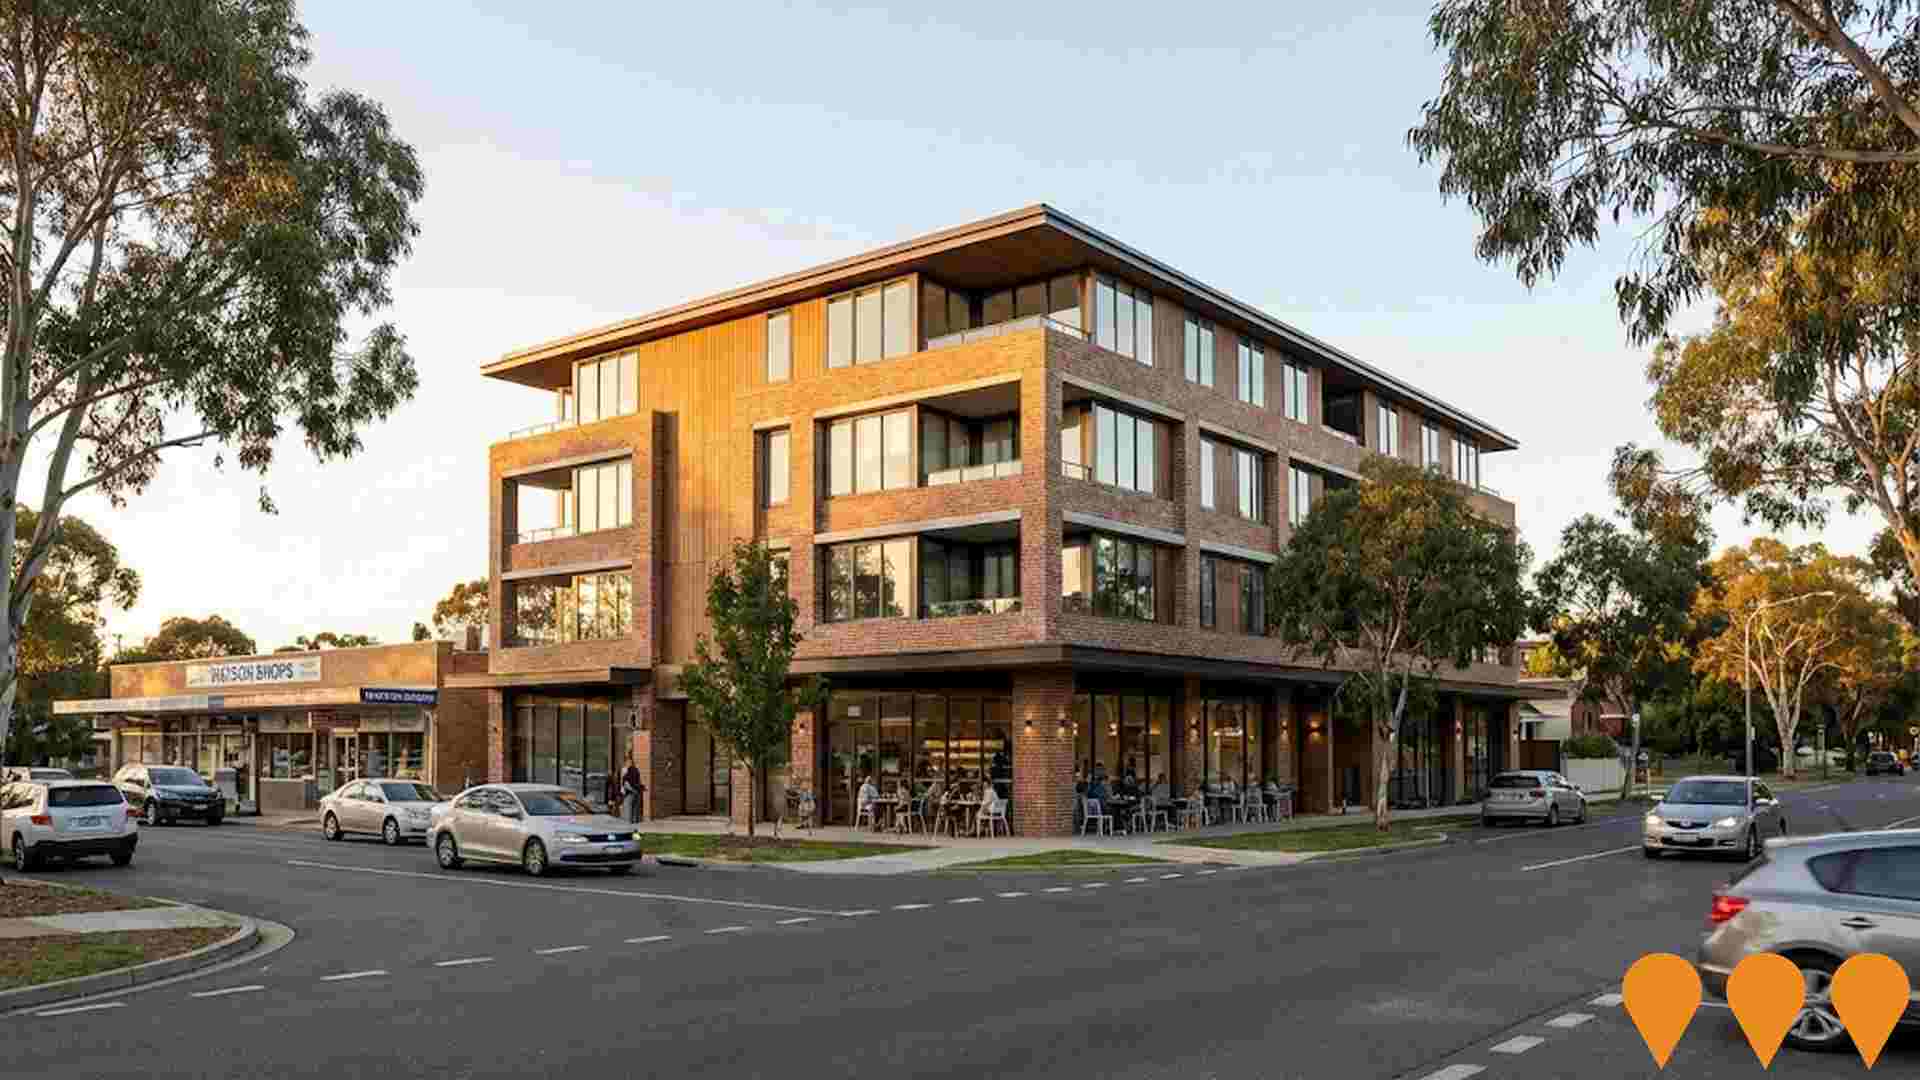
Boutique mixed-use development by JWLand comprising 94 luxury apartments and ground-floor retail/caf‚ space directly opposite Watson Shops, due for completion in 2026.
Employment
The labour market in Lyneham demonstrates typical performance when compared to similar areas across Australia
Lyneham has a highly educated workforce with professional services well represented. The unemployment rate was 3.6% as of September 2025, with an estimated employment growth of 1.7% over the past year.
There were 3,655 residents employed at this time, with an unemployment rate in line with the Australian Capital Territory's (ACT) rate of 3.6%. Workforce participation was broadly similar to ACT's 69.6%. Dominant employment sectors among residents include public administration & safety, professional & technical services, and education & training. The area specializes particularly in education & training, with an employment share 1.4 times the regional level.
Conversely, construction shows lower representation at 3.8% compared to the regional average of 6.8%. Employment opportunities locally may be limited, as indicated by Census data comparing working population to resident population. Between September 2024 and September 2025, employment increased by 1.7%, while labour force grew by 1.3%, causing a 0.4 percentage point drop in unemployment rate. During the same period, ACT experienced employment growth of 1.4% and labour force growth of 1.2%, with a 0.2 percentage point drop in unemployment rate. As of 25-November-25, ACT's employment grew by 1.19% year-on-year, adding 710 jobs, with the state unemployment rate at 4.5%. National employment forecasts from May-25 suggest national employment will expand by 6.6% over five years and 13.7% over ten years. Applying these projections to Lyneham's employment mix suggests local employment should increase by 6.5% over five years and 13.3% over ten years, though this is a simple weighting extrapolation for illustrative purposes only and does not consider localized population projections.
Frequently Asked Questions - Employment
Income
Income metrics indicate excellent economic conditions, with the area achieving higher performance than 75% of national locations assessed by AreaSearch
AreaSearch's data for financial year 2022 shows Lyneham SA2 had a median income of $67,498 and an average income of $83,440. This is higher than the Australian Capital Territory's median income of $68,678 and average income of $83,634. By September 2025, estimated median income would be approximately $76,678 and average income $94,788, based on a 13.6% Wage Price Index growth since financial year 2022. The 2021 Census indicates individual earnings in Lyneham SA2 are at the 91st percentile nationally, with weekly earnings of $1,200. Income brackets show that 37.3% of locals (2,430 people) earn between $1,500 and $2,999 weekly, aligning with regional trends where this cohort also represents 34.3%. Notably, 30.3% earn above $3,000 weekly, reflecting prosperity that fuels local economic activity. High housing costs consume 15.5% of income, but strong earnings place disposable income at the 72nd percentile nationally. The area's SEIFA income ranking places it in the 8th decile.
Frequently Asked Questions - Income
Housing
Lyneham displays a diverse mix of dwelling types, with a higher proportion of rental properties than the broader region
In Lyneham, as per the latest Census, 27.0% of dwellings were houses, with 73.0% being semi-detached, apartments, or other types. This contrasts with the Australian Capital Territory's figures of 39.3% houses and 60.7% other dwellings. Home ownership in Lyneham stood at 23.5%, similar to the ACT's rate. Mortgaged dwellings constituted 26.8%, while rented dwellings made up 49.7%. The median monthly mortgage repayment was $1,800, lower than the ACT average of $2,080 and the national average of $1,863. Meanwhile, the median weekly rent in Lyneham was $425, higher than the ACT's $476 and the national figure of $375.
Frequently Asked Questions - Housing
Household Composition
Lyneham features high concentrations of group households and lone person households, with a lower-than-average median household size
Family households comprise 52.5% of all households, including 17.0% couples with children, 27.1% couples without children, and 7.3% single parent families. Non-family households account for the remaining 47.5%, with lone person households at 37.8% and group households comprising 9.4%. The median household size is 2.1 people, which is smaller than the Australian Capital Territory average of 2.2.
Frequently Asked Questions - Households
Local Schools & Education
Lyneham shows strong educational performance, ranking in the upper quartile nationally when assessed across multiple qualification and achievement indicators
Lyneham's educational attainment is notably higher than broader averages. Among residents aged 15+, 60.5% possess university qualifications, compared to Australia's 30.4% and the SA4 region's 46.8%. This high level of educational attainment positions Lyneham favourably for knowledge-based opportunities. Bachelor degrees are most prevalent at 31.7%, followed by postgraduate qualifications (22.7%) and graduate diplomas (6.1%).
Vocational pathways account for 16.3% of qualifications, with advanced diplomas at 7.2% and certificates at 9.1%. Educational participation is high in Lyneham, with 29.5% of residents currently enrolled in formal education. This includes 13.4% in tertiary education, 5.7% in primary education, and 4.9% pursuing secondary education.
Frequently Asked Questions - Education
Schools Detail
Nearby Services & Amenities
Transport
Transport servicing is good compared to other areas nationally based on assessment of service frequency, route connectivity and accessibility
Lyneham has 46 active public transport stops, serving a mix of light rail and bus services. These stops are covered by 17 different routes, offering a total of 2,257 weekly passenger trips. Residents enjoy excellent transport accessibility, with an average distance of 164 meters to the nearest stop.
The service frequency is 322 trips per day across all routes, translating to about 49 weekly trips per individual stop.
Frequently Asked Questions - Transport
Transport Stops Detail
Health
Health performance in Lyneham is lower than average with common health conditions somewhat prevalent across the board, though to a considerably higher degree among older age cohorts
Lyneham faces significant health challenges with common health conditions prevalent across all age groups but to a notably higher degree among older cohorts. Approximately 61% of Lyneham's total population (3994 people) has private health cover, compared to 65.3% in the Australian Capital Territory and the national average of 55.3%. Mental health issues affect 11.4% of residents, while asthma impacts 7.9%.
67.0% of residents report being completely free from medical ailments, compared to 70.8% across the Australian Capital Territory. Lyneham has a higher proportion of seniors aged 65 and over at 15.3% (994 people), compared to 11.4% in the Australian Capital Territory. Health outcomes among seniors require more attention than those for the broader population.
Frequently Asked Questions - Health
Cultural Diversity
Lyneham was found to be more culturally diverse than the vast majority of local markets in Australia, upon assessment of a range of language and cultural background related metrics
Lyneham's population showed greater cultural diversity than most local markets, with 34.7% born overseas and 28.1% speaking a language other than English at home. Christianity was the predominant religion in Lyneham at 30.4%, while Buddhism was overrepresented at 5.1% compared to the Australian Capital Territory's 3.5%. The top three ancestry groups were English (23.4%), Australian (19.7%), and Other (13.6%).
Notably, Welsh (0.8%) was slightly overrepresented in Lyneham compared to regional levels (0.7%), as were Serbian (0.6% vs 0.3%) and Russian (0.5% vs 0.4%).
Frequently Asked Questions - Diversity
Age
Lyneham's population is younger than the national pattern
Lyneham's median age is 34 years, comparable to the Australian Capital Territory average of 35 and significantly lower than the national average of 38 years. Compared to the Australian Capital Territory, Lyneham has a higher percentage of 25-34 residents (26.2%) but fewer 5-14 year-olds (7.3%). This concentration of 25-34 residents is well above the national average of 14.5%. According to post-2021 Census data, the 25 to 34 age group has grown from 24.0% to 26.2%, while the 35 to 44 cohort increased from 14.5% to 16.3%. Conversely, the 15 to 24 cohort has declined from 13.7% to 11.7%. Demographic modeling suggests that Lyneham's age profile will evolve significantly by the year 2041. The 35 to 44 cohort is projected to grow by 33%, adding 351 residents to reach a total of 1,413.

