Chart Color Schemes
This analysis uses ABS Statistical Areas Level 2 (SA2) boundaries, which can materially differ from Suburbs and Localities (SAL) even when sharing similar names.
SA2 boundaries are defined by the Australian Bureau of Statistics and are designed to represent communities for statistical reporting (e.g., census and ERP).
Suburbs and Localities (SAL) represent commonly-used suburb/locality names (postal-style areas) and may use different geographic boundaries. For comprehensive analysis, consider reviewing both boundary types if available.
est. as @ -- *
ABS ERP | -- people | --
2021 Census | -- people
Sales Activity
Curious about local property values? Filter the chart to assess the volume and appreciation (including resales) trends and regional comparisons, or scroll to the map below view this information at an individual property level.
Find a Recent Sale
Sales Detail
Population
Kaleen is positioned among the lower quartile of areas assessed nationally for population growth based on AreaSearch's assessment of recent, and medium term trends
Kaleen's population was around 7,683 as of November 2025, based on AreaSearch's analysis. This figure reflects an increase of 11 people since the 2021 Census, which reported a population of 7,672. The change is inferred from the estimated resident population of 7,685 in June 2024 and an additional 12 validated new addresses since the Census date. This results in a population density ratio of 1,274 persons per square kilometer, higher than the average across national locations assessed by AreaSearch. Kaleen's growth rate of 0.1% since the census is within 2.3 percentage points of the SA3 area's growth rate of 2.4%, indicating competitive growth fundamentals. Overseas migration contributed approximately 75.9% of overall population gains during recent periods in Kaleen.
AreaSearch adopts ABS/Geoscience Australia projections for each SA2 area, released in 2024 with a base year of 2022. For areas not covered and years post-2032, age group growth rates from the ACT Government's SA2 area projections are used, also with a base year of 2022. According to these projections, Kaleen's population is expected to decline by 517 persons by 2041. However, specific age cohorts like the 85 and over group are projected to increase, with an anticipated growth of 216 people in this cohort during this period.
Frequently Asked Questions - Population
Development
Residential development activity is lower than average in Kaleen according to AreaSearch's national comparison of local real estate markets
Kaleen has seen approximately 21 dwellings granted development approval annually. Over the past five financial years, from FY-21 to FY-25, around 107 homes were approved, with another 15 approved so far in FY-26. On average, about 1.3 people have moved to the area each year for every dwelling built over these five years, suggesting a balanced supply and demand market that supports stable conditions.
The average expected construction cost value of new dwellings is $265,000. This year, around $4.5 million in commercial approvals have been registered, indicating limited focus on commercial development. Compared to the Australian Capital Territory, Kaleen shows significantly reduced construction activity, at 51.0% below the regional average per person. This limited new supply generally supports stronger demand and values for established homes, reflecting the area's maturity and possible planning constraints. New developments consist of 75.0% detached dwellings and 25.0% townhouses or apartments, maintaining Kaleen's traditional suburban character with a focus on family homes. This represents a shift from the area's existing housing composition, currently at 91.0% houses, suggesting decreasing availability of developable sites and reflecting changing lifestyles and demand for more diverse, affordable housing options.
With around 799 people per approval, Kaleen is a mature, established area with population projections indicating stability or decline, which should reduce housing demand pressures and benefit potential buyers.
Frequently Asked Questions - Development
Infrastructure
Kaleen has limited levels of nearby infrastructure activity, ranking in the 19thth percentile nationally
Twenty-five projects have been identified by AreaSearch as potentially impacting the area. Key projects include Kaleen Community Hub & Mixed-Use Precinct, Kaleen Local Centre Enhancements, Kenny New Suburb Development, Kaleen Aged Care Precinct - Bullecourt Village Expansion and Mona Tait Gardens Upgrades. The following list details those likely to be most relevant.
Professional plan users can use the search below to filter and access additional projects.
INFRASTRUCTURE SEARCH
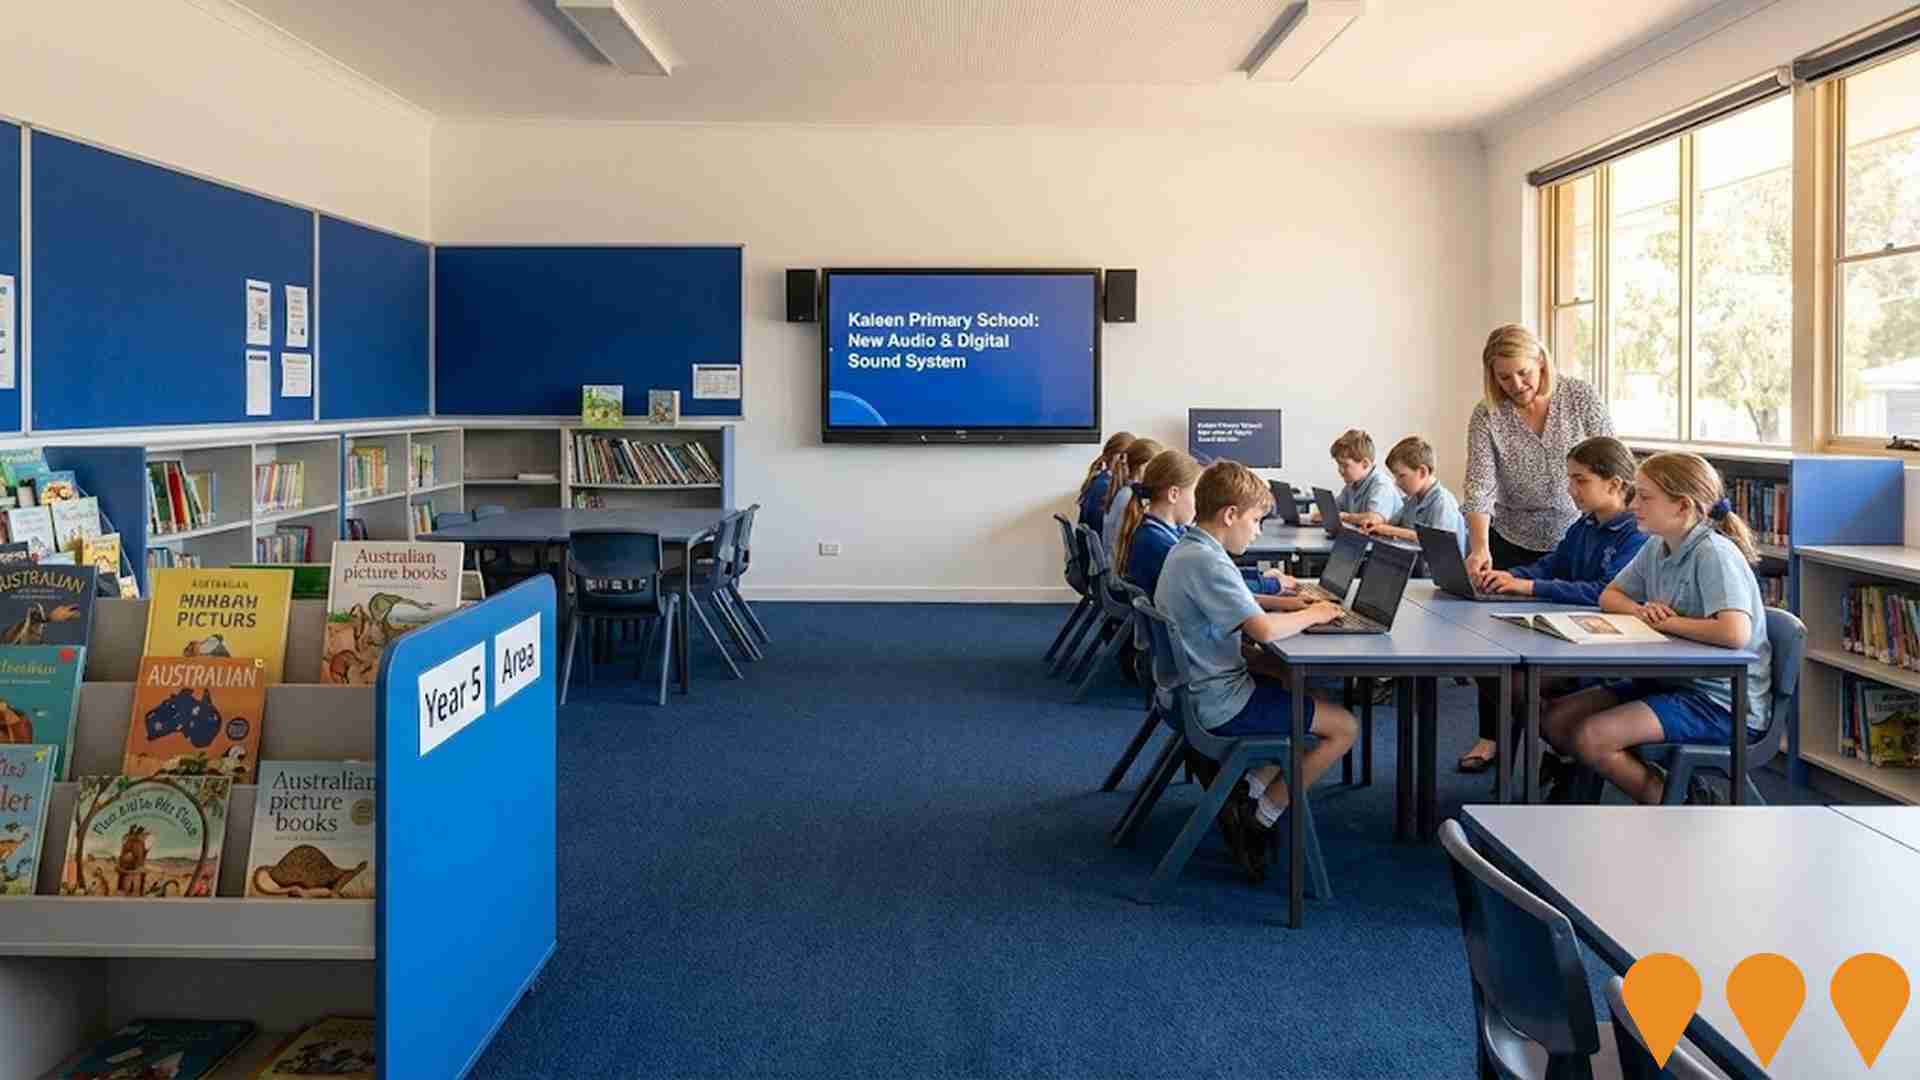
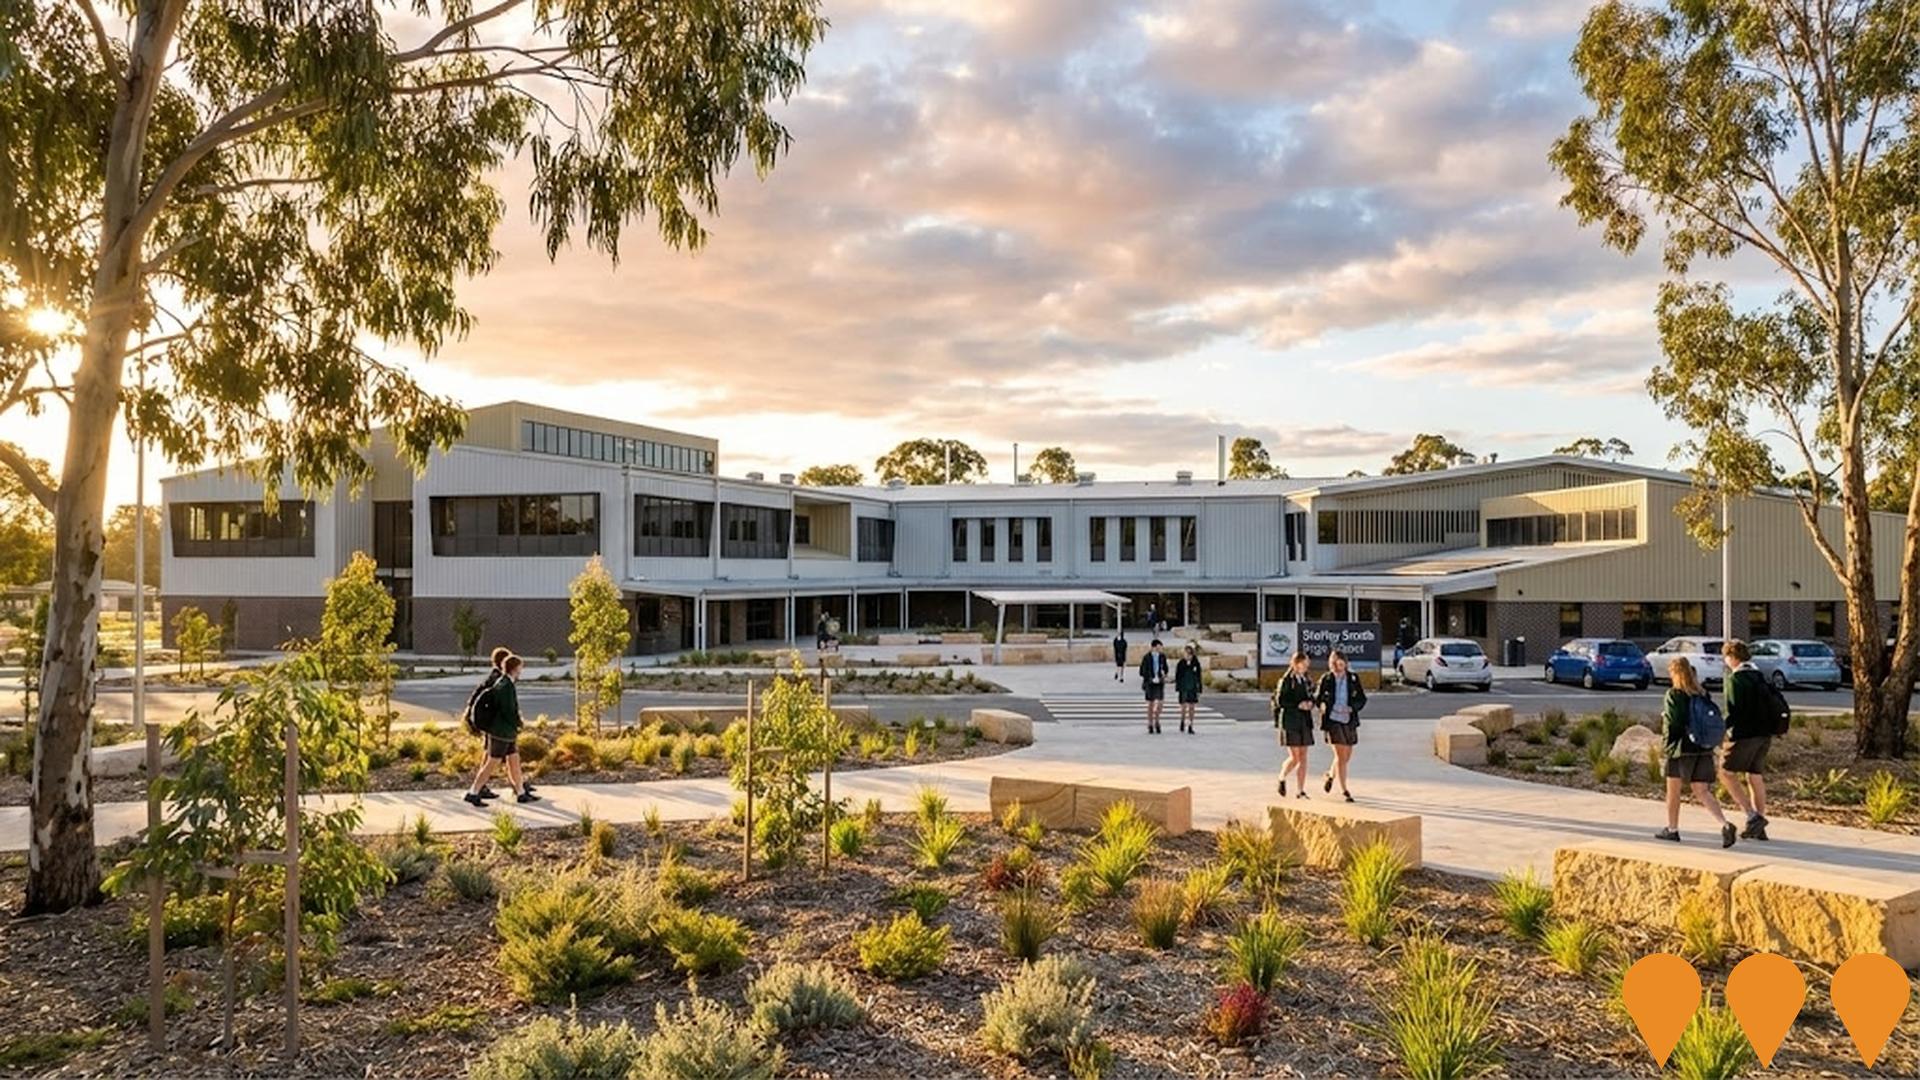
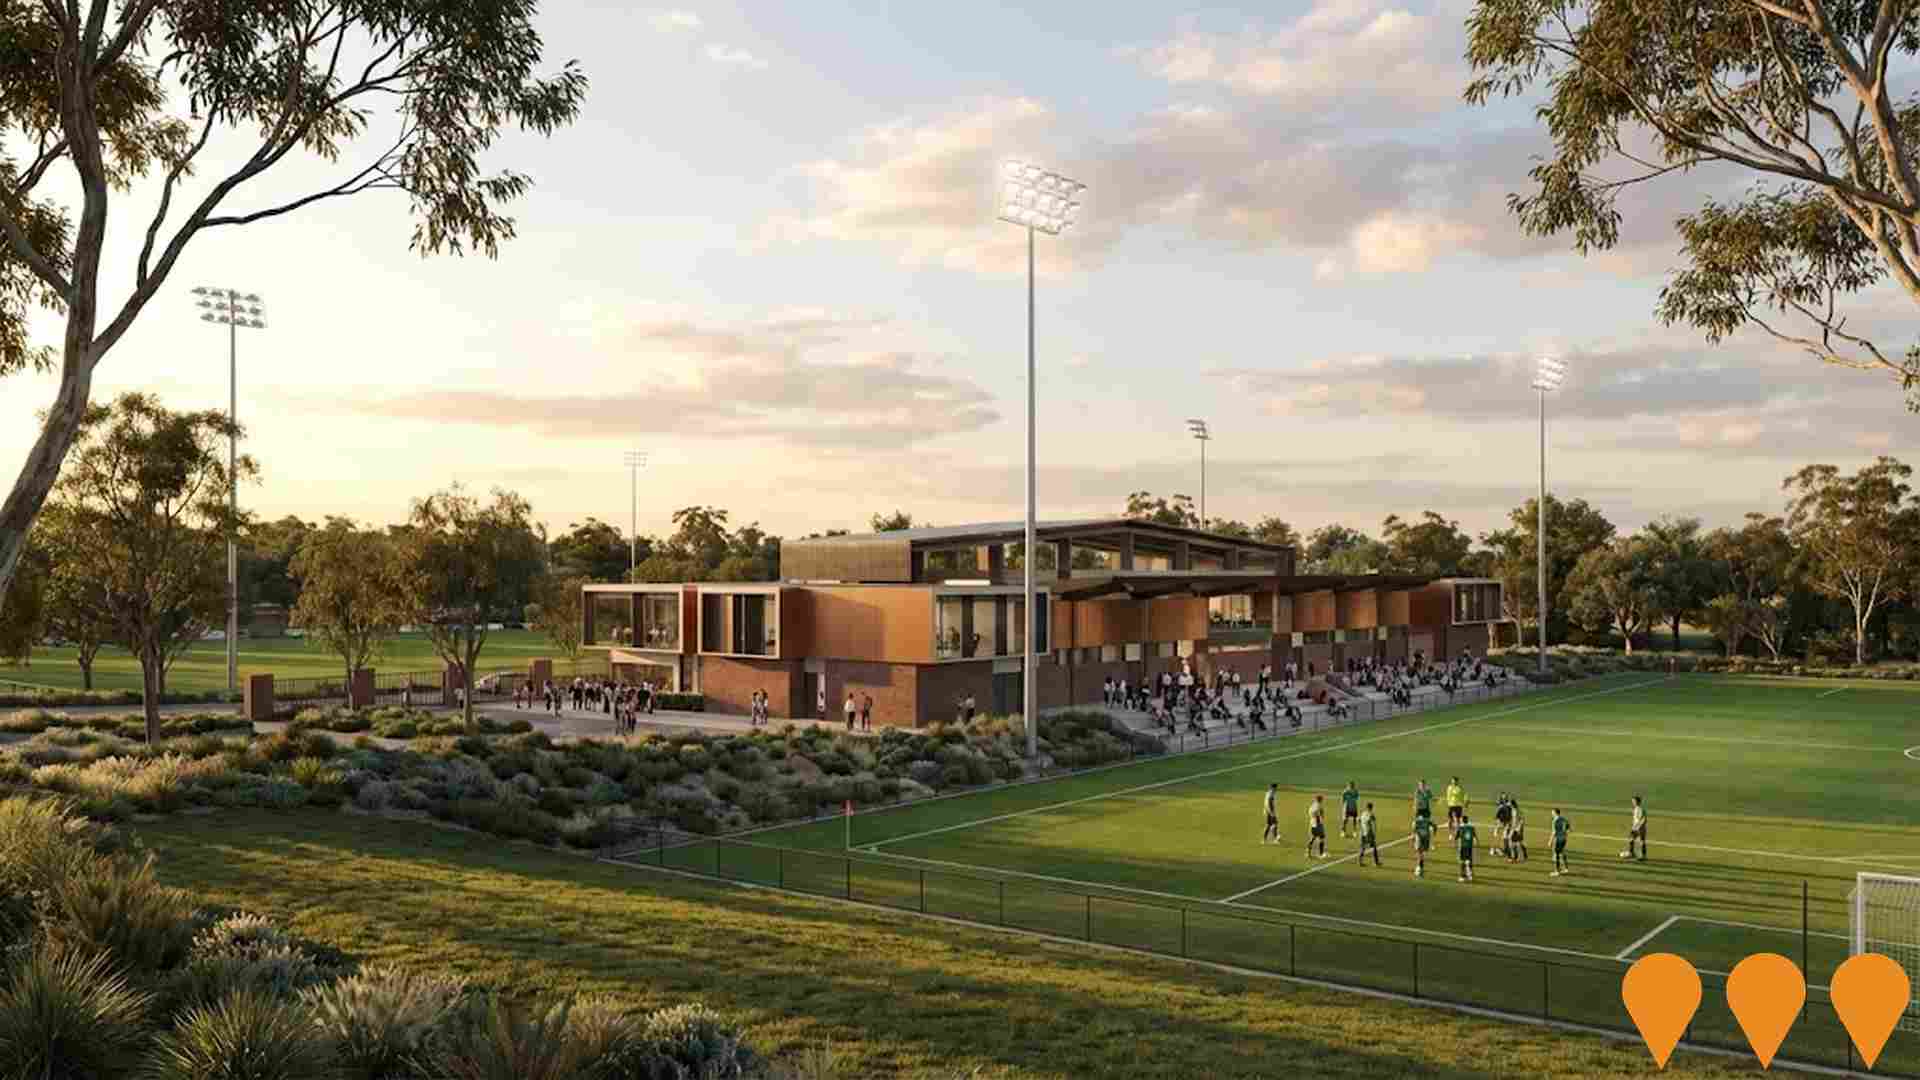
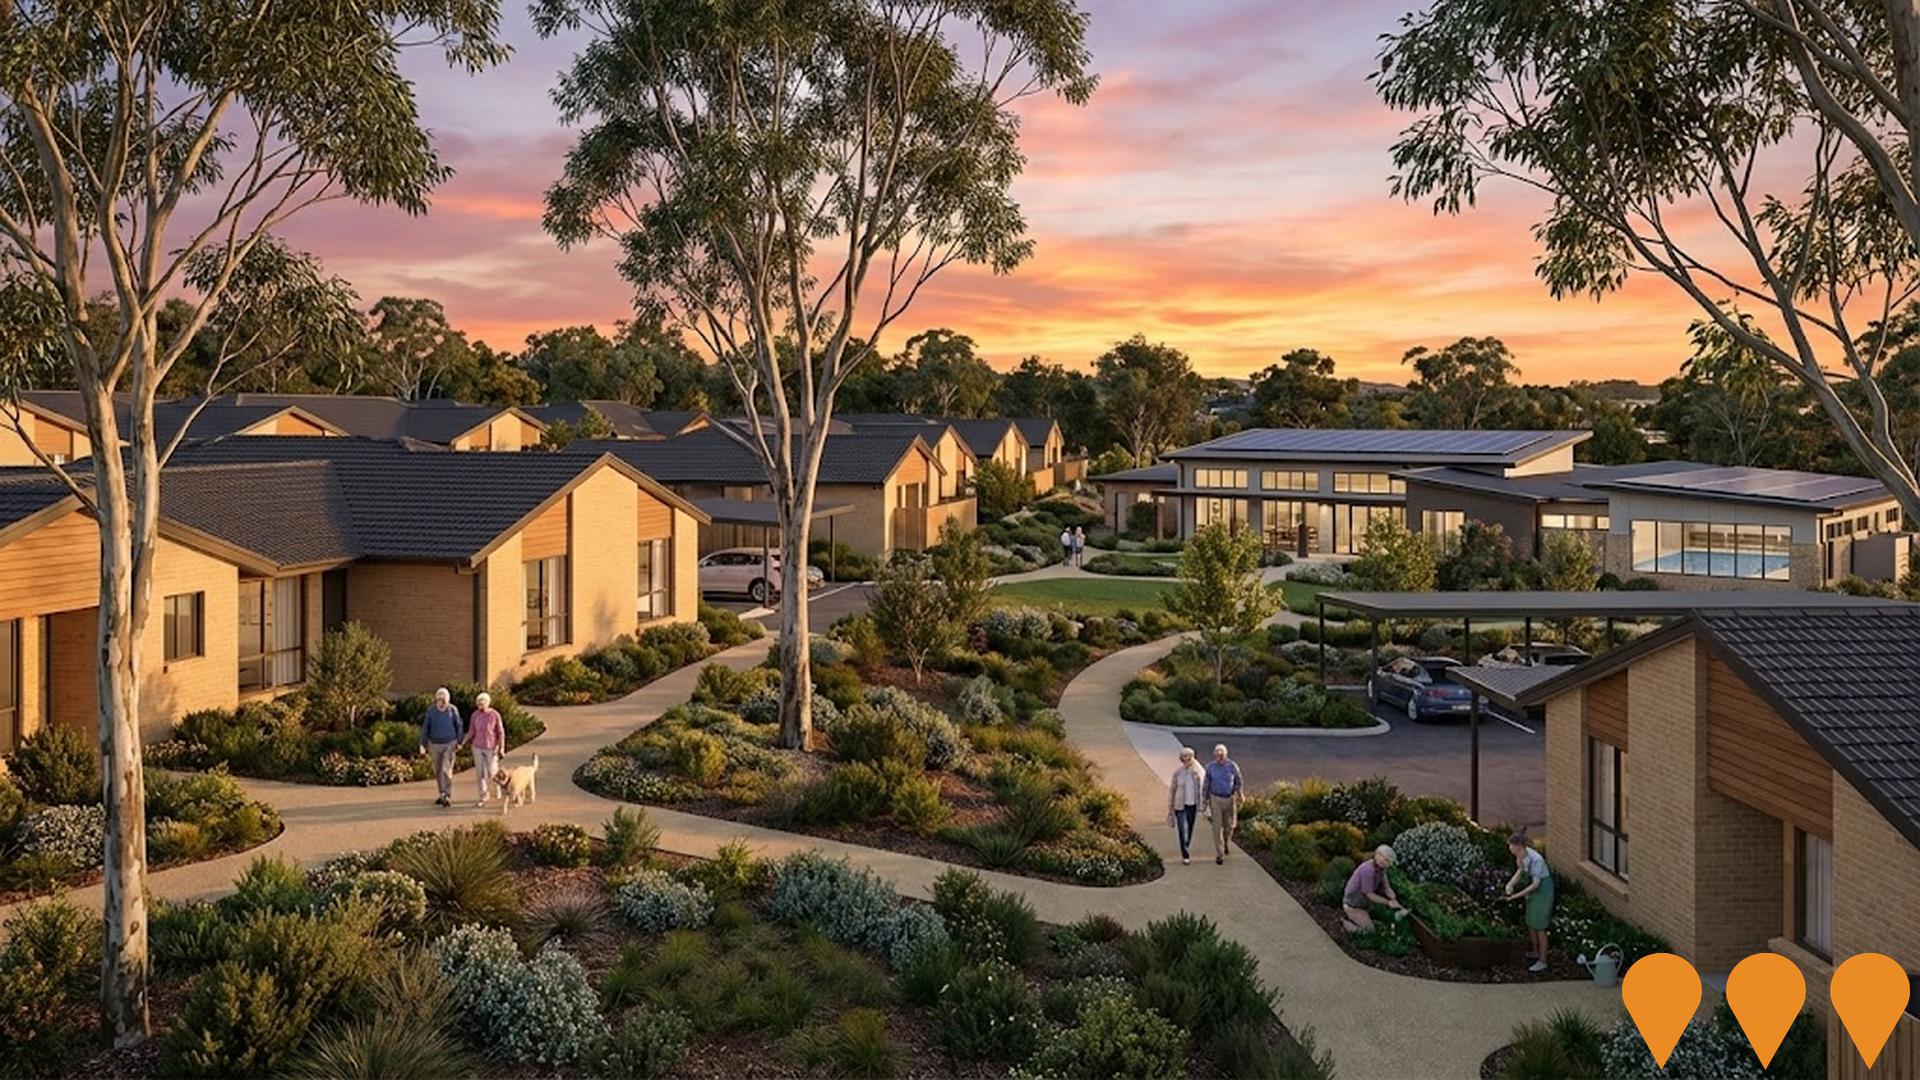
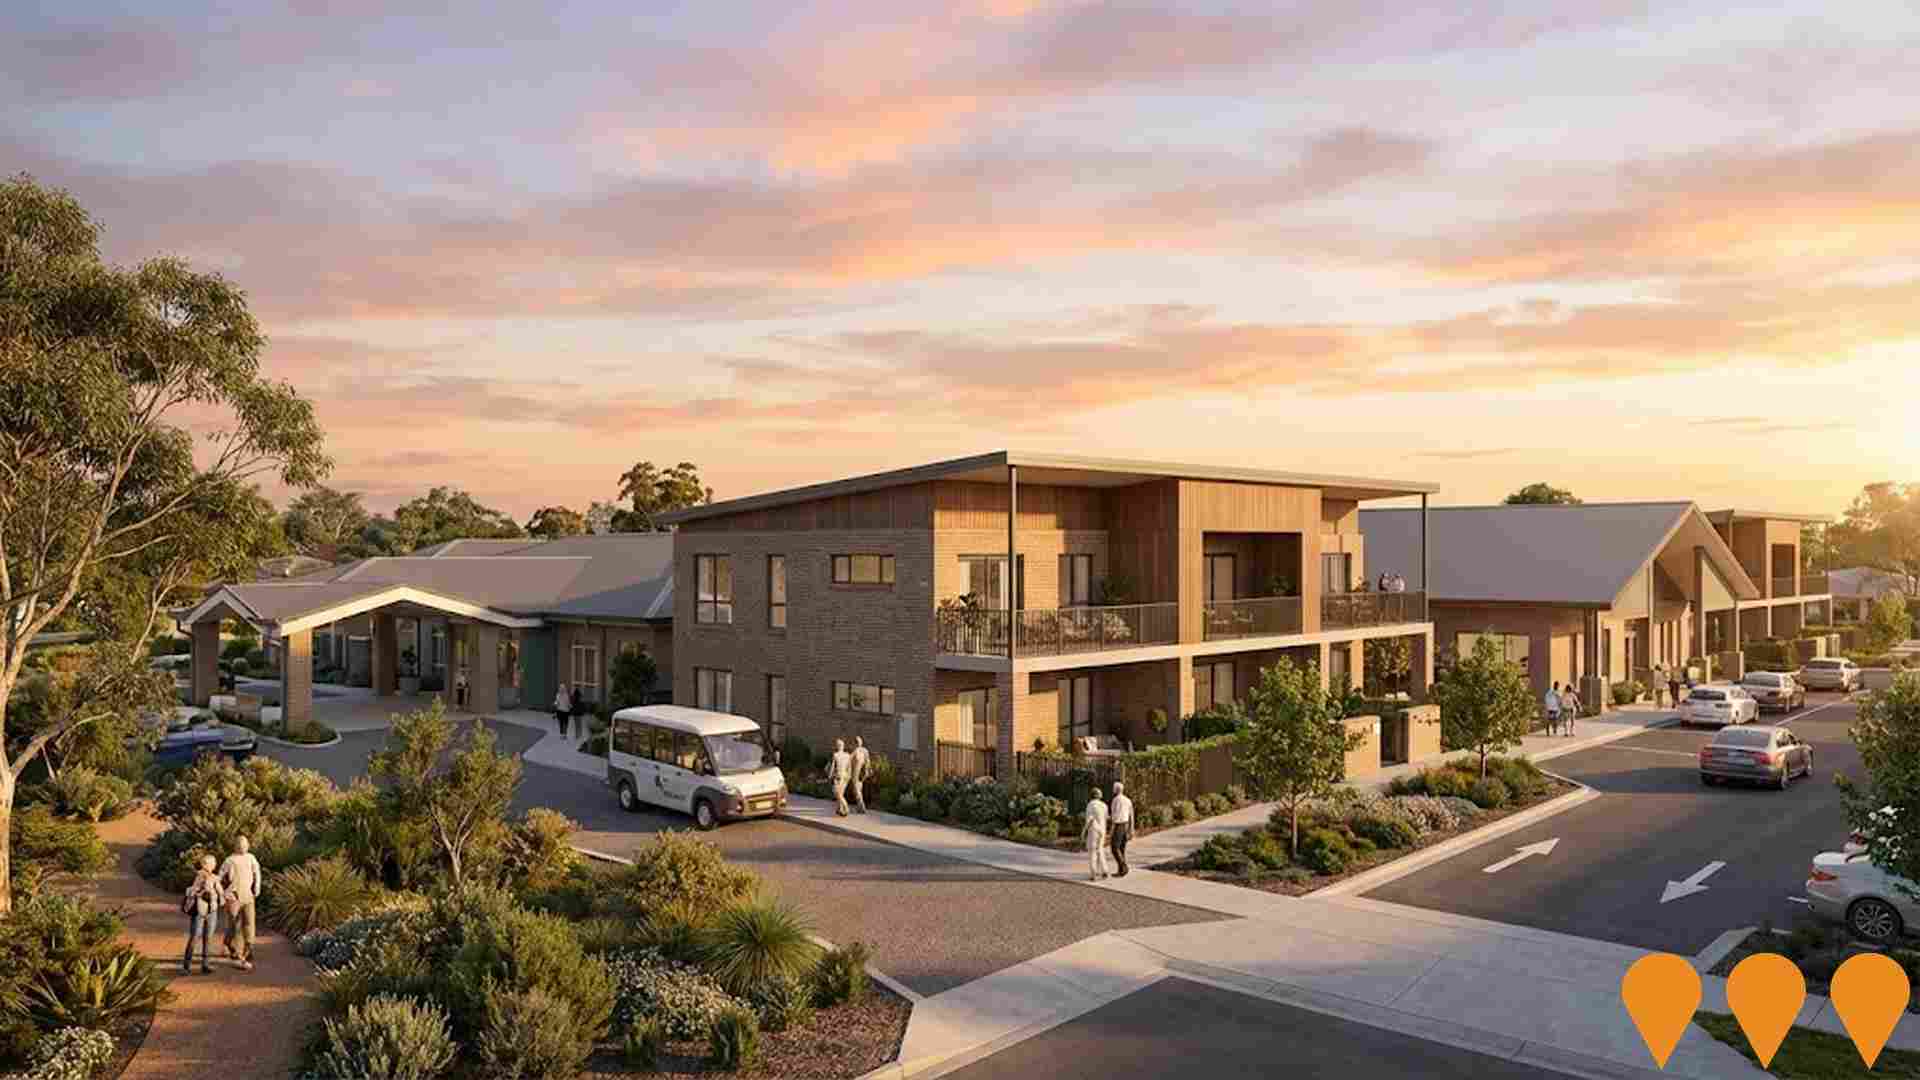
 Denotes AI-based impression for illustrative purposes only, not to be taken as definitive under any circumstances. Please follow links and conduct other investigations from the project's source for actual imagery. Developers and project owners wishing us to use original imagery please Contact Us and we will do so.
Frequently Asked Questions - Infrastructure
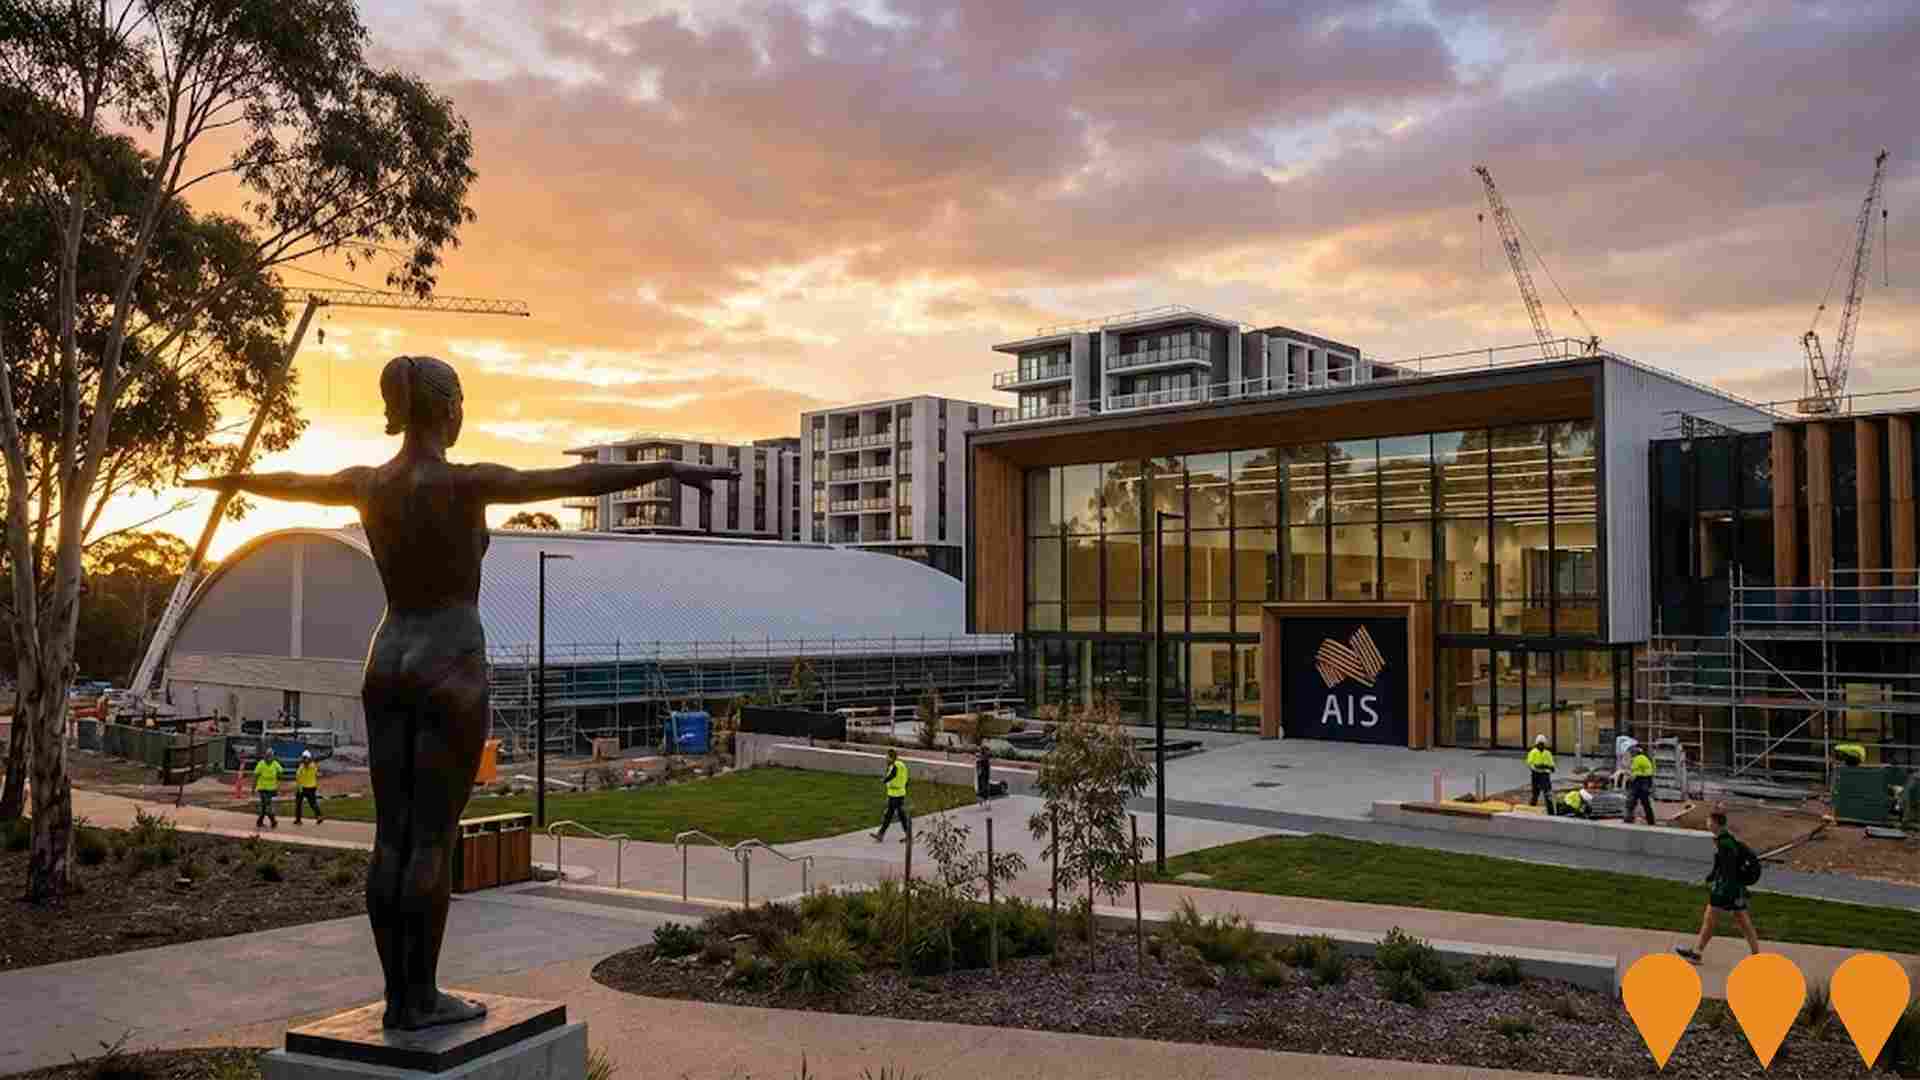
AIS Podium Project
Redevelopment of the Australian Institute of Sport campus in Bruce delivering a new High Performance Training and Testing Centre, a multi-sport indoor dome, and fully accessible athlete accommodation (approximately 200 beds). Construction commenced in October 2025 following Parliamentary approval.
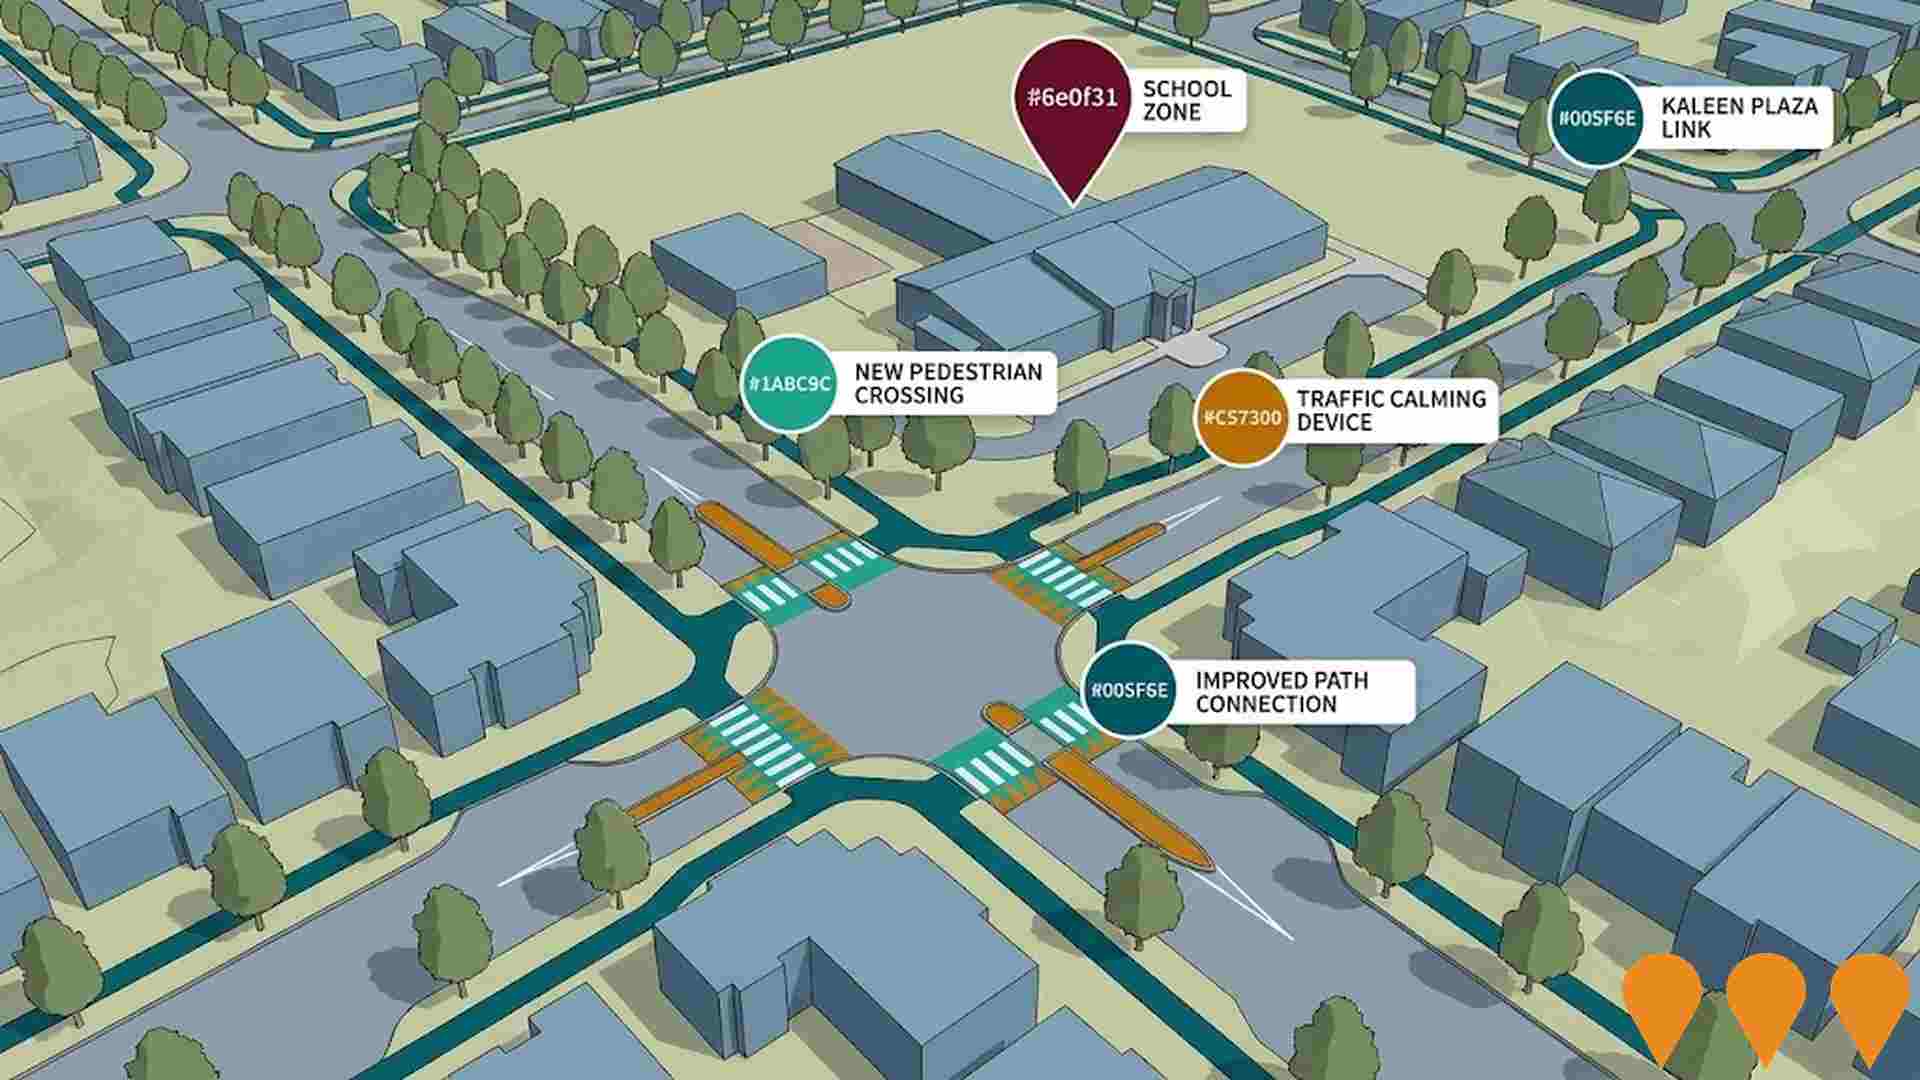
Kaleen Local Centre Enhancements
Potential future upgrade and modest expansion of Kaleen local shops (Kaleen Plaza) including improved access, parking, landscaping and retail floorspace. As of December 2025 no Development Application has been lodged for expansion of the plaza itself. Nearby public realm upgrades at Gwydir Square (South Kaleen) were completed in 2022, and a separate mixed-use DA at the former Eastlake Football Club site (16 Georgina Crescent) remains under assessment. This record tracks possible future plaza enhancements subject to lessee or ACT Government initiation.
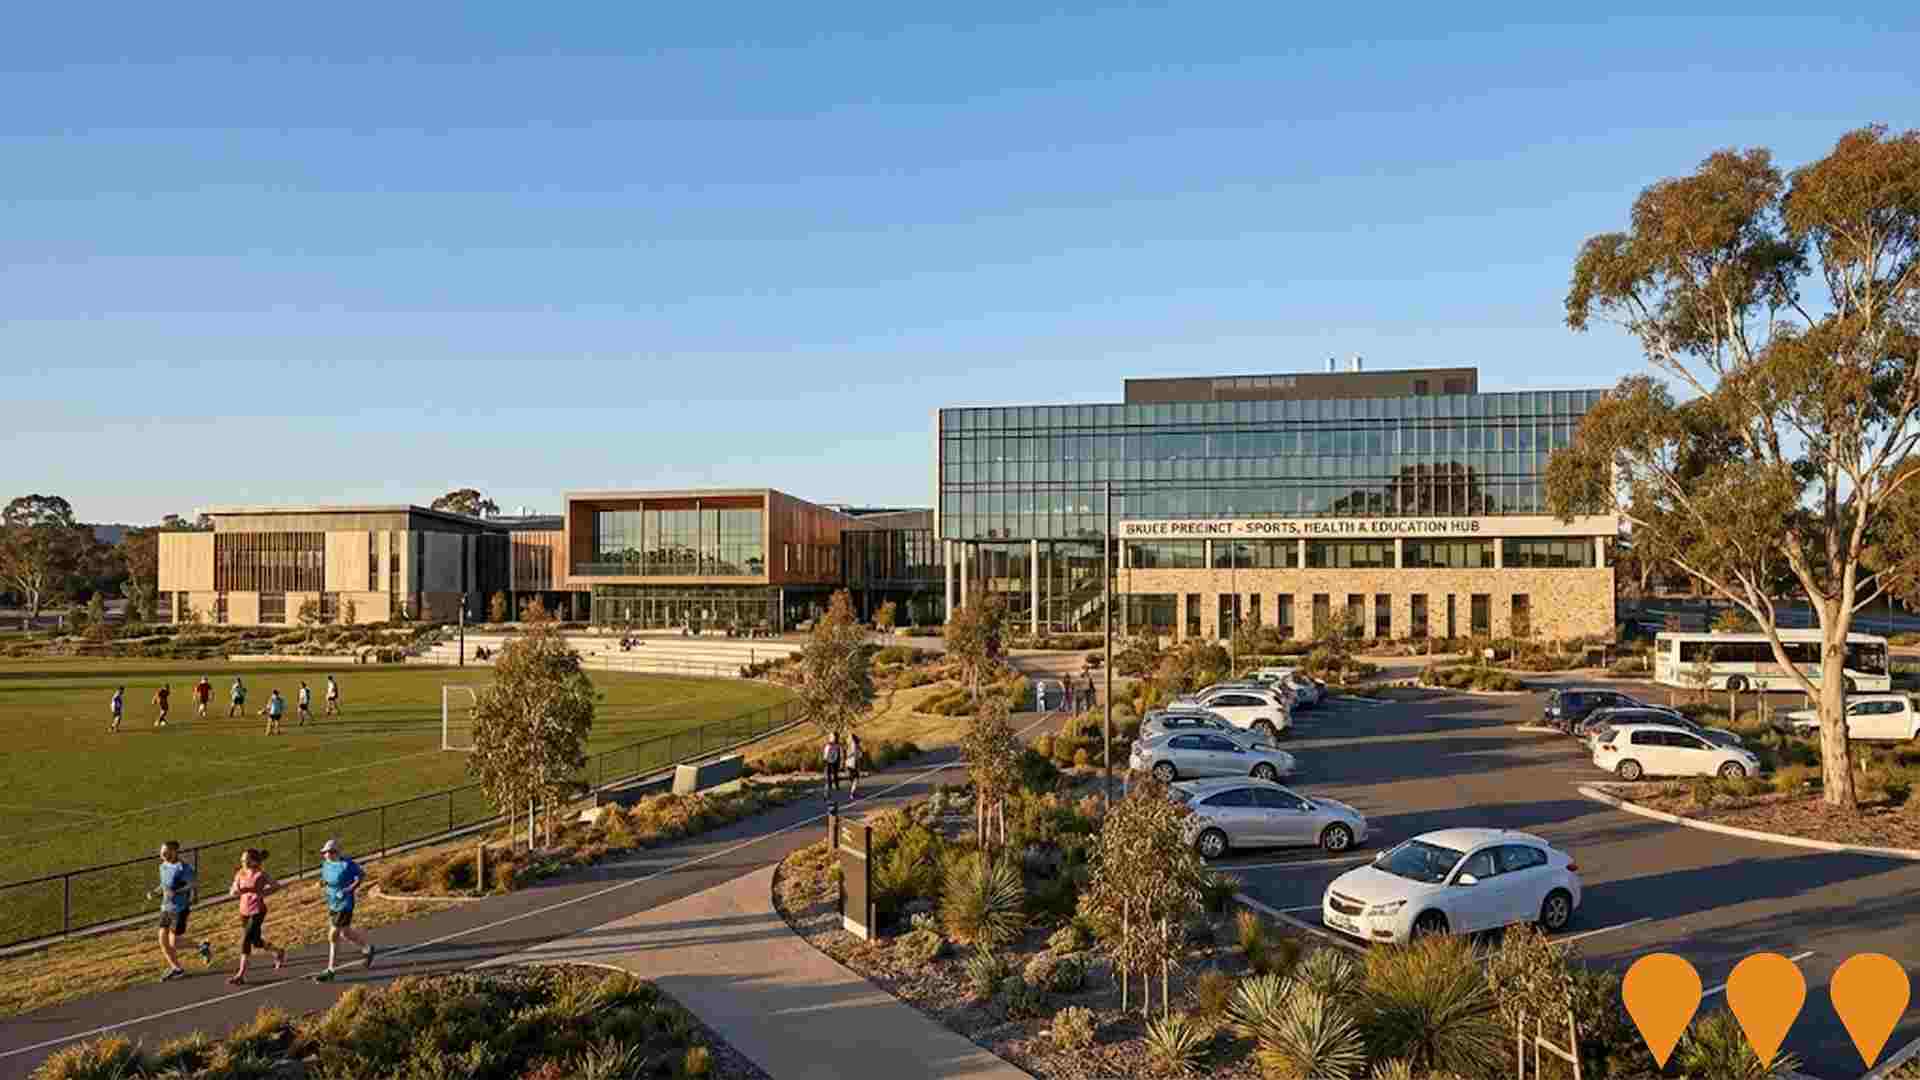
Bruce Sports, Health and Education Precinct
Integrated precinct development combining sports, health, and education facilities in Bruce. The project includes new sports facilities, health services, educational infrastructure, and supporting commercial development to create a major regional hub.
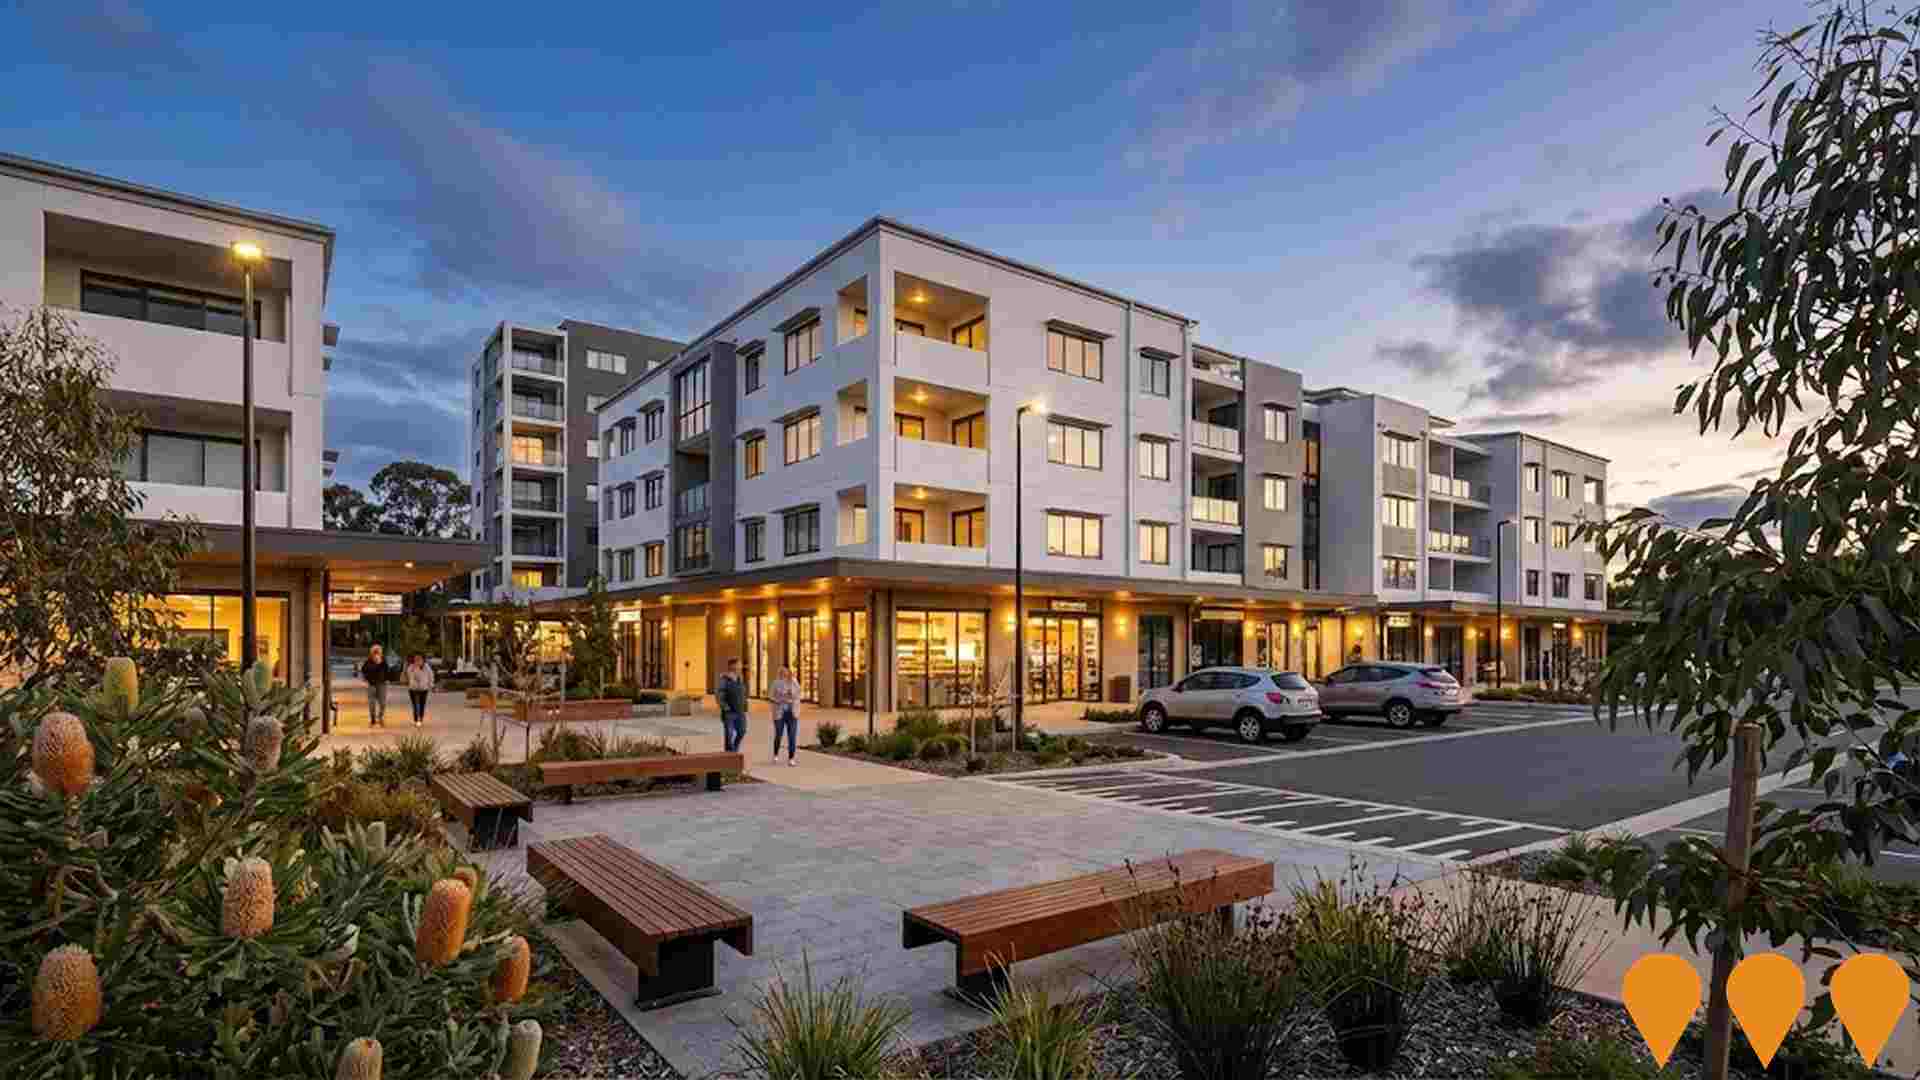
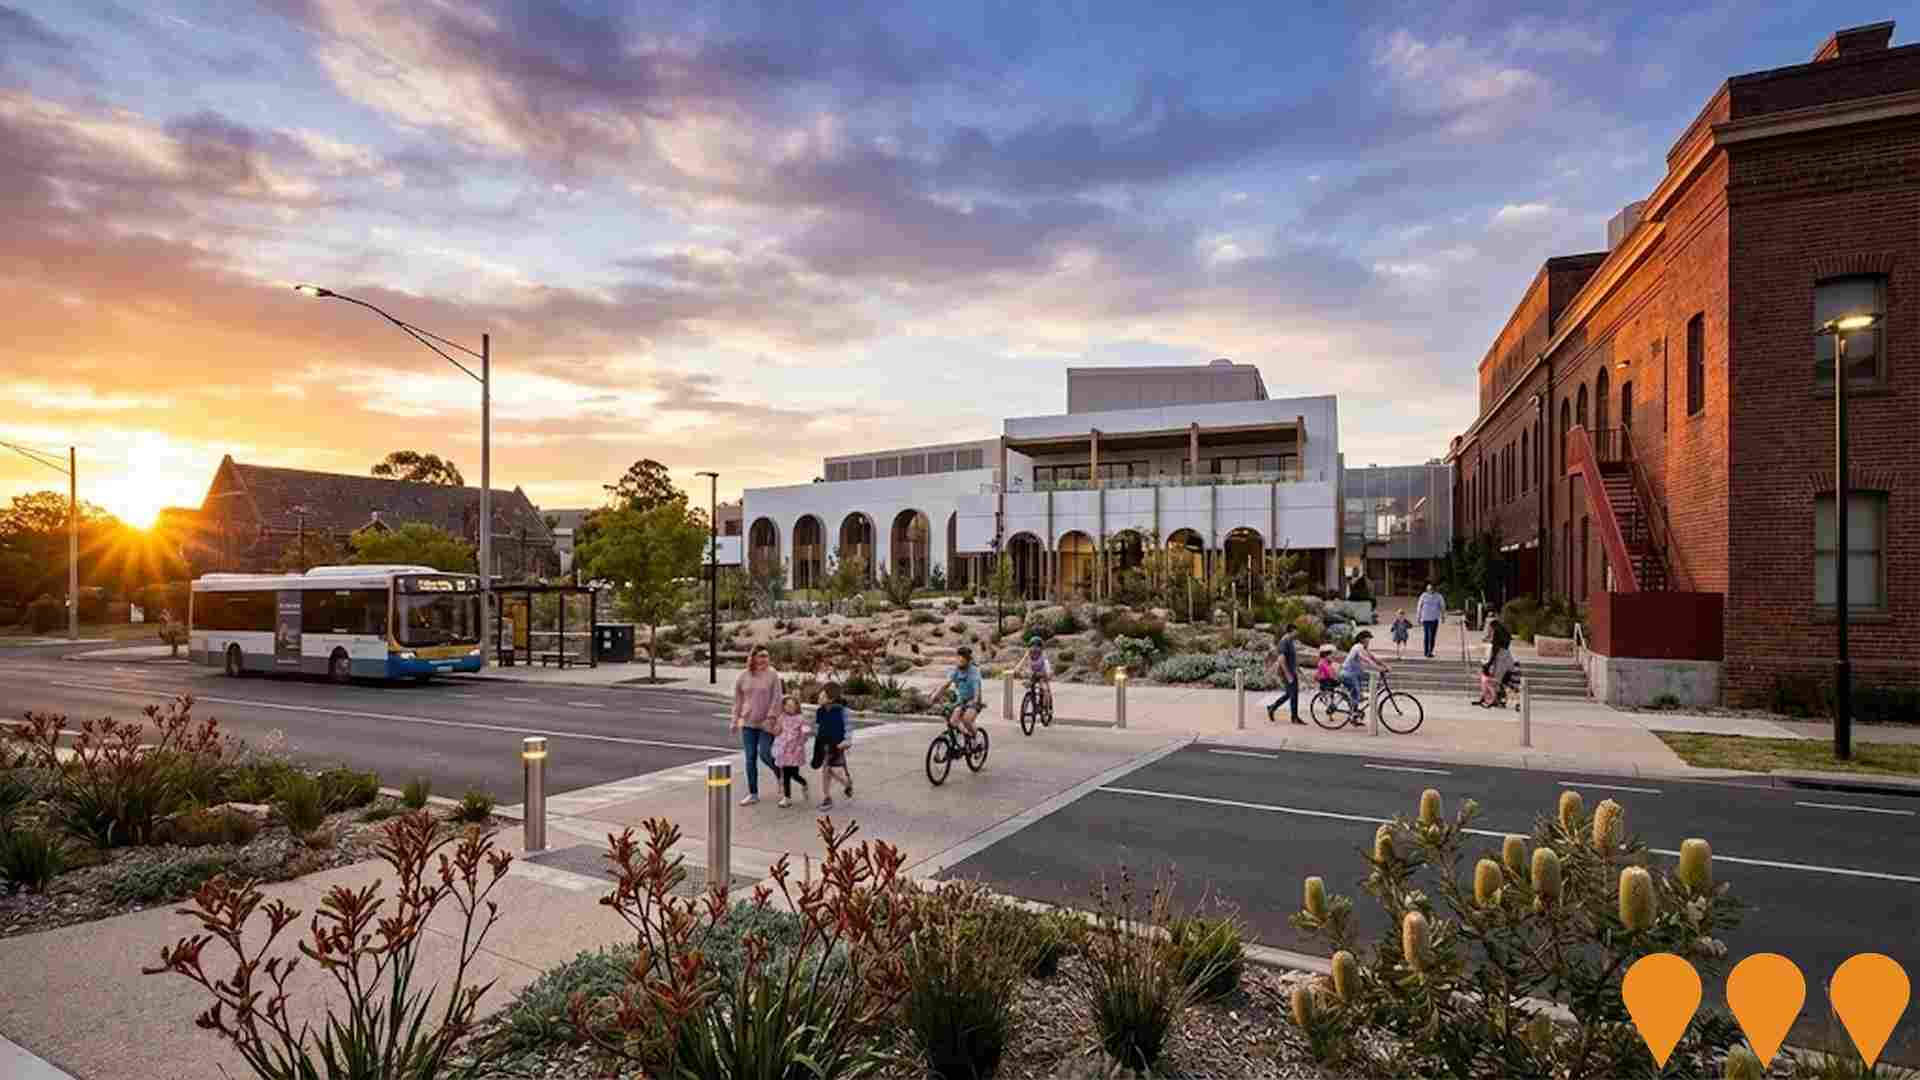
Kaleen Community Hub & Mixed-Use Precinct
Proposed mixed-use community hub at the current Kaleen shops site including new retail, medical centre, childcare, community facilities and medium-density residential apartments as part of the ACT Government's local centre renewal program.
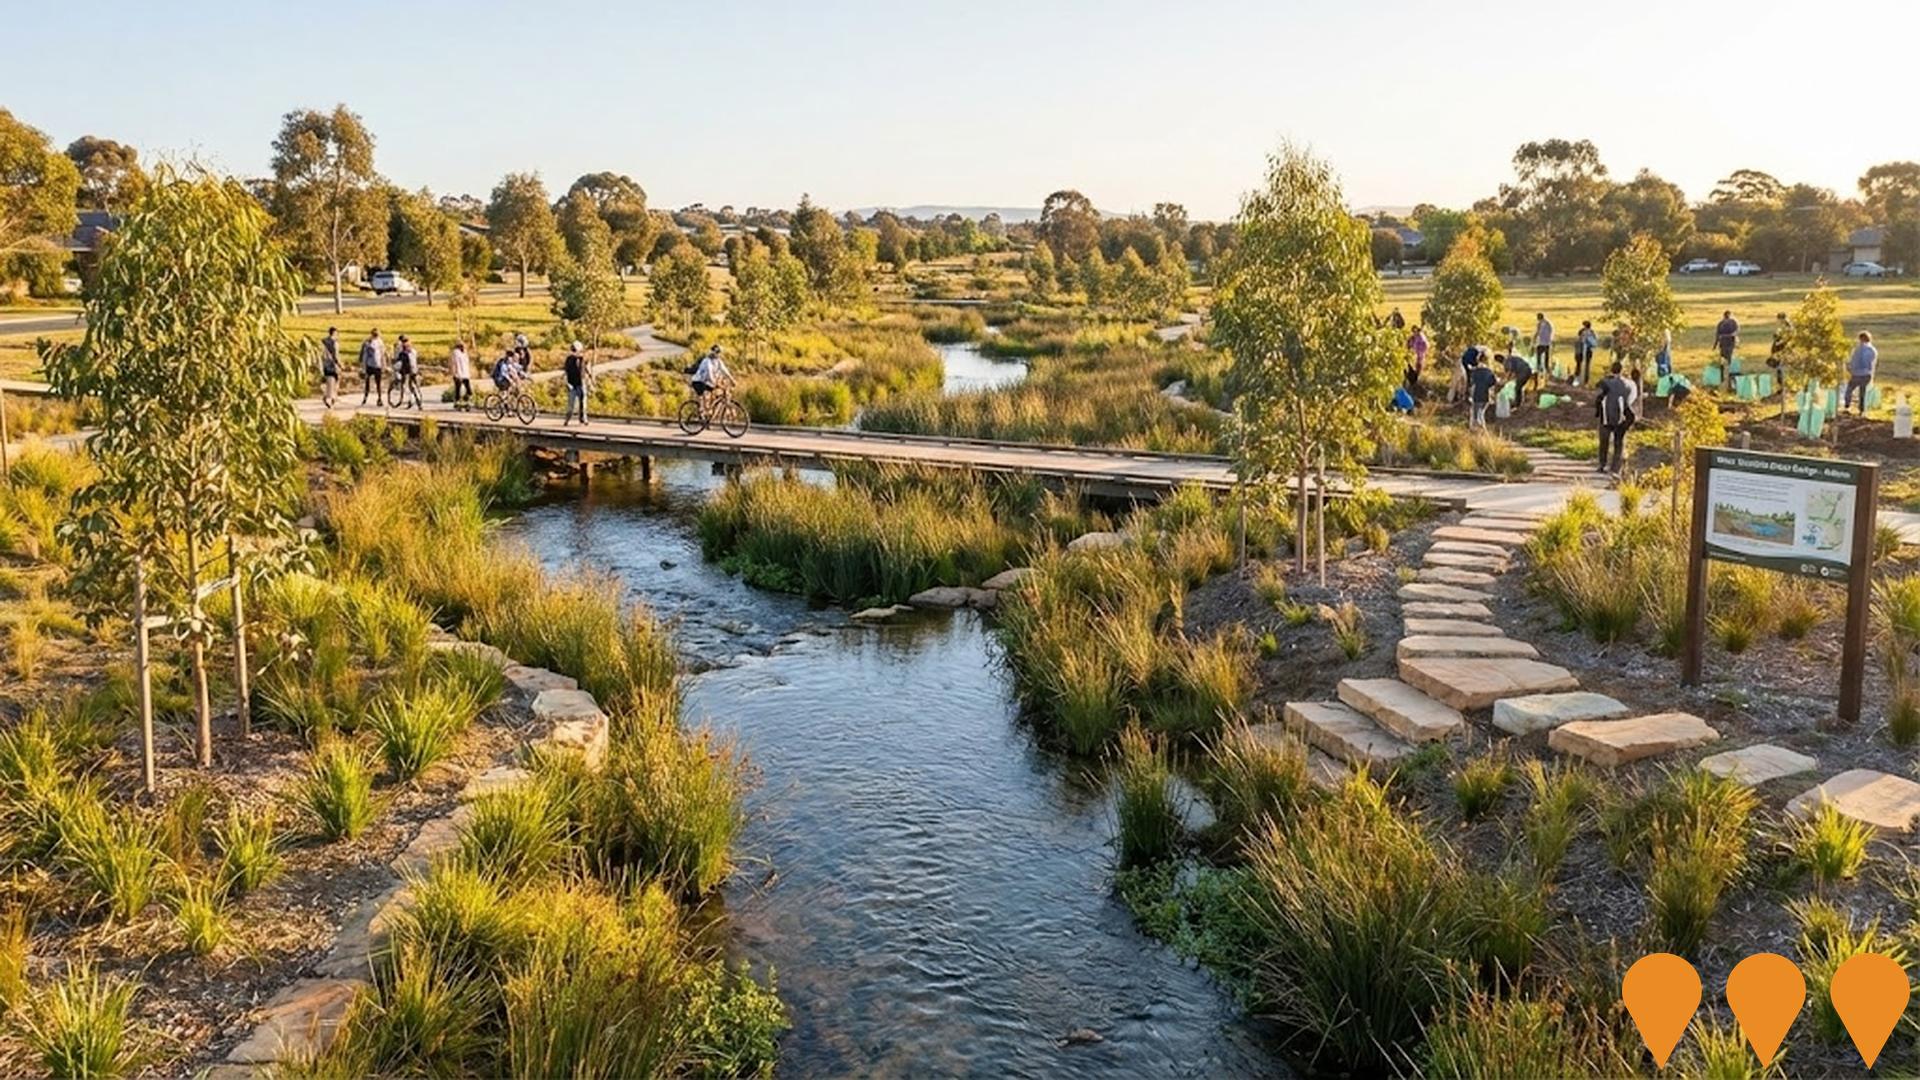
Kaleen Environmental Restoration Project
Restoration of natural habitats and delivery of water sensitive urban design works in Kaleen to improve creek health, reduce stormwater pollutants entering Lake Ginninderra, and enhance local biodiversity and amenity.
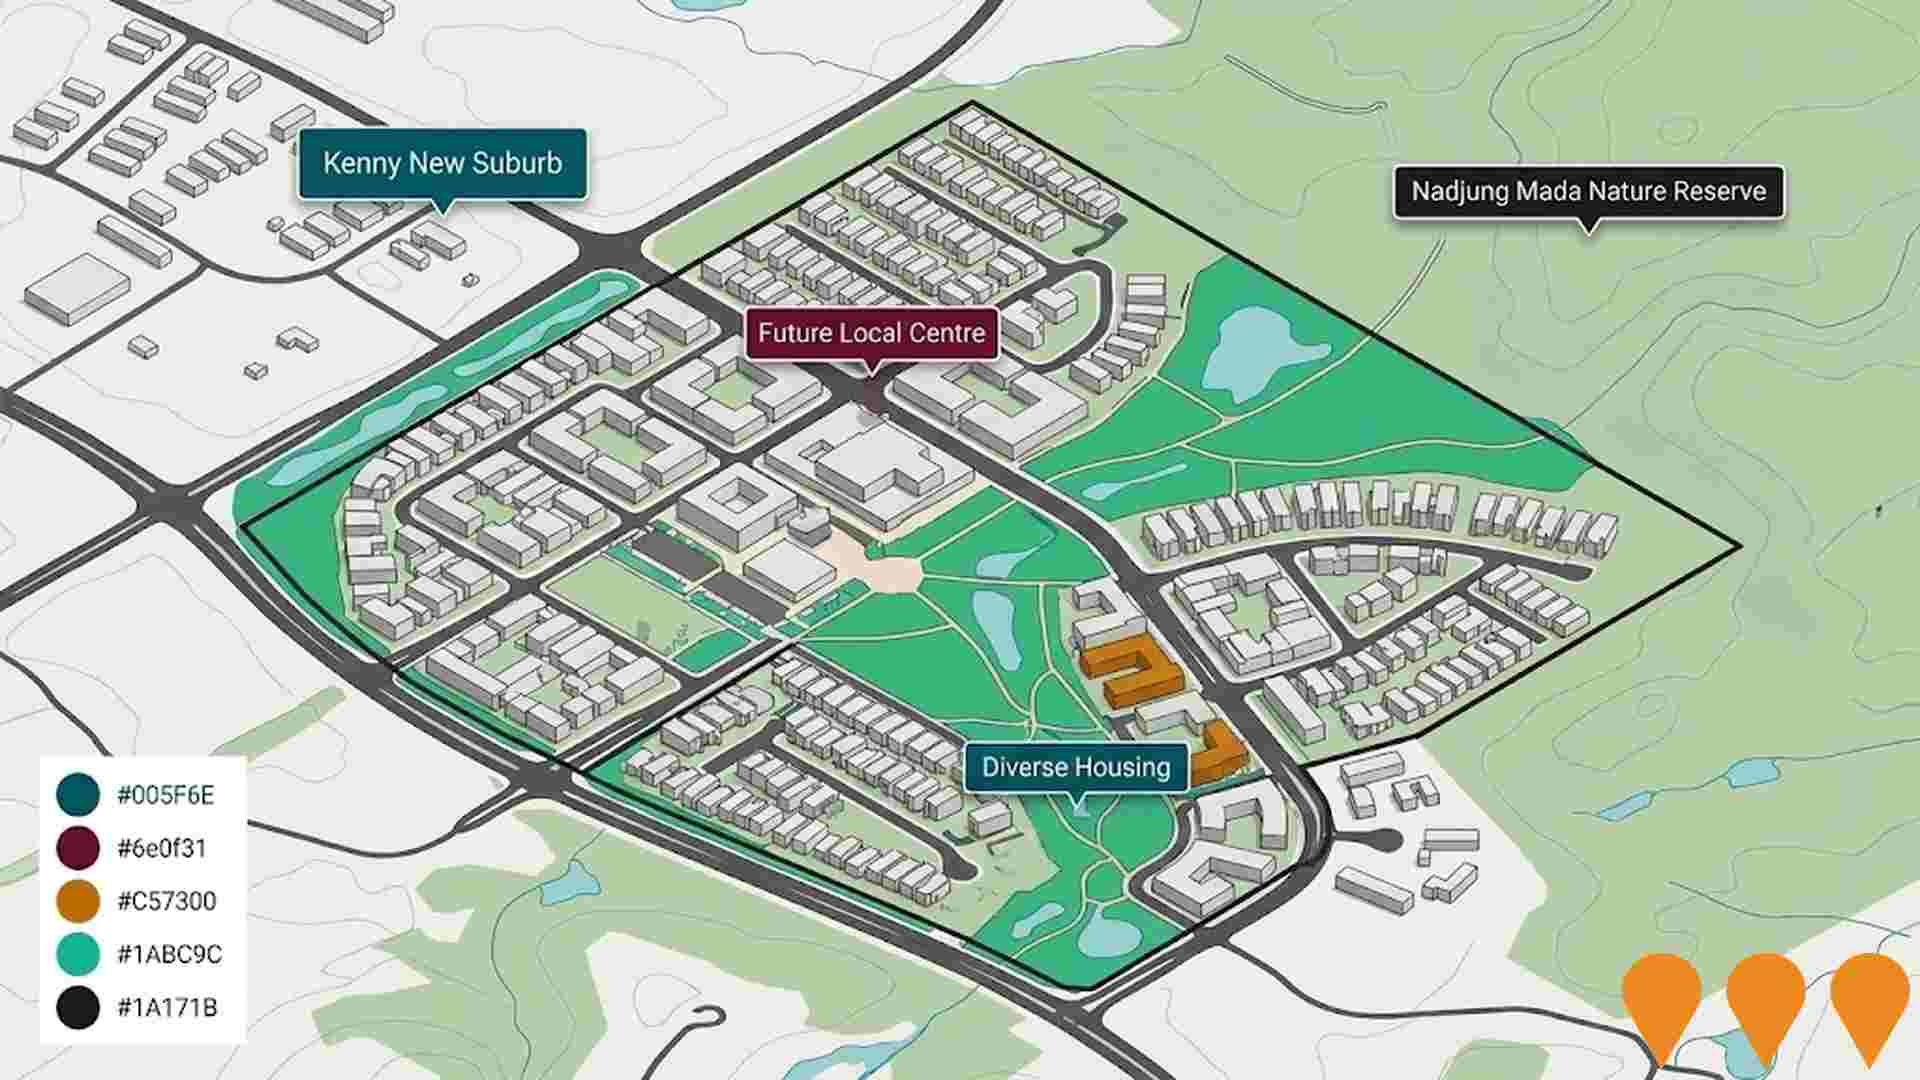
Kenny New Suburb Development
155-hectare new suburb between Watson and Harrison for 4,000+ residents. Will include diverse housing options, local centre, community facilities and connection to Nadjung Mada Nature Reserve. First land releases planned for 2025-26.
Mona Tait Gardens & Bullecourt Retirement Village Expansion
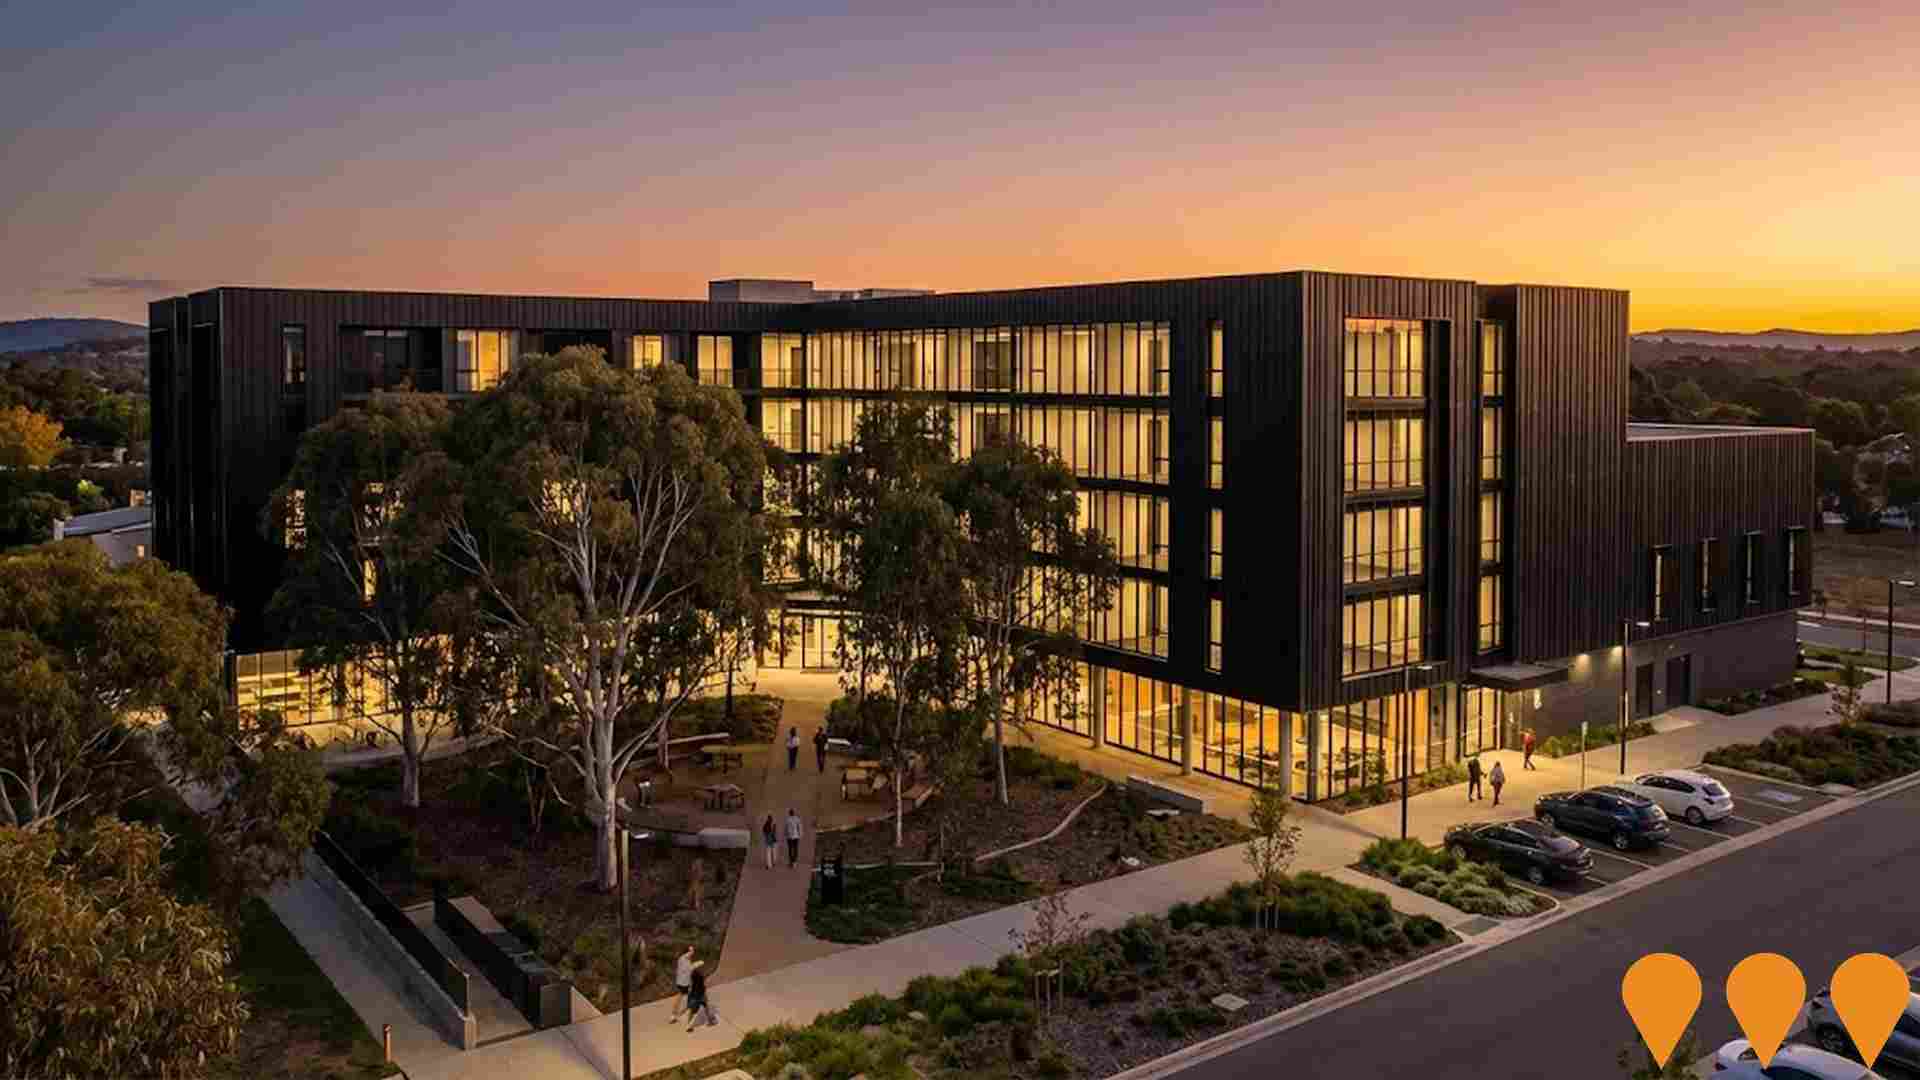
Redevelopment of the RSL LifeCare site, known as Pine Borough, at 160 Ellenborough Street, Kaleen. The project involves the construction of the Bullecourt Retirement Village (Independent Living Units - ILUs) and the operational Mona Tait Gardens Residential Aged Care Facility (RACF). The RACF, providing 80 aged care beds, was completed in May 2020 and became operational in October 2020. Construction on the retirement village part of the site (Stage 1 - Building A with 20 ILUs) was completed in June 2021. Development Application (DA) amendments for subsequent stages (Buildings B and D, to include a Clubhouse and more ILUs) were submitted in July 2022 to the ACT Planning & Land Authority (DA 202240477) to revise the unit mix and increase the number of units to a total of 90 ILUs. The overall project is part of a masterplan for an Aged Care Facility and a Retirement Village.
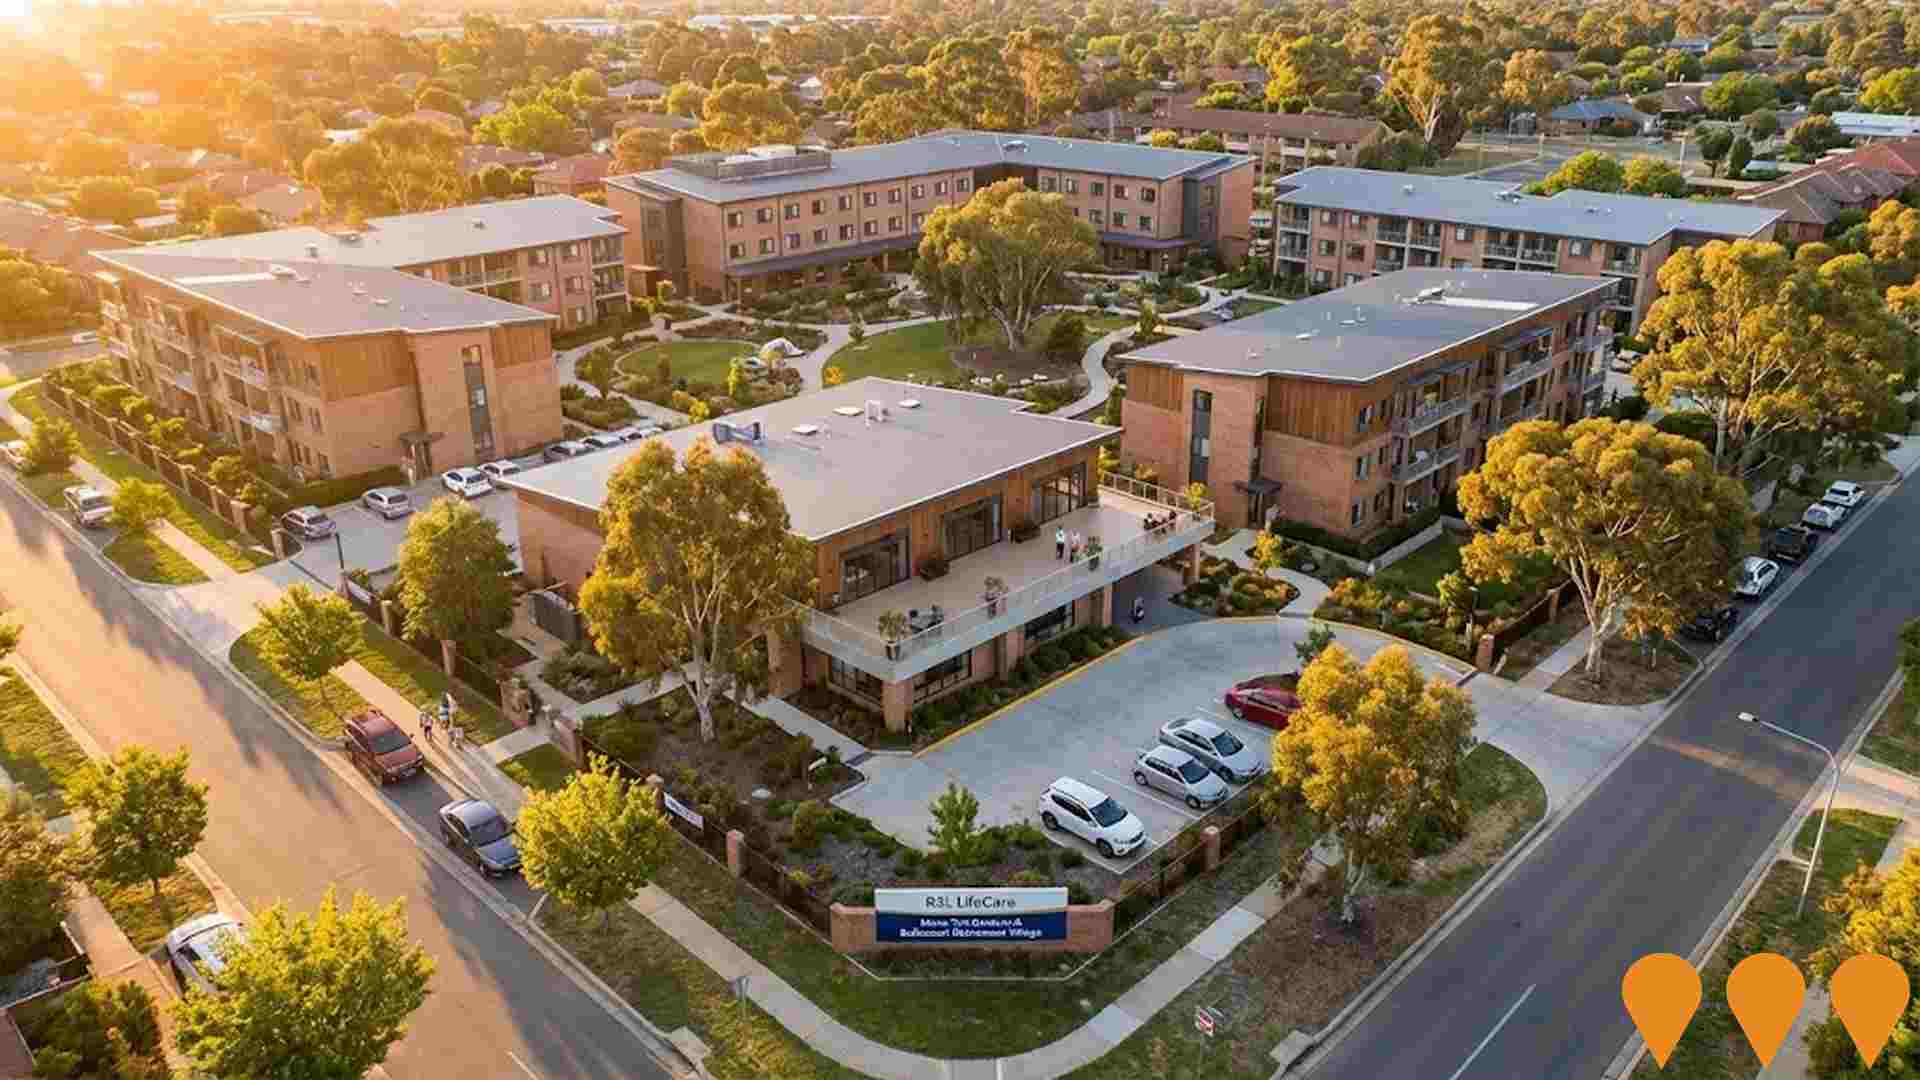
Kaleen Aged Care Precinct - Bullecourt Village Expansion and Mona Tait Gardens Upgrades
RSL LifeCare is progressing a scaled-back expansion of the Kaleen aged care precinct, adding approximately 83 independent living units and a community centre at Bullecourt Village with associated improvements to the adjoining Mona Tait Gardens residential aged care home. The revised scheme reduces height to predominantly two storeys along Warrego Circuit and Ellenborough Street following community feedback.
Employment
Kaleen shows employment indicators that trail behind approximately 70% of regions assessed across Australia
Kaleen has a highly educated workforce with significant representation in essential services sectors. Its unemployment rate was 4.8% as of September 2025, with an estimated employment growth of 0.6% over the past year.
In Kaleen, 3,897 residents were employed while its unemployment rate was 1.3% higher than the Australian Capital Territory's (ACT) rate of 3.6%. Workforce participation in Kaleen lagged behind ACT at 62.6% compared to ACT's 69.6%. Employment among residents was concentrated in public administration & safety, professional & technical services, and education & training sectors. Notably, construction employment levels were at 1.3 times the regional average.
However, public administration & safety was under-represented with only 26.2% of Kaleen's workforce compared to ACT's 30.4%. The predominantly residential area appeared to offer limited local employment opportunities as indicated by Census data on working population versus resident population. In the 12-month period ending in September 2025, employment in Kaleen increased by 0.6% alongside a labour force increase of 0.8%, resulting in an unemployment rate rise of 0.2 percentage points. In comparison, ACT saw employment grow by 1.4%, labour force expand by 1.2%, and unemployment fall by 0.2 percentage points. Providing broader context, state-level data up to 25-Nov-25 showed ACT employment grew by 1.19% year-on-year, adding 710 jobs, with the state unemployment rate at 4.5%. This compared to the national unemployment rate of 4.3%, and ACT's employment growth outpacing the national average of 0.14%. National employment forecasts from Jobs and Skills Australia, published in May-25, projected national employment growth of 6.6% over five years and 13.7% over ten years. Applying these projections to Kaleen's employment mix suggested local employment should increase by 6.4% over five years and 13.1% over ten years. However, it is important to note that these projections are simple weighted extrapolations for illustrative purposes and do not account for localised population projections.
Frequently Asked Questions - Employment
Income
Income metrics indicate excellent economic conditions, with the area achieving higher performance than 75% of national locations assessed by AreaSearch
AreaSearch's latest postcode level ATO data for financial year 2022 shows that Kaleen SA2 has an income above the national average. The median income is $58,726 and the average income stands at $70,920. This contrasts with Australian Capital Territory's figures of a median income of $68,678 and an average income of $83,634. Based on Wage Price Index growth of 13.6% since financial year 2022, current estimates for Kaleen would be approximately $66,713 (median) and $80,565 (average) as of September 2025. Census 2021 income data shows that Kaleen's household, family, and personal incomes rank highly nationally, between the 82nd and 85th percentiles. The earnings profile indicates that 32.4% of locals (2,489 people) fall into the $1,500 - 2,999 weekly income category, reflecting broader area patterns where 34.3% occupy this range. Notably, 37.8% earn above $3,000 weekly. After housing costs, residents retain 87.6% of their income, indicating strong purchasing power. The area's SEIFA income ranking places it in the 8th decile.
Frequently Asked Questions - Income
Housing
Kaleen is characterized by a predominantly suburban housing profile, with above-average rates of outright home ownership
As of the latest Census, dwelling structures in Kaleen consisted of 91.2% houses and 8.8% other dwellings (semi-detached, apartments, 'other' dwellings). This compares to the Australian Capital Territory's figures of 69.4% houses and 30.5% other dwellings. Home ownership in Kaleen stood at 40.2%, with mortgaged dwellings at 34.7% and rented dwellings at 25.1%. The median monthly mortgage repayment in the area was $2,167, exceeding the Australian Capital Territory average of $2,000. The median weekly rent figure for Kaleen was $460, compared to the Australian Capital Territory's $430. Nationally, Kaleen's median monthly mortgage repayments were higher at $2,167 than the Australian average of $1,863, and median weekly rents were substantially higher at $460 compared to the national figure of $375.
Frequently Asked Questions - Housing
Household Composition
Kaleen features high concentrations of group households, with a higher-than-average median household size
Family households account for 76.0% of all households, including 35.7% couples with children, 28.7% couples without children, and 10.4% single parent families. Non-family households constitute the remaining 24.0%, with lone person households at 19.1% and group households comprising 5.0%. The median household size is 2.7 people, which is larger than the Australian Capital Territory average of 2.5.
Frequently Asked Questions - Households
Local Schools & Education
Kaleen shows strong educational performance, ranking in the upper quartile nationally when assessed across multiple qualification and achievement indicators
Educational attainment in Kaleen is notably higher than national averages. Among residents aged 15 and above, 42.6% possess university qualifications, compared to Australia's 30.4%. This includes 24.5% with bachelor degrees, 12.7% with postgraduate qualifications, and 5.4% with graduate diplomas. Vocational credentials are also prevalent, with 26.0% of residents holding such qualifications – 10.0% have advanced diplomas and 16.0% hold certificates.
Educational participation is high, with 29.1% currently enrolled in formal education. This includes 9.3% in primary education, 7.0% in secondary education, and 6.5% pursuing tertiary education.
Frequently Asked Questions - Education
Schools Detail
Nearby Services & Amenities
Transport
Transport servicing is low compared to other areas nationally based on assessment of service frequency, route connectivity and accessibility
Transport analysis shows 41 active stops in Kaleen, served by buses along six routes. These routes offer 566 weekly passenger trips. Residents' average distance to the nearest stop is 226 meters.
Daily service averages 80 trips across all routes, equating to about 13 weekly trips per stop.
Frequently Asked Questions - Transport
Transport Stops Detail
Health
Kaleen's residents are relatively healthy in comparison to broader Australia with a fairly standard level of common health conditions seen across both young and old age cohorts
Kaleen's health metrics closely align with national benchmarks, exhibiting typical levels of common health conditions across both young and elderly age groups. Approximately 55% (~4225 people) have private health cover, slightly lower than the Australian Capital Territory's 57.1%.
Mental health issues affect 8.5% of residents, while arthritis impacts 7.8%, with 68.2% reporting no medical ailments, similar to the ACT's 68.1%. The area has a higher proportion of seniors aged 65 and over at 22.4% (1718 people), compared to the ACT's 15.3%. Overall, Kaleen's health profile is broadly in line with general population trends.
Frequently Asked Questions - Health
Cultural Diversity
The level of cultural diversity witnessed in Kaleen was found to be above average when compared nationally for a number of language and cultural background related metrics
Kaleen was found to be more culturally diverse than most local markets, with 30.1% of its population born overseas and 26.5% speaking a language other than English at home. Christianity is the predominant religion in Kaleen, comprising 45.0% of its population. Buddhism, however, is overrepresented in Kaleen at 3.6%, compared to 3.0% across Australian Capital Territory.
The top three ancestry groups in Kaleen are Australian (22.7%), English (22.5%), and Other (10.9%). Notably, Croatian (1.4%) and Serbian (0.5%) are overrepresented compared to regional figures of 0.8% and 0.3%, respectively, while Hungarian is also slightly overrepresented at 0.4%.
Frequently Asked Questions - Diversity
Age
Kaleen's population aligns closely with national norms in age terms
Kaleen's median age is 39, which is higher than the Australian Capital Territory figure of 35 and comparable to Australia's median age of 38. The age group of 65-74 years shows strong representation in Kaleen at 11.8%, compared to the Australian Capital Territory figure. However, the 25-34 age cohort is less prevalent in Kaleen at 11.7%. Between 2021 and present, the 75 to 84 age group has grown from 5.4% to 8.0% of Kaleen's population. Conversely, the 25 to 34 age cohort has declined from 13.3% to 11.7%, and the 65 to 74 age group has dropped from 12.9% to 11.8%. Looking ahead to 2041, demographic projections reveal significant shifts in Kaleen's age structure. The 85+ age group is projected to grow by 95 people, reaching 392 from a current figure of 200. This growth will be led by the aging population dynamic, with those aged 65 and above comprising all of the projected growth. Conversely, the 55 to 64 and 45 to 54 age cohorts are expected to experience population declines.
