Chart Color Schemes
This analysis uses ABS Statistical Areas Level 2 (SA2) boundaries, which can materially differ from Suburbs and Localities (SAL) even when sharing similar names.
SA2 boundaries are defined by the Australian Bureau of Statistics and are designed to represent communities for statistical reporting (e.g., census and ERP).
Suburbs and Localities (SAL) represent commonly-used suburb/locality names (postal-style areas) and may use different geographic boundaries. For comprehensive analysis, consider reviewing both boundary types if available.
est. as @ -- *
ABS ERP | -- people | --
2021 Census | -- people
Sales Activity
Curious about local property values? Filter the chart to assess the volume and appreciation (including resales) trends and regional comparisons, or scroll to the map below view this information at an individual property level.
Find a Recent Sale
Sales Detail
Population
Population growth drivers in Crace are above average based on AreaSearch's ranking of recent, and medium to long-term trends
Crace's population is approximately 4,768 as of November 2025. This figure represents a decrease of 32 individuals, or 0.7%, since the 2021 Census which reported a population of 4,800. The change is inferred from the estimated resident population of 4,779 in June 2024 and address validation since the Census date. This results in a population density ratio of 2,889 persons per square kilometer, placing Crace in the upper quartile relative to national locations assessed by AreaSearch. Over the past decade, Crace has shown resilient growth patterns with a compound annual growth rate of 4.5%, outperforming its SA3 area. Natural growth contributed approximately 58.6% of overall population gains during recent periods.
AreaSearch adopts ABS/Geoscience Australia projections for each SA2 area, released in 2024 with 2022 as the base year. For areas not covered by this data and years post-2032, age group growth rates from the ACT Government's SA2 area projections are used, also based on 2022. Population projections indicate lower quartile growth for Australian statistical areas, with Crace expected to expand by 194 persons to 2041, reflecting a total gain of 4.3% over the 17 years.
Frequently Asked Questions - Population
Development
Residential dwelling approval activity has been practically non-existent in Crace
Crace has seen few dwelling approvals in recent years. Between FY-21 and FY-25, only 3 homes were approved, with none so far in FY-26.
The area's population decline has maintained adequate housing supply relative to demand, resulting in a balanced market with good buyer choice. New homes are being built at an average construction cost of $401,000, indicating a focus on the premium segment. Compared to the Australian Capital Territory, Crace has less development activity. This scarcity can strengthen demand and prices for existing properties. The area's level is below the national average, suggesting its established nature and potential planning limitations. All new construction in Crace has been detached houses, preserving its suburban character and attracting space-seeking buyers. Developers are constructing more detached housing than previously indicated (70.0% at Census), reflecting strong demand for family homes.
Frequently Asked Questions - Development
Infrastructure
Crace has limited levels of nearby infrastructure activity, ranking in the 11thth percentile nationally
No infrastructure changes or major projects have been identified by AreaSearch that could impact the area. Key projects include Gungahlin College East (Nicholls), Kaleen Local Centre Enhancements, Kenny New Suburb Development, and Kaleen Primary School Facility Upgrades.
Professional plan users can use the search below to filter and access additional projects.
INFRASTRUCTURE SEARCH
 Denotes AI-based impression for illustrative purposes only, not to be taken as definitive under any circumstances. Please follow links and conduct other investigations from the project's source for actual imagery. Developers and project owners wishing us to use original imagery please Contact Us and we will do so.
Frequently Asked Questions - Infrastructure
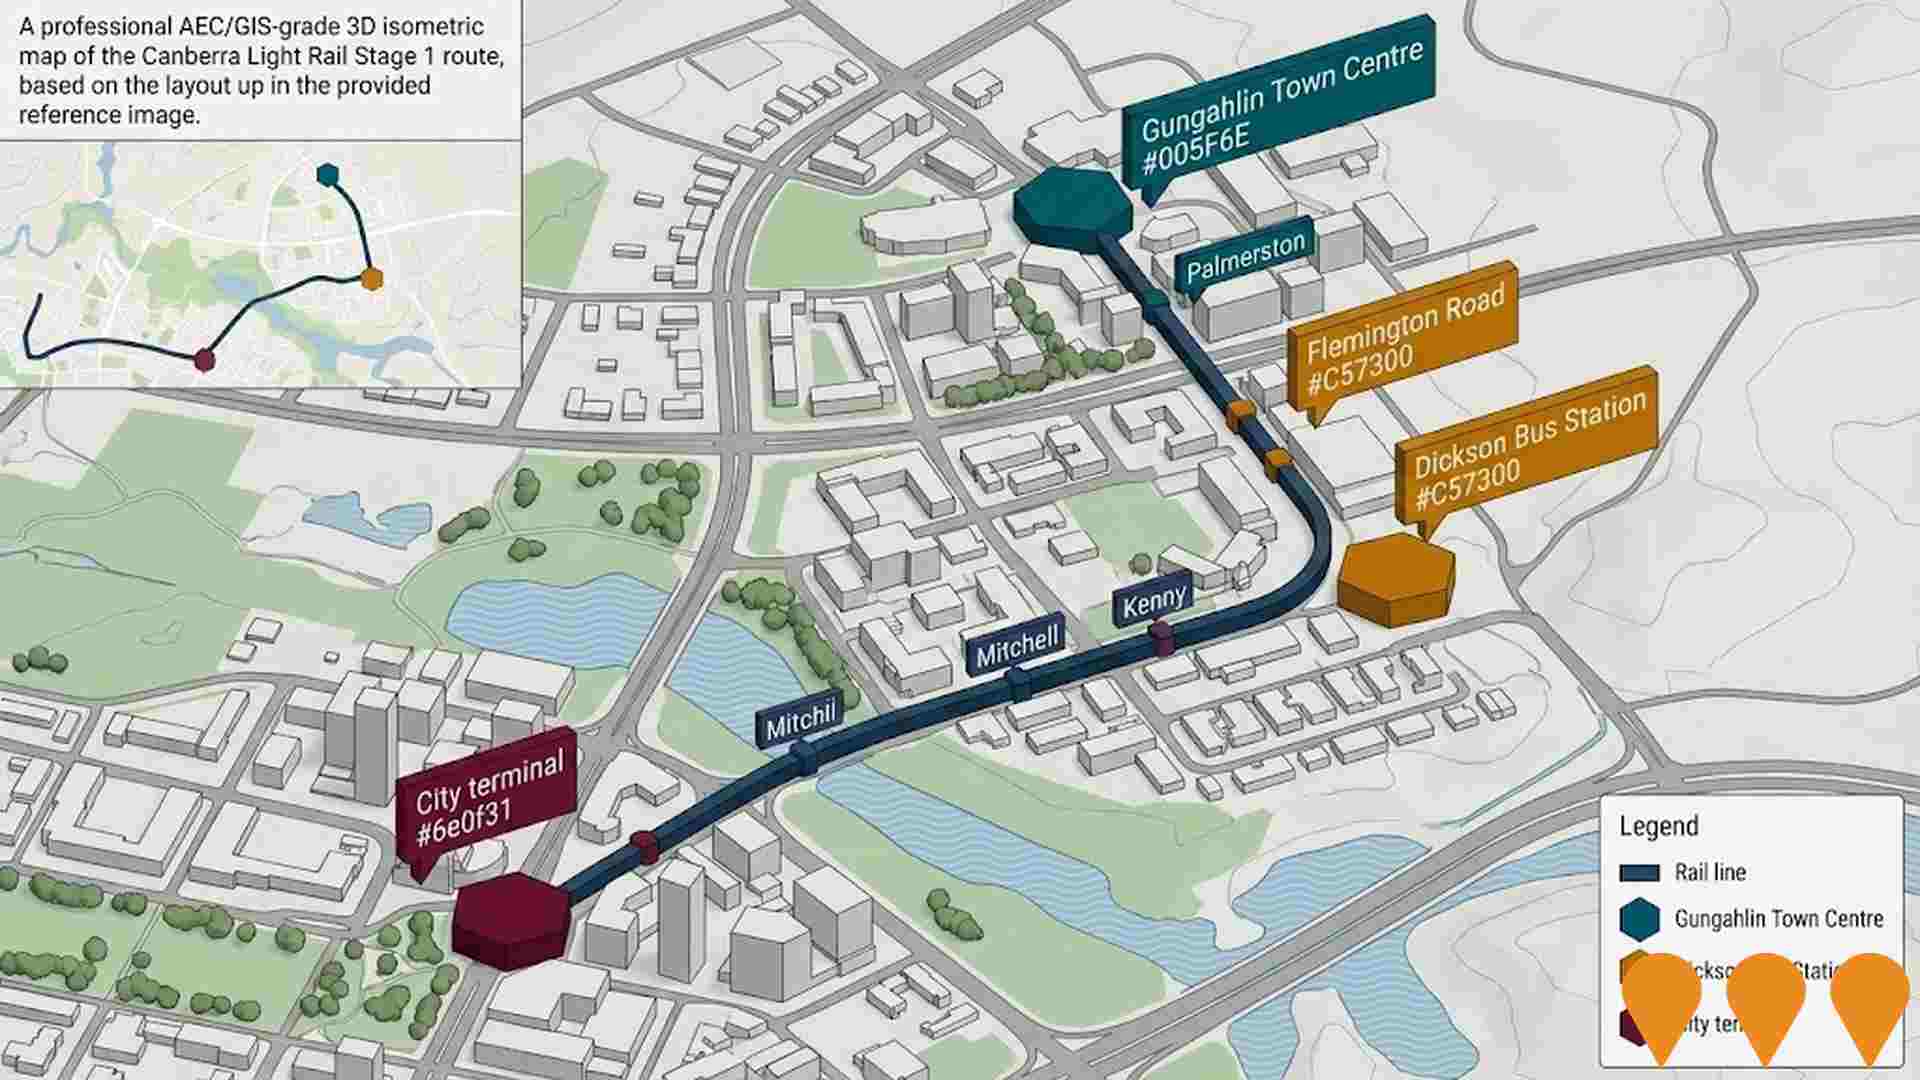
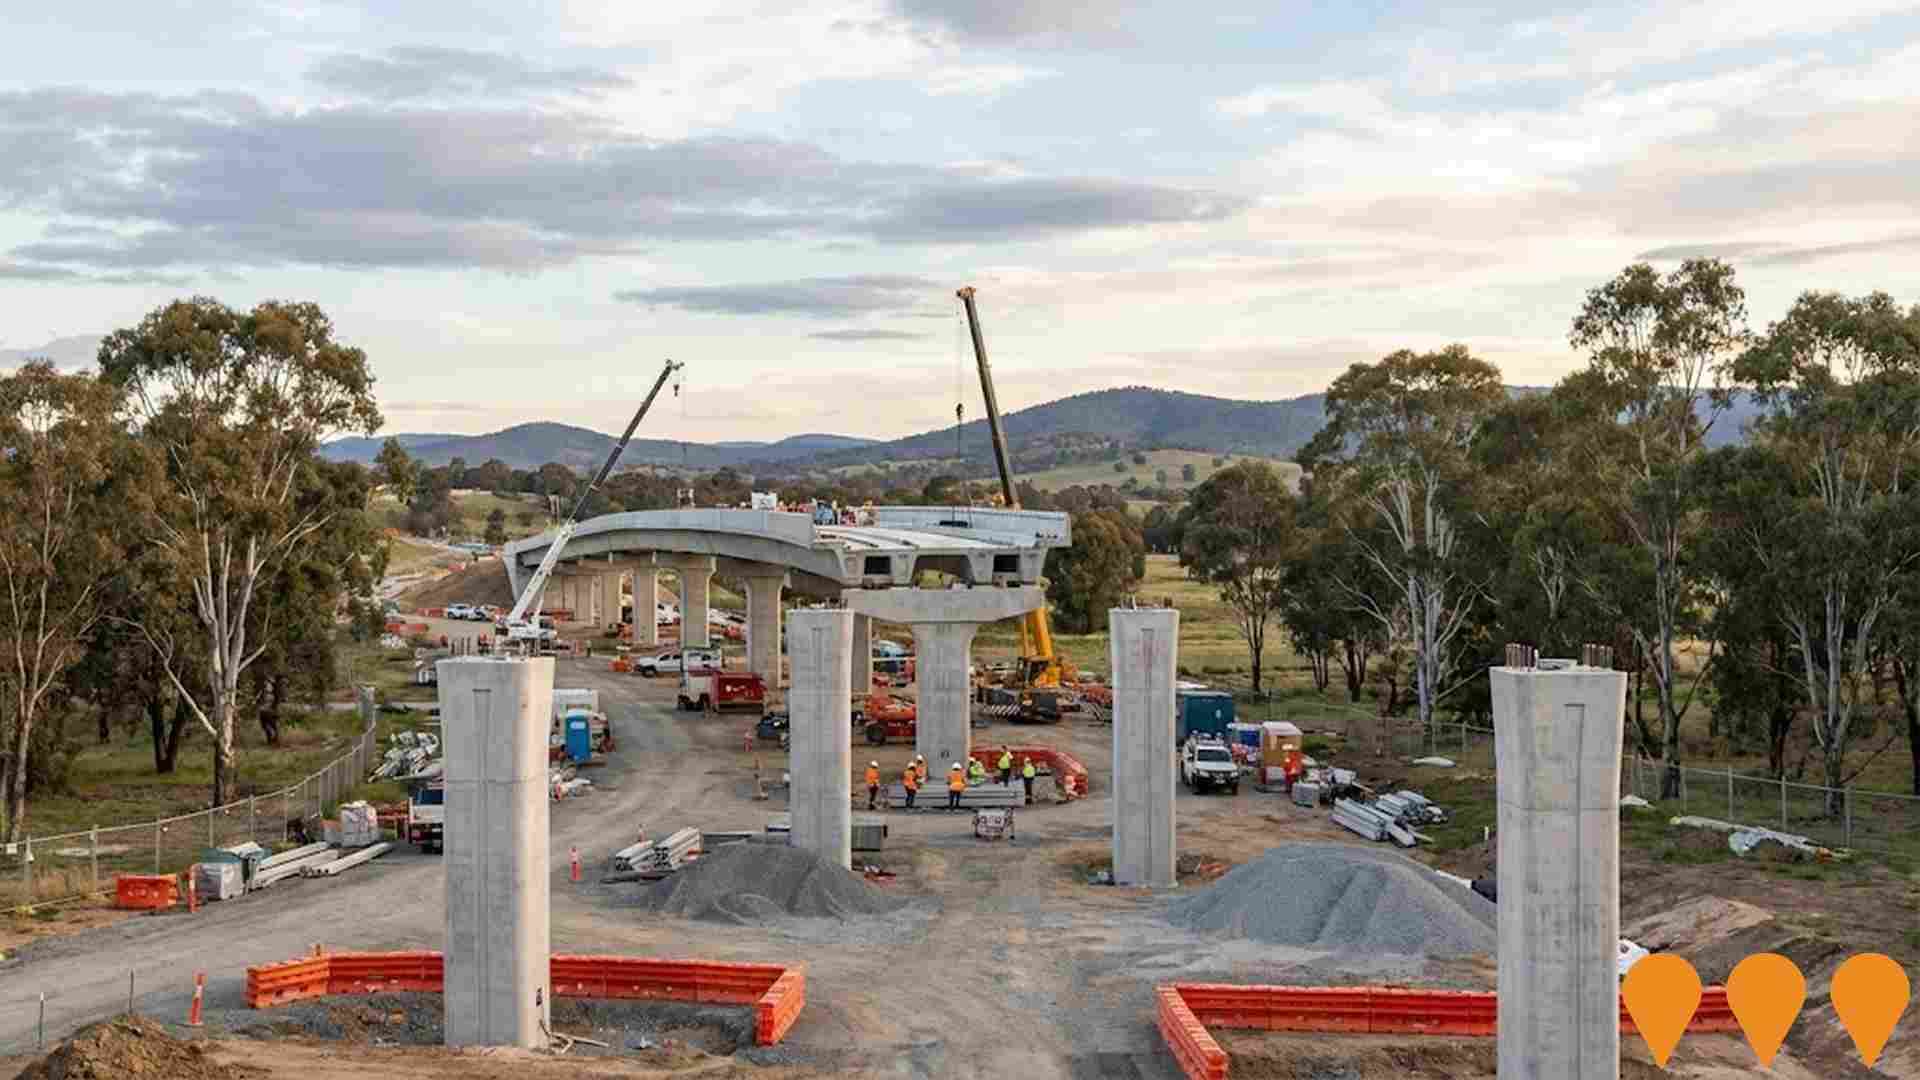
Canberra Light Rail Stage 3: Belconnen to City (Bruce Alignment)
Planning and feasibility analysis for the future Stage 3 of the Canberra Light Rail network, connecting Belconnen Town Centre to the City via Bruce. The proposed corridor serves major precincts including the University of Canberra, CIT Bruce, North Canberra Hospital, and GIO Stadium. The project follows the Belconnen Transitway alignment and aims to provide high-capacity public transport to the north-west.
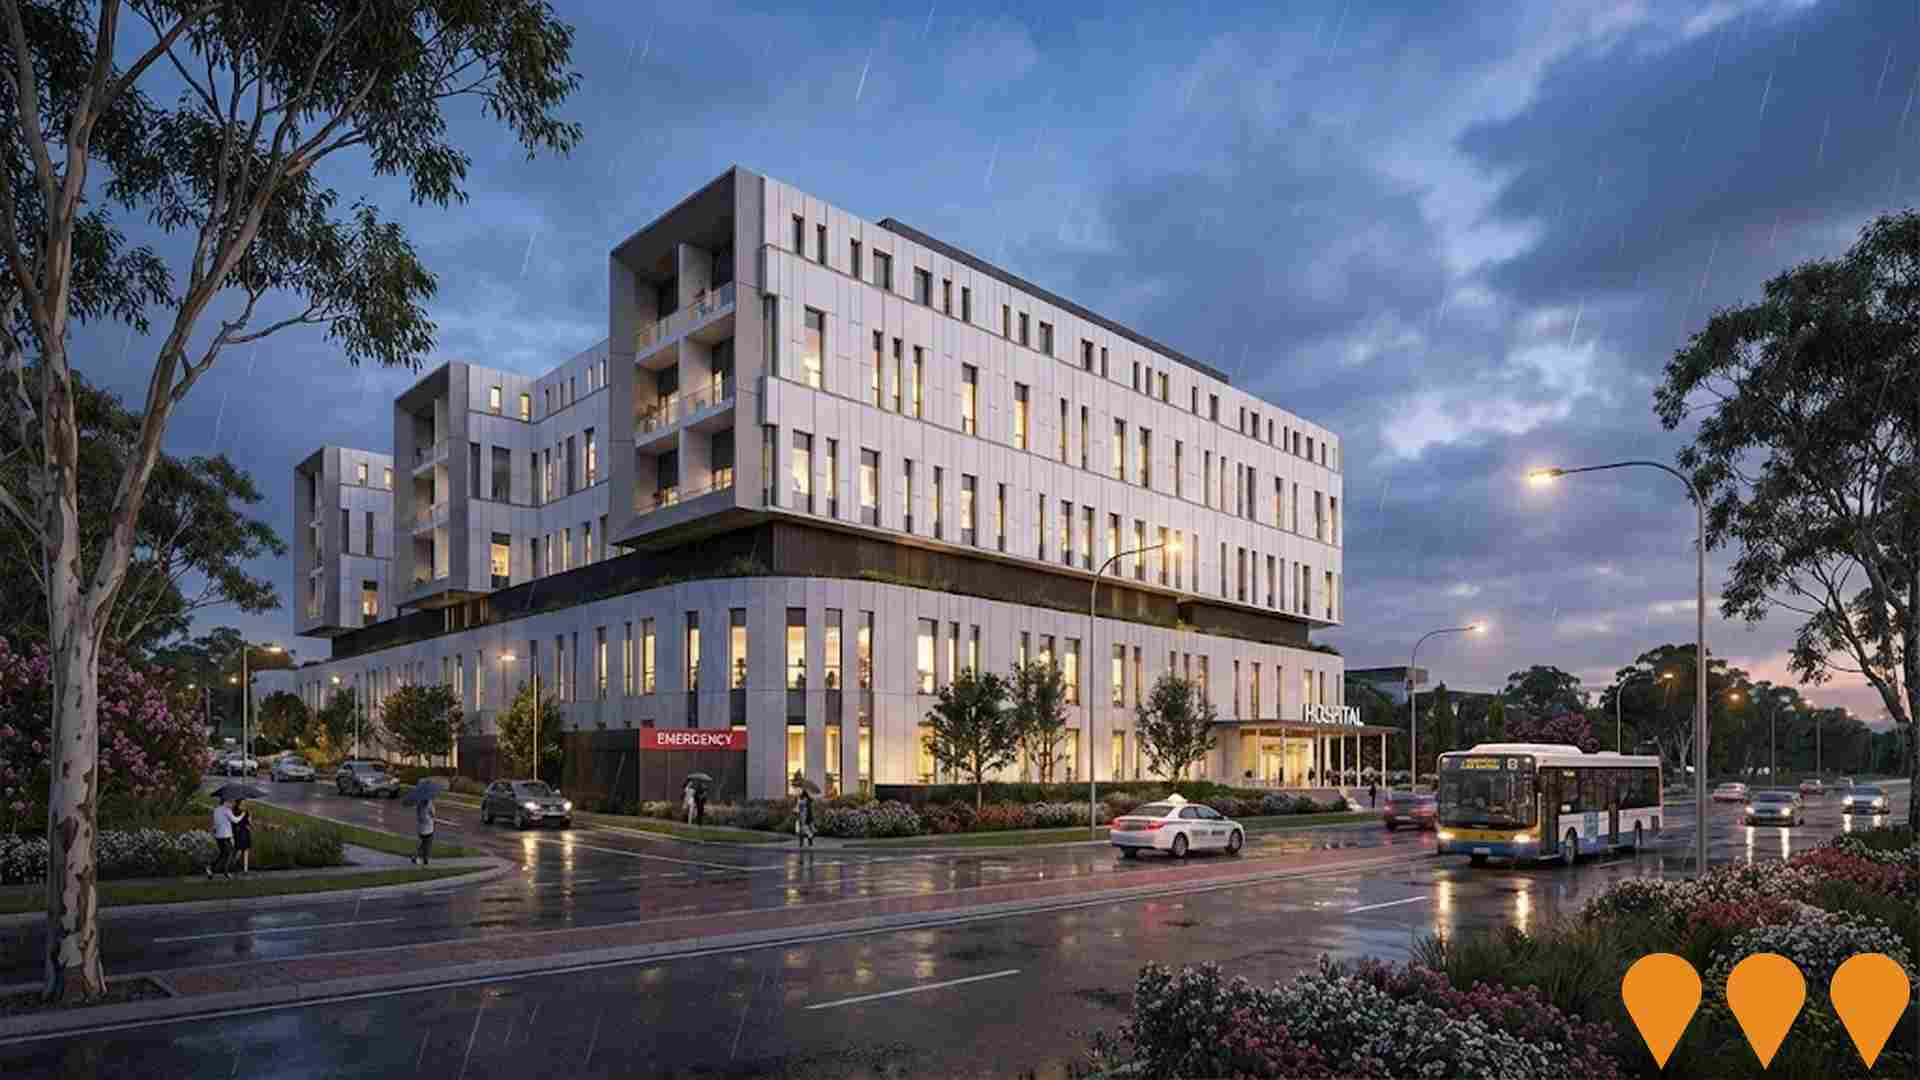
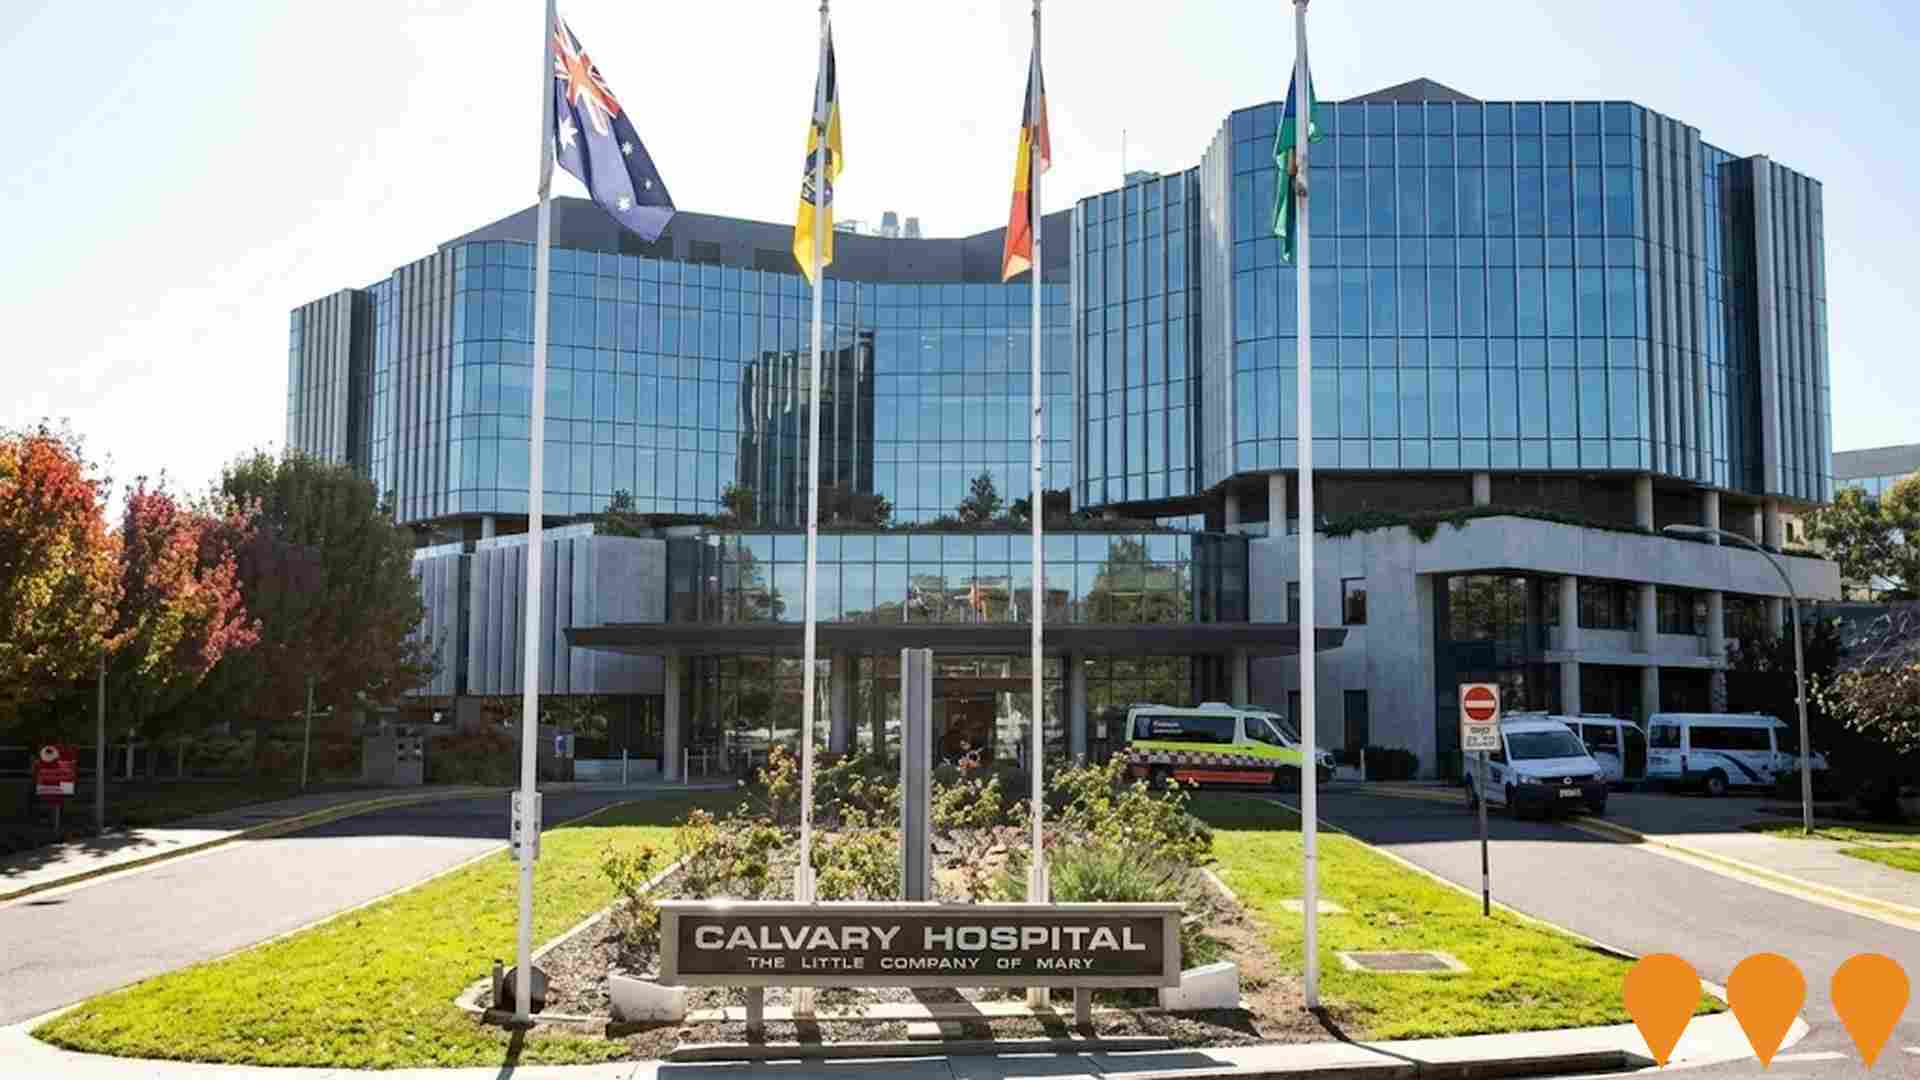
New Northside Hospital (North Canberra Hospital Redevelopment)
Development of a new major tertiary hospital on the existing North Canberra Hospital campus (formerly Calvary Public Hospital). The project involves an investment of over $1 billion to construct a new state-of-the-art clinical services building, expanded emergency department, and modern inpatient facilities to replace aging infrastructure.
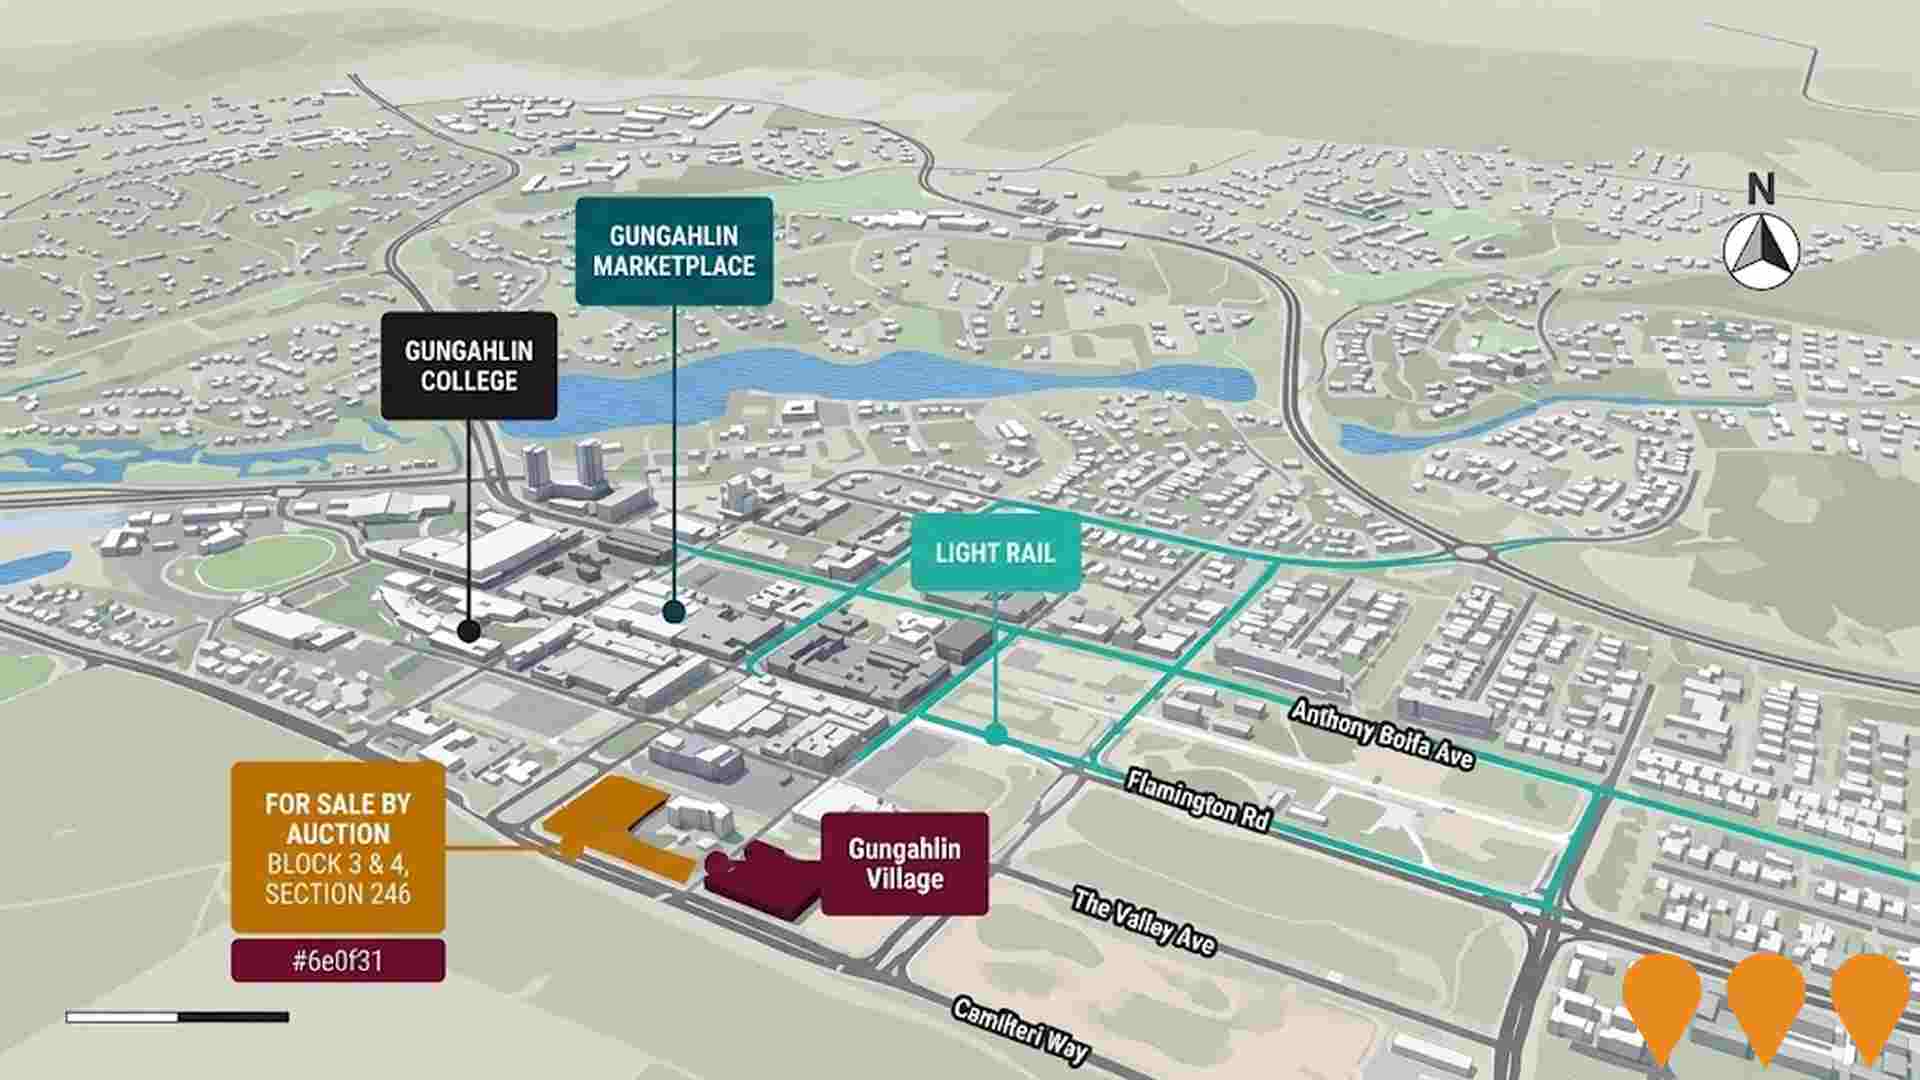
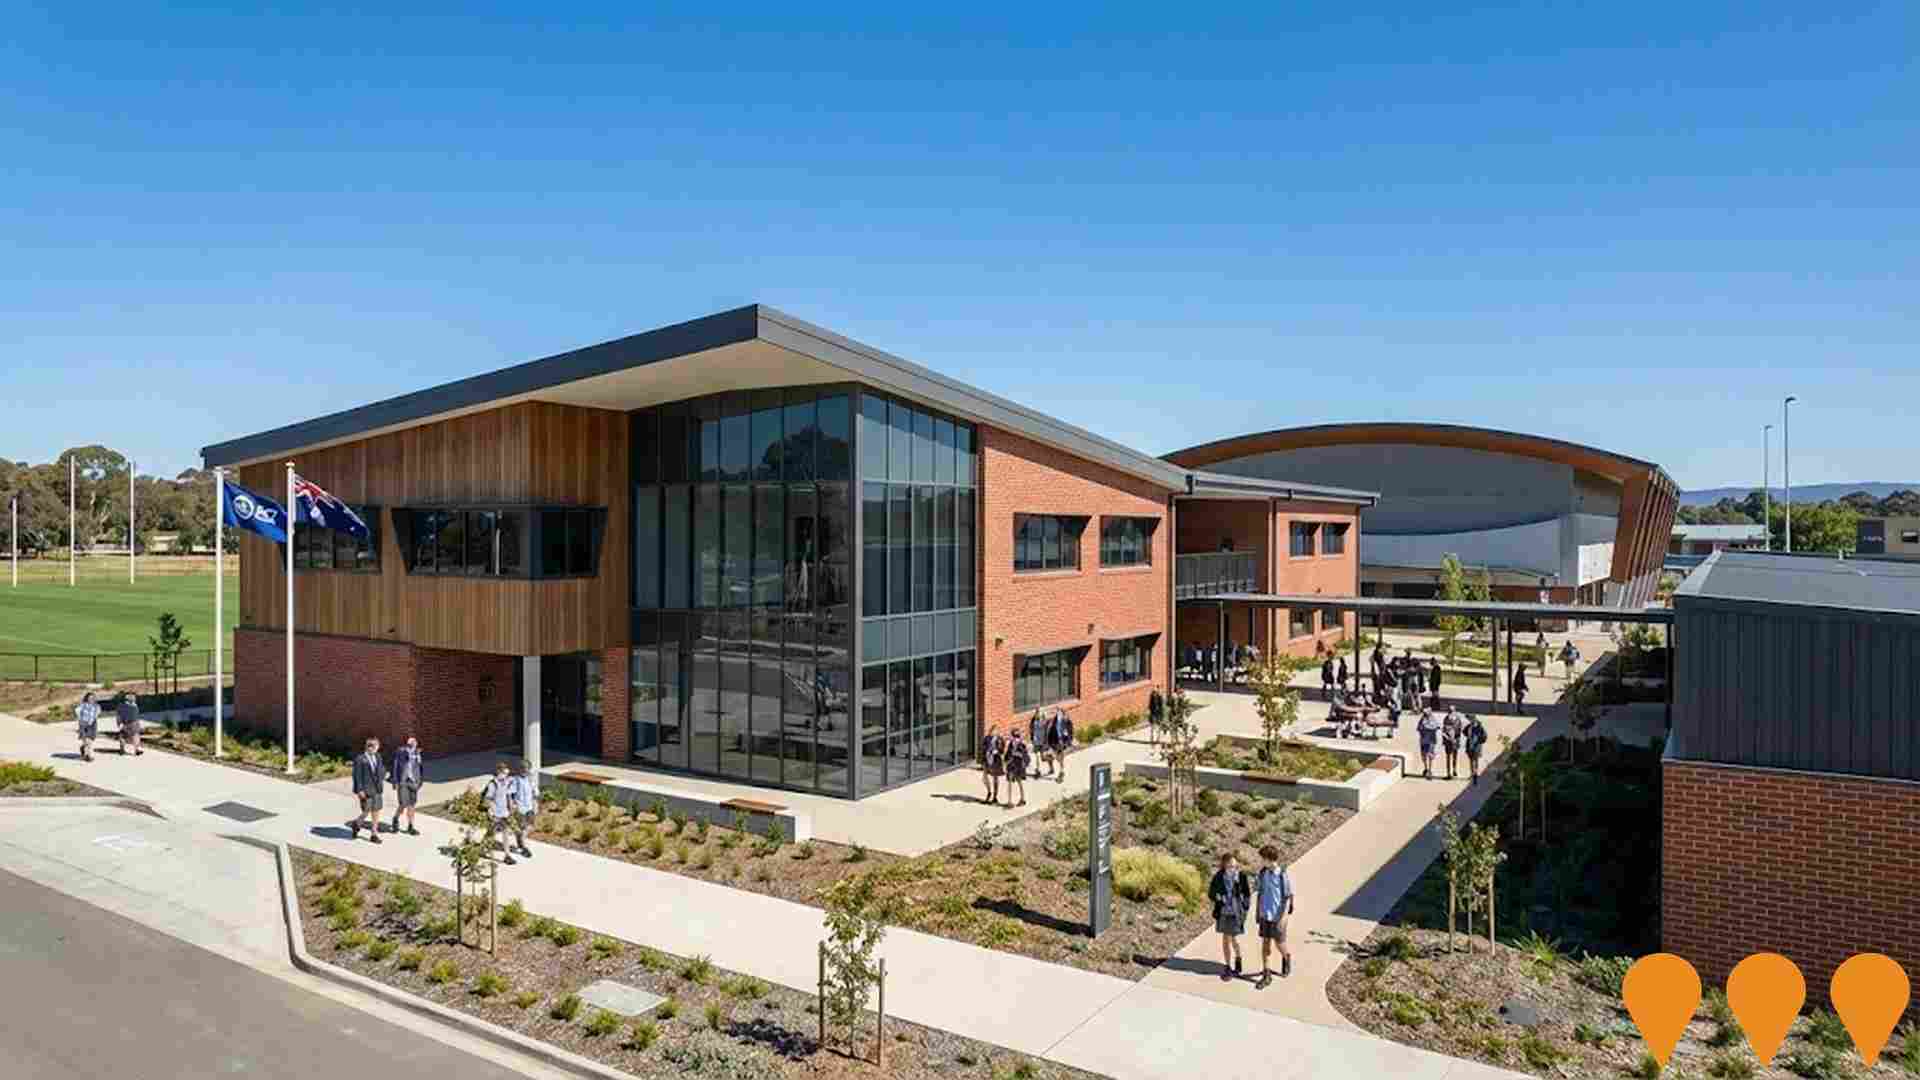
Gungahlin College East (Nicholls)
New public secondary college in Nicholls (Gungahlin East) for Years 7-10 initially, opening with capacity for 800 students and designed to expand to 1,100. Includes state-of-the-art learning spaces, performing arts centre, sports facilities and shared community use areas. Part of the ACT Government's $800 million school infrastructure program.
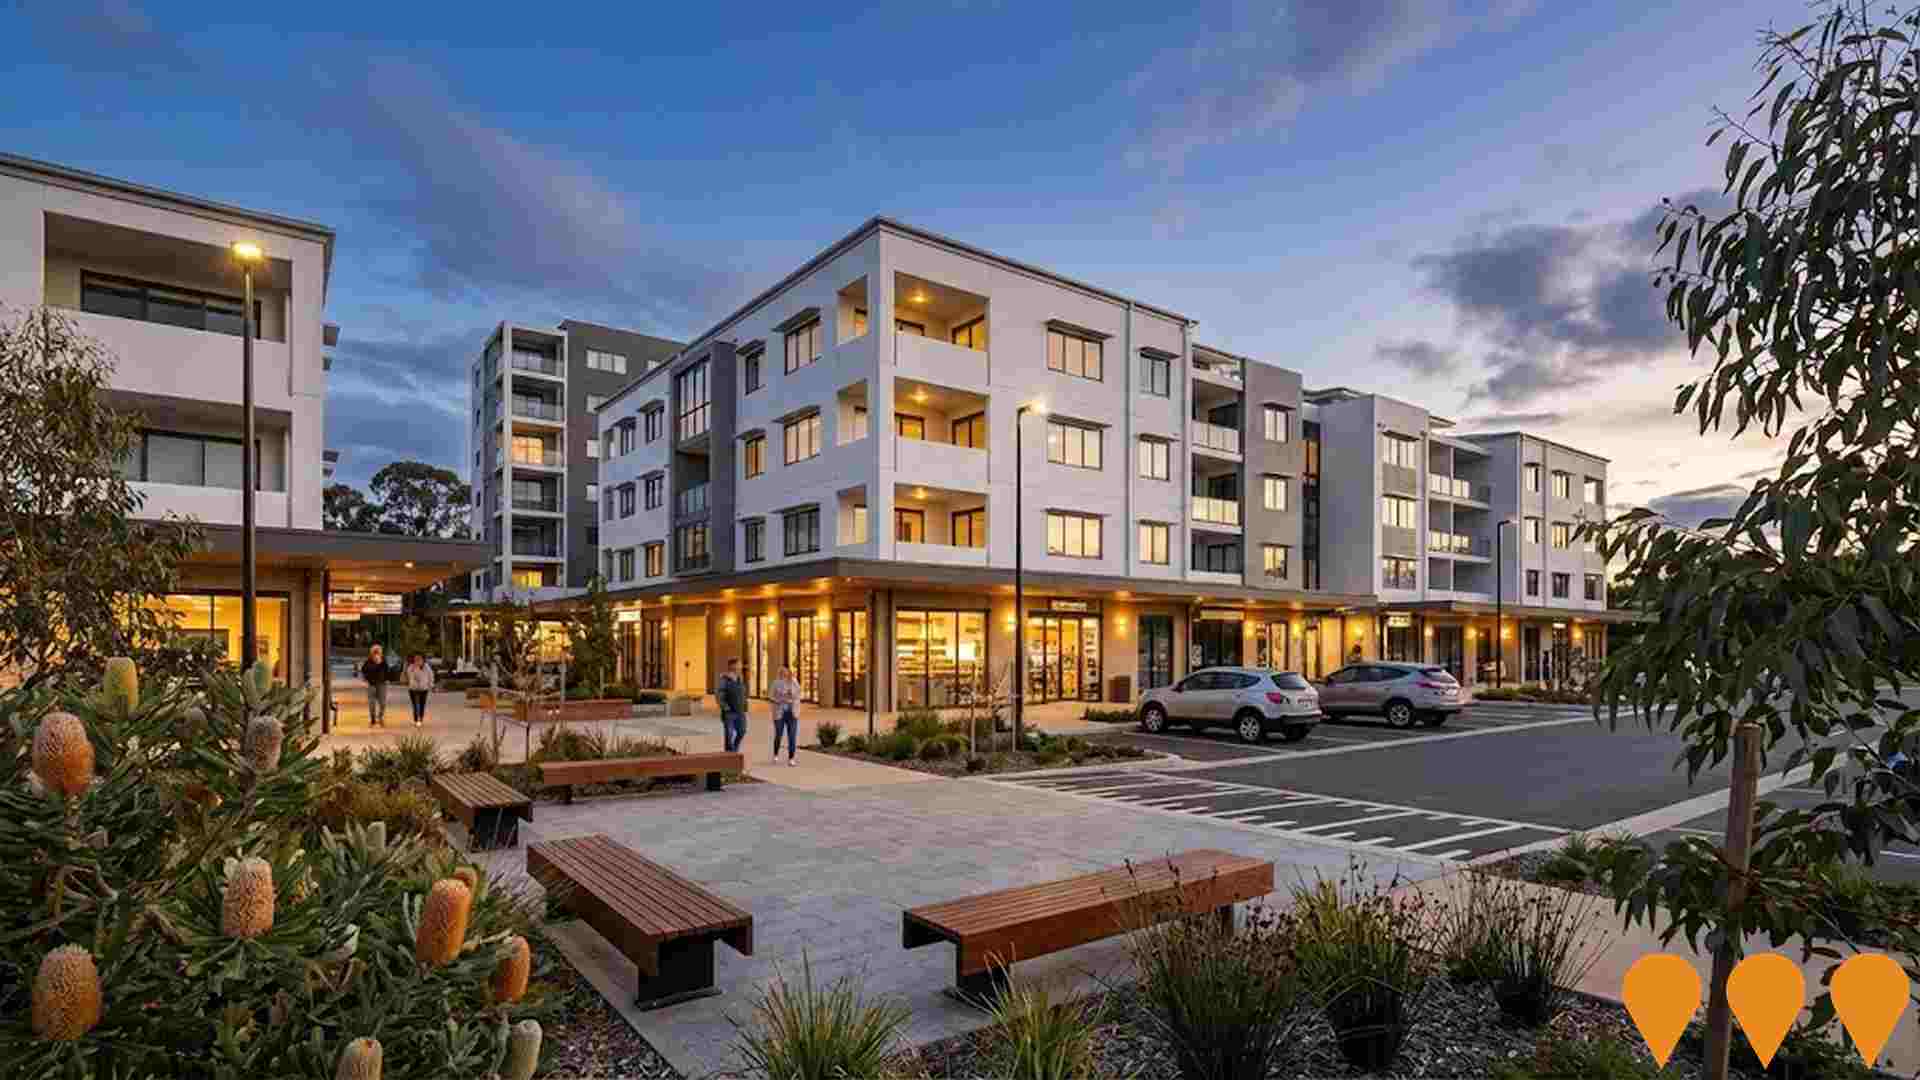
Kaleen Local Centre Enhancements
Potential future upgrade and modest expansion of Kaleen local shops (Kaleen Plaza) including improved access, parking, landscaping and retail floorspace. As of December 2025 no Development Application has been lodged for expansion of the plaza itself. Nearby public realm upgrades at Gwydir Square (South Kaleen) were completed in 2022, and a separate mixed-use DA at the former Eastlake Football Club site (16 Georgina Crescent) remains under assessment. This record tracks possible future plaza enhancements subject to lessee or ACT Government initiation.
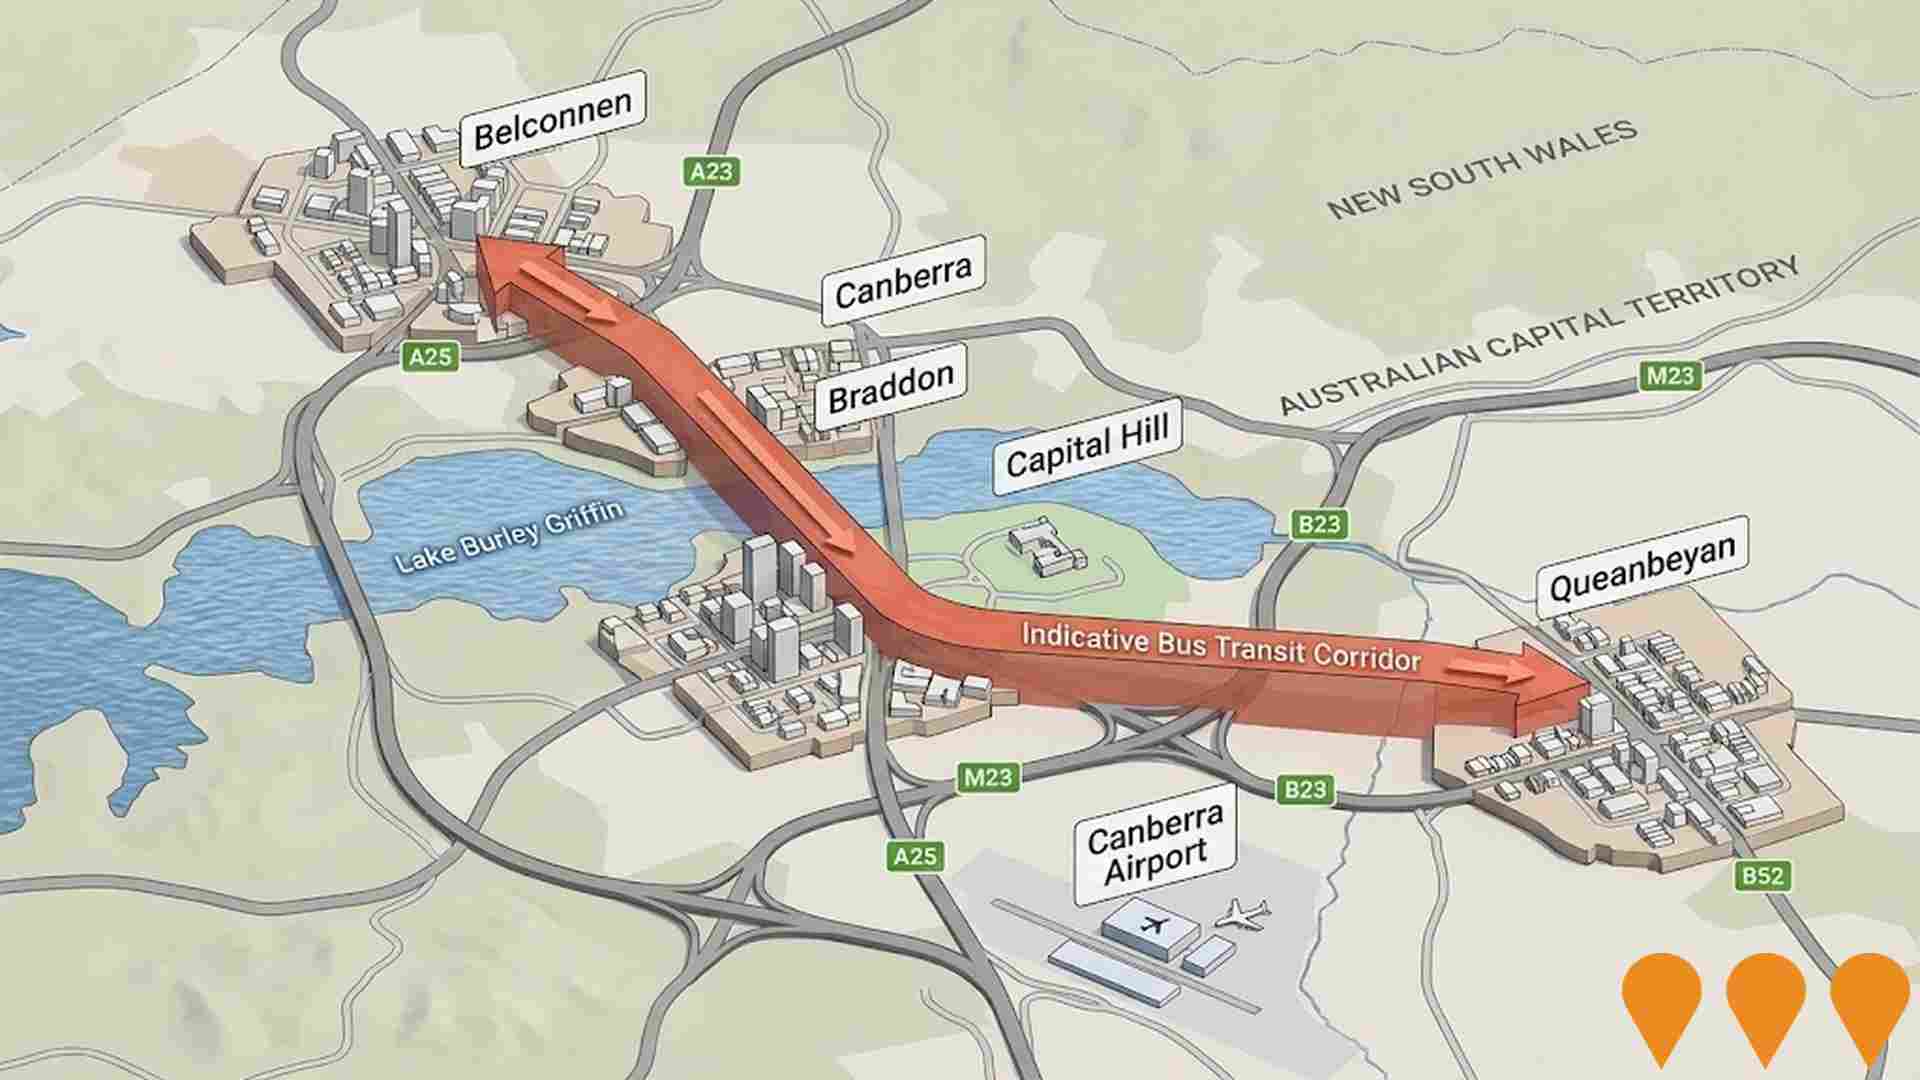
Enhanced bus and light rail corridors (Belconnen & Queanbeyan to Central Canberra)
ACT is progressing an integrated program to enhance high-frequency bus and future light rail corridors that link Belconnen and Queanbeyan with central Canberra. Light Rail Stage 2A (City to Commonwealth Park) commenced construction in early 2025 with services targeted from 2028, while planning and approvals continue for Stage 2B to Woden. The ACT Government has acknowledged and is planning upgrades for the Belconnen-to-City bus corridor as groundwork for a future east-west light rail Stage 3, and is coordinating cross-border public transport initiatives with NSW through the Queanbeyan Region Integrated Transport Plan and the ACT-NSW MoU for Regional Collaboration.
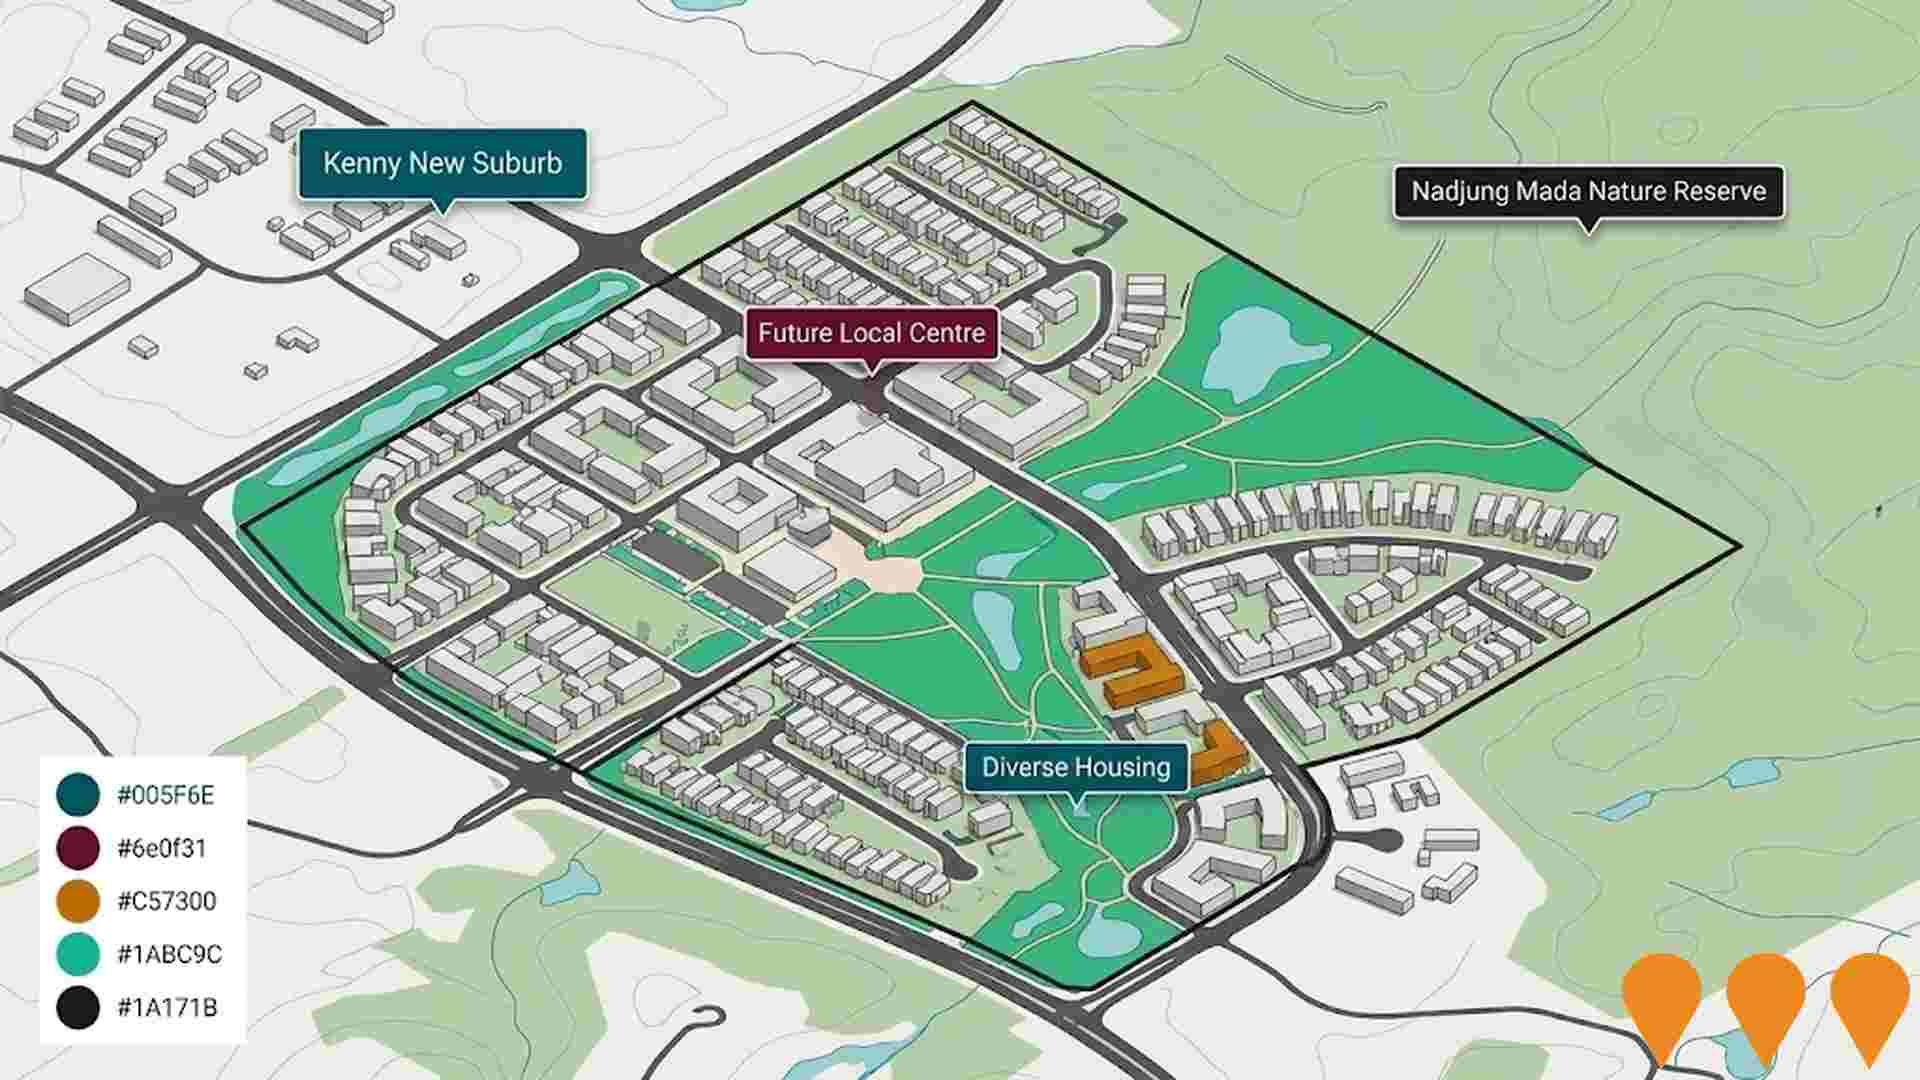
Kenny New Suburb Development
155-hectare new suburb between Watson and Harrison for 4,000+ residents. Will include diverse housing options, local centre, community facilities and connection to Nadjung Mada Nature Reserve. First land releases planned for 2025-26.
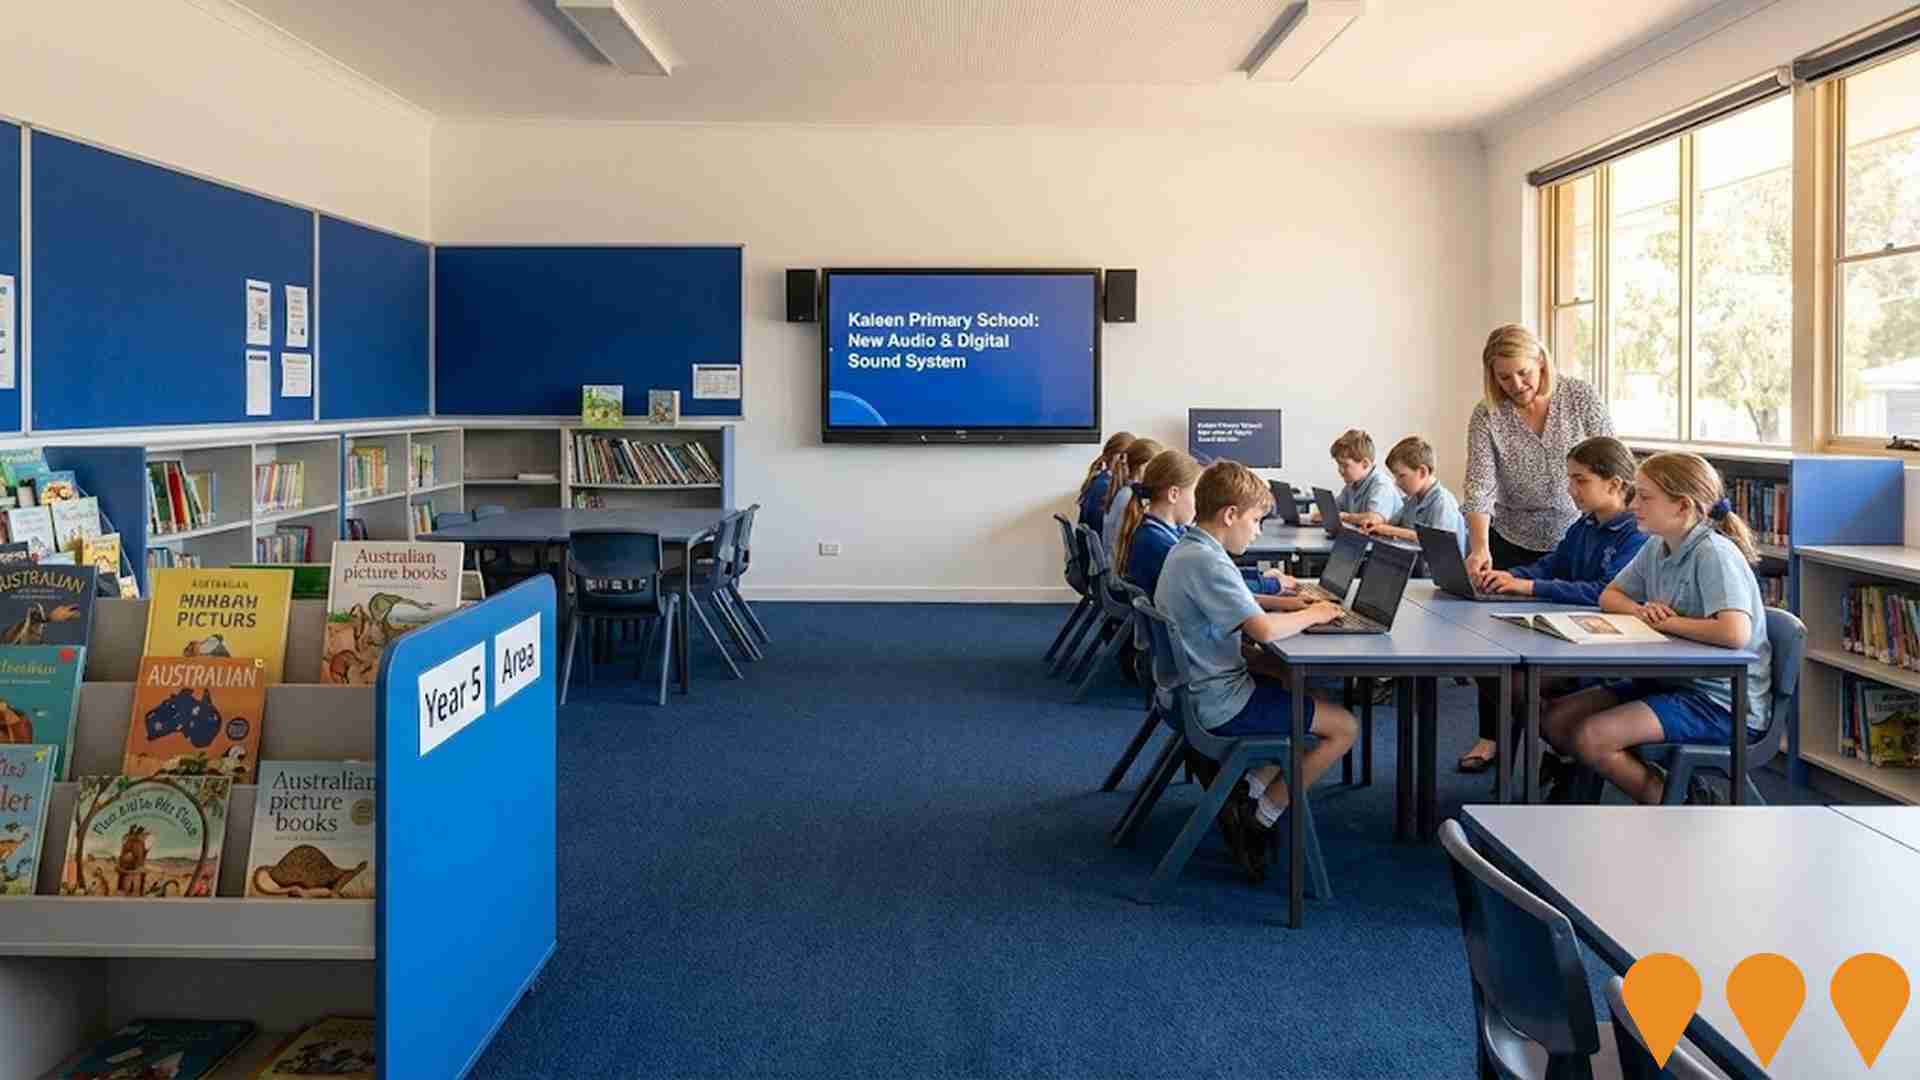
Kaleen Primary School Facility Upgrades
Ongoing facility upgrades at Kaleen Primary School to improve learning and community spaces. Recent and planned works include new carpet in the Year 5 area, soundproofing in the gym, a new audio and digital sound system in the hall, painting in junior school toilets, and funding set aside for an inclusive playground project in 2025.
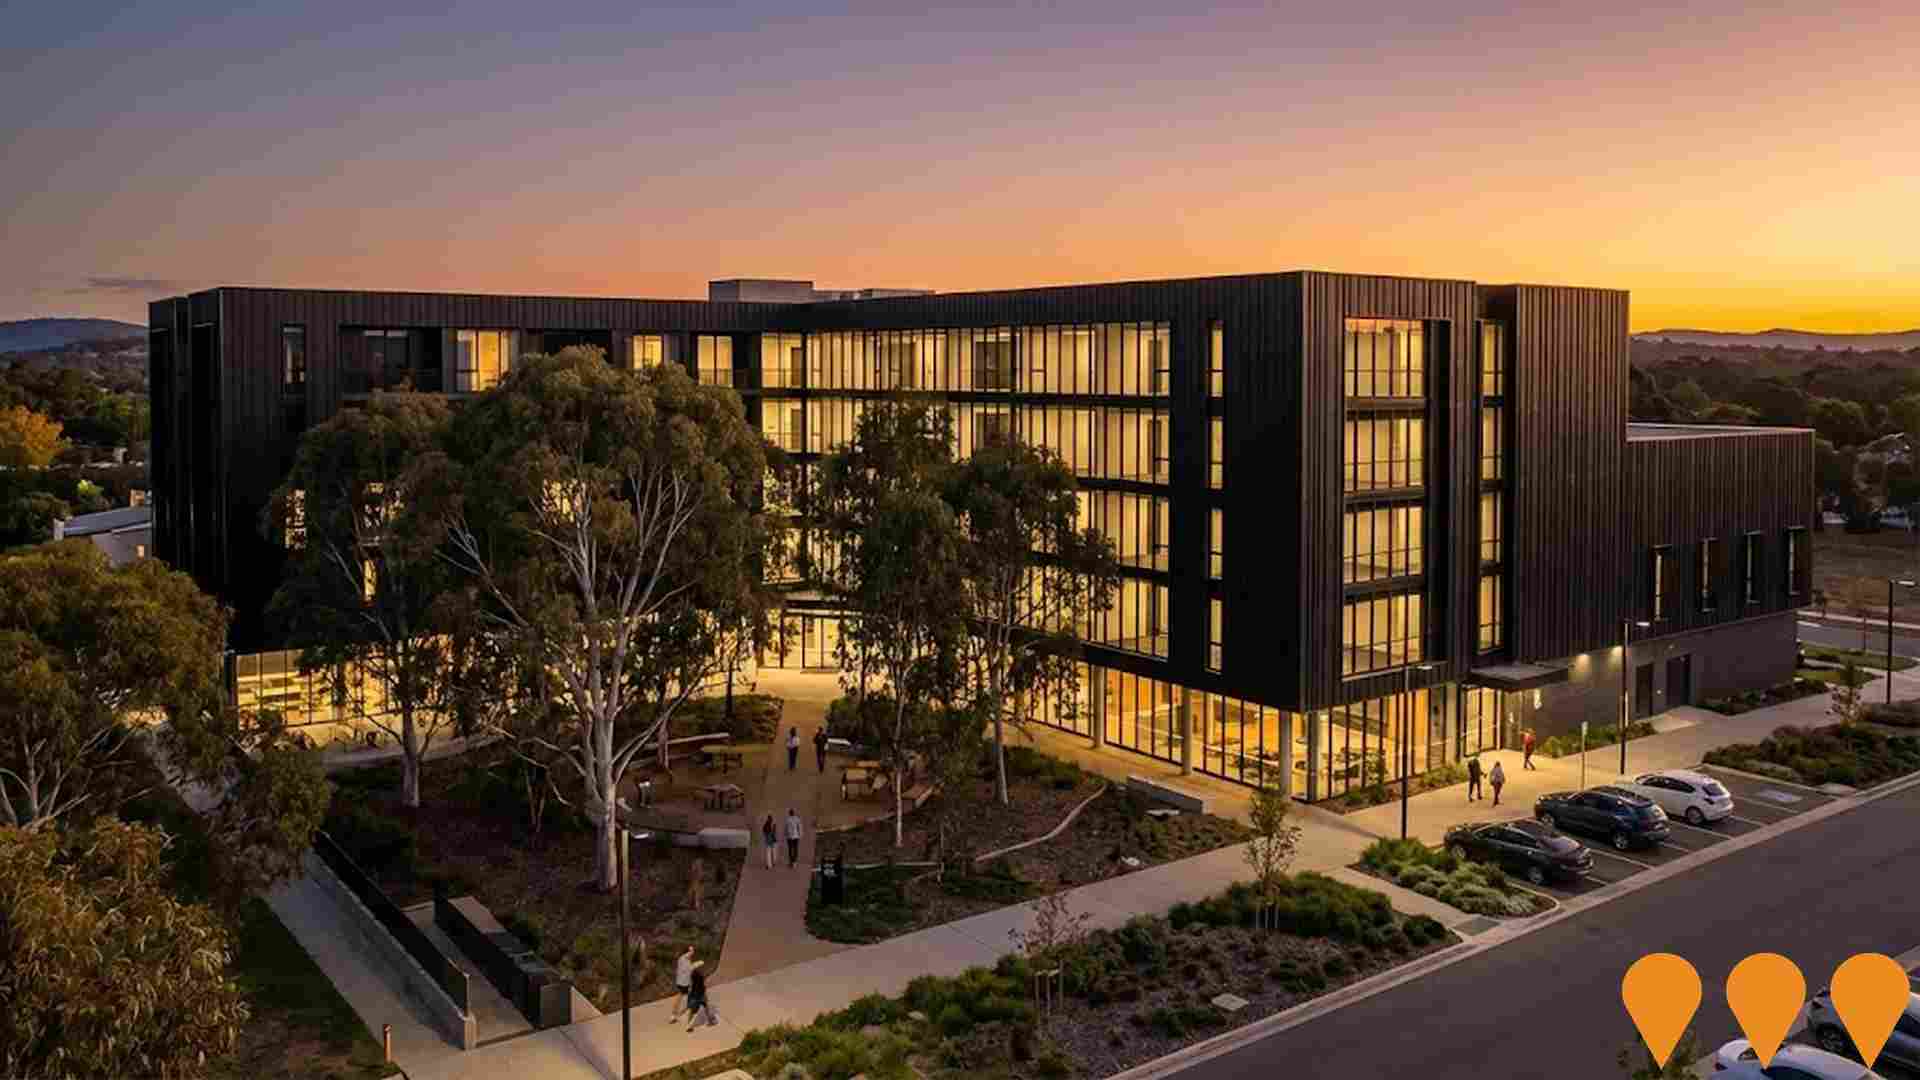
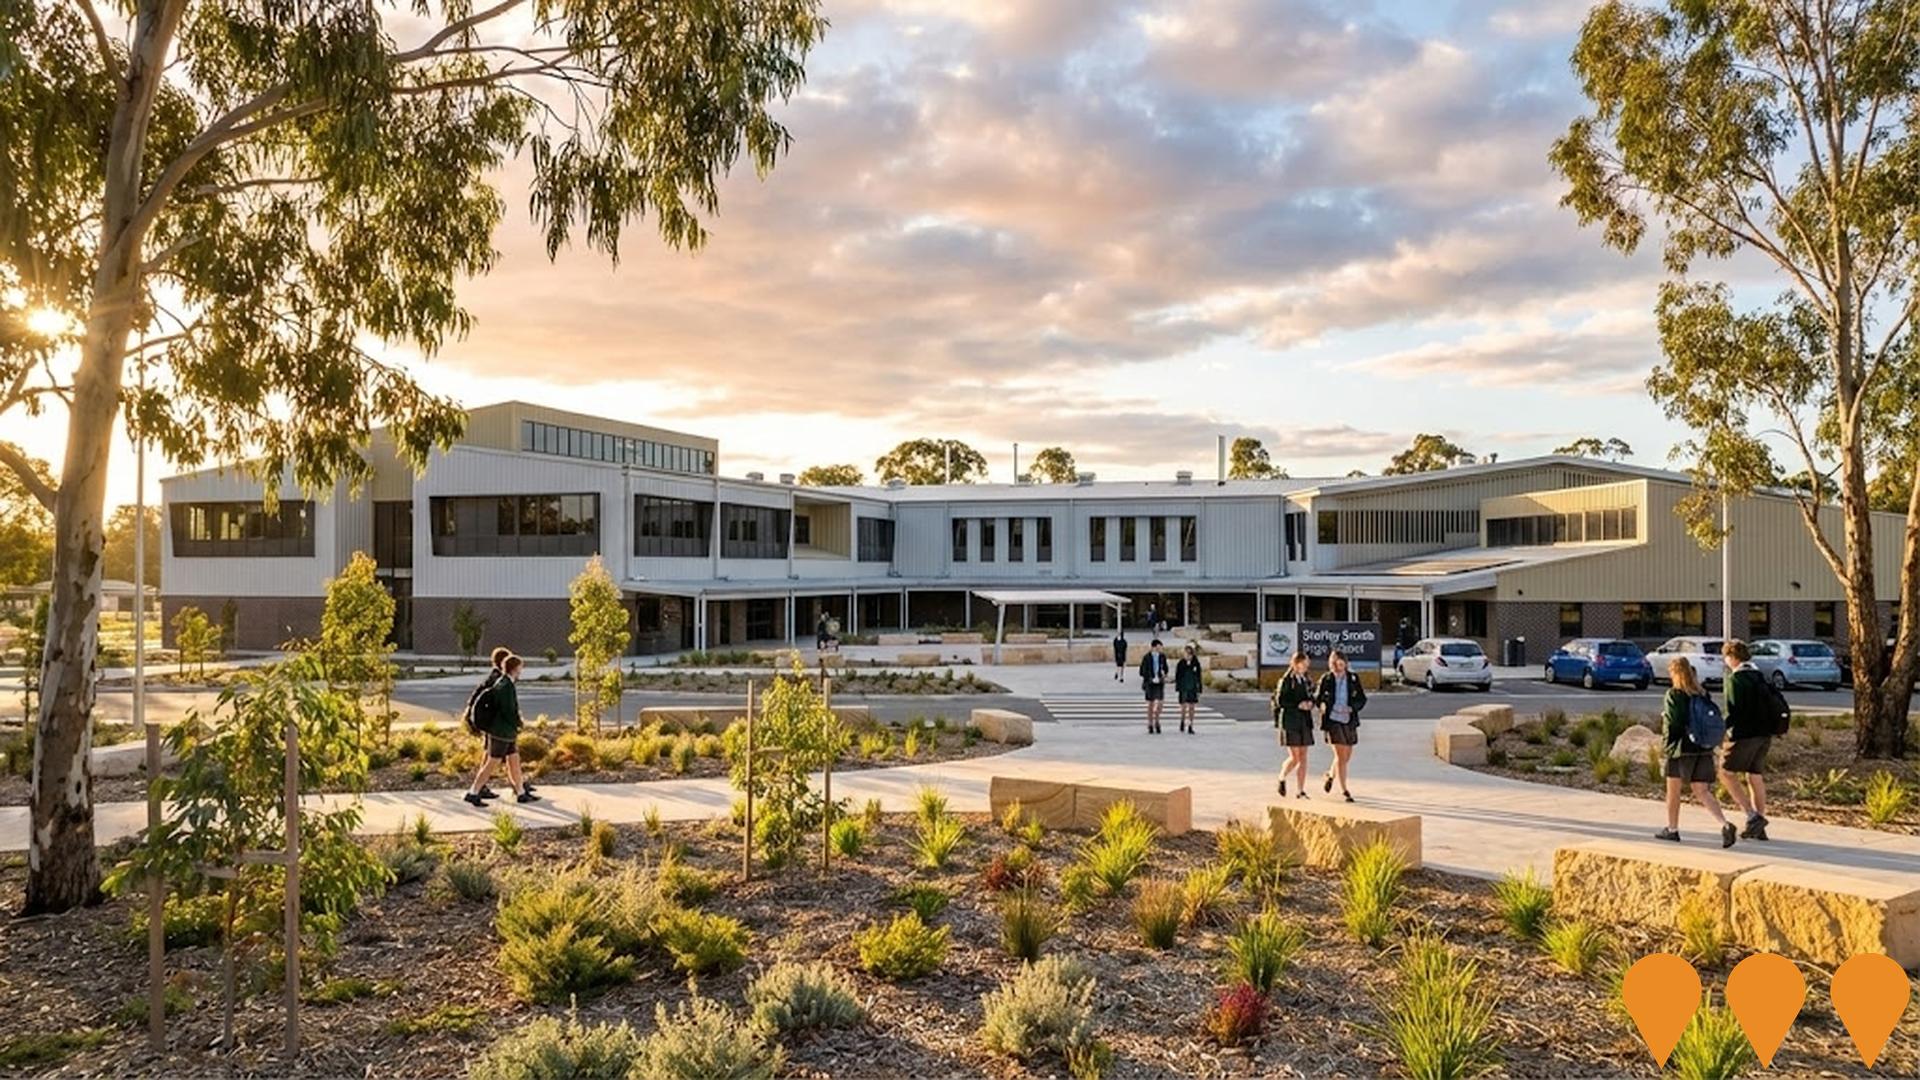
Shirley Smith High School Kenny
$85 million high school for years 7-10 accommodating 800 students. Features multipurpose gymnasium for community use. Opened for 2024 school year as part of expanding education infrastructure in Gungahlin region.
Employment
AreaSearch analysis reveals Crace significantly outperforming the majority of regions assessed nationwide
Crace has an educated workforce with professional services well-represented. The unemployment rate is 2.1%, lower than the Australian Capital Territory's (ACT) 3.6%.
Employment stability has been maintained over the past year. As of September 2025, 2,848 residents are employed, with an unemployment rate of 1.4% below the ACT's rate. Workforce participation is high at 77.2%, compared to the ACT's 69.6%.
Leading employment industries include public administration & safety, professional & technical services, and health care & social assistance. Health care & social assistance employs 10.1% of residents, slightly lower than the regional average of 11.7%. Employment opportunities locally may be limited due to the predominantly residential nature of Crace. Between September 2024 and September 2025, employment levels increased by 0.4%, labour force grew by 1.0%, causing unemployment to rise by 0.6 percentage points. In comparison, the ACT recorded employment growth of 1.4% and a decrease in unemployment by 0.2 percentage points. As of 25-November-25, ACT employment grew by 1.19% year-on-year, with an unemployment rate of 4.5%, compared to the national rate of 4.3%. National employment forecasts from May-25 project a growth of 6.6% over five years and 13.7% over ten years. Applying these projections to Crace's employment mix suggests local employment should increase by approximately 6.5% over five years and 13.2% over ten years, assuming constant population projections for illustrative purposes.
Frequently Asked Questions - Employment
Income
The economic profile demonstrates exceptional strength, placing the area among the top 10% nationally based on comprehensive AreaSearch income analysis
The median income of taxpayers in Crace SA2 was $75,729 in financial year 2022. The average income stood at $86,587 during the same period. In comparison, the Australian Capital Territory's median and average incomes were $68,678 and $83,634 respectively. By September 2025, estimates suggest that Crace SA2's median income would be approximately $86,028 and the average income around $98,363, factoring in a 13.6% growth since financial year 2022. According to the 2021 Census, incomes in Crace rank highly nationally, between the 95th and 96th percentiles for households, families, and individuals. The income bracket of $1,500 - $2,999 captures 32.0% of the community (1,525 individuals), aligning with broader regional trends where 34.3% fall into this category. Notably, 46.8% earn above $3,000 weekly, indicating prosperity that stimulates local economic activity. High housing costs consume 15.8% of income, yet strong earnings place disposable income at the 94th percentile nationally. The area's SEIFA income ranking places it in the 10th decile.
Frequently Asked Questions - Income
Housing
Crace displays a diverse mix of dwelling types, with a higher proportion of rental properties than the broader region
The latest Census data shows that in Crace, 69.6% of dwellings were houses, with the remaining 30.4% being semi-detached homes, apartments, and other types. In comparison, across the Australian Capital Territory (ACT), 66.3% of dwellings were houses. Home ownership in Crace was at 13.9%, with mortgaged dwellings making up 50.7% and rented ones 35.5%. The median monthly mortgage repayment in Crace was $2,400, higher than the ACT average of $2,123. The median weekly rent in Crace was recorded at $460, slightly above the ACT figure of $462. Nationally, Crace's median monthly mortgage repayments were significantly higher than the Australian average of $1,863, and rents were substantially above the national figure of $375.
Frequently Asked Questions - Housing
Household Composition
Crace features high concentrations of family households, with a lower-than-average median household size
Family households constitute 77.3% of all households, including 44.8% couples with children, 24.8% couples without children, and 6.9% single parent families. Non-family households comprise the remaining 22.7%, with lone person households at 19.1% and group households making up 3.3%. The median household size is 2.8 people, which is smaller than the Australian Capital Territory average of 2.9.
Frequently Asked Questions - Households
Local Schools & Education
Crace shows strong educational performance, ranking in the upper quartile nationally when assessed across multiple qualification and achievement indicators
Educational attainment in Crace is notably high, with 52.9% of residents aged 15+ holding university qualifications, compared to the national average of 30.4% and the SA3 area average of 46.3%. Bachelor degrees are the most common at 28.3%, followed by postgraduate qualifications at 20.1% and graduate diplomas at 4.5%. Vocational pathways account for 23.9% of qualifications among those aged 15+, with advanced diplomas at 11.2% and certificates at 12.7%. Educational participation is also high, with 34.0% of residents currently enrolled in formal education.
This includes 11.9% in primary education, 7.4% in tertiary education, and 6.2% pursuing secondary education.
Frequently Asked Questions - Education
Schools Detail
Nearby Services & Amenities
Transport
Transport servicing is moderate compared to other areas nationally based on assessment of service frequency, route connectivity and accessibility
Transport analysis indicates 11 active public transit stops operating within Crace. These stops serve a mix of bus routes, with two individual routes in total providing 526 weekly passenger trips. Transport accessibility is rated as good, with residents located an average of 204 meters from the nearest stop.
Service frequency averages 75 trips per day across all routes, equating to approximately 47 weekly trips per individual stop.
Frequently Asked Questions - Transport
Transport Stops Detail
Health
Crace's residents boast exceedingly positive health performance metrics with both young and old age cohorts seeing low prevalence of common health conditions
Health outcomes data shows excellent results across Crace, with both younger and older age groups experiencing low prevalence of common health conditions. The rate of private health cover is notably high at approximately 63% of the total population (3018 people), compared to 58.6% in the Australian Capital Territory and a national average of 55.3%. The most prevalent medical conditions are asthma and mental health issues, affecting 7.5 and 5.7% of residents respectively, while 78.3% report being completely free from medical ailments, compared to 76.4% in the Australian Capital Territory.
Crace has a higher proportion of seniors aged 65 and over at 10.1% (482 people), compared to 8.3% in the Australian Capital Territory. Health outcomes among seniors are above average but require more attention than those seen in the broader population.
Frequently Asked Questions - Health
Cultural Diversity
Crace is among the most culturally diverse areas in the country based on AreaSearch assessment of a range of language and cultural background related metrics
Crace has a high level of cultural diversity, with 37.7% of its population born overseas and 39.9% speaking a language other than English at home. Christianity is the predominant religion in Crace, accounting for 39.1% of its population. Hinduism is notably overrepresented in Crace compared to the Australian Capital Territory, comprising 9.1% versus 9.5%.
The top three ancestry groups in Crace are Australian (19.6%), English (18.2%), and Other (15.4%). There are also significant differences in the representation of certain ethnic groups: Croatian is overrepresented at 1.5% compared to the regional average of 1.3%, Indian is overrepresented at 7.1% versus 6.4%, and Serbian is overrepresented at 0.7% versus 0.4%.
Frequently Asked Questions - Diversity
Age
Crace hosts a young demographic, positioning it in the bottom quartile nationwide
Crace has a median age of 35, matching the Australian Capital Territory figure but slightly below Australia's 38 years. Compared to the Australian Capital Territory, Crace has a higher percentage of residents aged 35-44 (20.9%) but fewer residents aged 55-64 (6.1%). This 35-44 concentration is notably higher than the national figure of 14.2%. Between the 2021 Census and the present, Crace's residents have aged by an average of 1.1 years, with the median age rising from 34 to 35. Specifically, the 15-24 age group has increased from 9.4% to 11.8%, while the 45-54 cohort has risen from 11.5% to 13.7%. Conversely, the 25-34 cohort has decreased from 18.0% to 15.0%, and the 0-4 age group has dropped from 9.1% to 7.7%. By 2041, Crace's age profile is projected to change significantly. The 45-54 age cohort is expected to grow by 147 people (23%), increasing from 653 to 801. However, population declines are projected for the 0-4 and 35-44 cohorts.

