Chart Color Schemes
This analysis uses ABS Statistical Areas Level 2 (SA2) boundaries, which can materially differ from Suburbs and Localities (SAL) even when sharing similar names.
SA2 boundaries are defined by the Australian Bureau of Statistics and are designed to represent communities for statistical reporting (e.g., census and ERP).
Suburbs and Localities (SAL) represent commonly-used suburb/locality names (postal-style areas) and may use different geographic boundaries. For comprehensive analysis, consider reviewing both boundary types if available.
est. as @ -- *
ABS ERP | -- people | --
2021 Census | -- people
Sales Activity
Curious about local property values? Filter the chart to assess the volume and appreciation (including resales) trends and regional comparisons, or scroll to the map below view this information at an individual property level.
Find a Recent Sale
Sales Detail
Population
Civic lies within the top 10% of areas nationally in terms of population growth performance according to AreaSearch analysis of short and medium-term trends
Civic's population, as of November 2025, stands at approximately 5,282 people. This figure reflects an increase of 447 individuals since the 2021 Census, which reported a population of 4,835 people. The change is inferred from the estimated resident population of 5,271 as of June 2024 and an additional 299 validated new addresses since the Census date. This results in a population density ratio of 3,693 persons per square kilometer, placing Civic in the upper quartile relative to national locations assessed by AreaSearch. Civic's growth of 9.2% since the 2021 census exceeded the state average (5.9%), positioning it as a growth leader in the region. Overseas migration contributed approximately 94.0% of overall population gains during recent periods, driving primary population growth for the area.
AreaSearch adopts ABS/Geoscience Australia projections for each SA2 area, released in 2024 with 2022 as the base year. For areas not covered by this data and years post-2032, age group growth rates from the ACT Government's SA2 area projections are adopted, also based on 2022. Future population dynamics predict exceptional growth for Civic, placing it in the top 10 percent of statistical areas across the nation. The area is expected to expand by 8,118 persons to 2041 based on the latest annual ERP population numbers, reflecting an increase of 153.4% over the 17-year period.
Frequently Asked Questions - Population
Development
AreaSearch assessment of residential development activity positions Civic among the top 25% of areas assessed nationwide
Civic has seen approximately 66 new homes approved annually. Over the past five financial years, from FY21 to FY25, around 332 homes have been approved, with none yet approved in FY26. On average, each new home has brought one new resident per year over these five years, indicating that new supply is meeting or exceeding demand and providing ample buyer choice while also allowing for population growth beyond current forecasts.
The average construction cost value of these new homes is $319,000, which is somewhat higher than regional norms due to quality-focused development. In the current financial year, $411.8 million in commercial approvals have been registered, suggesting strong local business investment. Compared to the Australian Capital Territory, Civic shows comparable construction activity per person, maintaining market equilibrium consistent with surrounding areas. However, there has been a recent intensification of construction activity, which is well above the national average, reflecting strong developer confidence in the area.
All new construction in Civic has been comprised of medium and high-density housing, promoting affordable entry points for downsizers, investors, and first-home buyers. According to the latest AreaSearch quarterly estimate, Civic is projected to add 8,105 residents by 2041. If current development rates continue, housing supply may not keep pace with population growth, potentially increasing competition among buyers and supporting stronger price growth.
Frequently Asked Questions - Development
Infrastructure
Civic has emerging levels of nearby infrastructure activity, ranking in the 27thth percentile nationally
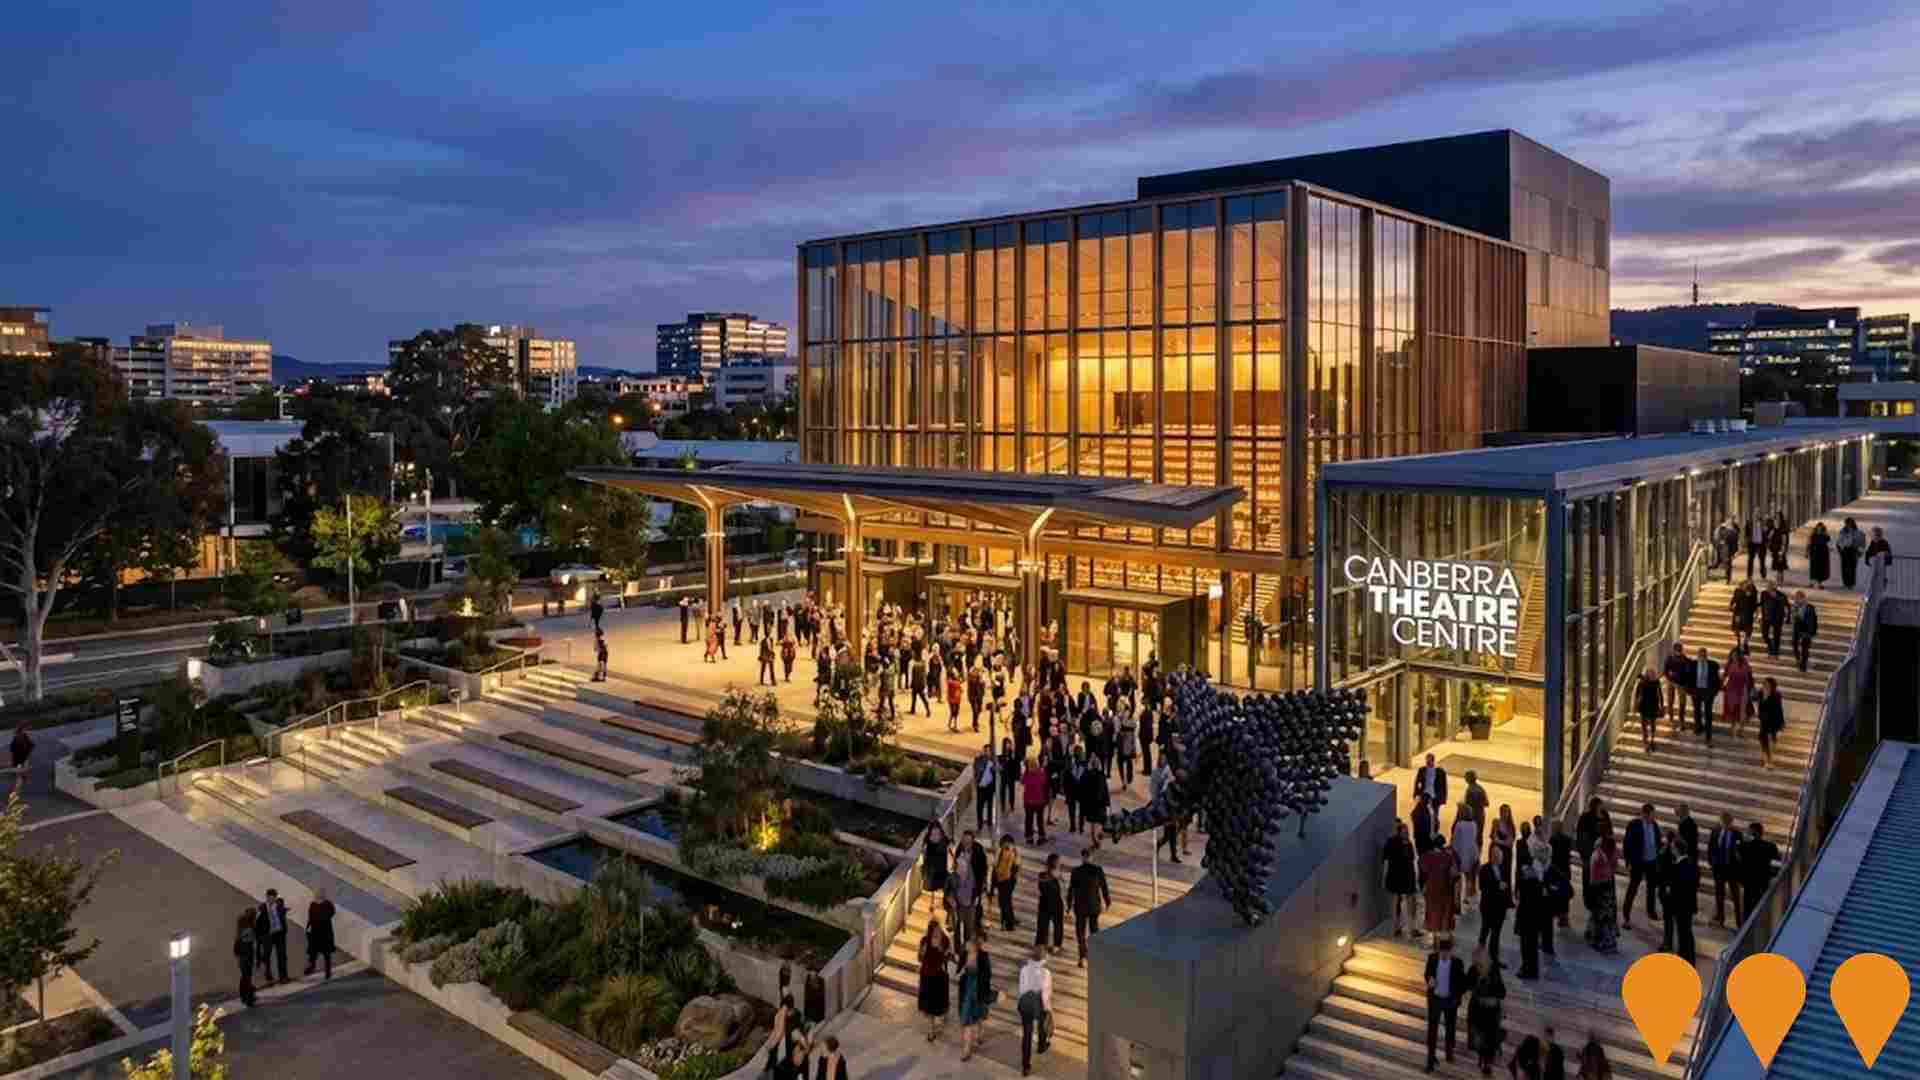
Changes to local infrastructure significantly impact an area's performance. AreaSearch has identified 28 projects likely to affect the area. Notable projects include ACT Light Rail Stage 2A (City to Commonwealth Park), Lonsdale & Girrahween - Braddon (Section 34), The Grande, and City Hill Mixed-Use Precinct. Relevant projects are detailed below.
Professional plan users can use the search below to filter and access additional projects.
INFRASTRUCTURE SEARCH
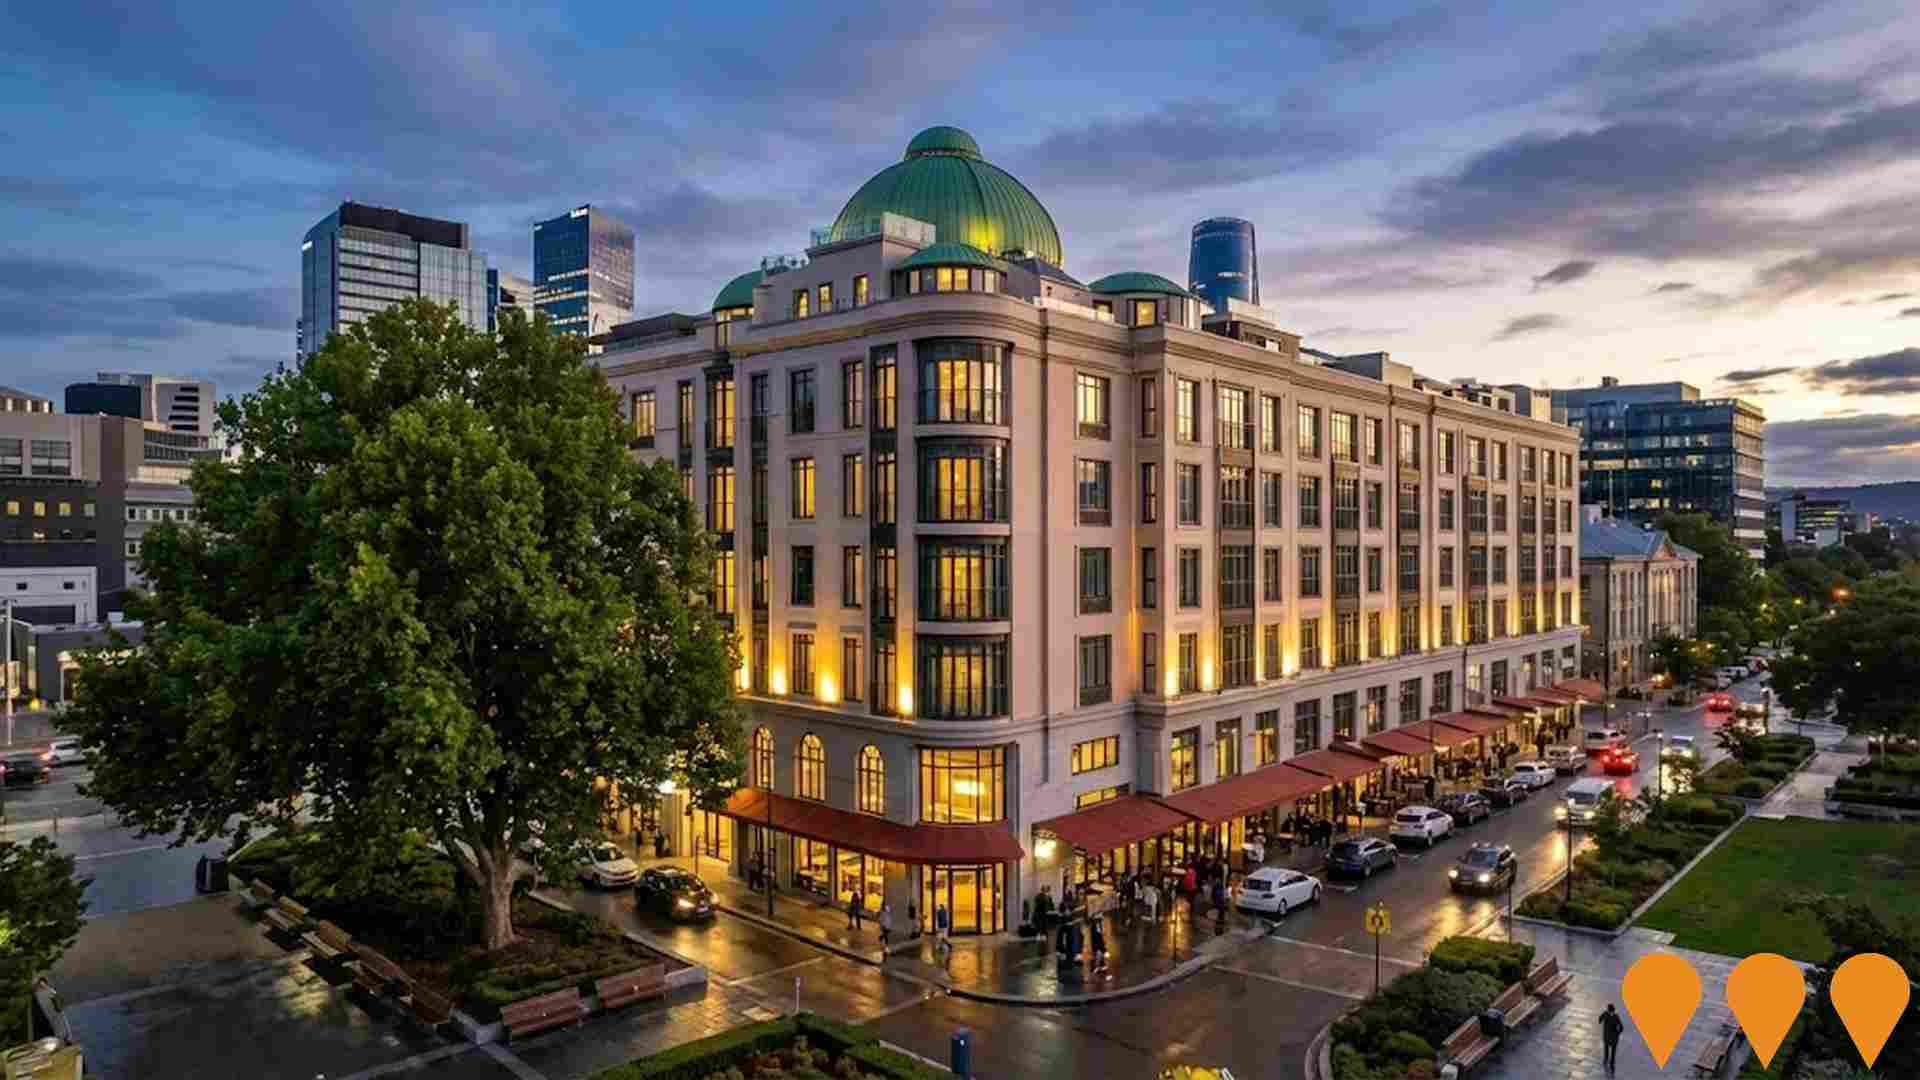
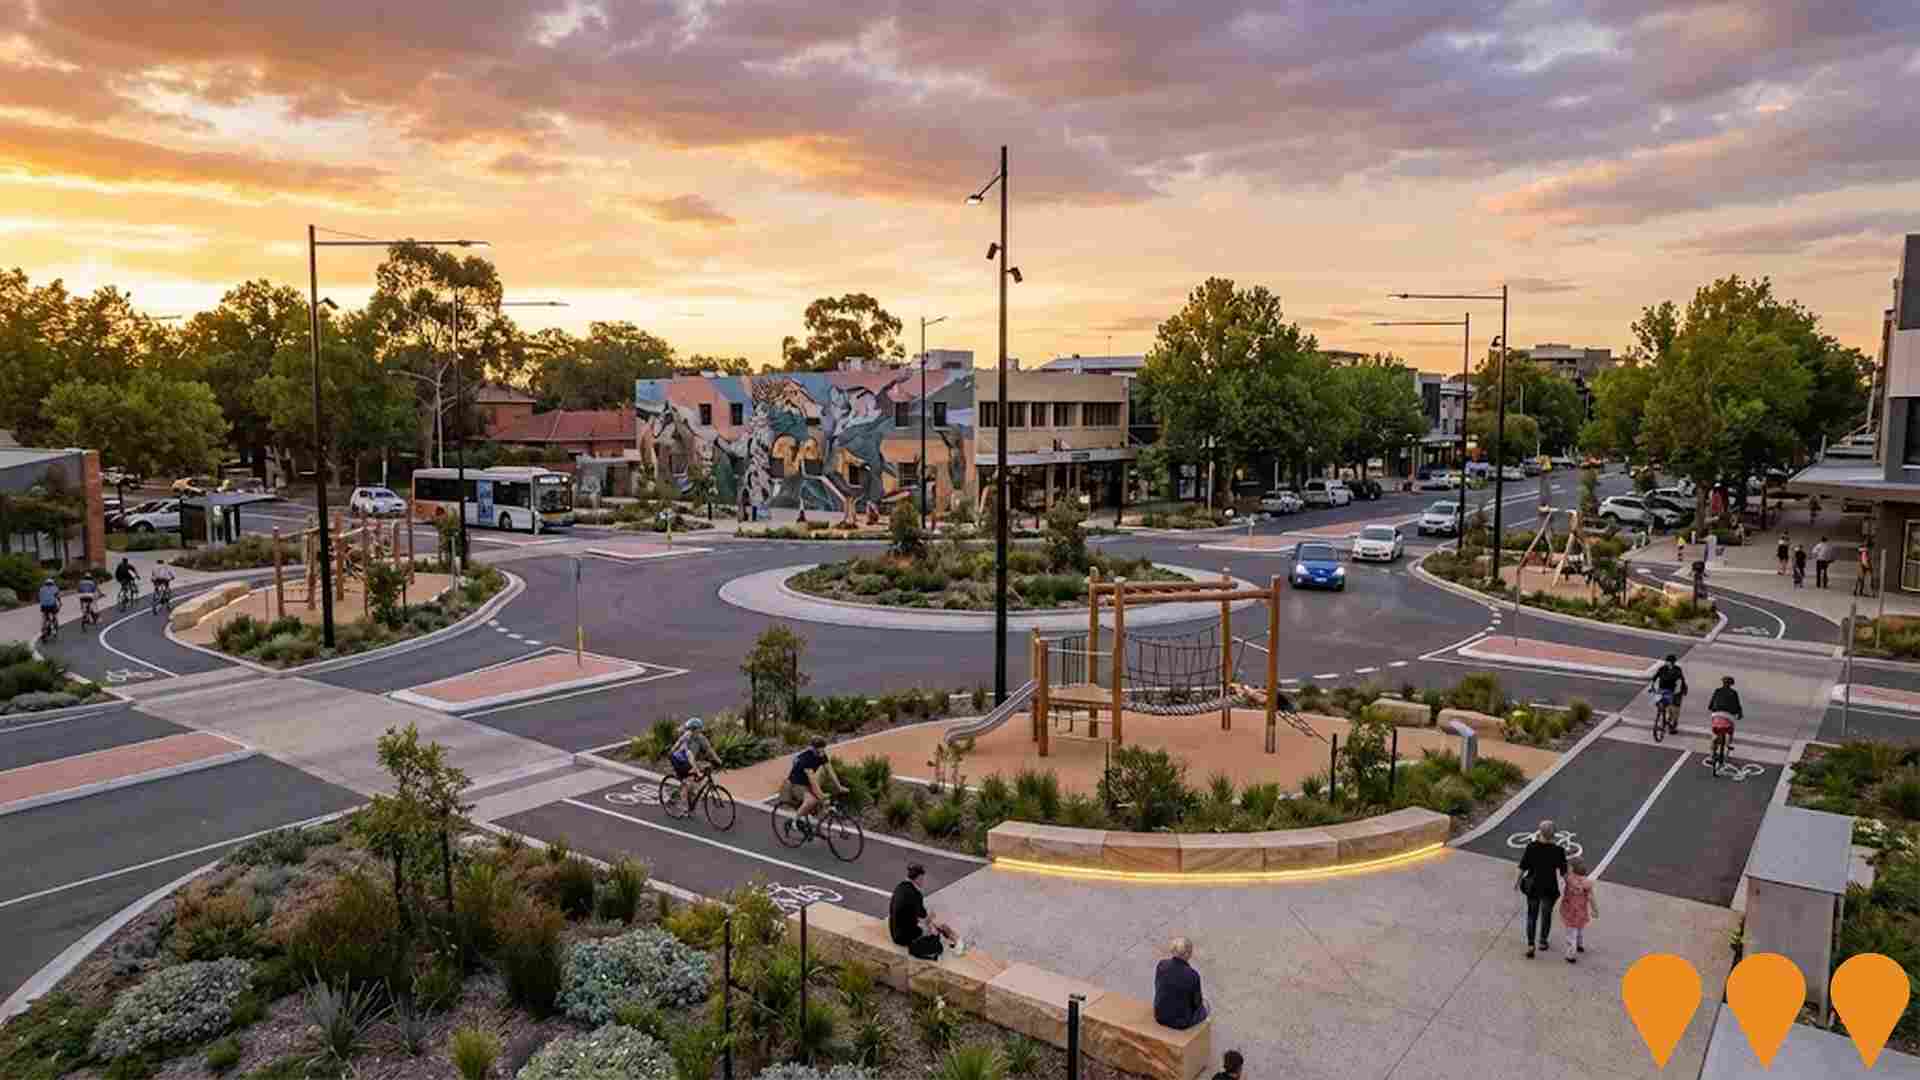
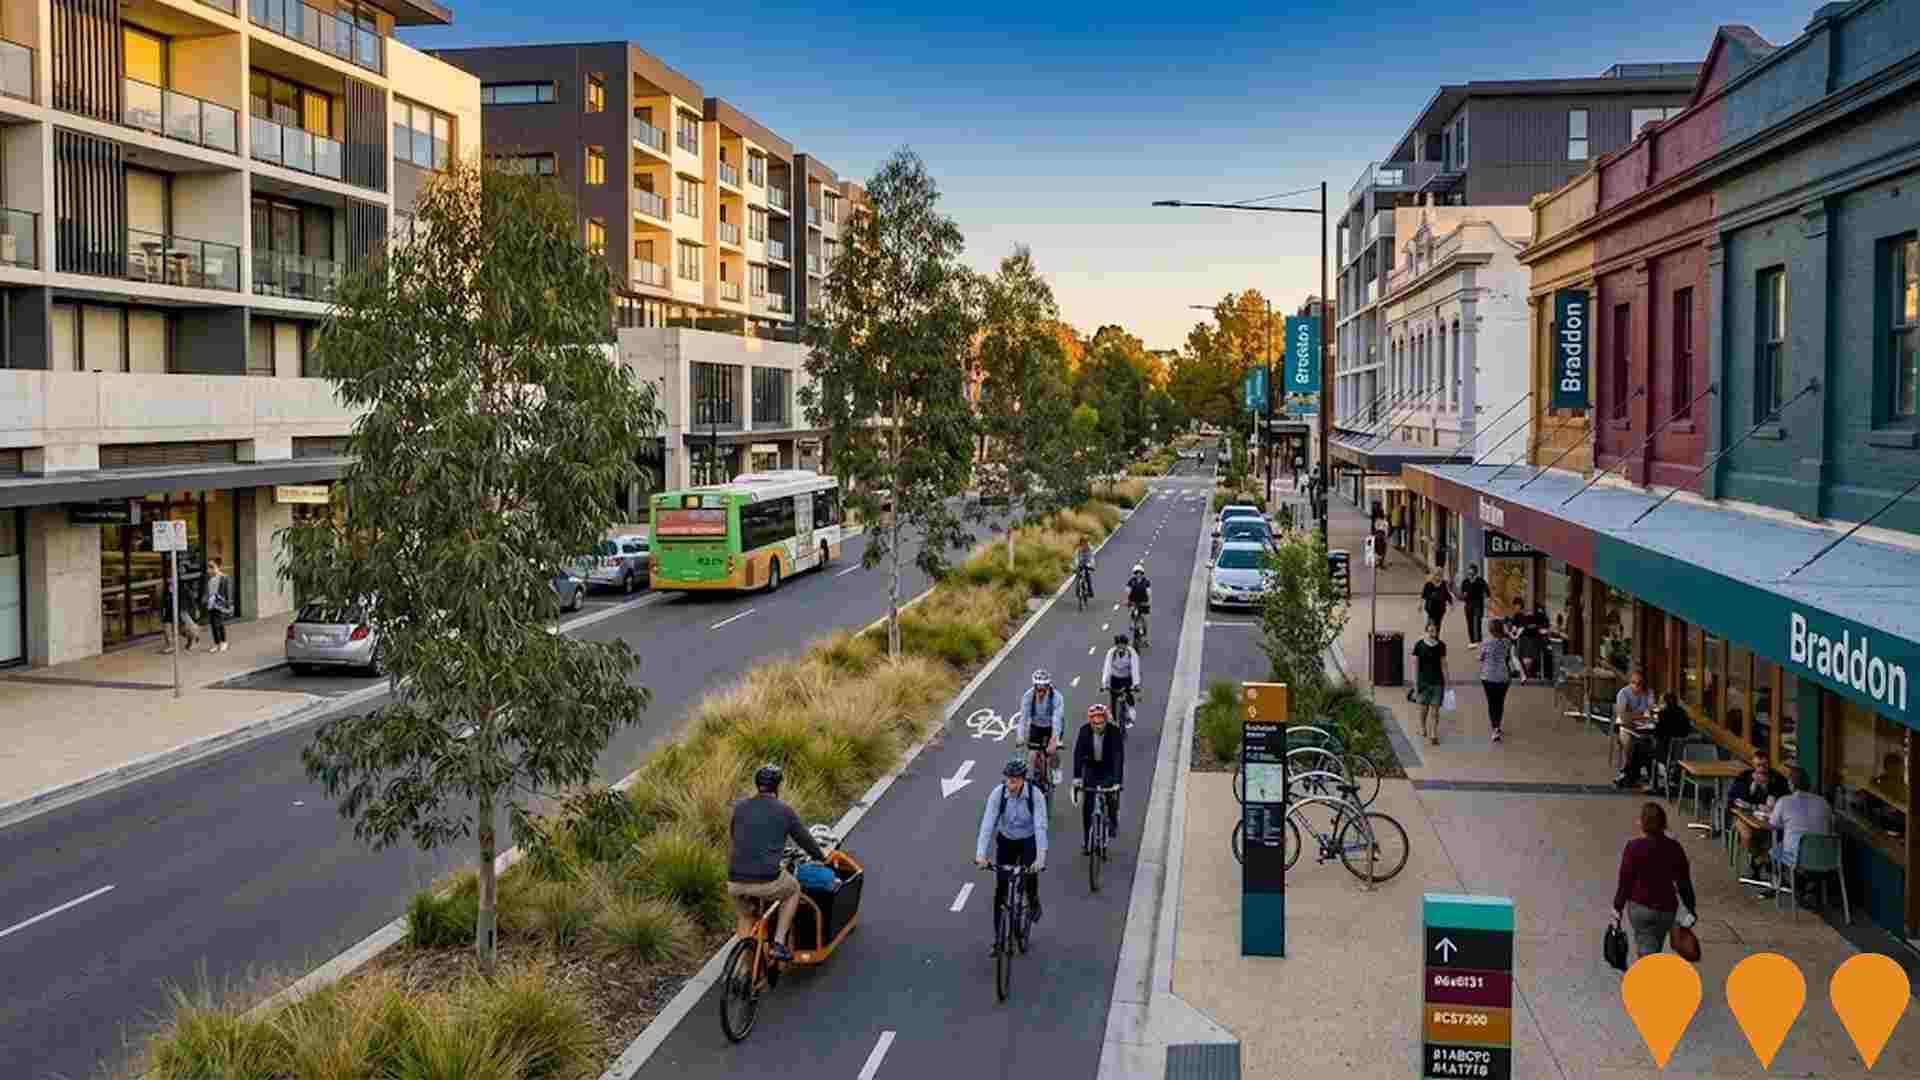
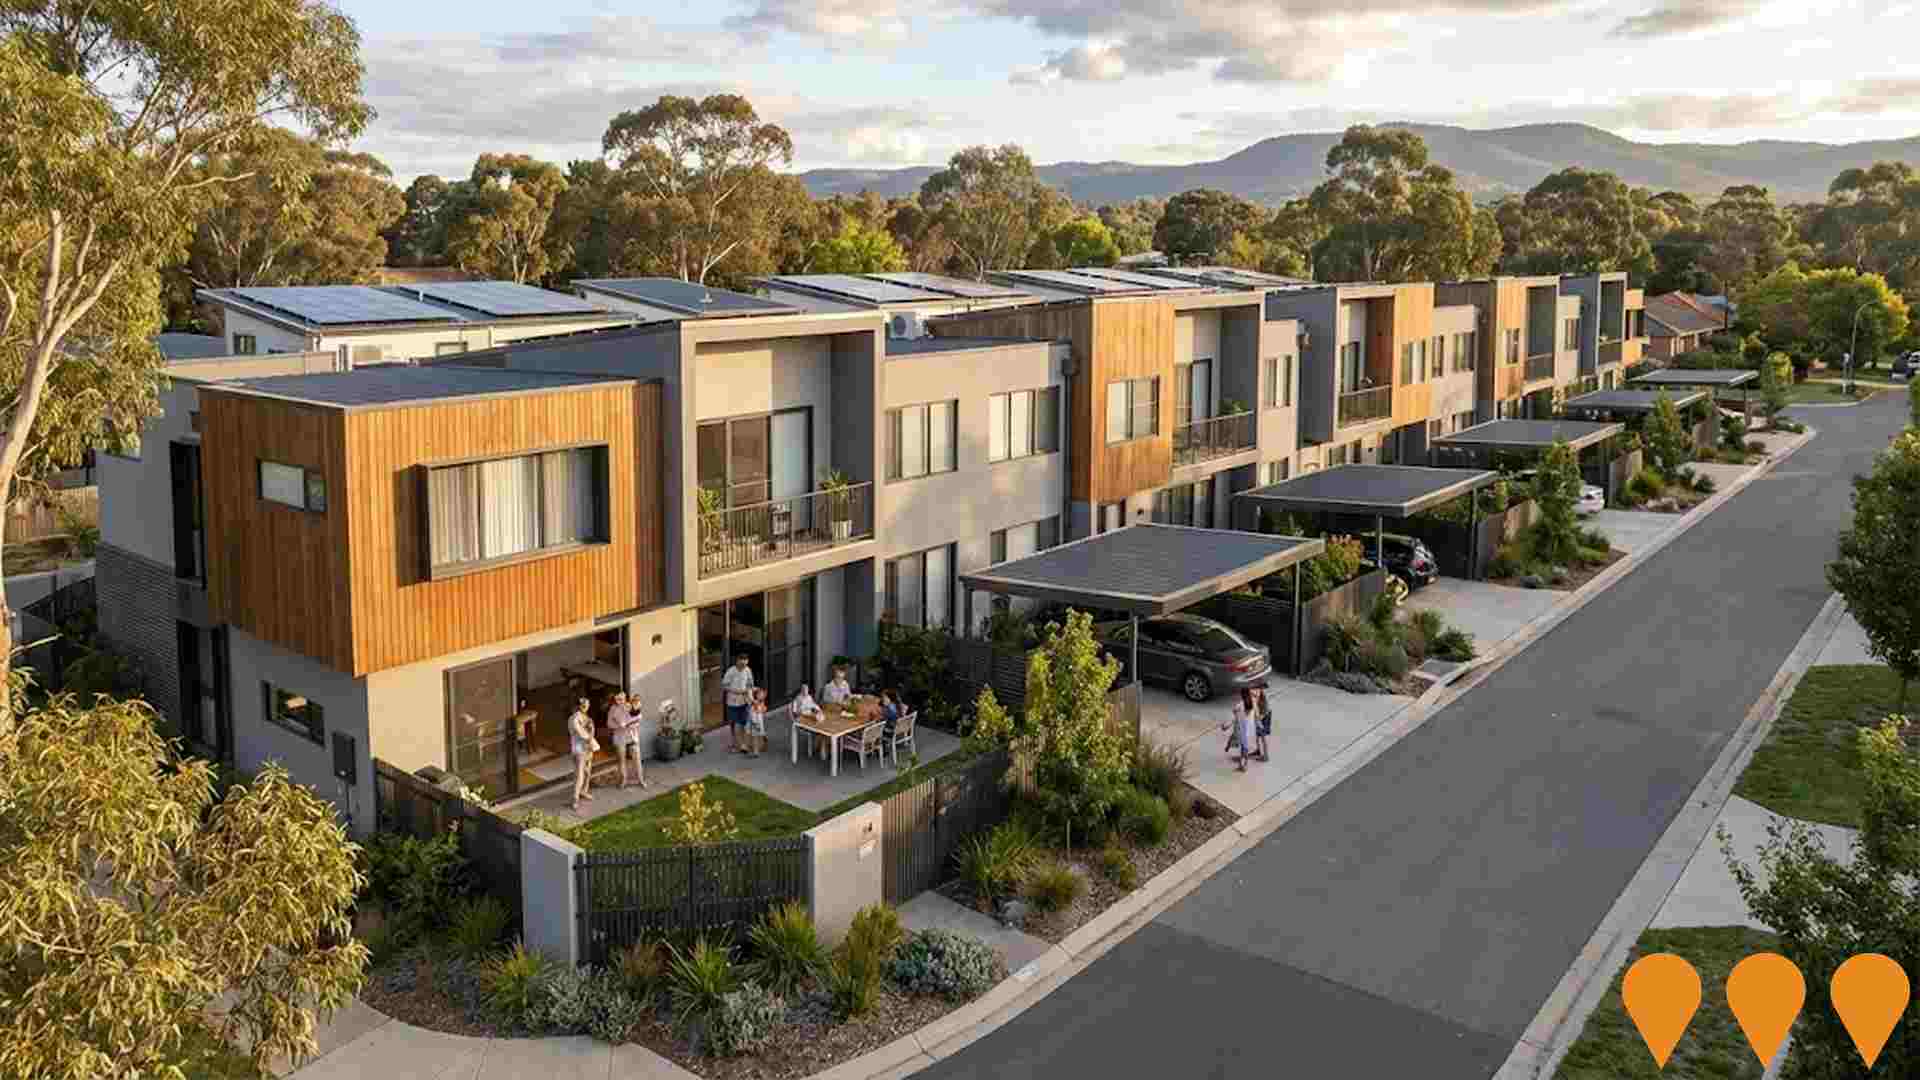
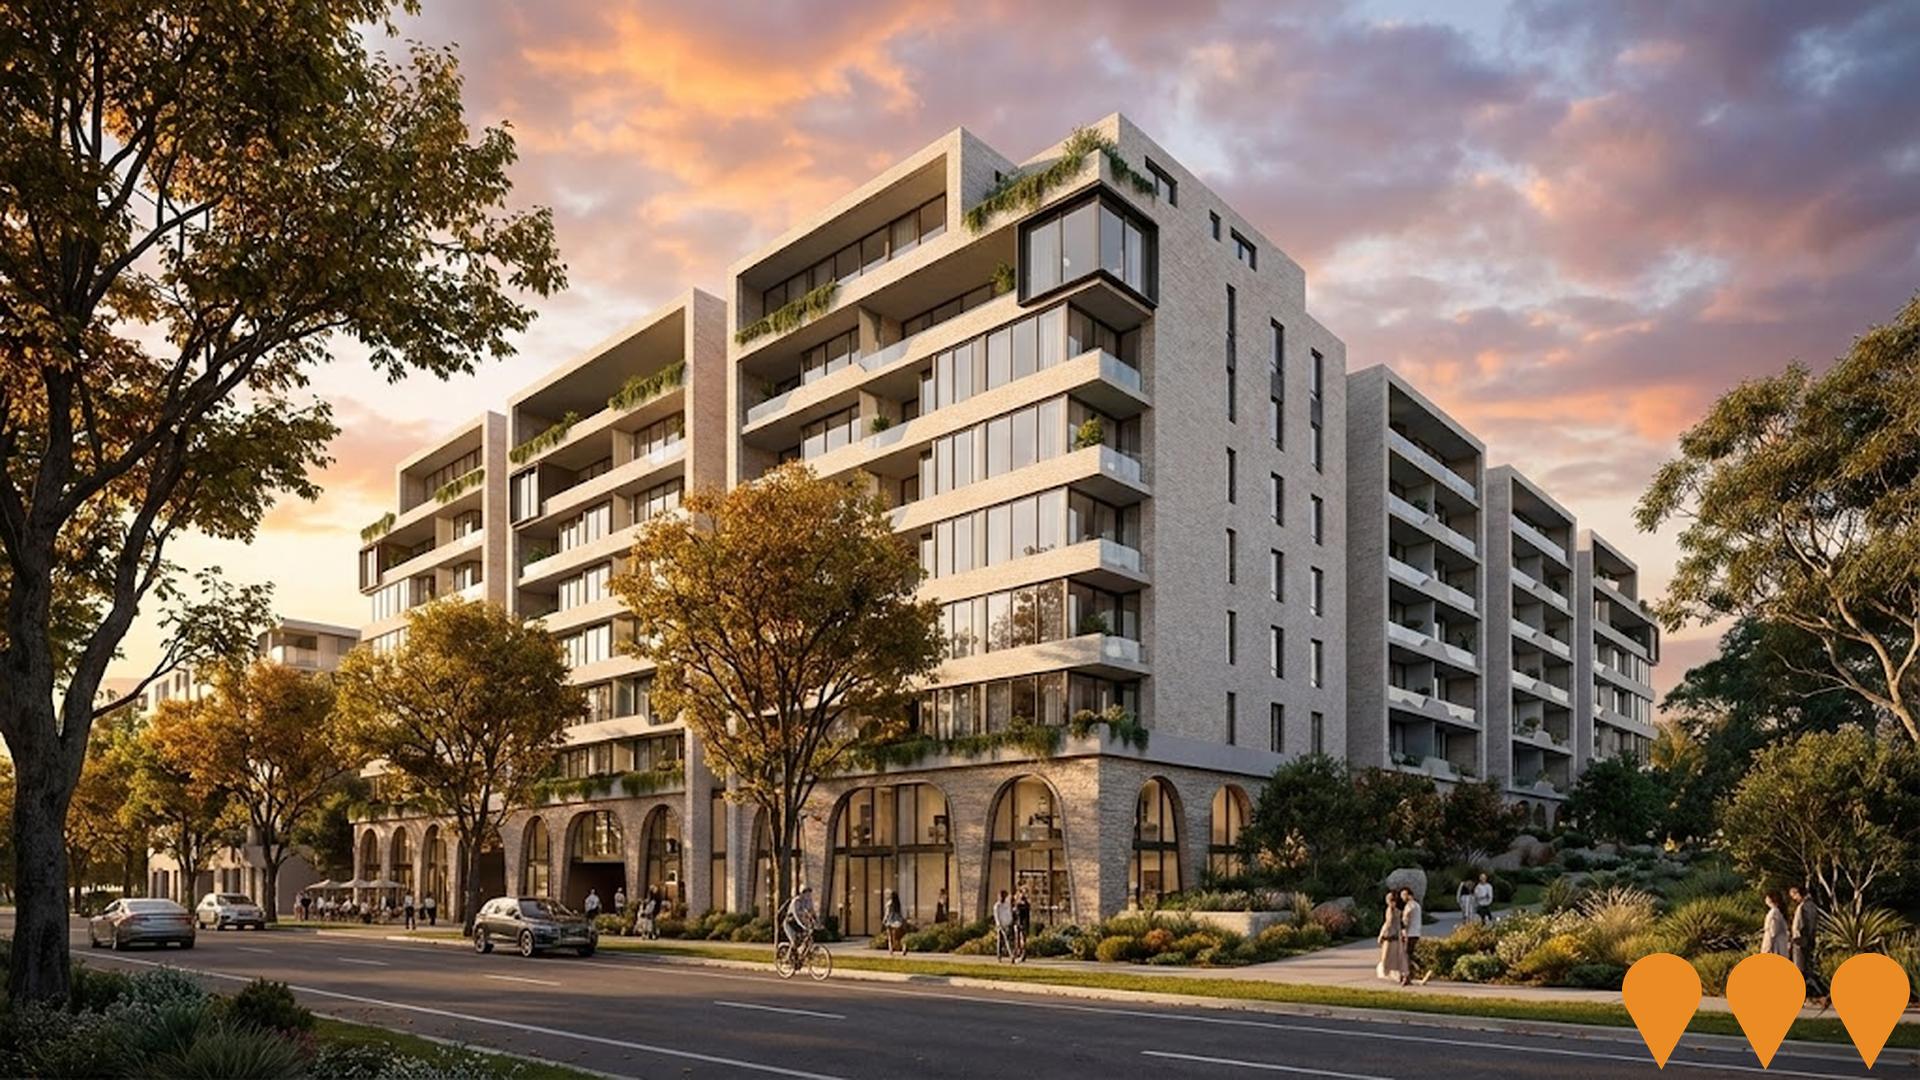
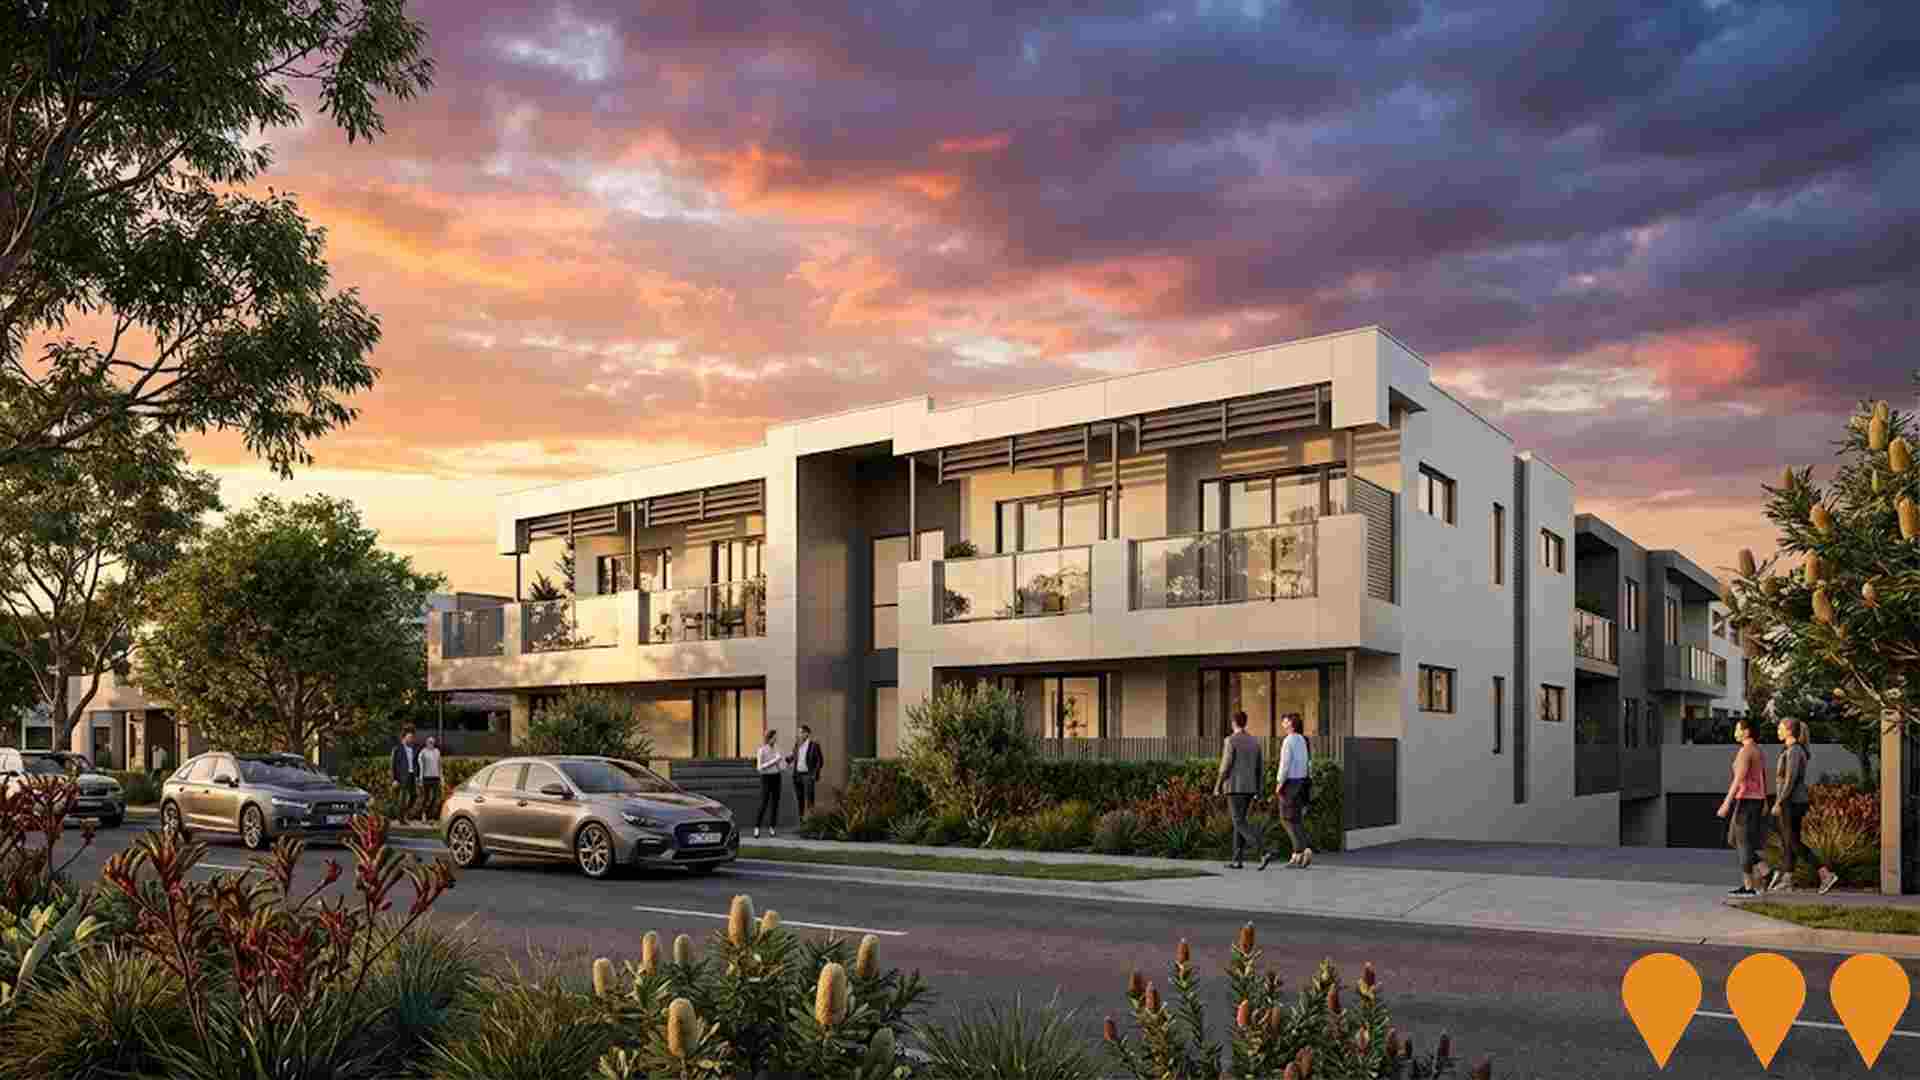
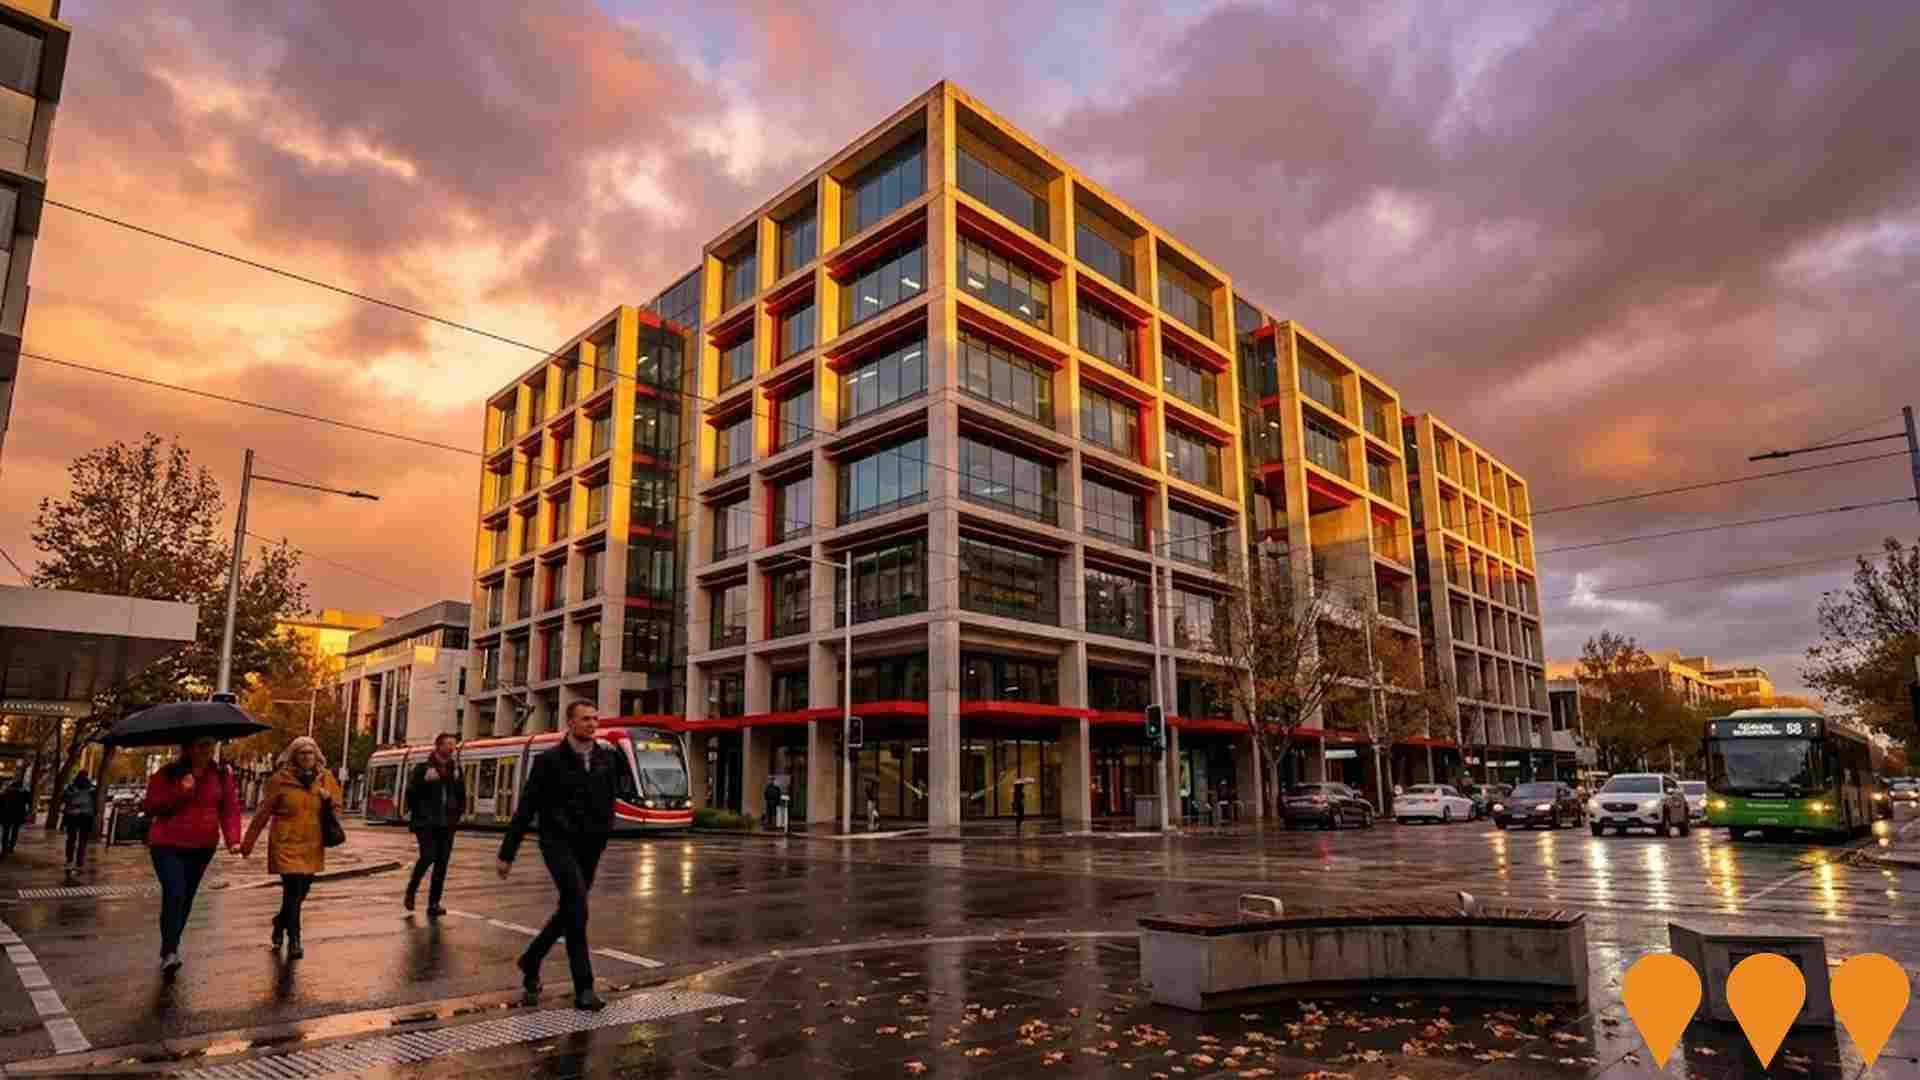
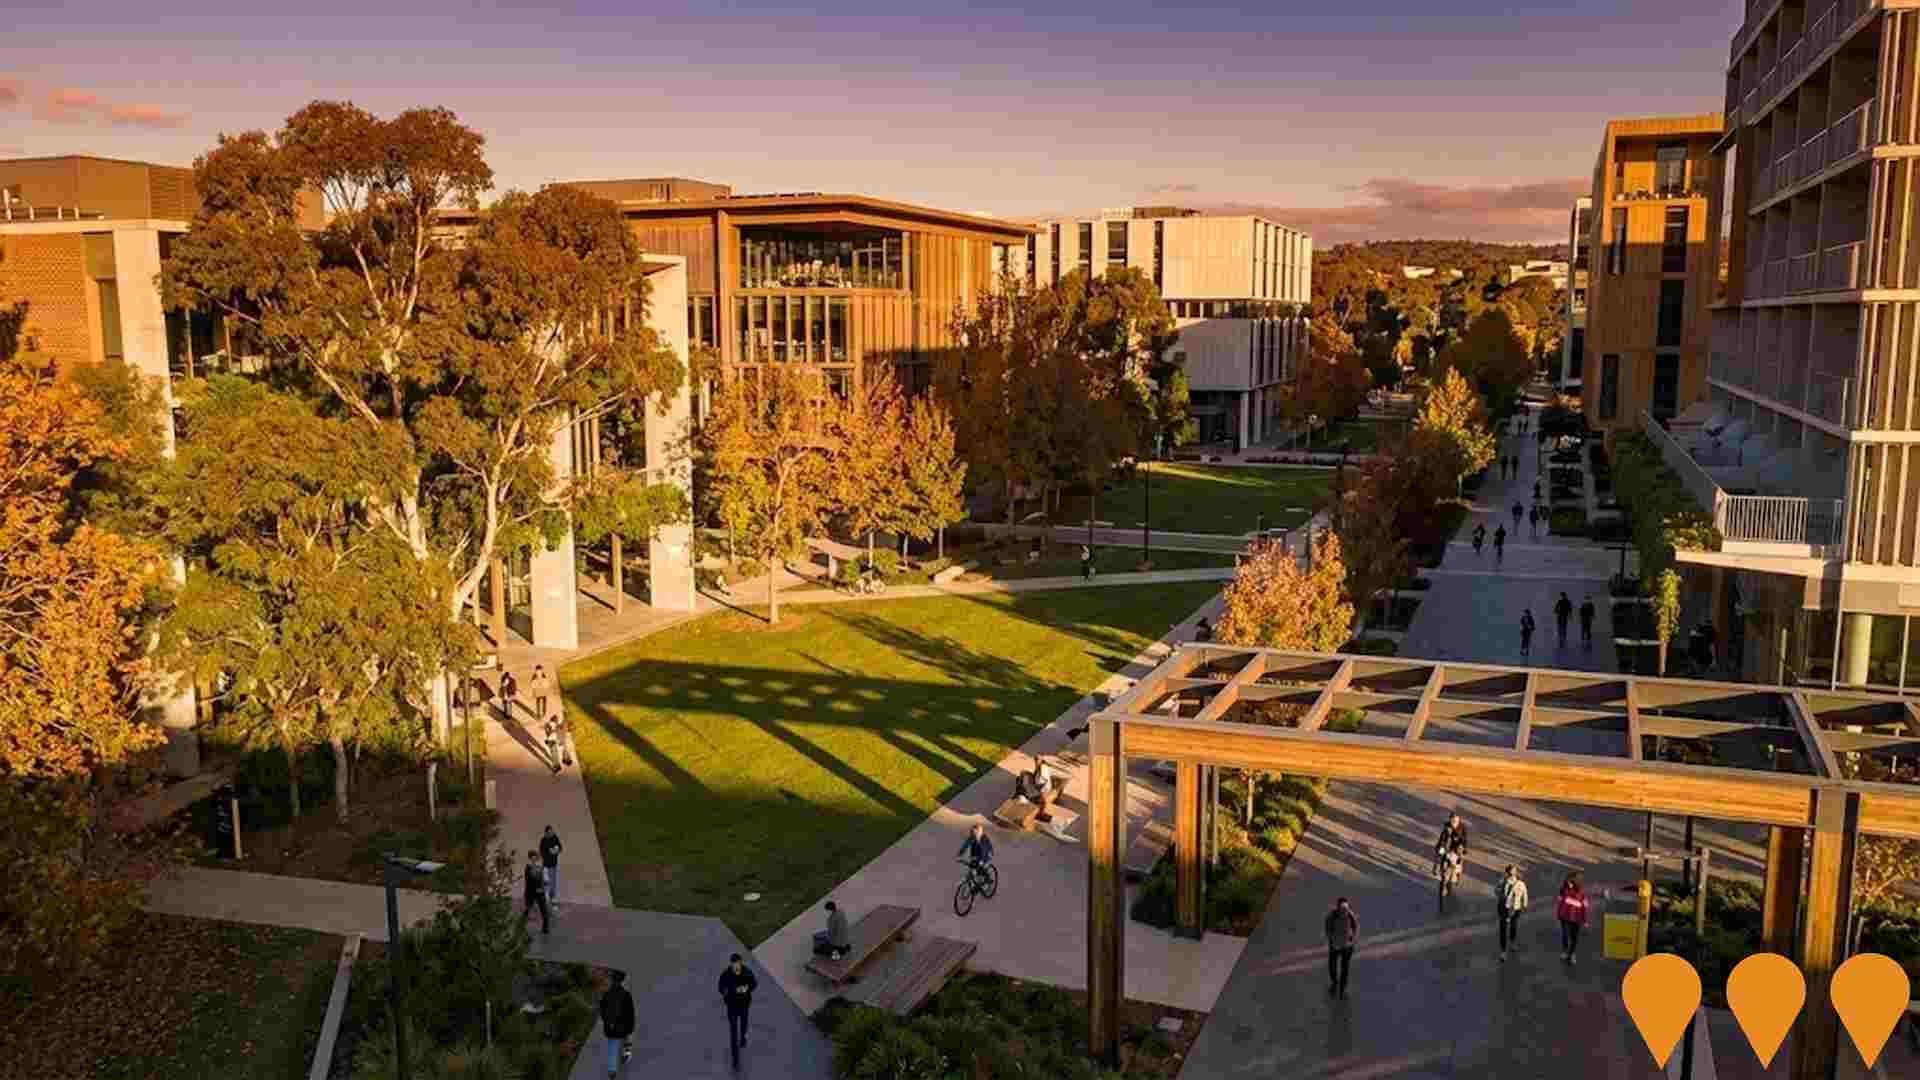
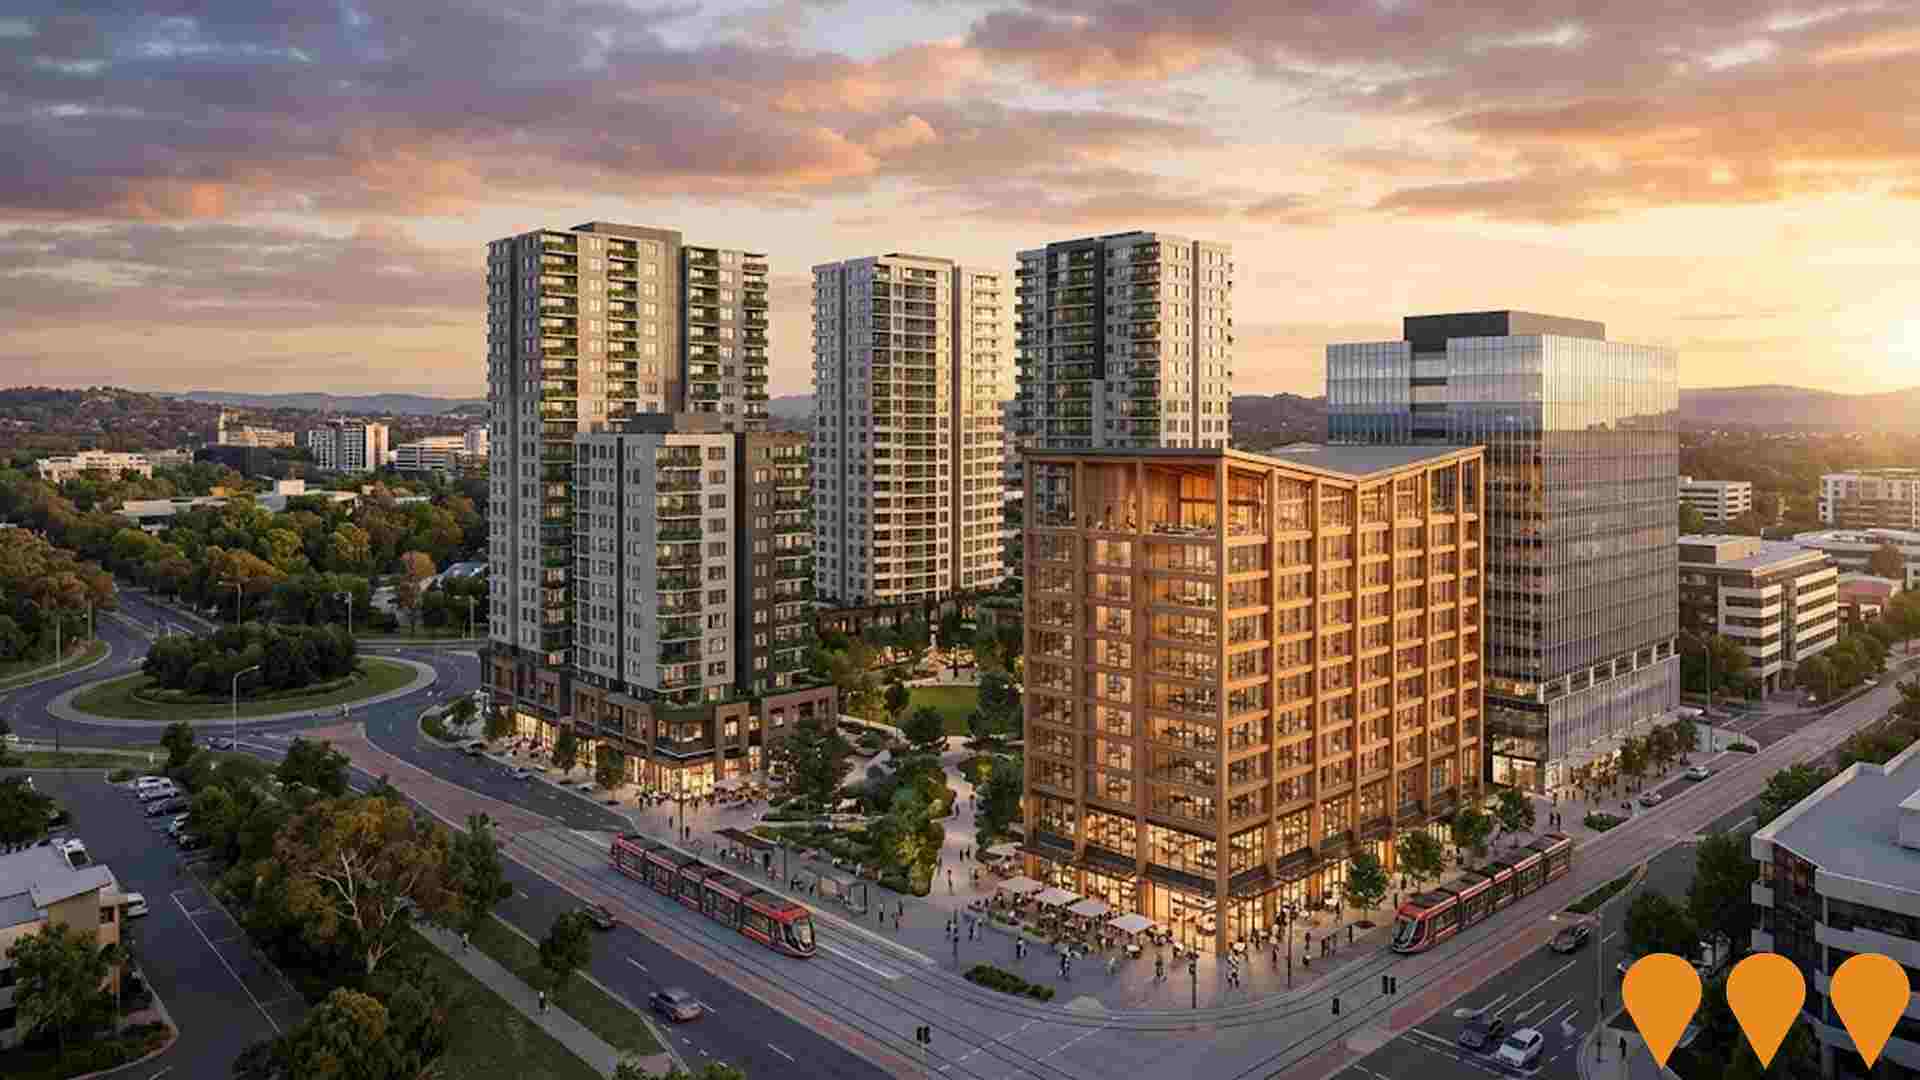
 Denotes AI-based impression for illustrative purposes only, not to be taken as definitive under any circumstances. Please follow links and conduct other investigations from the project's source for actual imagery. Developers and project owners wishing us to use original imagery please Contact Us and we will do so.
Frequently Asked Questions - Infrastructure
ACT Light Rail Stage 2A (City to Commonwealth Park)
The 1.7km extension of Canberra's light rail from Alinga Street to Commonwealth Park is **under construction** and expected to be operational in **early 2028**. It will feature **three new stops** at Edinburgh Avenue, City South, and Commonwealth Park. The project includes wire-free operation with on-board energy storage systems, a new light rail bridge over Parkes Way, and integrated cycling and walking infrastructure. Enabling works, including the raising of London Circuit, are also underway. The project is jointly funded by the Australian and ACT Governments and is being delivered as an augmentation to the Stage 1 Public-Private Partnership (PPP) agreement with the Canberra Metro consortium. The total major works contract is valued at $577 million.

Haig Park Place - Braddon East
Major urban renewal precinct adjacent to Haig Park delivering over 1,000 dwellings, retail, and significant new public open space as part of the Braddon East master plan area.
Light Rail Extension Planning - Braddon
Planning and concept work for potential future extensions of the Canberra light rail network that would improve access for Braddon and nearby inner north precincts. The ACT Government is currently focused on delivering Stage 2A from the city to Commonwealth Park and planning Stage 2B from Commonwealth Park to Woden, while longer term network planning identifies future stages to other corridors including Belconnen and the airport. No detailed route, scope or timing has been confirmed for any Braddon specific extension, but the precinct sits within the existing Stage 1 corridor and is included in ongoing light rail network and precinct planning.
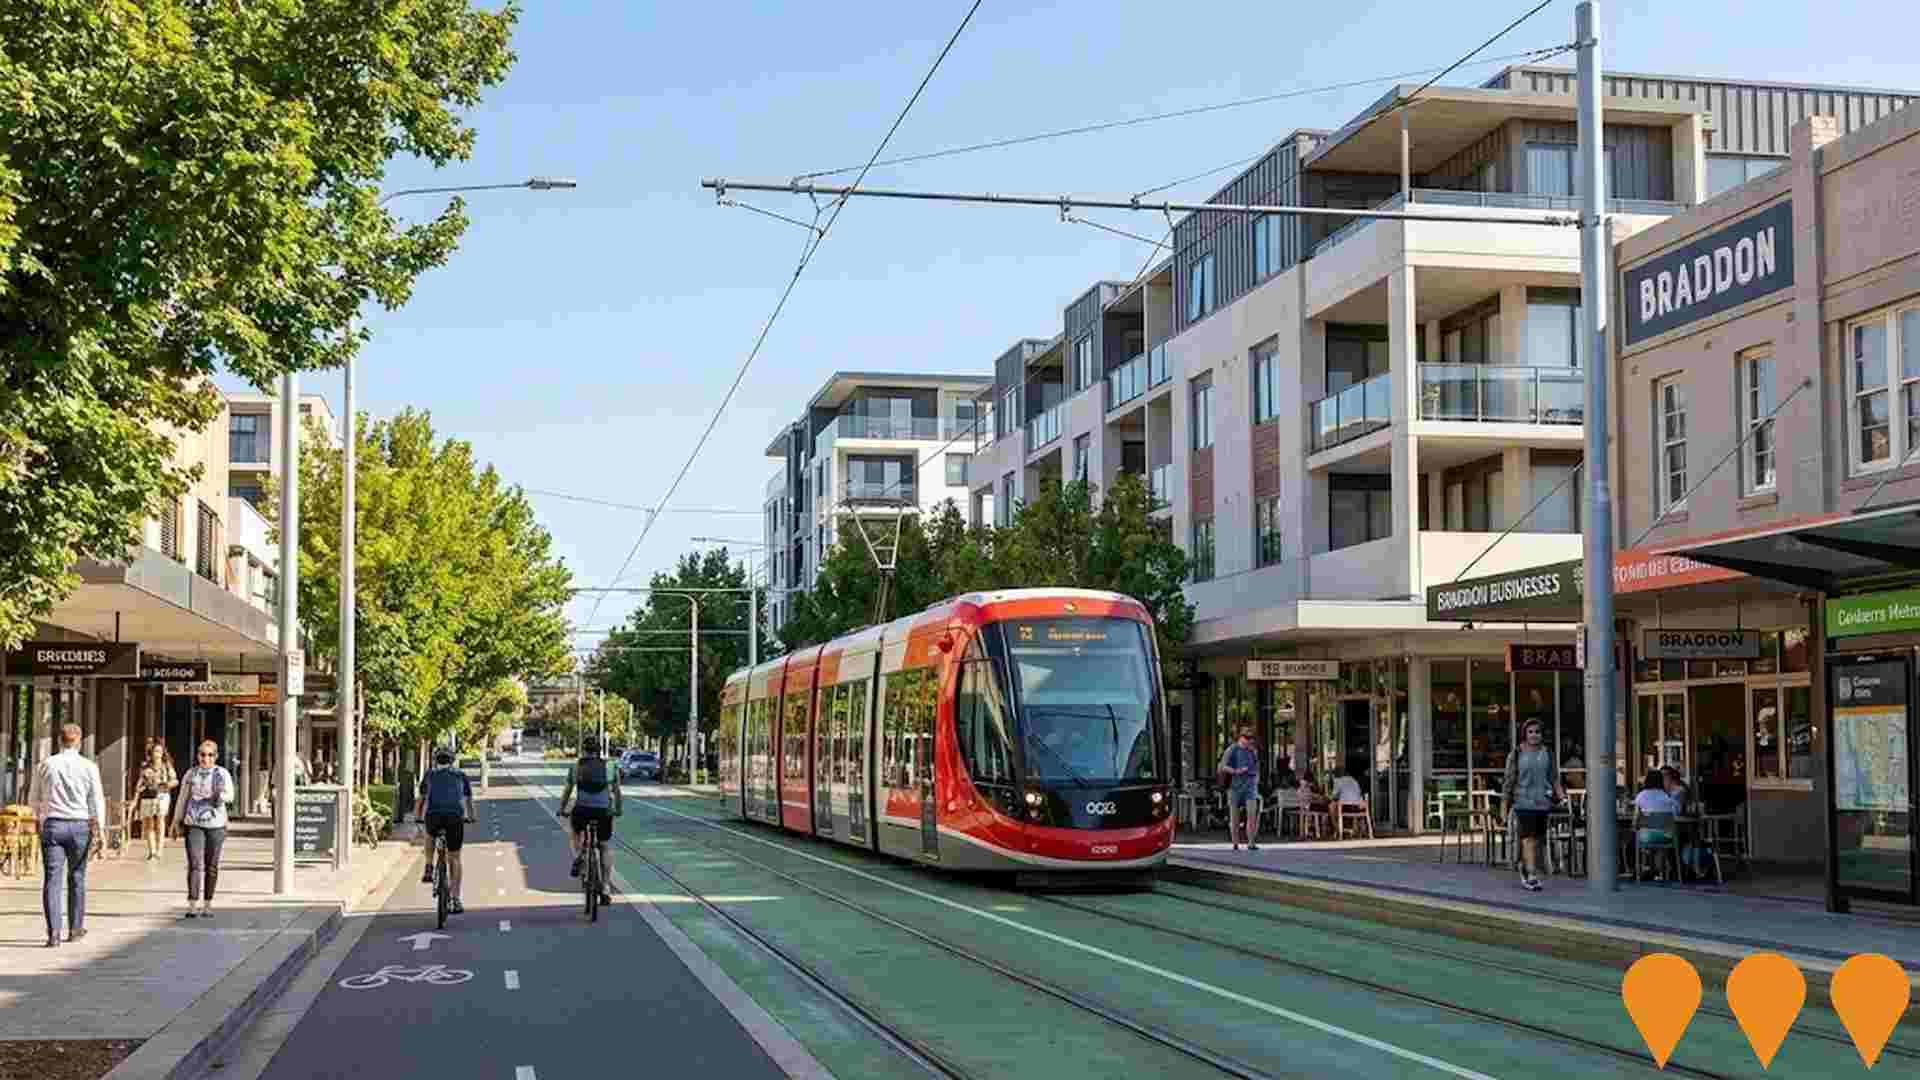
Lonsdale & Girrahween - Braddon (Section 34)
Two mixed-use towers delivering approximately 400 apartments plus retail and commercial space on the former Braddon Club site, currently under construction.

Marcus Clarke Street Office Complex
A 12-storey premium office complex designed to accommodate growing tech and professional services companies. Features flexible floor plates, end-of-trip facilities, and sustainable building technologies.
UNSW Canberra City Campus - Stage 1
The first stage of a new UNSW campus in Canberra's CBD, featuring two multi-use buildings for teaching, research, retail, and industry partners. This is part of a larger plan for a full campus with 14 buildings over five precincts.
The Grande
A $250-million mixed-use development with 356 apartments, shops, and a gym across three buildings up to nine storeys.

City Hill Mixed-Use Precinct
Capital Property Group plans a mixed-use precinct with residential buildings, a hybrid timber hotel, city park, and offices in Canberra. It features four residential buildings, a high-end hotel, A-grade office building and activated ground floor retail.
Employment
Employment conditions in Civic demonstrate strong performance, ranking among the top 35% of areas assessed nationally
Civic has an educated workforce with strong professional services representation. The unemployment rate was 2.4% in the past year, with estimated employment growth of 1.8%.
As of September 2025, there were 3,718 residents employed at a 1.2% lower unemployment rate than the Australian Capital Territory's (ACT) rate of 3.6%. Workforce participation was slightly below standard at 67.4%, compared to ACT's 69.6%. Leading employment industries among residents are public administration & safety, professional & technical services, and accommodation & food. The area specializes in accommodation & food with an employment share twice the regional level, while health care & social assistance has limited presence at 6.5% compared to the regional 11.7%.
There were 8.3 workers per resident as of the Census, indicating Civic functions as an employment hub attracting workers from surrounding areas. Between September 2024 and September 2025, employment levels increased by 1.8%, labour force grew by 1.2%, and unemployment fell by 0.6 percentage points. In comparison, ACT recorded employment growth of 1.4%, labour force growth of 1.2%, with a decrease in unemployment of 0.2 percentage points. State-level data from 25-Nov-25 shows ACT employment grew by 1.19% year-on-year, adding 710 jobs, with the state unemployment rate at 4.5%. National employment forecasts from May-25 suggest national employment will expand by 6.6% over five years and 13.1% over ten years. Applying these projections to Civic's employment mix indicates local employment should increase by 6.5% over five years and 13.1% over ten years, assuming constant population growth for illustrative purposes.
Frequently Asked Questions - Employment
Income
The economic profile demonstrates exceptional strength, placing the area among the top 10% nationally based on comprehensive AreaSearch income analysis
The Civic SA2 shows a median taxpayer income of $72,282 and an average of $103,421 according to the latest postcode level ATO data aggregated by AreaSearch for financial year 2022. This is among the top percentile nationally. In contrast, the Australian Capital Territory's median income was $68,678 with an average income of $83,634 in the same period. Based on Wage Price Index growth of 13.6% from financial year 2022 to September 2025, current estimates would be approximately $82,112 (median) and $117,486 (average). Census 2021 income data shows household, family, and personal incomes all rank highly in Civic, between the 80th and 84th percentiles nationally. Distribution data shows the largest segment comprises 39.8% earning $1,500 - $2,999 weekly (2,102 residents), reflecting patterns seen in the surrounding region where 34.3% similarly occupy this range. The substantial proportion of high earners, at 34.3%, indicates strong economic capacity throughout the area. High housing costs consume 19.8% of income, but strong earnings still place disposable income at the 74th percentile. The area's SEIFA income ranking places it in the 7th decile.
Frequently Asked Questions - Income
Housing
Civic features a more urban dwelling mix with significant apartment living, with a higher proportion of rental properties than the broader region
Dwelling structure in Civic, as per the latest Census, consisted entirely of other dwellings such as semi-detached homes and apartments. This is unlike the Australian Capital Territory's mix of 39.3% houses and 60.7% other dwellings. Home ownership in Civic was at 15.8%, with mortgaged dwellings at 21.4% and rented ones at 62.8%. The median monthly mortgage repayment in Civic was $1,950, lower than the Australian Capital Territory average of $2,080 but higher than the national average of $1,863. Median weekly rent in Civic was $550, above both the Australian Capital Territory figure of $476 and the national average of $375.
Frequently Asked Questions - Housing
Household Composition
Civic features high concentrations of lone person households and group households, with a lower-than-average median household size
Family households constitute 45.0% of all households, consisting of 5.9% couples with children, 35.5% couples without children, and 2.9% single parent families. Non-family households account for the remaining 55.0%, with lone person households at 44.5% and group households comprising 10.3% of the total. The median household size is 1.7 people, which is smaller than the Australian Capital Territory average of 2.2.
Frequently Asked Questions - Households
Local Schools & Education
Educational attainment in Civic aligns closely with national averages, showing typical qualification patterns and performance metrics
Civic's educational attainment exceeds national and regional averages. Among residents aged 15+, 61.5% possess university qualifications, compared to Australia's 30.4% and the SA4 region's 46.8%. Bachelor degrees are most prevalent at 33.3%, followed by postgraduate qualifications (24.0%) and graduate diplomas (4.2%). Technical qualifications comprise 11.7%, with advanced diplomas at 5.6% and certificates at 6.1%.
Educational participation is high, with 50.3% currently enrolled in formal education. This includes 44.3% in tertiary education, 1.2% in primary education, and 1.1% pursuing secondary education.
Frequently Asked Questions - Education
Schools Detail
Nearby Services & Amenities
Transport
Transport servicing is high compared to other areas nationally based on assessment of service frequency, route connectivity and accessibility
Public transport analysis reveals 43 active transport stops operating within Civic. These stops offer a mix of train, lightrail, and bus services. They are serviced by 51 individual routes, collectively providing 7,021 weekly passenger trips.
Transport accessibility is rated as excellent, with residents typically located 180 meters from the nearest transport stop. Service frequency averages 1,003 trips per day across all routes, equating to approximately 163 weekly trips per individual stop.
Frequently Asked Questions - Transport
Transport Stops Detail
Health
Civic's residents boast exceedingly positive health performance metrics with very low prevalence of common health conditions across all age groups
Civic demonstrates excellent health outcomes across all age groups, with a very low prevalence of common health conditions. Private health cover rate is notably high at approximately 73% (3,834 people), compared to 65.3% in Australian Capital Territory and 55.3% nationally. Mental health issues and asthma are the most prevalent conditions, affecting 10.8 and 7.5% of residents respectively.
A significant majority, 77.1%, report being completely clear of medical ailments, compared to 70.8% in Australian Capital Territory. Civic has a lower proportion of seniors aged 65 and over at 6.2% (328 people), compared to 11.4% in Australian Capital Territory. Health outcomes among seniors are strong and align with the general population's health profile.
Frequently Asked Questions - Health
Cultural Diversity
Civic is among the most culturally diverse areas in the country based on AreaSearch assessment of a range of language and cultural background related metrics
Civic has a high level of cultural diversity, with 42.7% of its population speaking a language other than English at home and 49.9% born overseas. The predominant religion in Civic is Christianity, accounting for 23.4% of the population. However, Judaism is overrepresented in Civic compared to the Australian Capital Territory average, comprising 0.4% versus 0.5%.
In terms of ancestry, the top three groups in Civic are Chinese (19.0%), English (19.0%), and Australian (16.2%). These figures compare to regional averages of 5.6%, 24.1%, and 21.6% respectively for Chinese, English, and Australian ancestry. There are also notable differences in the representation of Korean (1.8% vs 0.7%), Indian (3.7% vs 2.0%), and Russian (0.4% vs 0.4%) ethnic groups in Civic compared to regional averages.
Frequently Asked Questions - Diversity
Age
Civic hosts a very young demographic, ranking in the bottom 10% of areas nationwide
Civic's median age is 27 years, significantly below the Australian Capital Territory average of 35 and lower than the national average of 38. Civic has a higher concentration of residents aged 15-24 (36.3%) compared to the ACT but fewer residents aged 5-14 (3.1%). This concentration is well above the national average of 12.5%. According to the 2021 Census, the 5-14 age group has grown from 1.6% to 3.1%, while the 45-54 cohort has declined from 7.3% to 5.6% and the 15-24 group has decreased from 37.4% to 36.3%. Population forecasts for Civic in 2041 indicate significant demographic changes, with the 15-24 age cohort projected to increase by 2,536 people (132%), from 1,919 to 4,456.
