Chart Color Schemes
This analysis uses ABS Statistical Areas Level 2 (SA2) boundaries, which can materially differ from Suburbs and Localities (SAL) even when sharing similar names.
SA2 boundaries are defined by the Australian Bureau of Statistics and are designed to represent communities for statistical reporting (e.g., census and ERP).
Suburbs and Localities (SAL) represent commonly-used suburb/locality names (postal-style areas) and may use different geographic boundaries. For comprehensive analysis, consider reviewing both boundary types if available.
est. as @ -- *
ABS ERP | -- people | --
2021 Census | -- people
Sales Activity
Curious about local property values? Filter the chart to assess the volume and appreciation (including resales) trends and regional comparisons, or scroll to the map below view this information at an individual property level.
Find a Recent Sale
Sales Detail
Population
Yarralumla has seen population growth performance typically on par with national averages when looking at short and medium term trends
Yarralumla's population is around 3,177 as of Nov 2025. This reflects an increase of 57 people since the 2021 Census, which reported a population of 3,120 people. The change is inferred from the estimated resident population of 3,103 from the ABS as of June 2024 and an additional 35 validated new addresses since the Census date. This level of population equates to a density ratio of 440 persons per square kilometer. Population growth for the area was primarily driven by overseas migration.
AreaSearch is adopting ABS/Geoscience Australia projections for each SA2 area, as released in 2024 with 2022 as the base year. For areas not covered and years post-2032, age group growth rates from the ACT Government's SA2 area projections are adopted. Considering projected demographic shifts, a population increase just below the median is expected by 2041 based on latest annual ERP population numbers, reflecting an increase of 7.8% in total over the 17 years.
Frequently Asked Questions - Population
Development
Residential development activity is lower than average in Yarralumla according to AreaSearch's national comparison of local real estate markets
Yarralumla has approved approximately 11 residential properties per year over the past five financial years, totalling 57 homes. As of FY26, one approval has been recorded. On average, around 0.2 people have moved to the area annually for each dwelling built between FY21 and FY25. This indicates that new supply is meeting or exceeding demand, providing ample buyer choice and potential for population growth beyond current forecasts.
The average expected construction cost of new homes in Yarralumla is $525,000, suggesting developers are targeting the premium market segment with higher-end properties. In FY26, $31.4 million worth of commercial approvals have been registered, indicating high levels of local commercial activity. However, compared to the Australian Capital Territory average, Yarralumla has significantly lower building activity (59.0% below regional average per person). This limited new construction typically reinforces demand and pricing for existing dwellings.
Nevertheless, development activity has increased recently. All recent development in Yarralumla has consisted of detached dwellings, preserving the area's low-density nature and attracting space-seeking buyers. Notably, developers are building more traditional houses than the current mix suggests (65.0% at Census), implying strong demand for family homes despite density pressures. Yarralumla reflects a low-density area with around 208 people per approval. According to AreaSearch's latest quarterly estimate, the suburb is expected to grow by 249 residents through to 2041. Given current development patterns, new housing supply should readily meet demand, offering good conditions for buyers and potentially facilitating population growth beyond current projections.
Frequently Asked Questions - Development
Infrastructure
Yarralumla has emerging levels of nearby infrastructure activity, ranking in the 23rdth percentile nationally
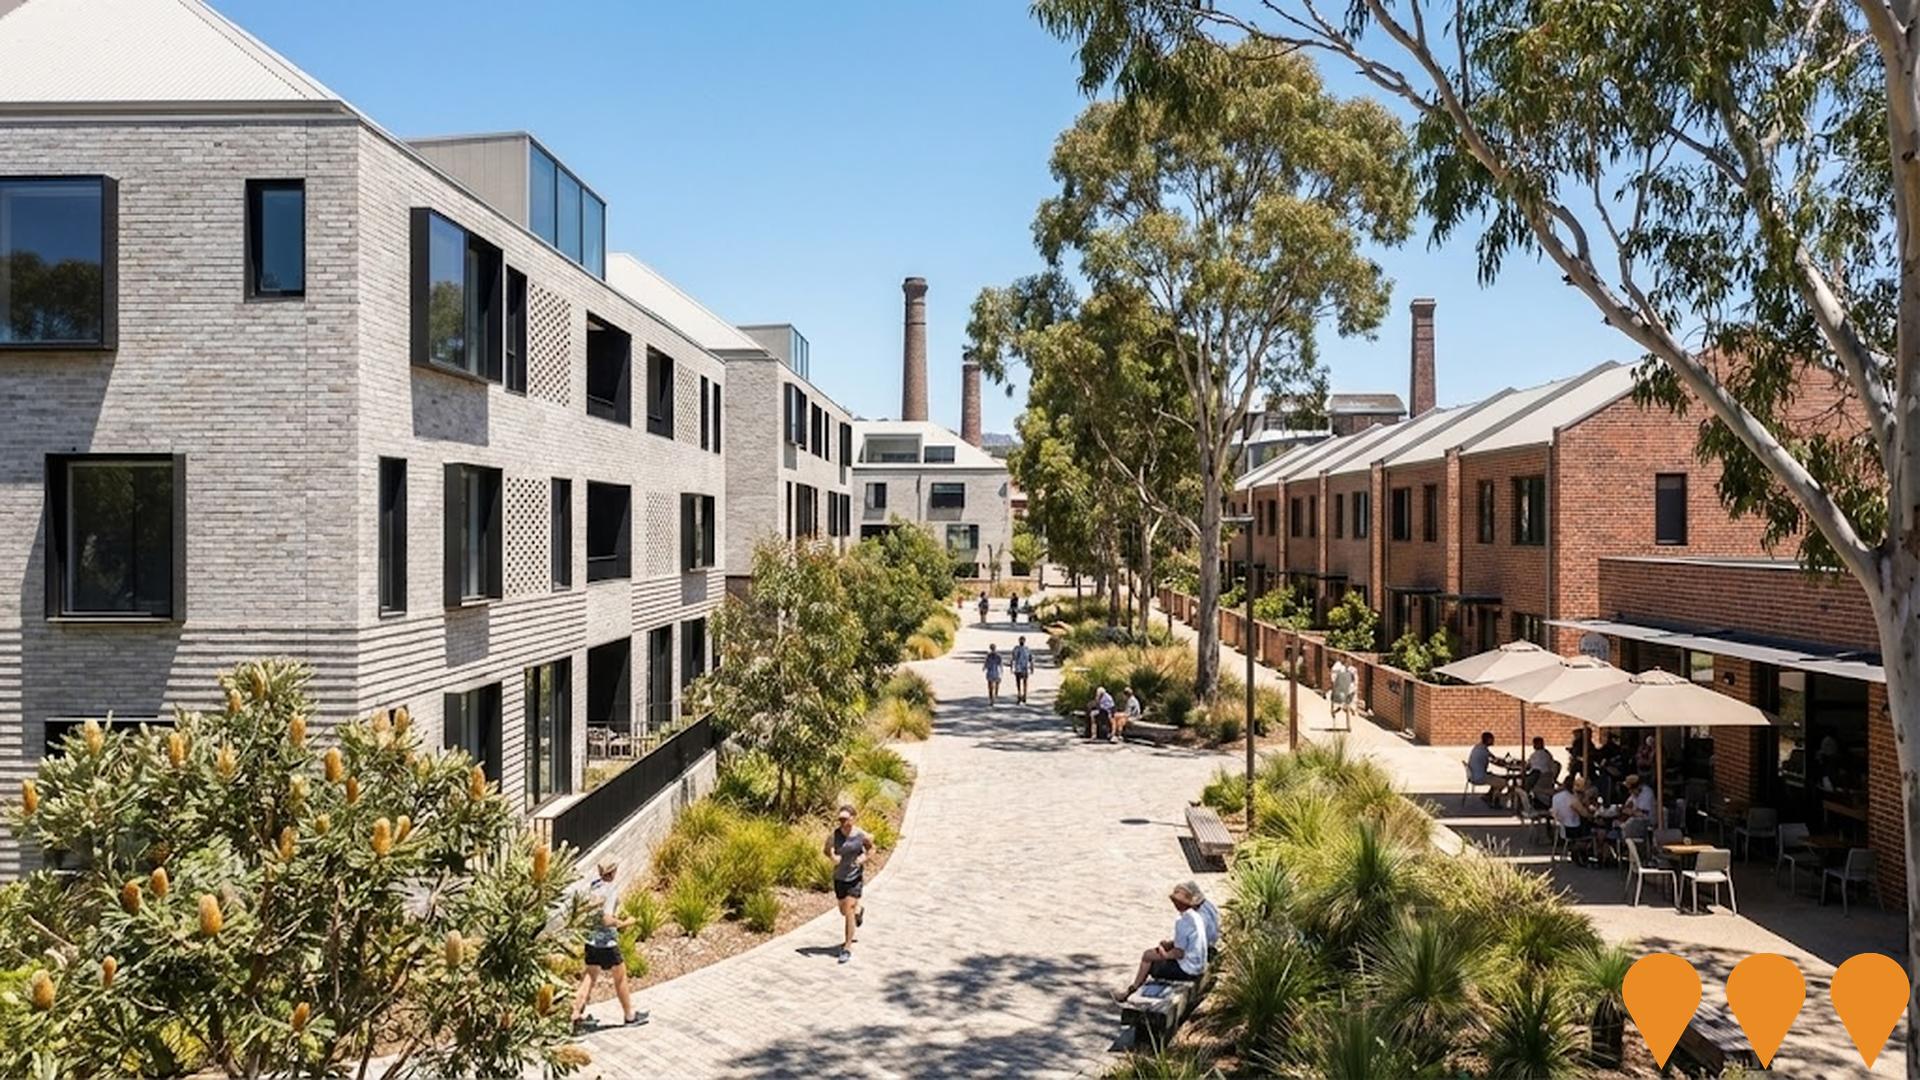
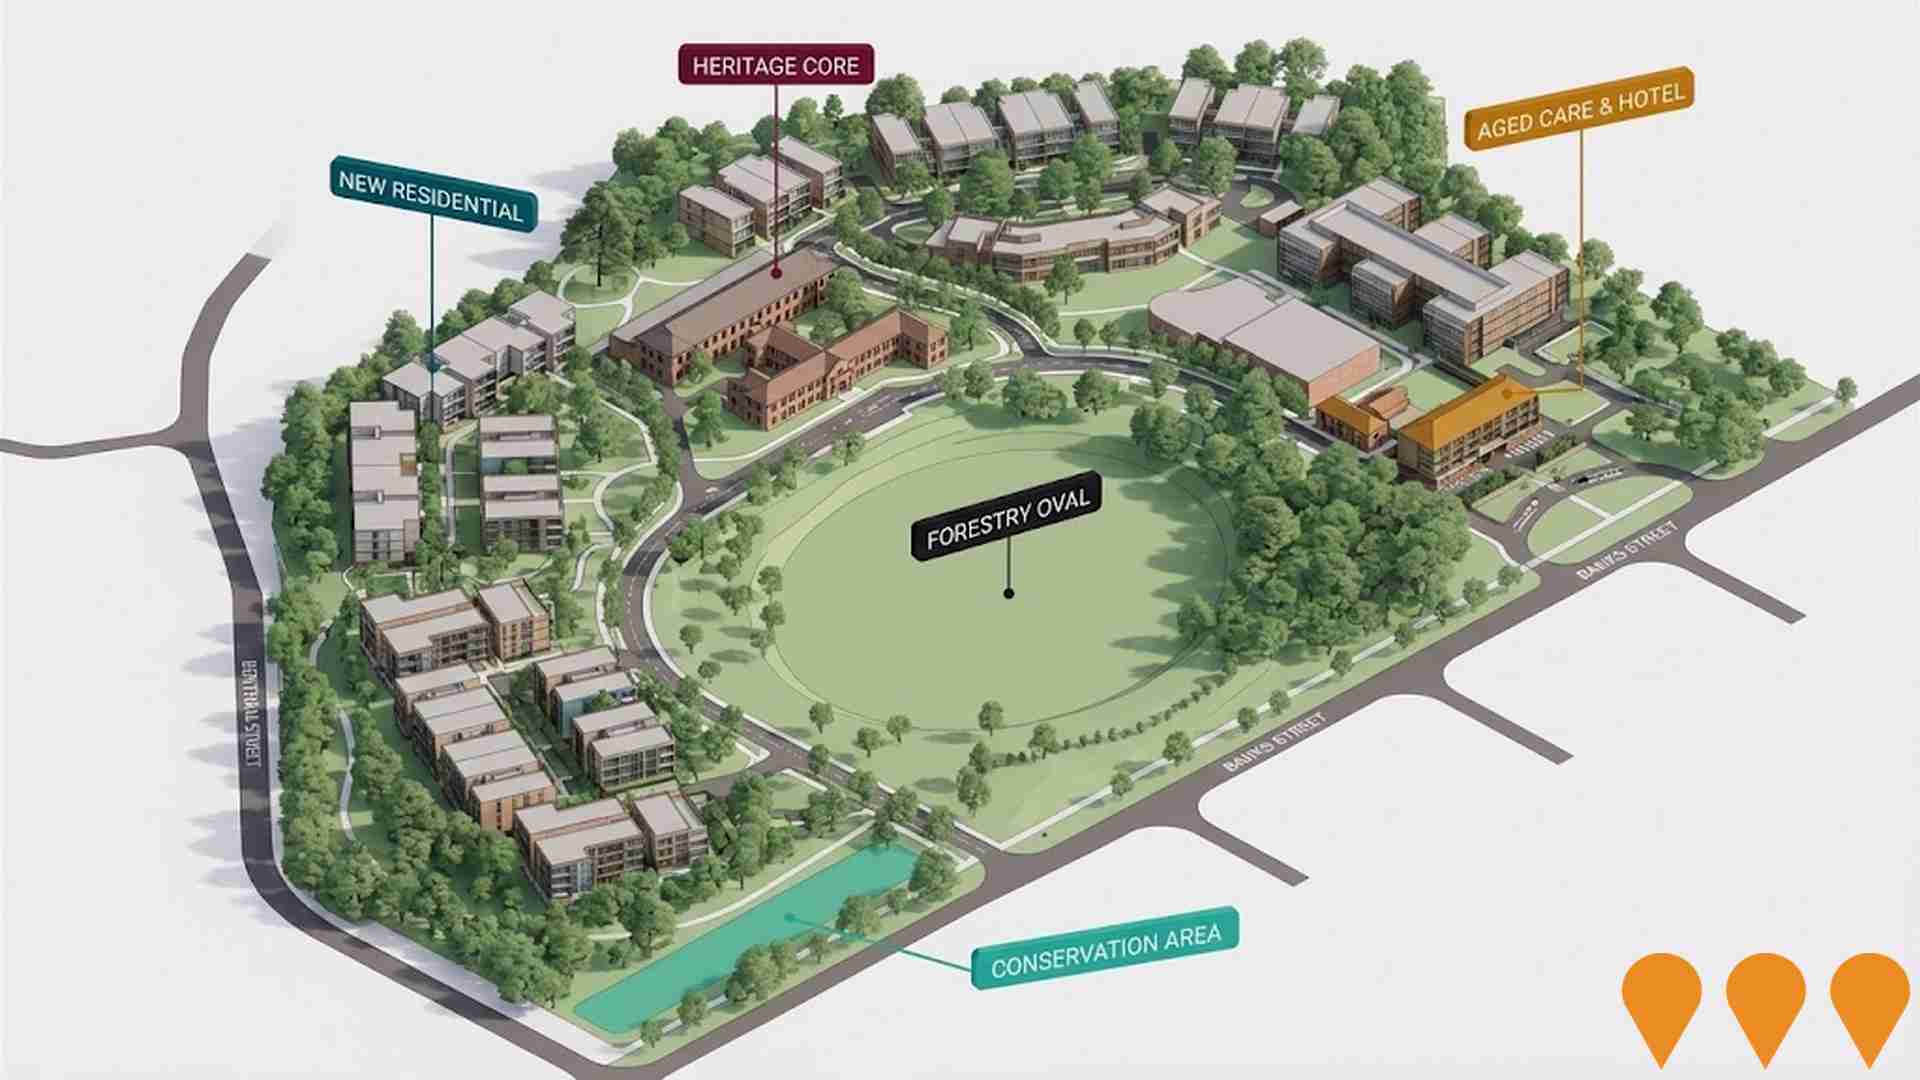
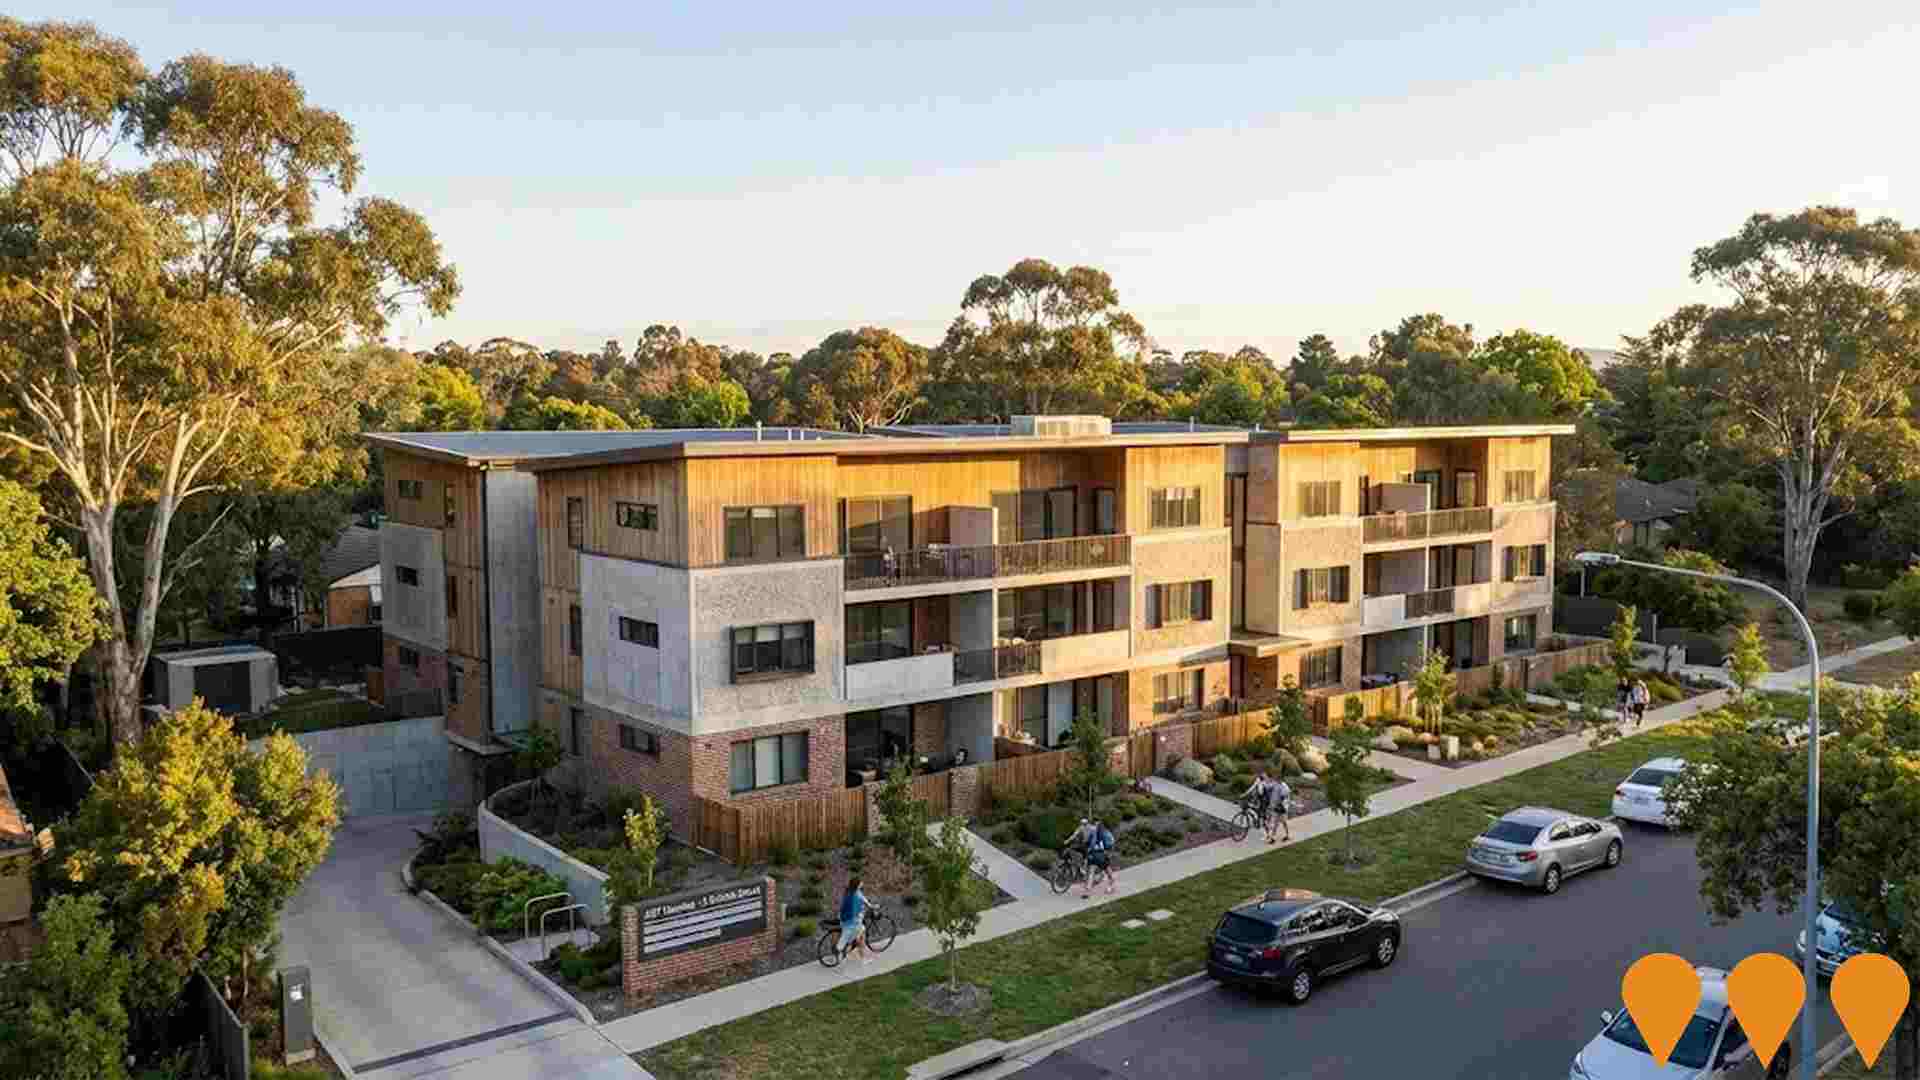
Changes to local infrastructure significantly influence an area's performance. AreaSearch has identified 16 projects likely to impact the area. Notable ones include Yarralumla Apartments, 2 Schlich Street Public Housing, Canberra Brickworks Precinct, and Forestry Place. The following details those most relevant.
Professional plan users can use the search below to filter and access additional projects.
INFRASTRUCTURE SEARCH
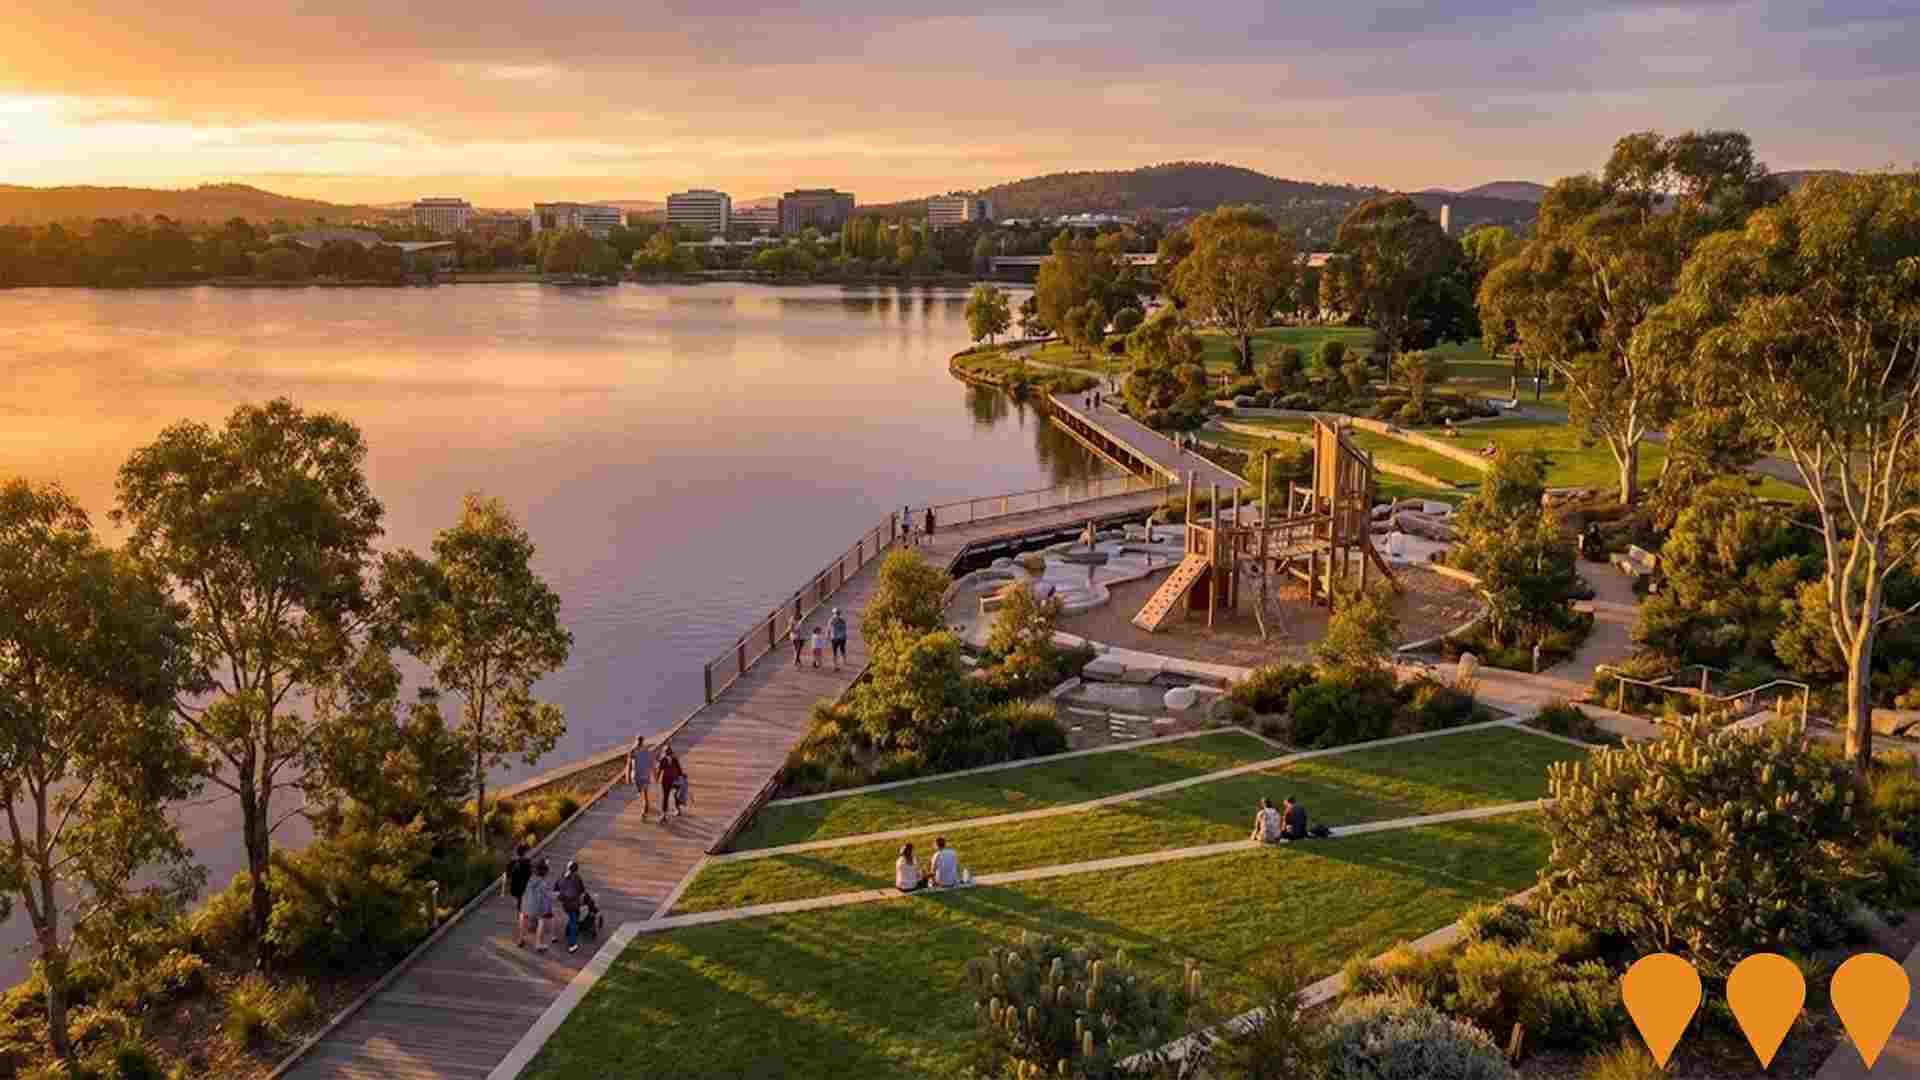
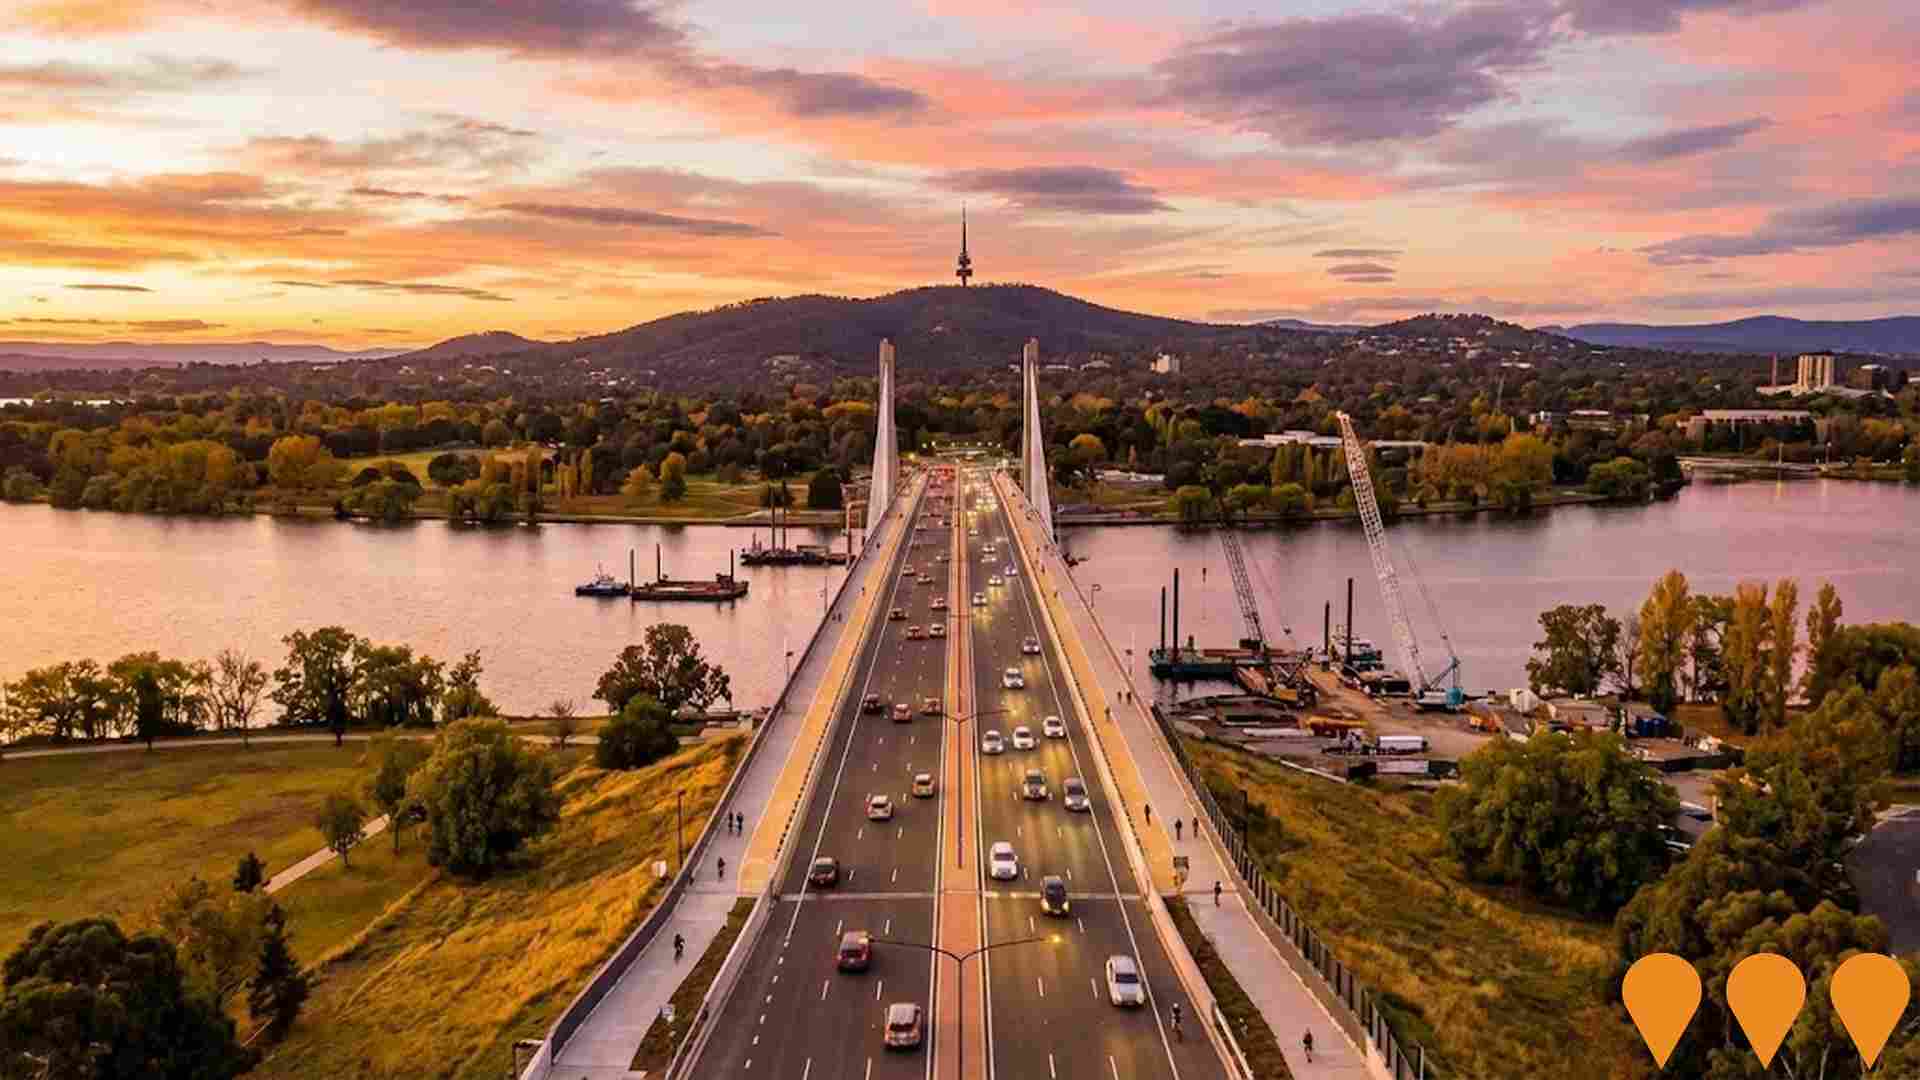
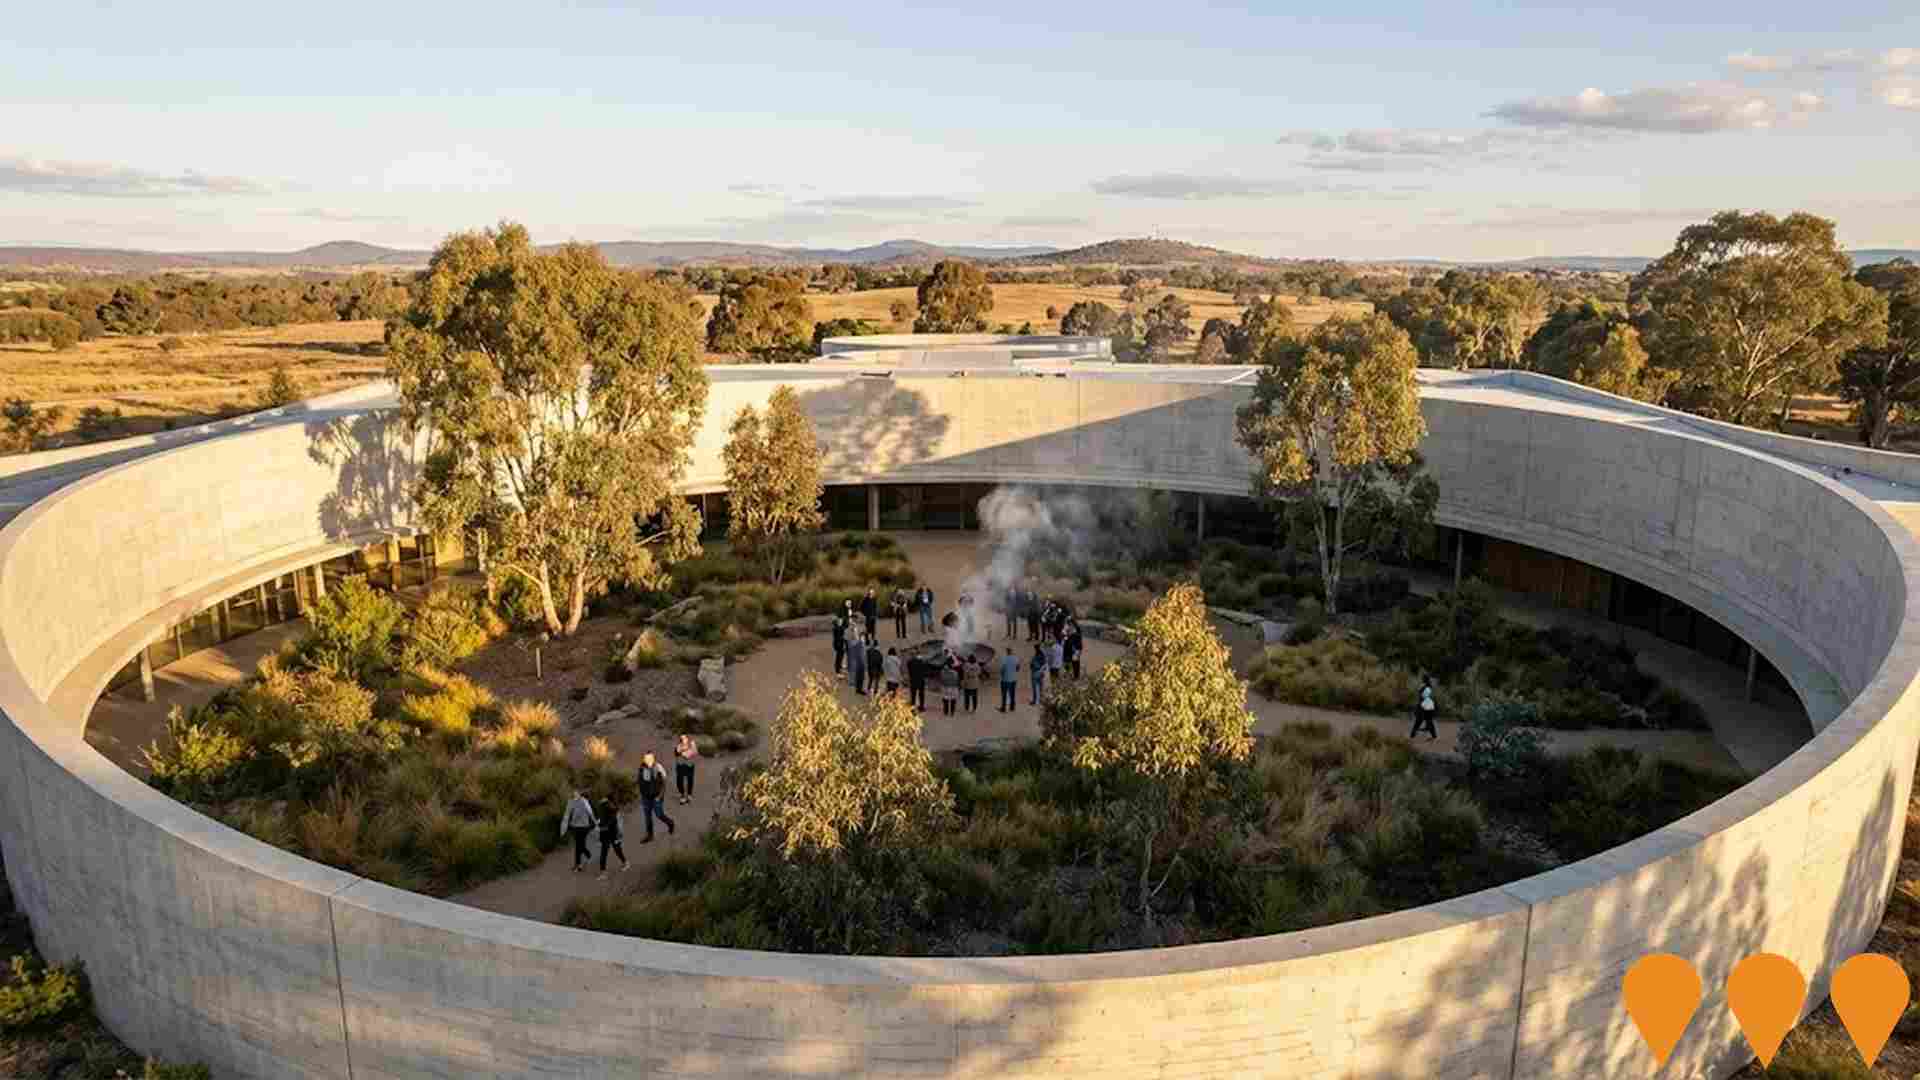
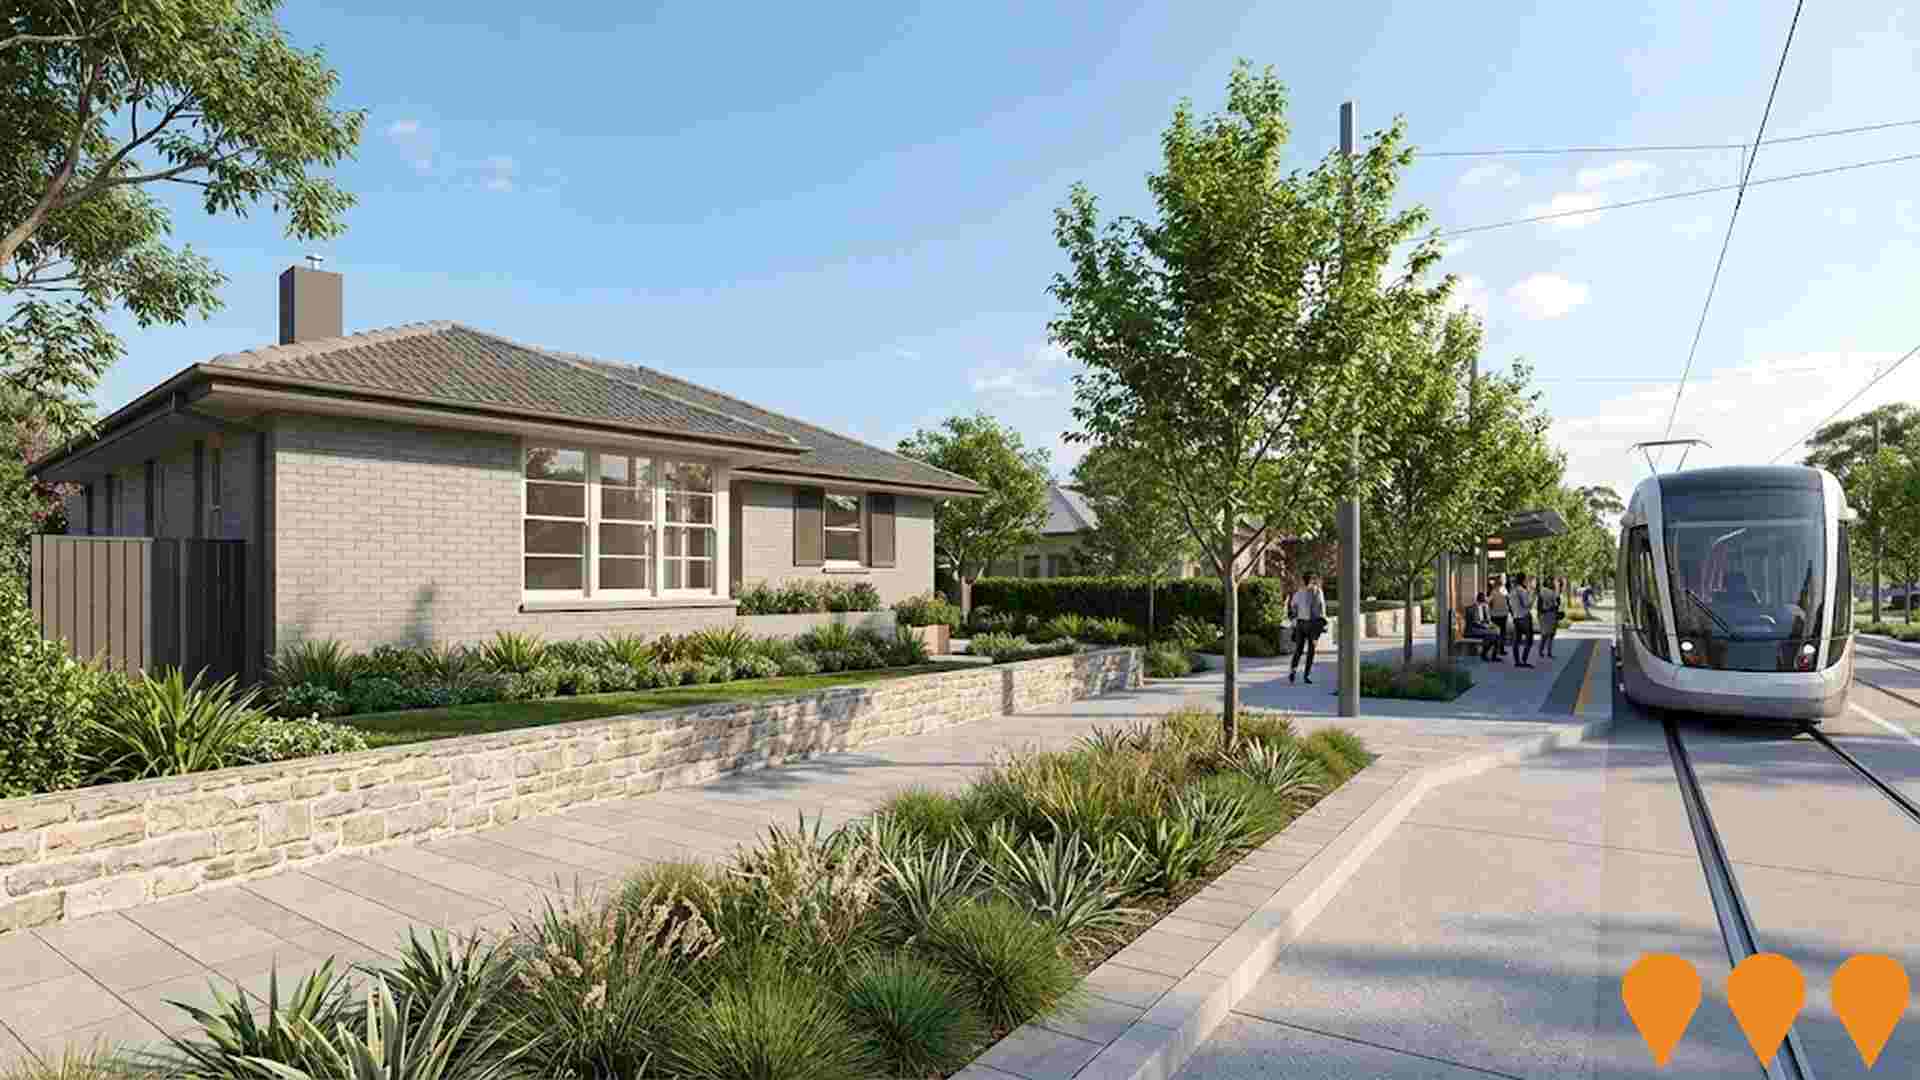
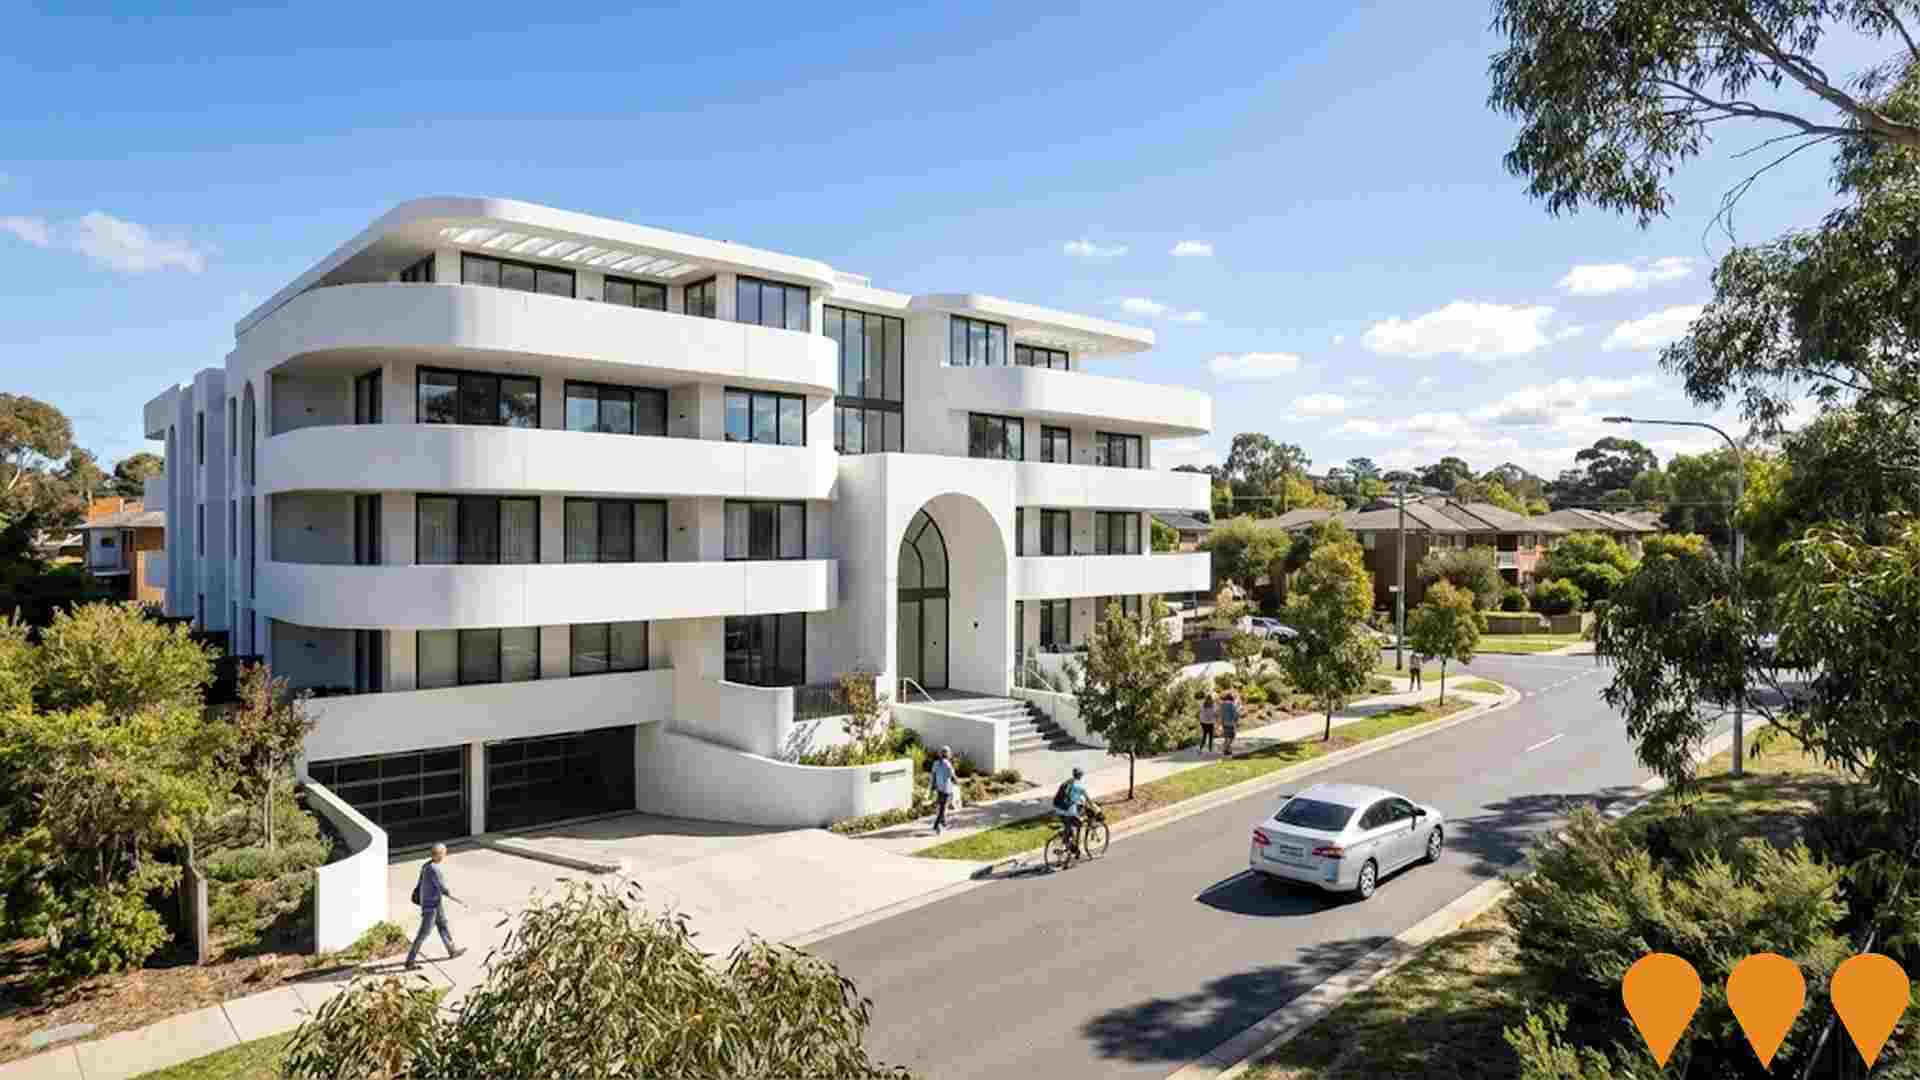
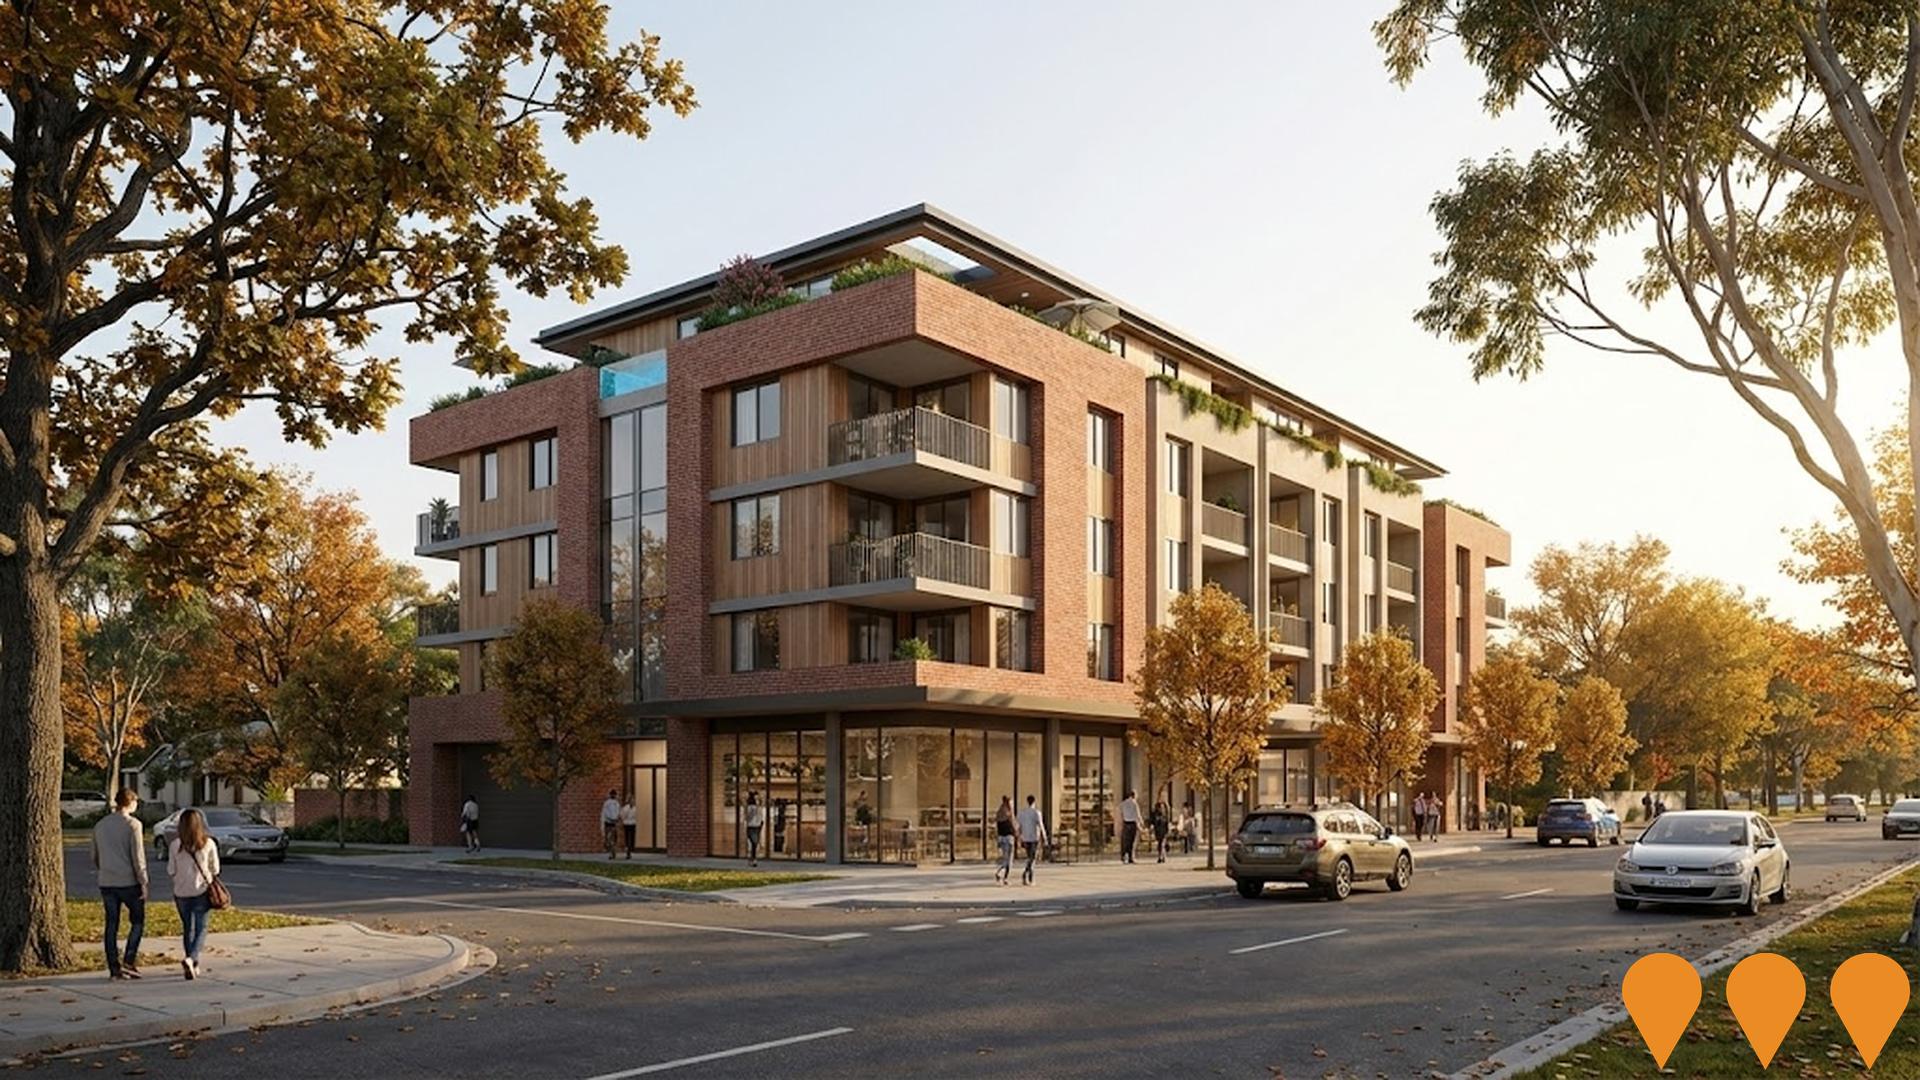
 Denotes AI-based impression for illustrative purposes only, not to be taken as definitive under any circumstances. Please follow links and conduct other investigations from the project's source for actual imagery. Developers and project owners wishing us to use original imagery please Contact Us and we will do so.
Frequently Asked Questions - Infrastructure
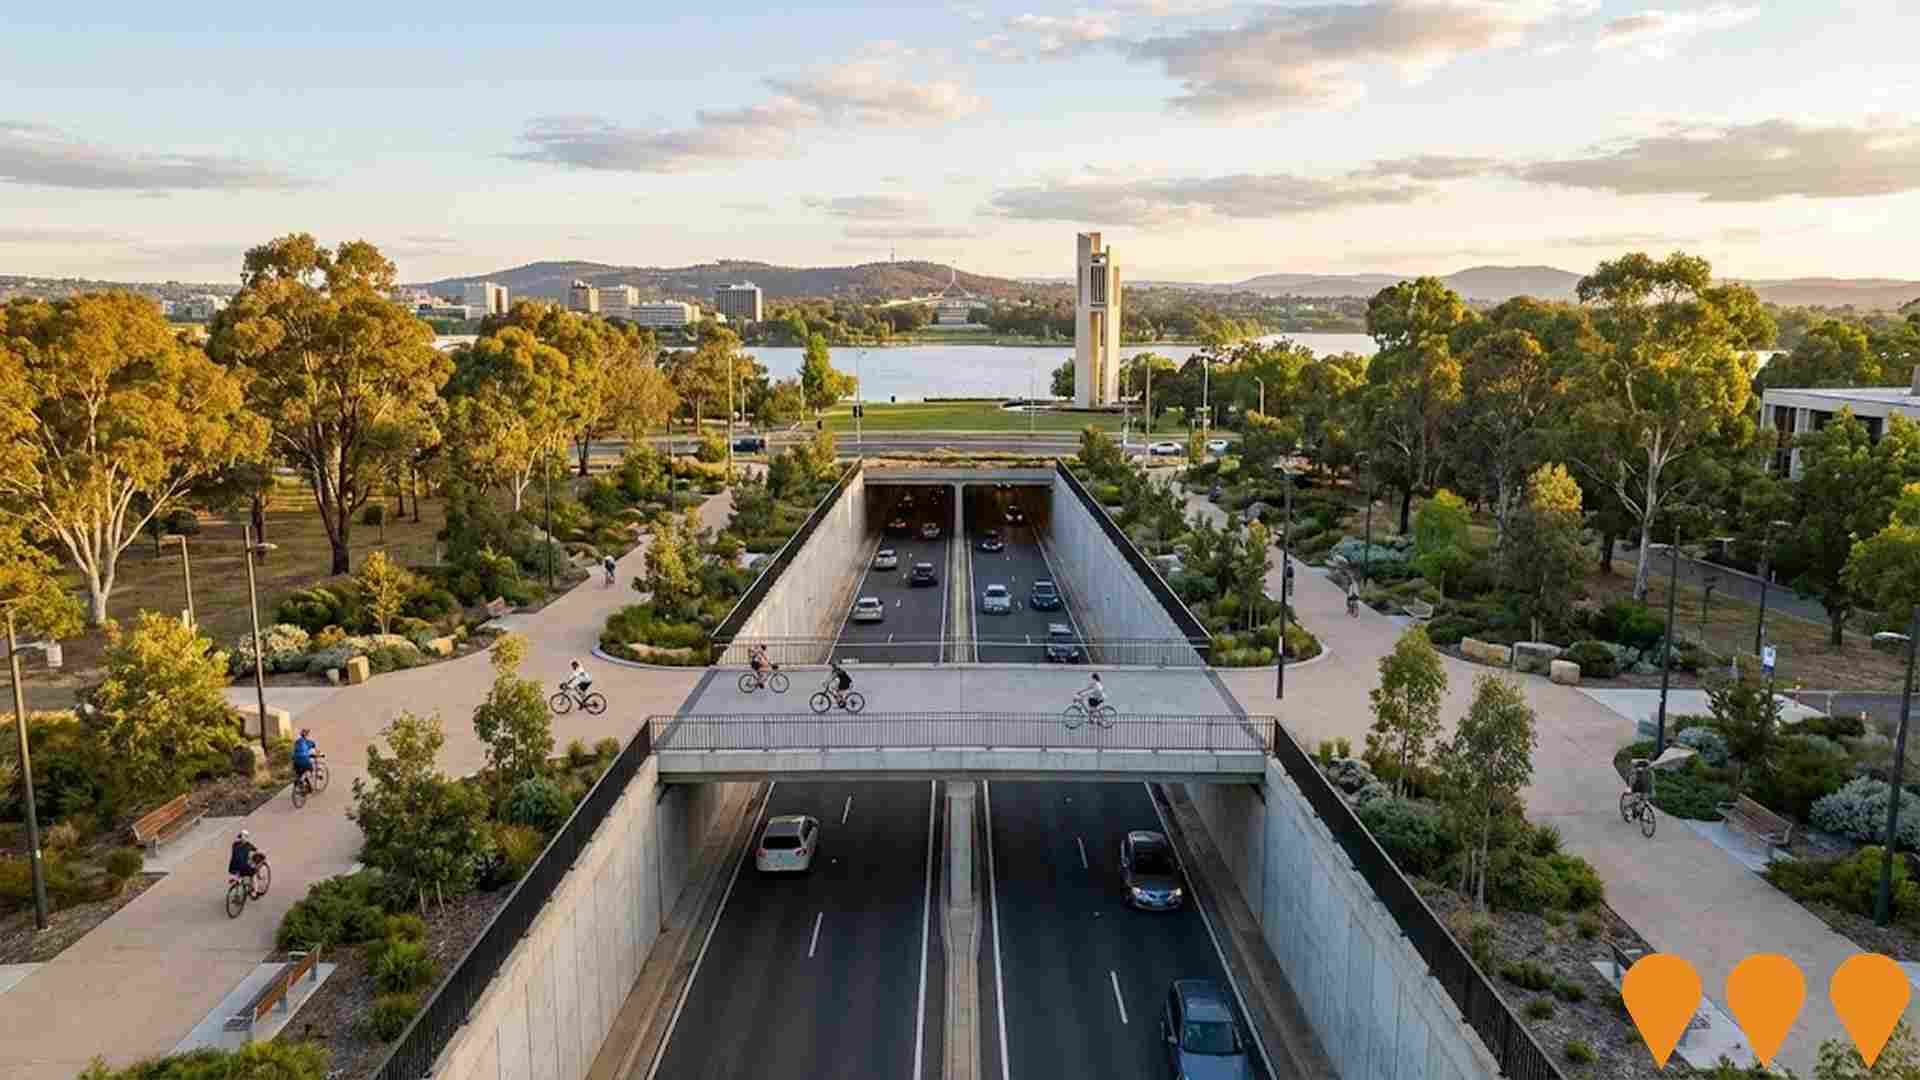
ACT Light Rail Stage 2A (City to Commonwealth Park)
The 1.7km extension of Canberra's light rail from Alinga Street to Commonwealth Park is **under construction** and expected to be operational in **early 2028**. It will feature **three new stops** at Edinburgh Avenue, City South, and Commonwealth Park. The project includes wire-free operation with on-board energy storage systems, a new light rail bridge over Parkes Way, and integrated cycling and walking infrastructure. Enabling works, including the raising of London Circuit, are also underway. The project is jointly funded by the Australian and ACT Governments and is being delivered as an augmentation to the Stage 1 Public-Private Partnership (PPP) agreement with the Canberra Metro consortium. The total major works contract is valued at $577 million.

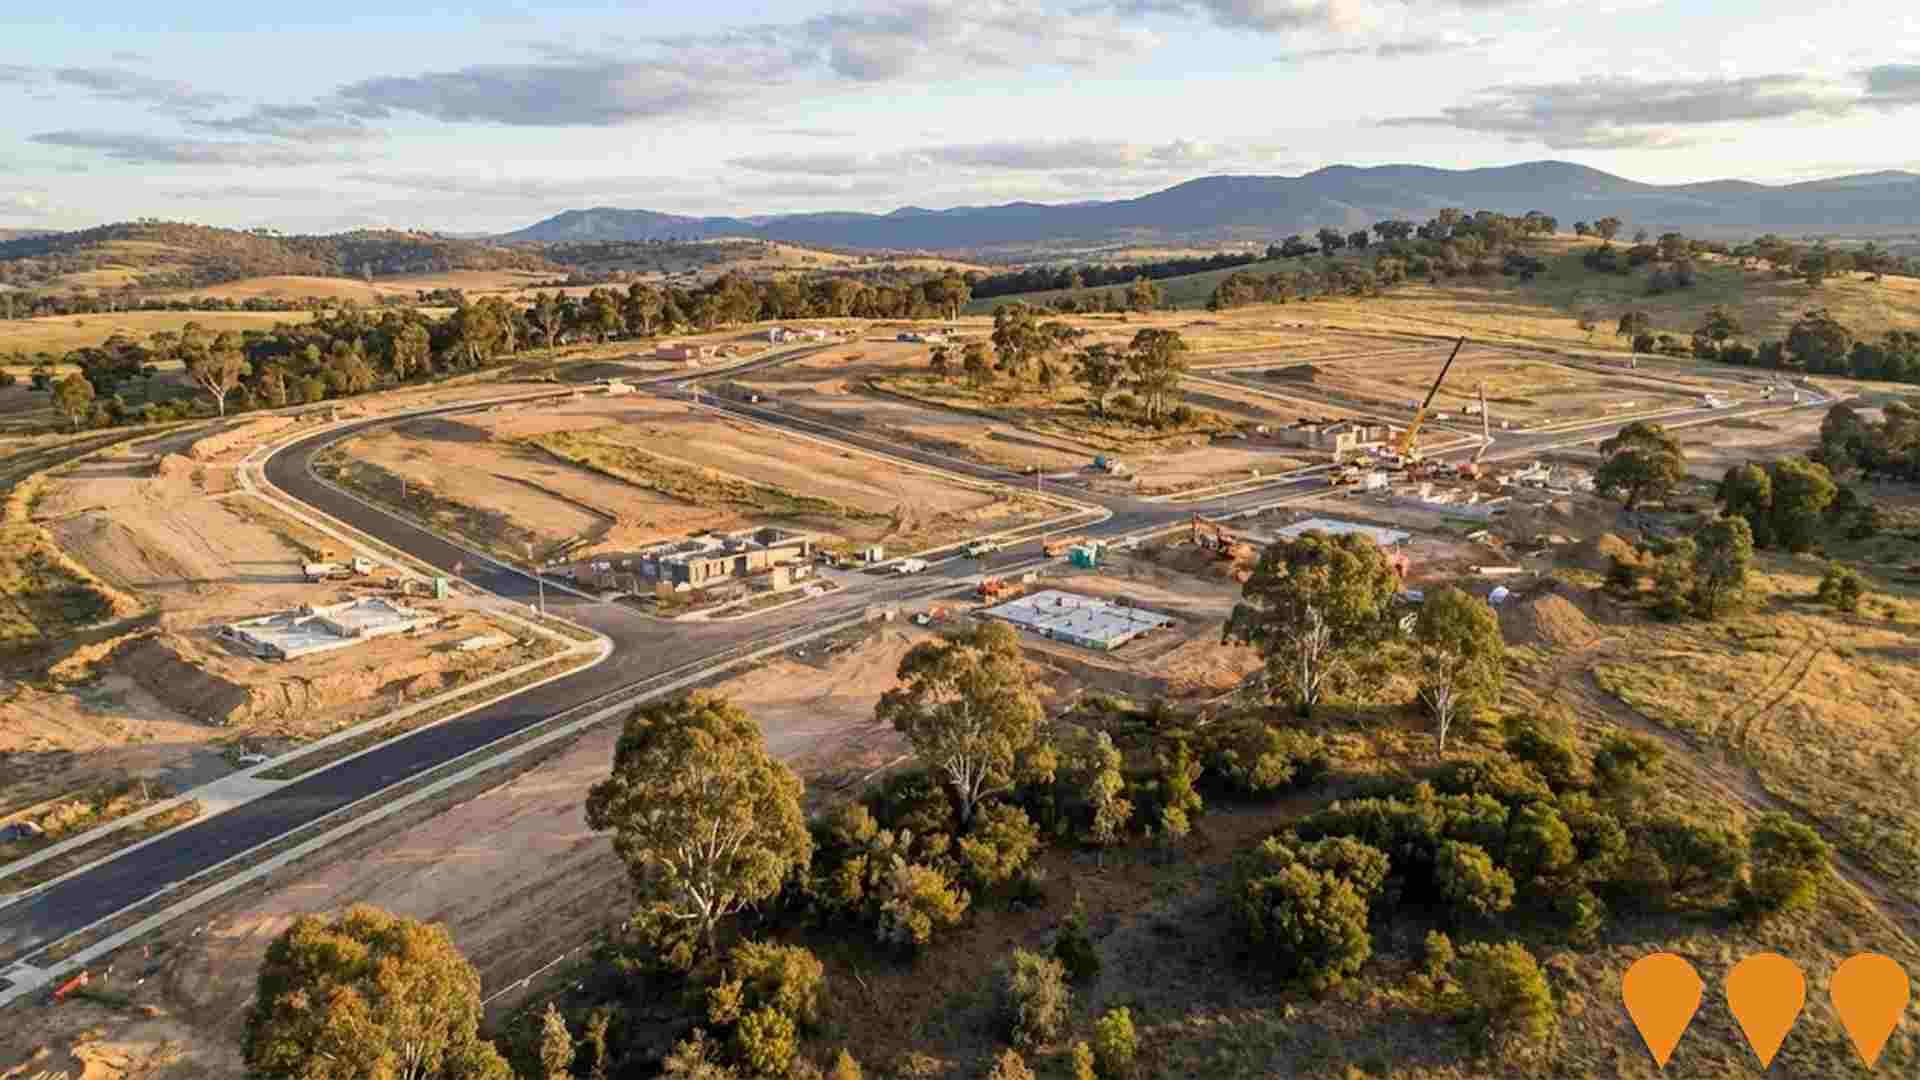
Bandler and Sulman New Suburbs
Development of two new suburbs in the Molonglo Valley - Bandler and Sulman - as part of the Molonglo Valley 3 East planning area. The project will provide approximately 2,500 new dwellings with supporting infrastructure, parks, schools, and community facilities. Planning is in early stages with potential delays due to infrastructure requirements like the Bindubi Street Extension.
Draft Inner South District Strategy
A strategic planning framework by the ACT Government to guide the future development of the Inner South district, including Deakin. The strategy proposes to manage growth and change, potentially allowing for increased housing density, particularly in West Deakin and along the new light rail corridor. It aims to protect the valued characteristics of the district while accommodating future population growth.
The Embassy Residences
A residential development of 53 high-end apartments, primarily with three and four bedrooms, and three ground-floor commercial units for a day spa, club lounge, and art gallery. The project is aimed at downsizers and retirees and is located on the former Margaret Dimoff Art Gallery site. The development includes two basement levels with 134 car parking spaces.
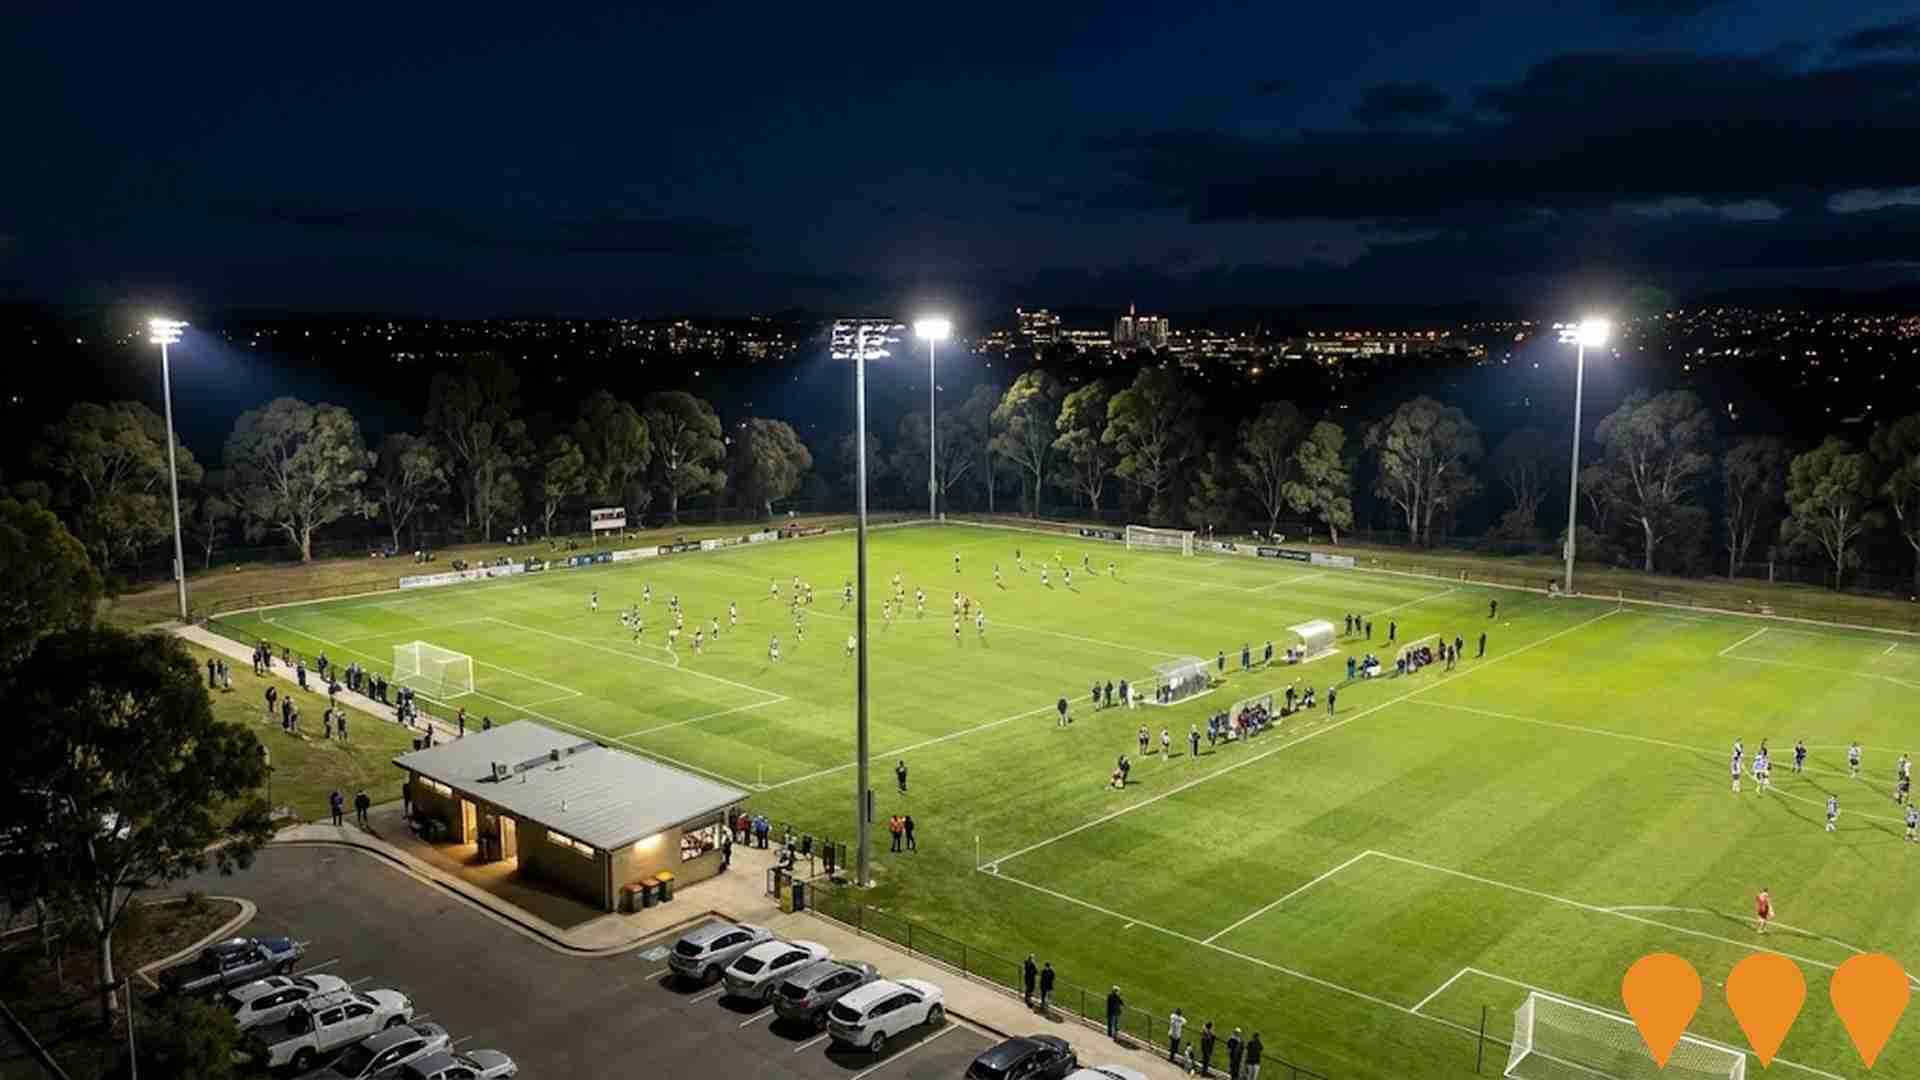
Deakin District Playing Fields Upgrade
Upgrades to the Deakin District Playing Fields, including the installation of new LED sportsground floodlighting to allow for night games.
Deakin Private Hospital
Deakin Private Hospital offers premium and integrated inpatient, day therapy, and hospital-in-the-home services, focusing on individualised and high-quality mental health treatment. It includes a Specialised PTSD & Trauma Support Unit for military and first responders, and services such as Repetitive Transcranial Magnetic Stimulation (rTMS) for depression. The hospital also features co-located clinics and is supported by a multidisciplinary team of Psychiatrists, Medical, Nursing, and Allied Health professionals.

Yarralumla Apartments
Proposed five-storey mixed-use redevelopment opposite the Yarralumla shops at the corner of Novar and Bentham Streets. The scheme includes 12 three-bedroom apartments and two penthouses above ground-floor commercial tenancies, with communal amenities including a residents lounge, garden and pool. Designed to Gold Level Livable Housing Design Guidelines.
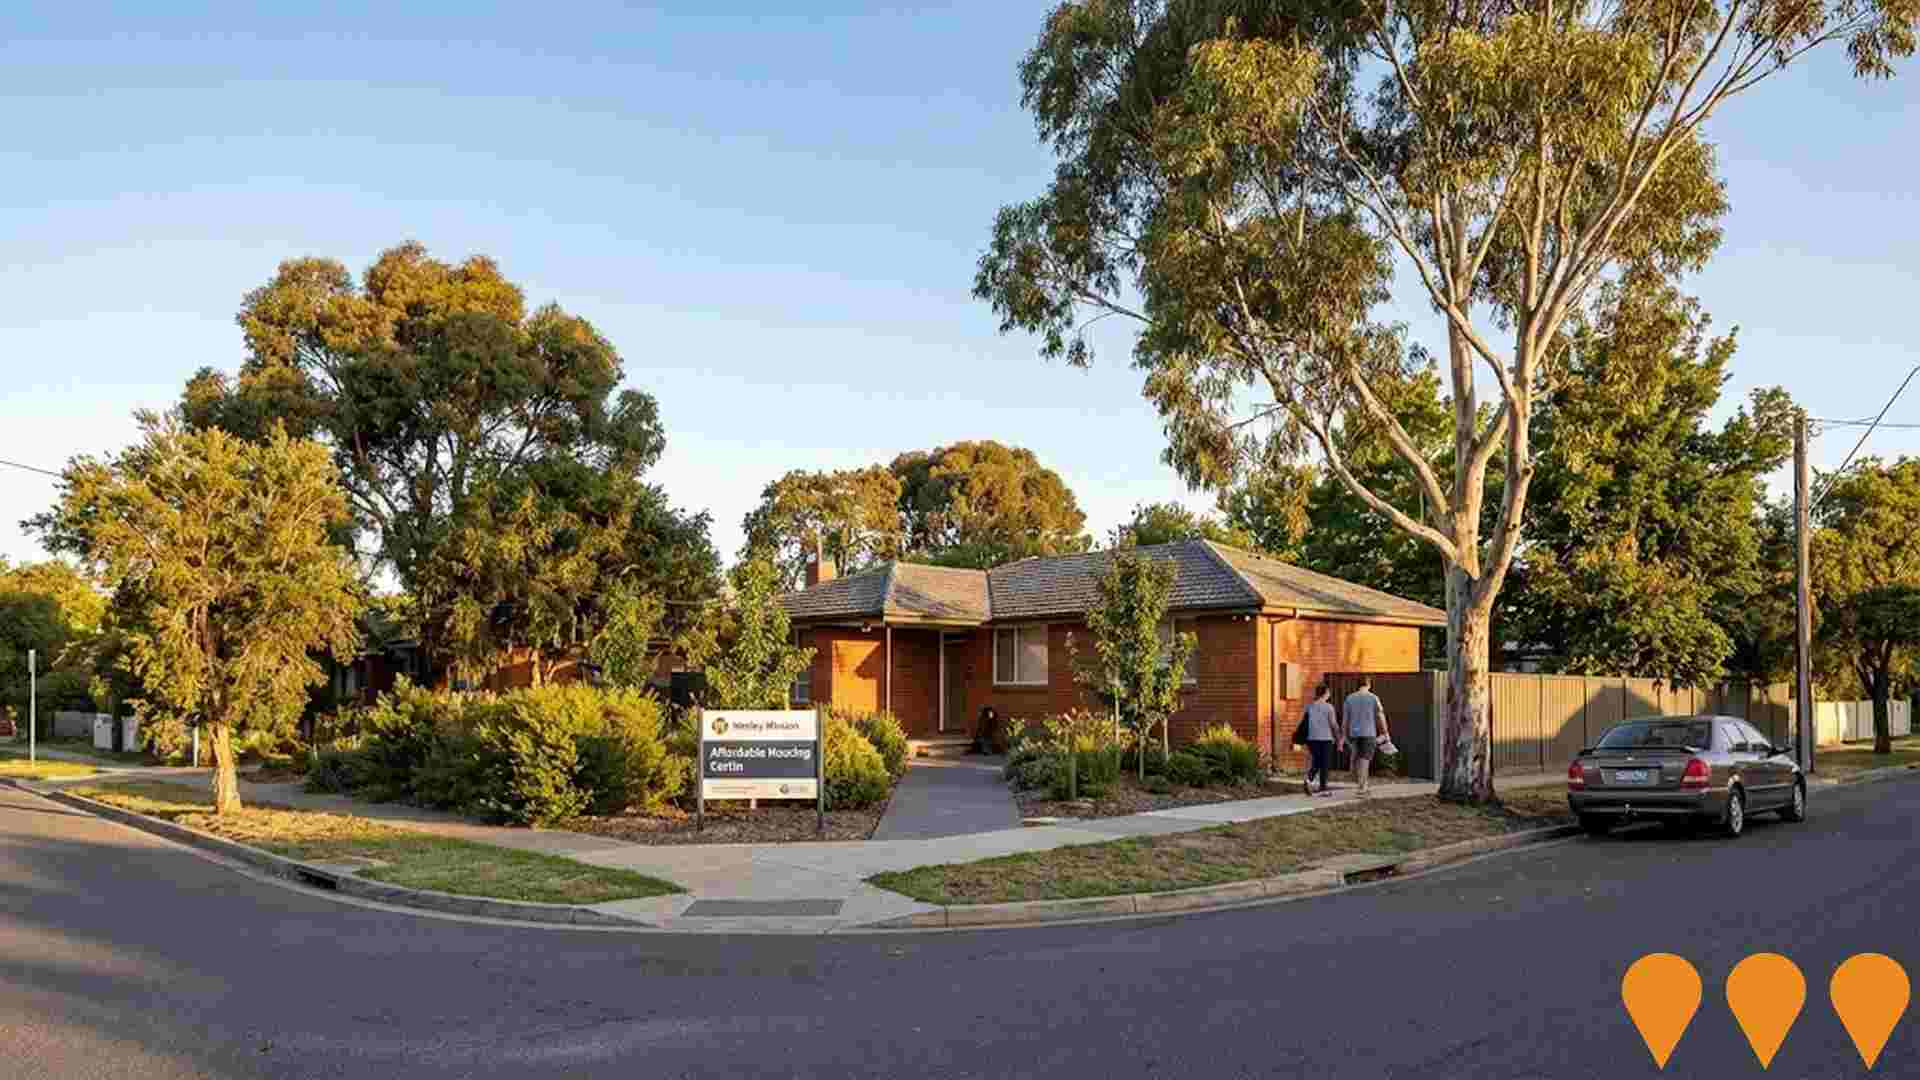
2 Schlich Street Public Housing
A public housing development of 30 units, including one, two, and three-bedroom apartments. The project will replace the former Solander Court complex and provide much-needed social housing in the area.
Employment
The labour market in Yarralumla shows considerable strength compared to most other Australian regions
Yarralumla has a highly educated workforce with professional services well represented. Its unemployment rate was 2.2% in the past year, with an estimated employment growth of 1.6%.
As of September 2025, 1,569 residents are employed and the unemployment rate is 1.3% lower than the Australian Capital Territory's (ACT) rate of 3.6%. The workforce participation rate in Yarralumla is 58.1%, compared to ACT's 69.6%. Key industries for employment among residents include public administration & safety, professional & technical services, and health care & social assistance. Professional & technical services have notable concentration with employment levels at 1.7 times the regional average.
However, public administration & safety shows lower representation at 27.0% compared to the regional average of 30.4%. Many residents commute elsewhere for work, as indicated by the count of Census working population to local population. In the 12-month period ending September 2025, employment in Yarralumla increased by 1.6%, while labour force grew by 0.9%, causing unemployment rate to fall by 0.7 percentage points. In comparison, ACT recorded employment growth of 1.4%, labour force growth of 1.2%, with unemployment falling by 0.2 percentage points. As of 25-November-25, ACT employment grew by 1.19% year-on-year, adding 710 jobs, with the state unemployment rate at 4.5%. This is compared to the national rate of 4.3%, and ACT's employment growth outpacing the national average of 0.14%. National employment forecasts from May-25 suggest employment will expand by 6.6% over five years and 13.7% over ten years. Applying these projections to Yarralumla's employment mix, local employment is estimated to increase by 7.2% over five years and 14.5% over ten years.
Frequently Asked Questions - Employment
Income
The economic profile demonstrates exceptional strength, placing the area among the top 10% nationally based on comprehensive AreaSearch income analysis
Yarralumla SA2's median income among taxpayers was $86,986 and average income stood at $132,955 in financial year 2022. This compares to the Australian Capital Territory's figures of $68,678 and $83,634 respectively. By September 2025, estimates suggest median income would be approximately $98,816 and average income around $151,037, based on a 13.6% growth in the Wage Price Index since financial year 2022. According to 2021 Census figures, household, family, and personal incomes in Yarralumla ranked highly nationally, between the 98th and 98th percentiles. Income distribution data showed that 43.3% of residents (1,375 people) earned over $4,000 per week, contrasting with regional levels where the $1,500 - 2,999 bracket led at 34.3%. This affluence was reflected in 55.6% of residents earning over $3,000 per week, supporting premium retail and service offerings. After housing costs, residents retained 89.6% of their income, indicating strong purchasing power. The area's SEIFA income ranking placed it in the 10th decile.
Frequently Asked Questions - Income
Housing
Yarralumla displays a diverse mix of dwelling types, with above-average rates of outright home ownership
Yarralumla's dwelling structures, as per the latest Census, consisted of 65.2% houses and 34.9% other dwellings (semi-detached, apartments, 'other' dwellings). This contrasts with the Australian Capital Territory's structure of 40.7% houses and 59.3% other dwellings. Home ownership in Yarralumla stood at 49.2%, with mortgaged dwellings at 27.8% and rented ones at 23.0%. The median monthly mortgage repayment was $3,425, exceeding the Australian Capital Territory average of $2,275. The median weekly rent in Yarralumla was $547, compared to the Australian Capital Territory's $500. Nationally, Yarralumla's mortgage repayments were significantly higher than the Australian average of $1,863, and rents were substantially above the national figure of $375.
Frequently Asked Questions - Housing
Household Composition
Yarralumla has a typical household mix, with a higher-than-average median household size
Family households constitute 71.5% of all households, including 29.7% couples with children, 34.9% couples without children, and 5.9% single parent families. Non-family households comprise the remaining 28.5%, with lone person households at 26.4% and group households at 2.6%. The median household size is 2.4 people, which is larger than the Australian Capital Territory average of 2.2.
Frequently Asked Questions - Households
Local Schools & Education
Yarralumla shows strong educational performance, ranking in the upper quartile nationally when assessed across multiple qualification and achievement indicators
Yarralumla's educational attainment is notably higher than national and regional averages. Among residents aged 15 and above, 62.4% have university qualifications, compared to 30.4% nationally and 46.8% in the SA4 region. Bachelor degrees are the most common at 33.1%, followed by postgraduate qualifications (22.9%) and graduate diplomas (6.4%). Vocational pathways account for 15.9% of qualifications, with advanced diplomas at 9.4% and certificates at 6.5%.
Educational participation is high, with 28.5% of residents currently enrolled in formal education. This includes 8.7% in primary education, 8.3% in secondary education, and 7.4% pursuing tertiary education.
Frequently Asked Questions - Education
Schools Detail
Nearby Services & Amenities
Transport
Transport servicing is good compared to other areas nationally based on assessment of service frequency, route connectivity and accessibility
Transport analysis shows 20 active stops operating in Yarralumla, served by buses. These stops are covered by 10 routes, offering 1,987 weekly passenger trips combined. Transport access is rated good, with residents on average 215 meters from the nearest stop.
Services run an average of 283 trips per day across all routes, equating to about 99 weekly trips per individual stop.
Frequently Asked Questions - Transport
Transport Stops Detail
Health
Yarralumla's residents are healthier than average in comparison to broader Australia with prevalence of common health conditions quite low across both younger and older age cohorts
Health data shows relatively positive outcomes for Yarralumla residents. The prevalence of common health conditions is quite low across both younger and older age cohorts. Private health cover rate is exceptionally high at approximately 82% of the total population (2,614 people), compared to 78.0% across Australian Capital Territory and 55.3% nationally.
The most common medical conditions are arthritis and asthma, impacting 8.8% and 8.4% of residents respectively. 67.0% of residents declare themselves completely clear of medical ailments, compared to 69.8% across Australian Capital Territory. The area has 29.9% of residents aged 65 and over (949 people), higher than the 19.9% in Australian Capital Territory. Health outcomes among seniors are particularly strong, performing even better than the general population in health metrics.
Frequently Asked Questions - Health
Cultural Diversity
The level of cultural diversity witnessed in Yarralumla was found to be above average when compared nationally for a number of language and cultural background related metrics
Yarralumla's population, as of a certain date, showed higher cultural diversity than most local markets: 17.6% spoke languages other than English at home, and 29.5% were born overseas. Christianity was the predominant religion in Yarralumla, comprising 47.2%. Notably, Judaism's representation stood at 0.6%, comparable to the Australian Capital Territory average.
Regarding ancestry, the top three groups were English (25.8%), Australian (20.6%), and Irish (11.5%). Some ethnic groups had notable differences in representation: Welsh (0.9% vs regional 0.7%), Croatian (1.1% vs 0.9%), and South African (0.8% vs 0.3%).
Frequently Asked Questions - Diversity
Age
Yarralumla ranks among the oldest 10% of areas nationwide
Yarralumla's median age is 50 years, significantly higher than the Australian Capital Territory average of 35 years and Australia's average of 38 years. The age profile shows that those aged 75-84 are particularly prominent, making up 12.8% of the population, compared to 6.0% nationally. This is a significant increase from 8.6% in 2021. Conversely, the 25-34 age group makes up only 5.6%, smaller than the Australian Capital Territory average. The 15-24 cohort has increased from 10.4% to 12.0% since 2021, while the 65-74 cohort has declined from 17.0% to 13.6%. By 2041, population forecasts indicate significant demographic changes for Yarralumla. The 85+ age group is projected to grow by 96%, adding 105 residents to reach 215. Senior residents aged 65 and above will drive 54% of the population growth, reflecting demographic aging trends. Conversely, population declines are projected for those aged 25-34 and 5-14 years old.
