Chart Color Schemes
This analysis uses ABS Statistical Areas Level 2 (SA2) boundaries, which can materially differ from Suburbs and Localities (SAL) even when sharing similar names.
SA2 boundaries are defined by the Australian Bureau of Statistics and are designed to represent communities for statistical reporting (e.g., census and ERP).
Suburbs and Localities (SAL) represent commonly-used suburb/locality names (postal-style areas) and may use different geographic boundaries. For comprehensive analysis, consider reviewing both boundary types if available.
est. as @ -- *
ABS ERP | -- people | --
2021 Census | -- people
Sales Activity
Curious about local property values? Filter the chart to assess the volume and appreciation (including resales) trends and regional comparisons, or scroll to the map below view this information at an individual property level.
Find a Recent Sale
Sales Detail
Population
Beverley lies within the top quartile of areas nationally for population growth performance according to AreaSearch analysis of recent, and medium to long-term trends
Beverley's population was around 9,697 as of November 2025. This reflected an increase of 800 people since the 2021 Census, which reported a population of 8,897. The change was inferred from ABS estimates of 9,652 in June 2024 and additional validated new addresses since the Census date. Beverley's population density was 2,303 persons per square kilometer as of November 2025, above national averages assessed by AreaSearch. Between 2021 and 2025, Beverley's population grew by 9%, exceeding the state average of 7.1%. Overseas migration contributed approximately 55.6% of overall population gains during this period.
All drivers of growth, including natural growth and interstate migration, were positive factors. AreaSearch adopted ABS/Geoscience Australia projections for each SA2 area released in 2024 with a base year of 2022. For areas not covered by this data and years post-2032, the SA State Government's Regional/LGA projections based on 2021 data were adopted with adjustments made using weighted aggregation methods. Based on projected demographic shifts, Beverley is expected to grow by 2,150 persons to reach a total population of 11,847 by 2041, reflecting an increase of 21.7% over the 17-year period.
Frequently Asked Questions - Population
Development
AreaSearch assessment of residential development activity positions Beverley among the top 25% of areas assessed nationwide
Beverley has recorded approximately 94 residential properties granted approval annually. Over the past five financial years, from FY-21 to FY-25, a total of 471 homes were approved, with an additional 78 approved so far in FY-26. This results in an average of 2.4 new residents per year for each dwelling over these five financial years, reflecting strong demand that supports property values.
The average construction cost value of new homes being built is $210,000, which is below regional norms, indicating more affordable housing options for purchasers. In FY-26 alone, there have been $328.0 million in commercial approvals, demonstrating robust commercial development momentum. Compared to Greater Adelaide, Beverley shows moderately higher development activity, with 22.0% above the regional average per person over the five-year period. This maintains good buyer choice while supporting existing property values.
New development consists of 56.0% standalone homes and 44.0% attached dwellings, featuring an increasing blend of attached housing types offering choices across price ranges from spacious family homes to more compact options. This represents a notable shift from the area's existing housing composition, which is currently 75.0% houses, indicating decreasing availability of developable sites and reflecting changing lifestyles and demand for diverse, affordable housing options. With around 101 people per approval, Beverley reflects a developing area. Population forecasts indicate Beverley will gain approximately 2,105 residents by 2041, based on the latest AreaSearch quarterly estimate. At current development rates, new housing supply should comfortably meet demand, providing good conditions for buyers and potentially supporting population growth beyond current projections.
Frequently Asked Questions - Development
Infrastructure
Beverley has limited levels of nearby infrastructure activity, ranking in the 12thth percentile nationally
Changes to local infrastructure significantly influence an area's performance. AreaSearch has identified 28 projects likely impacting the area. Notable projects include Findon Road Upgrade, Findon Railway Station Upgrade, St Clair Precinct Community Facility, and Woodville Village Masterplan. Below is a list detailing those most relevant.
Professional plan users can use the search below to filter and access additional projects.
INFRASTRUCTURE SEARCH
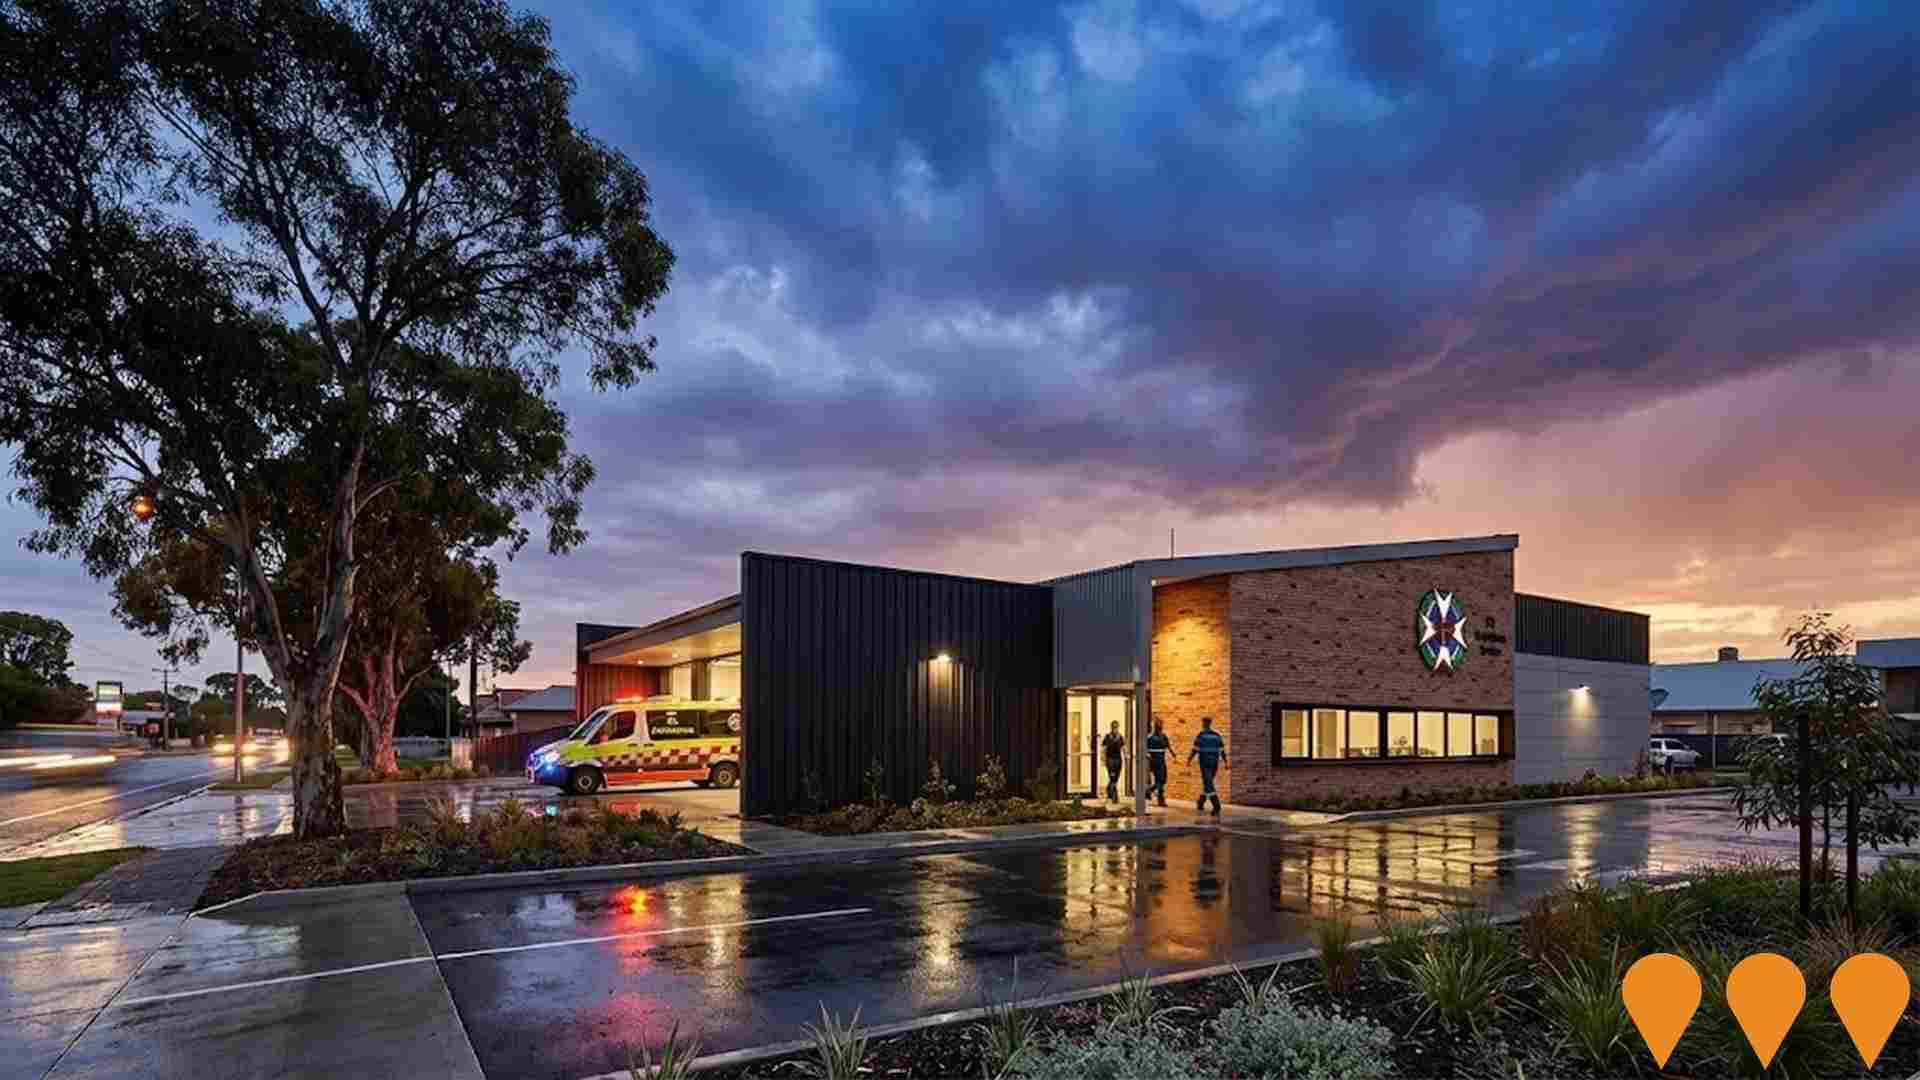
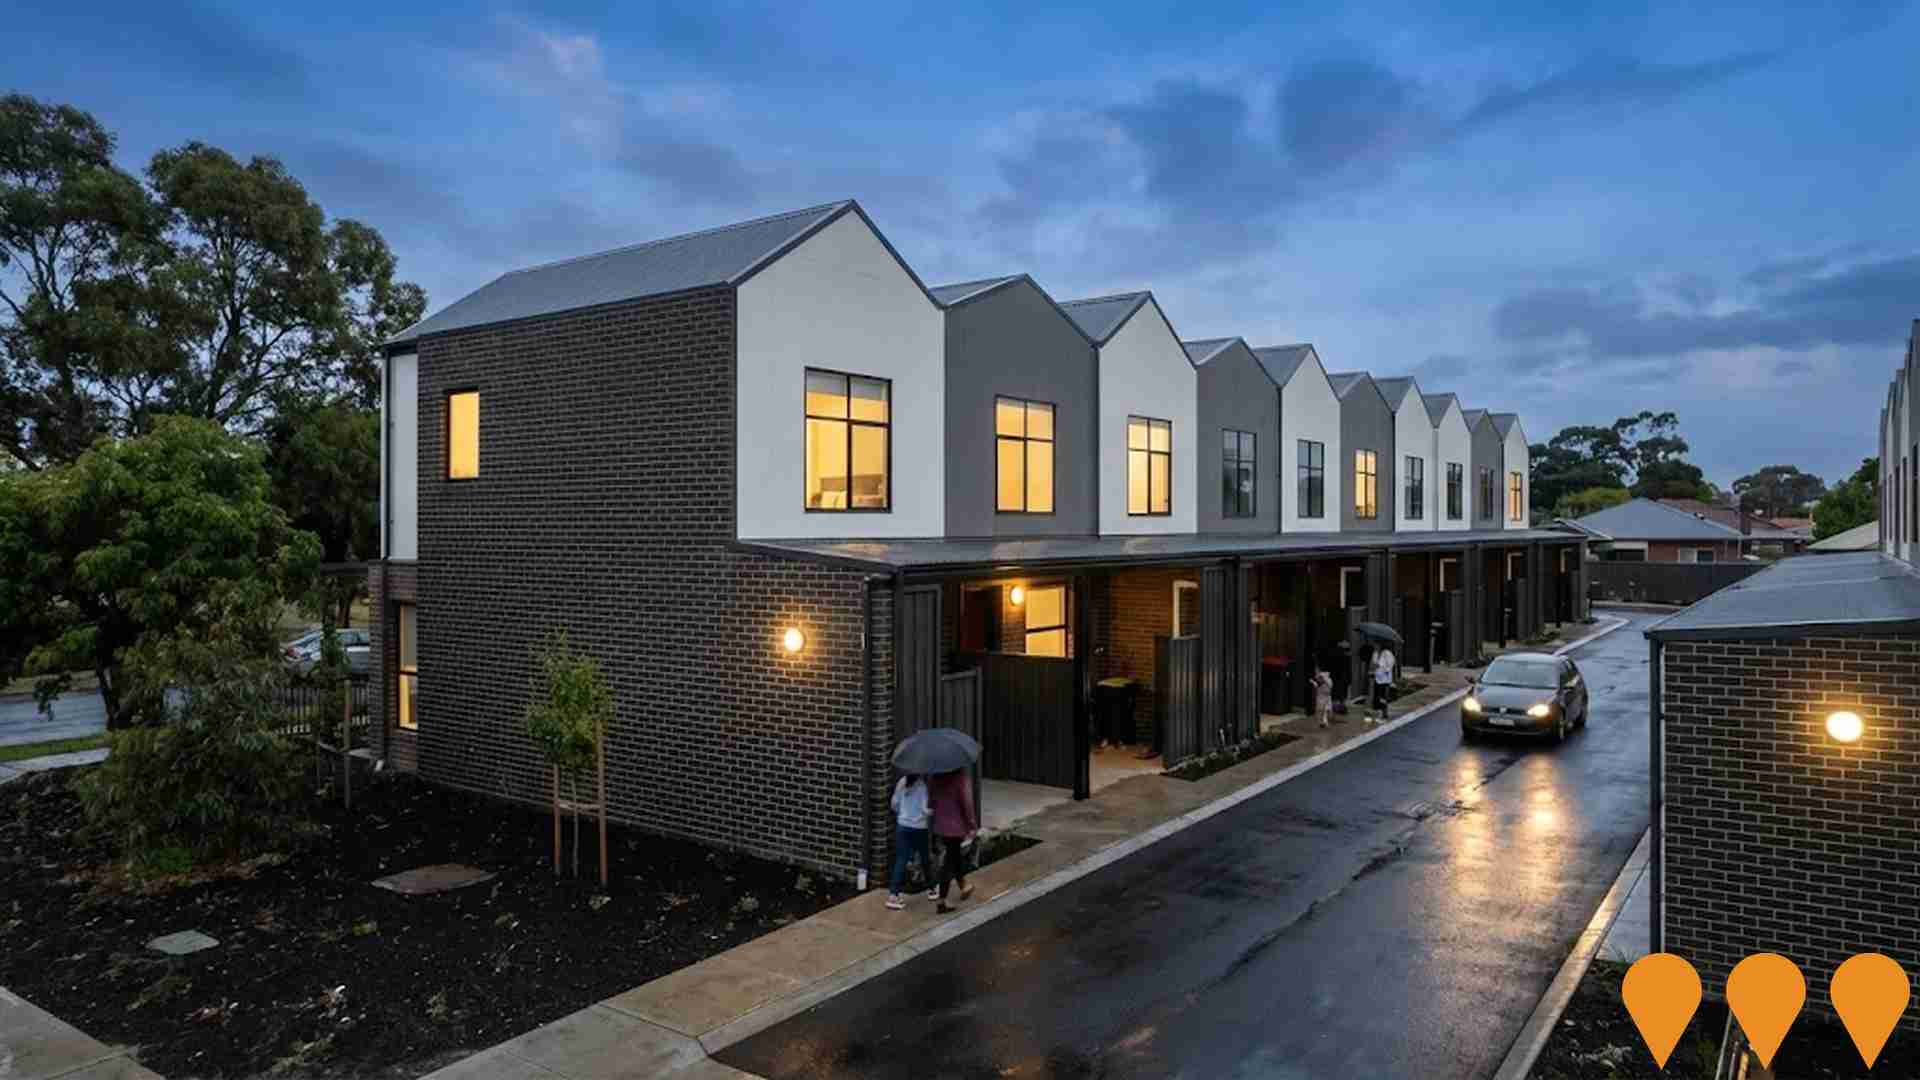
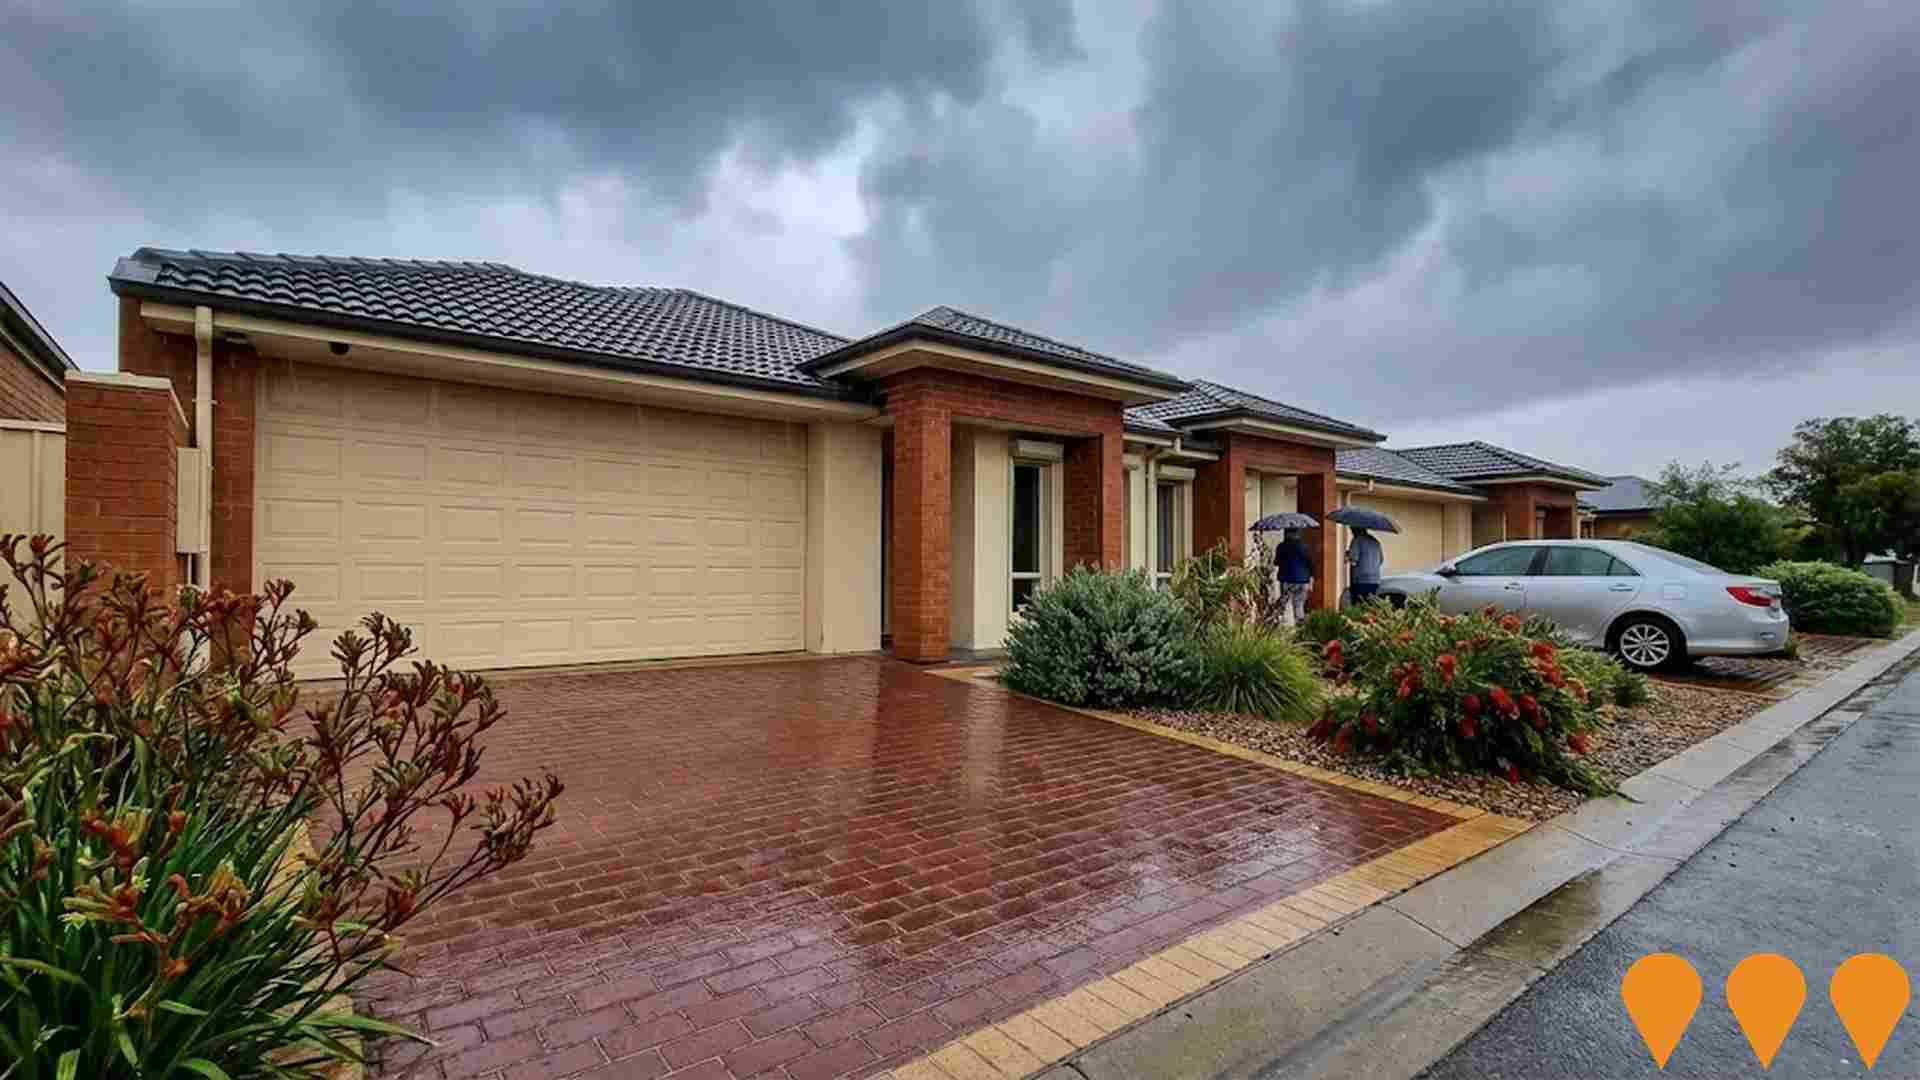
 Denotes AI-based impression for illustrative purposes only, not to be taken as definitive under any circumstances. Please follow links and conduct other investigations from the project's source for actual imagery. Developers and project owners wishing us to use original imagery please Contact Us and we will do so.
Frequently Asked Questions - Infrastructure
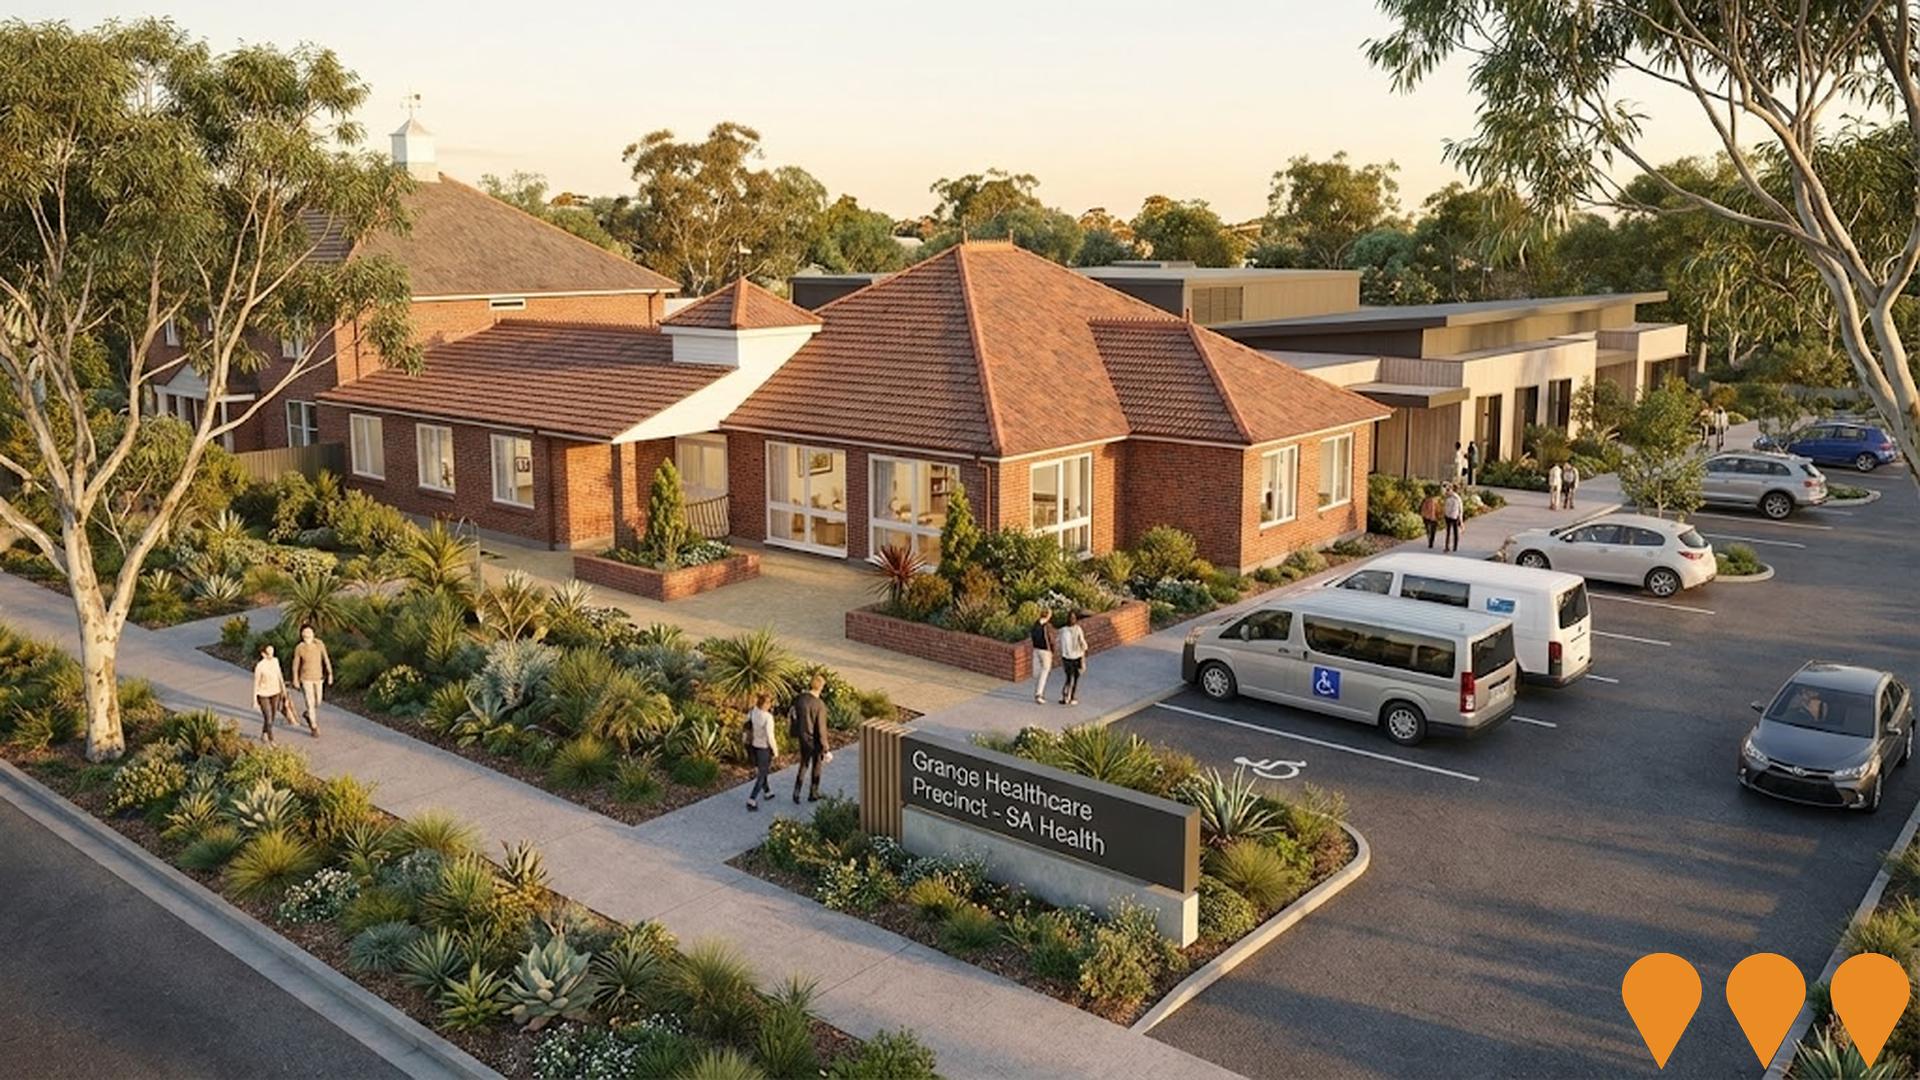
Grange Healthcare Precinct
Proposed SA Health healthcare precinct in the Grange Findon corridor in western Adelaide, expanding aged care, community mental health and primary health services for older residents and the local community. The project remains in the proposal and planning phase with an indicative completion target around 2027.
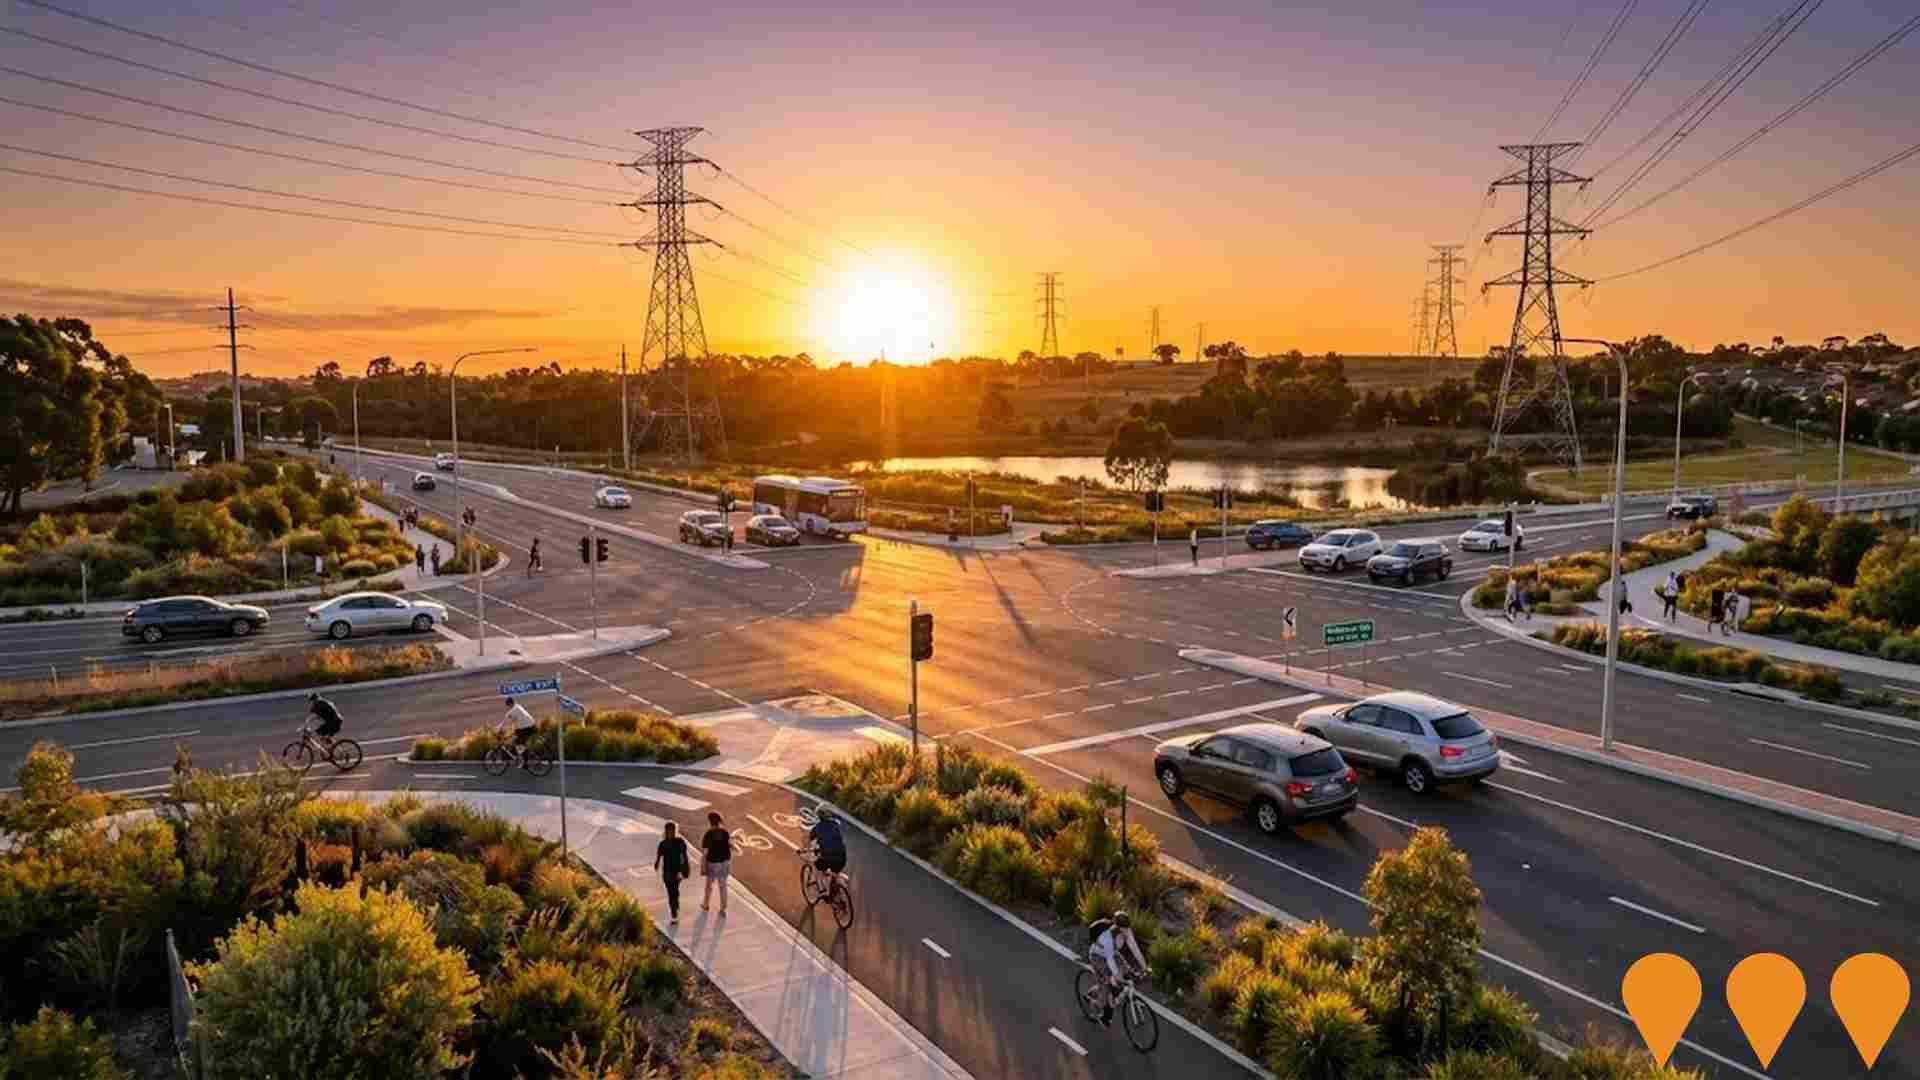
Findon Road Upgrade
Major road infrastructure upgrade including intersection improvements, cycling infrastructure, and public transport enhancements along Findon Road corridor.
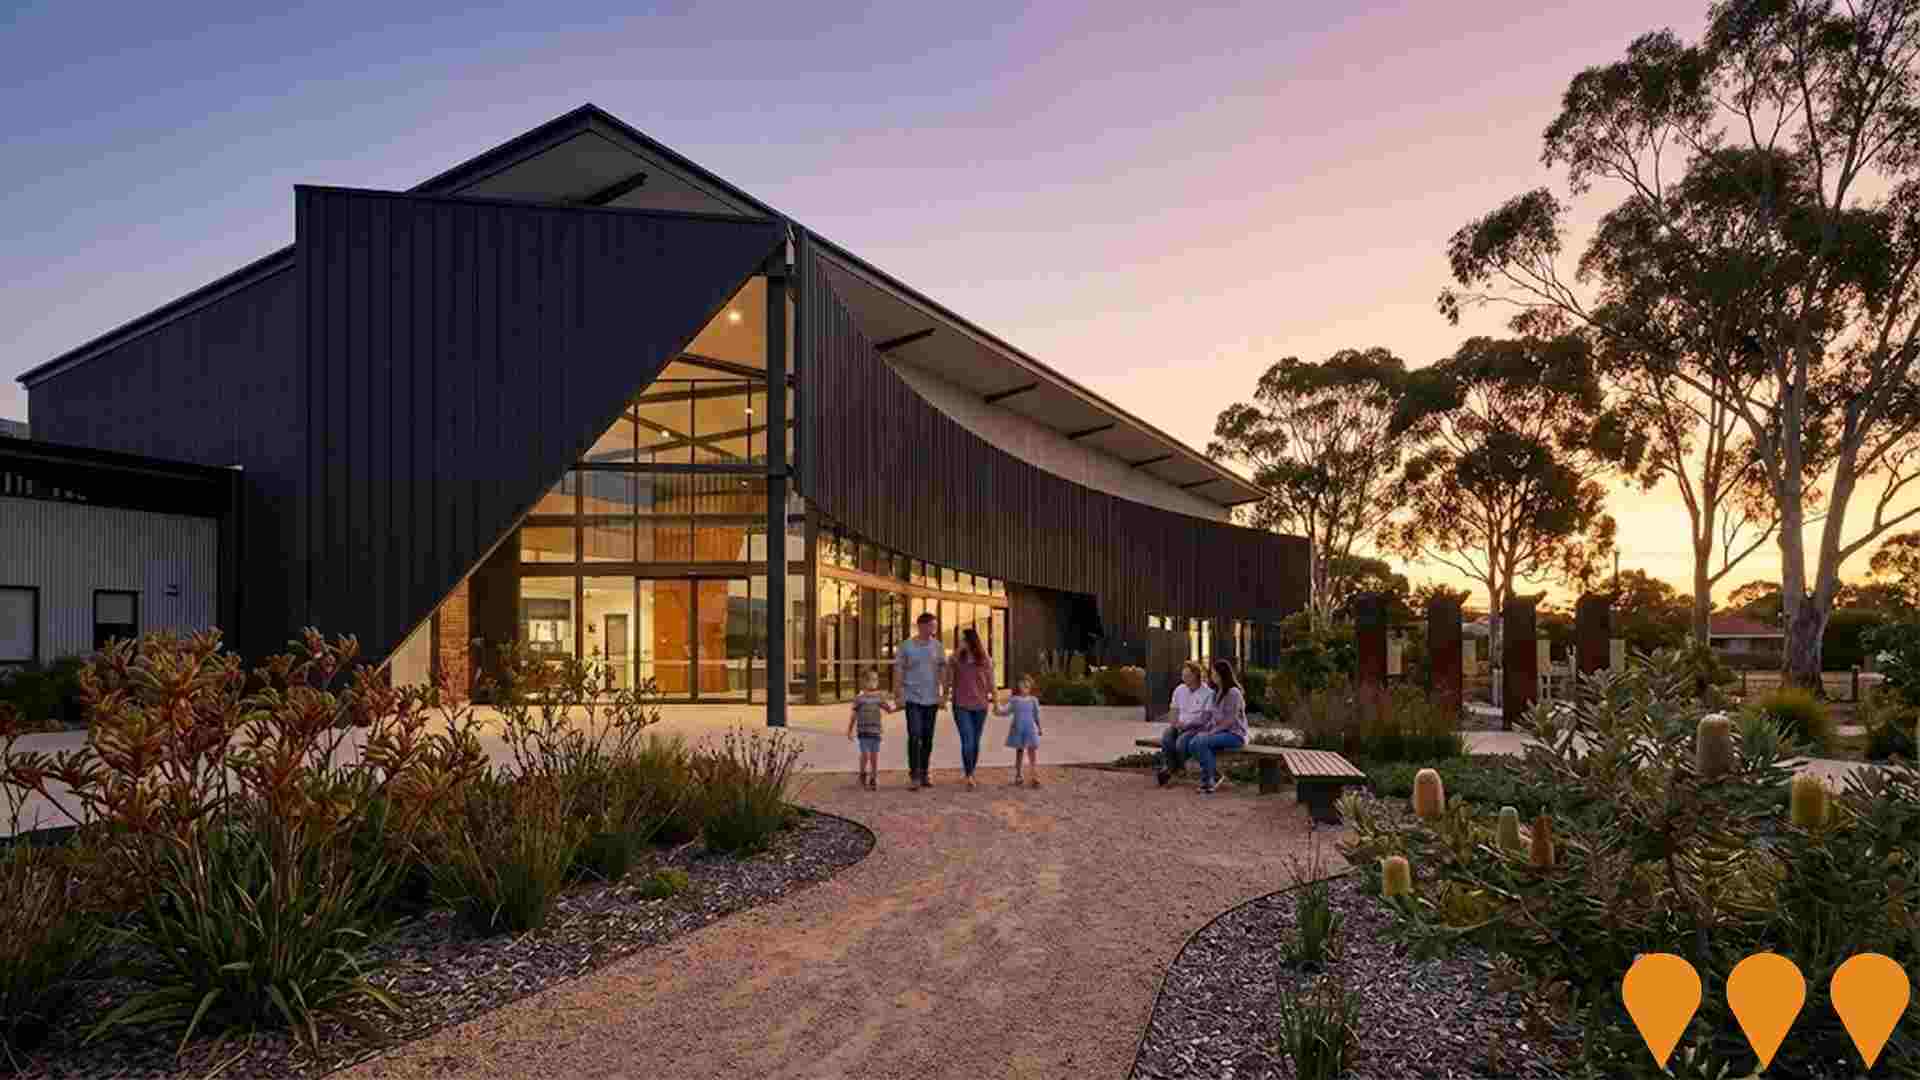
St Clair Precinct Community Facility
State Government pledged funding to upgrade the St Clair oval precinct including a new community facility at Oval 2. Following 2024 consultation, Council deferred construction and will prepare a precinct-wide master plan to resolve design, access, parking and cricket nets issues. The facility remains on hold pending outcomes of the master plan.
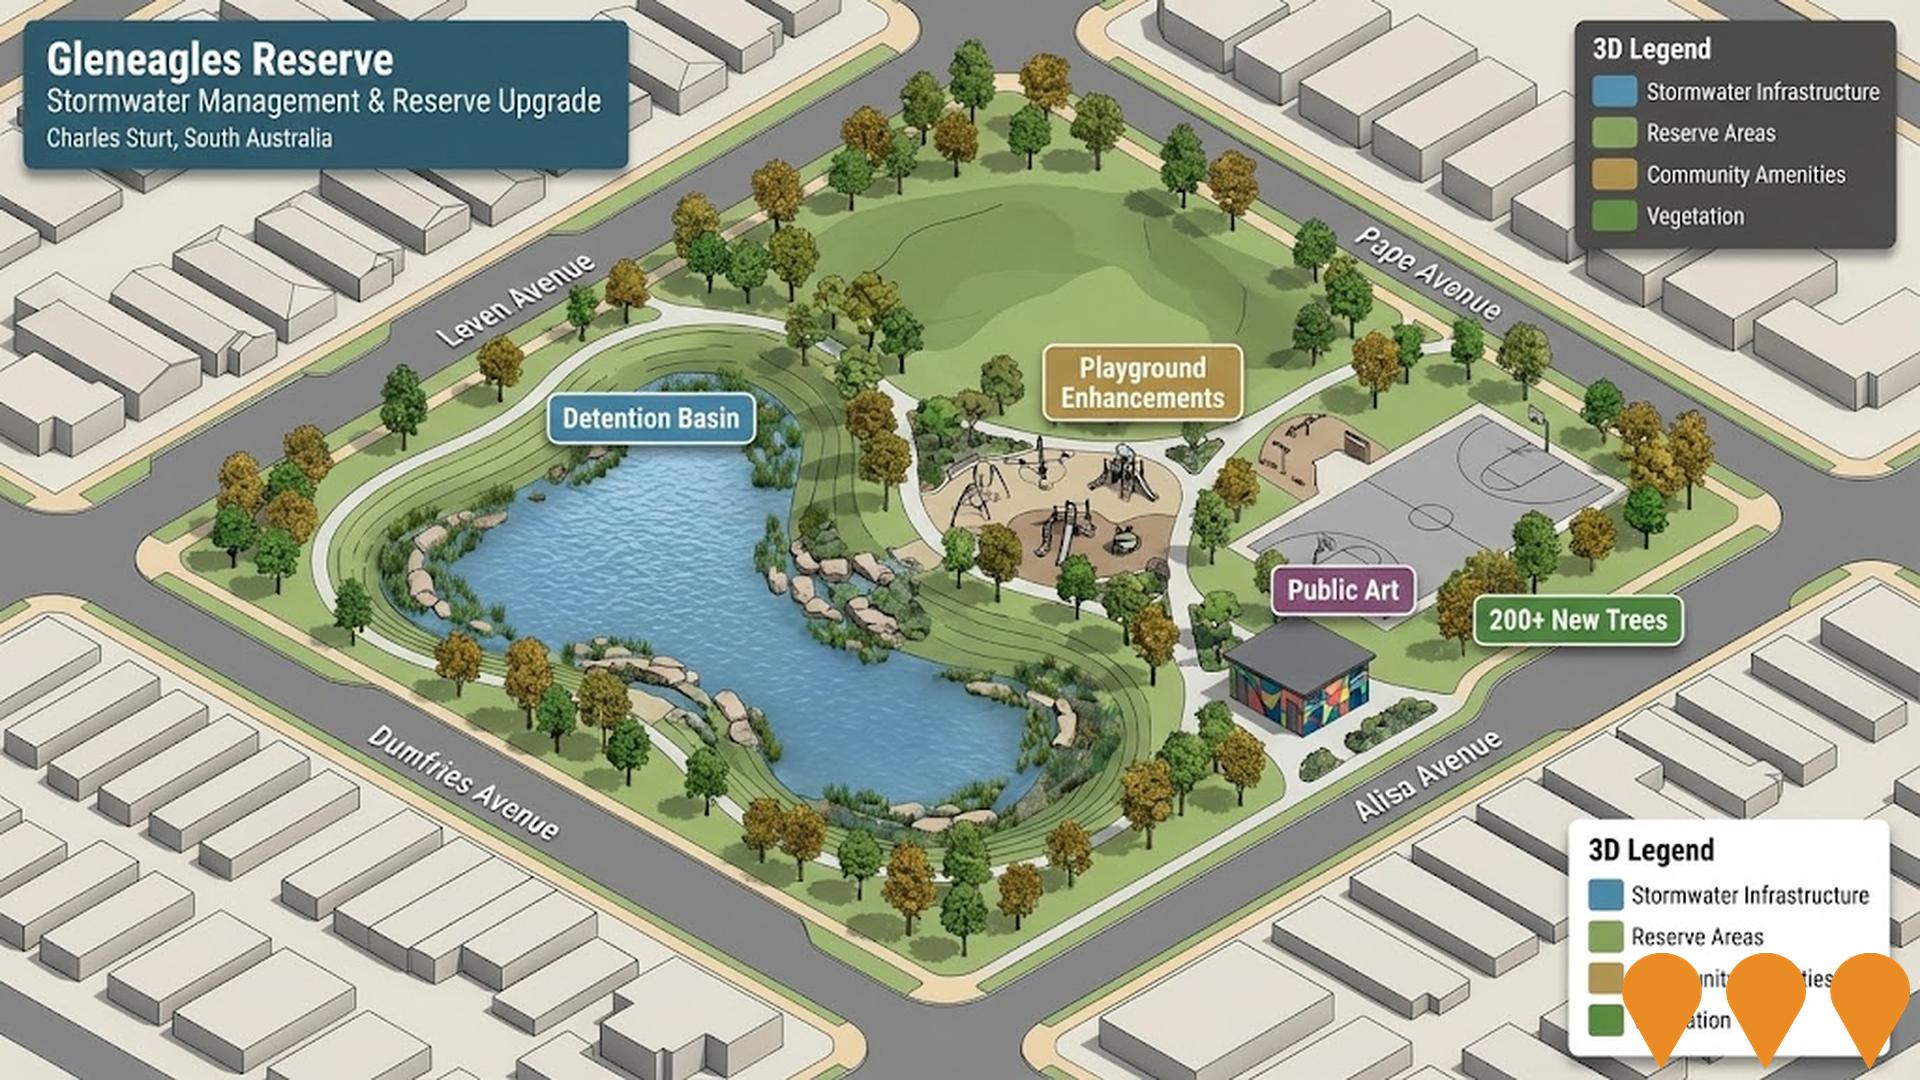
Gleneagles Reserve Stormwater Management & Reserve Upgrade
Multi-stage stormwater detention basin project to manage flooding in the Meakin Terrace sub-catchment, reducing flood risk for surrounding streets including Leven Avenue, Tapleys Hill Road, Wilford and Prior Avenues. The stormwater infrastructure is now complete with over 200 trees planted. Stage 2 reserve upgrades will commence October 2025, featuring enhanced community amenities, public toilet artwork by artist Cat Dean, and improvements reflecting community feedback priorities including playground enhancements and expanded recreational facilities.
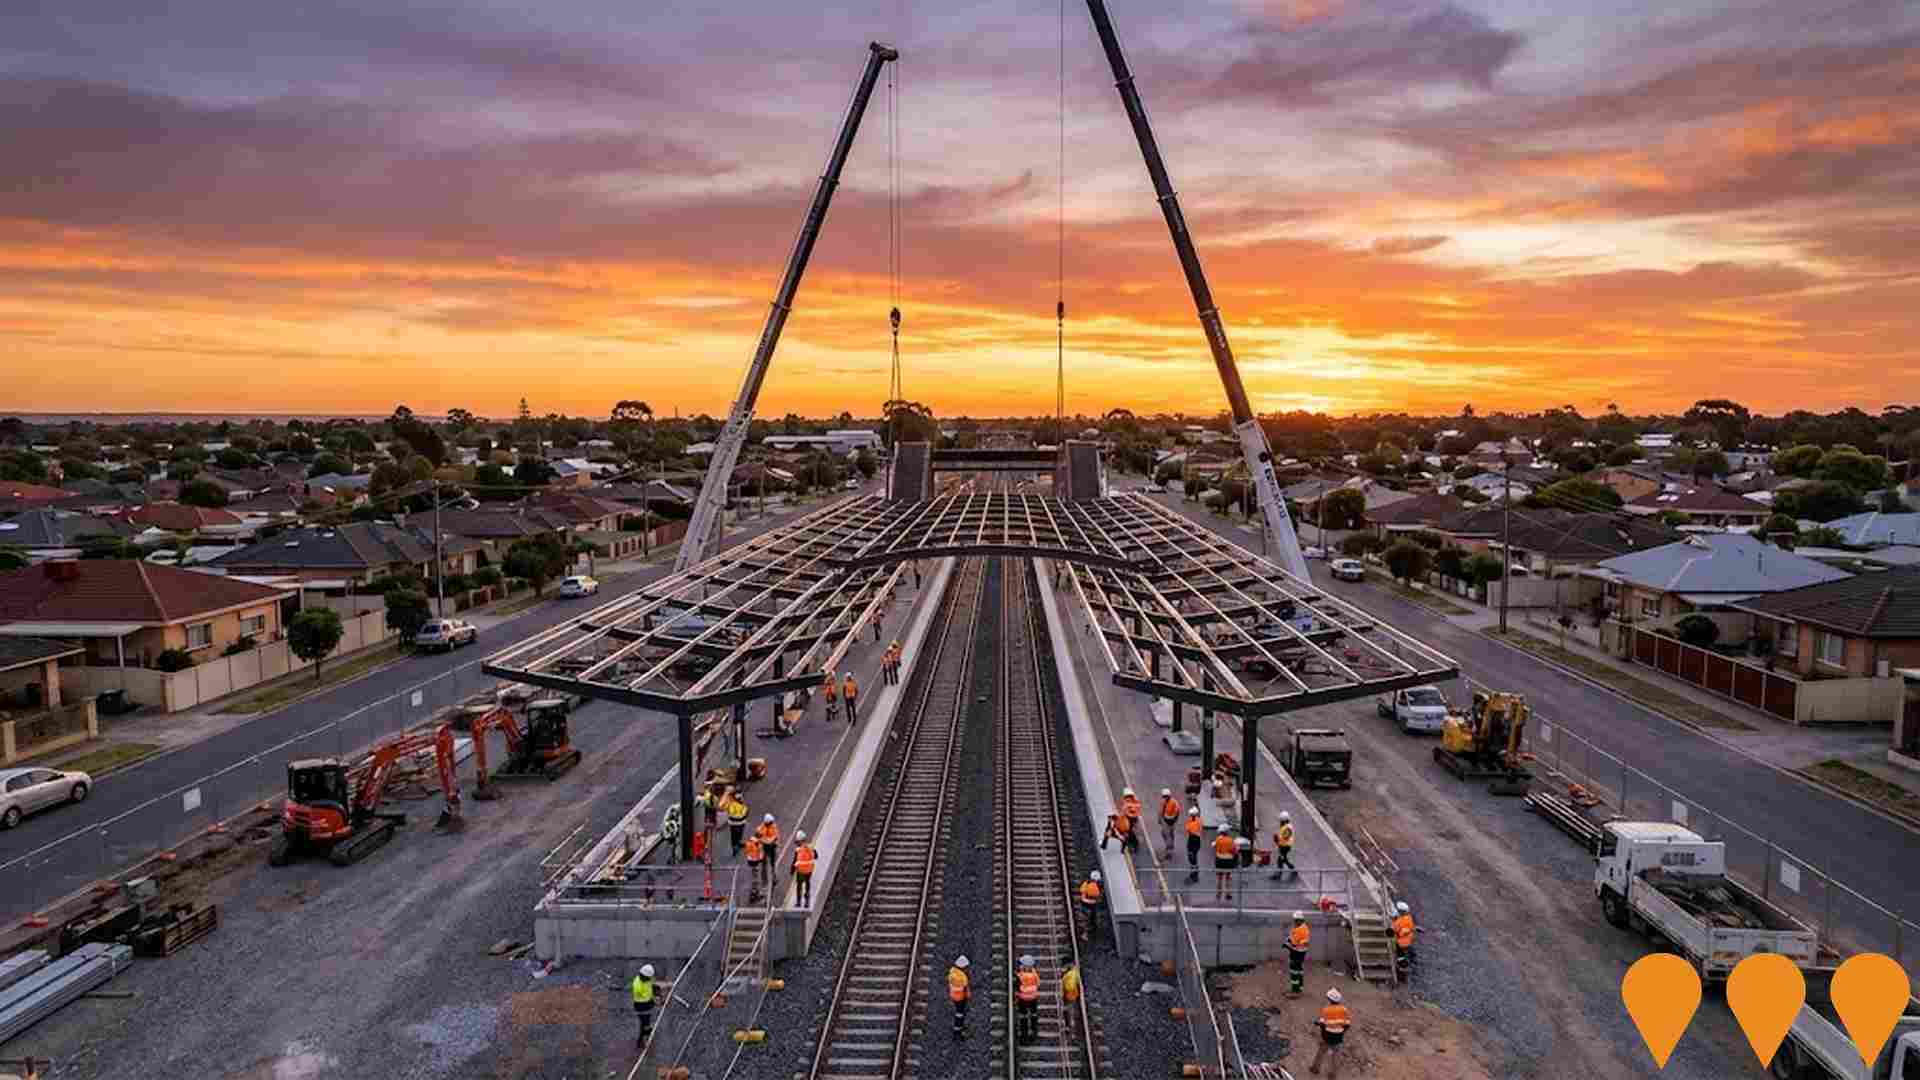
Findon Railway Station Upgrade
Railway station modernization including platform extensions, accessibility improvements, and integration with Gawler line electrification project.
St Clair Village - Stage 6 & 7
Final residential and mixed-use stages of the St Clair masterplanned community, located on the vacant allotment north of the St Clair Village Shopping Centre. A Code Amendment was lodged in May 2025 by landowner ISPT to rezone the site to a 'Suburban Activity Centre' and increase maximum building heights to 7 storeys to support higher-density living.
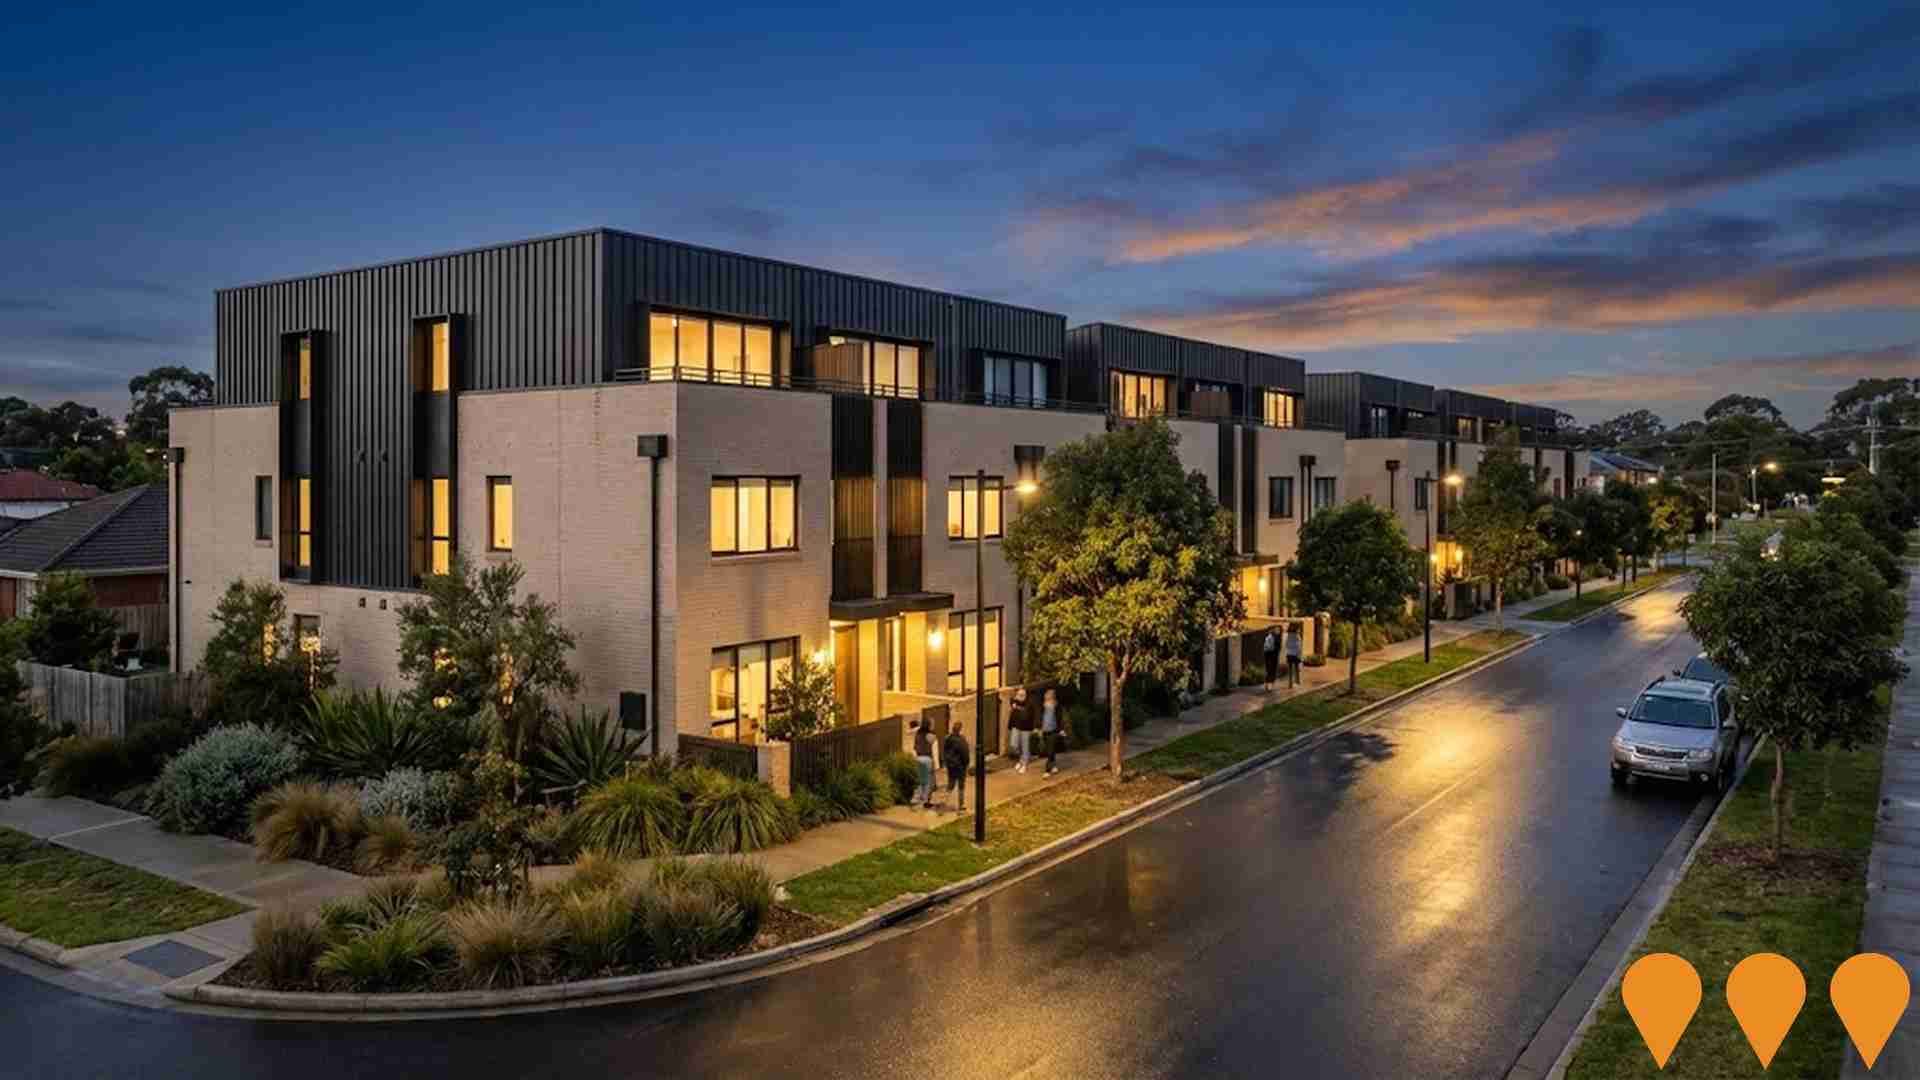
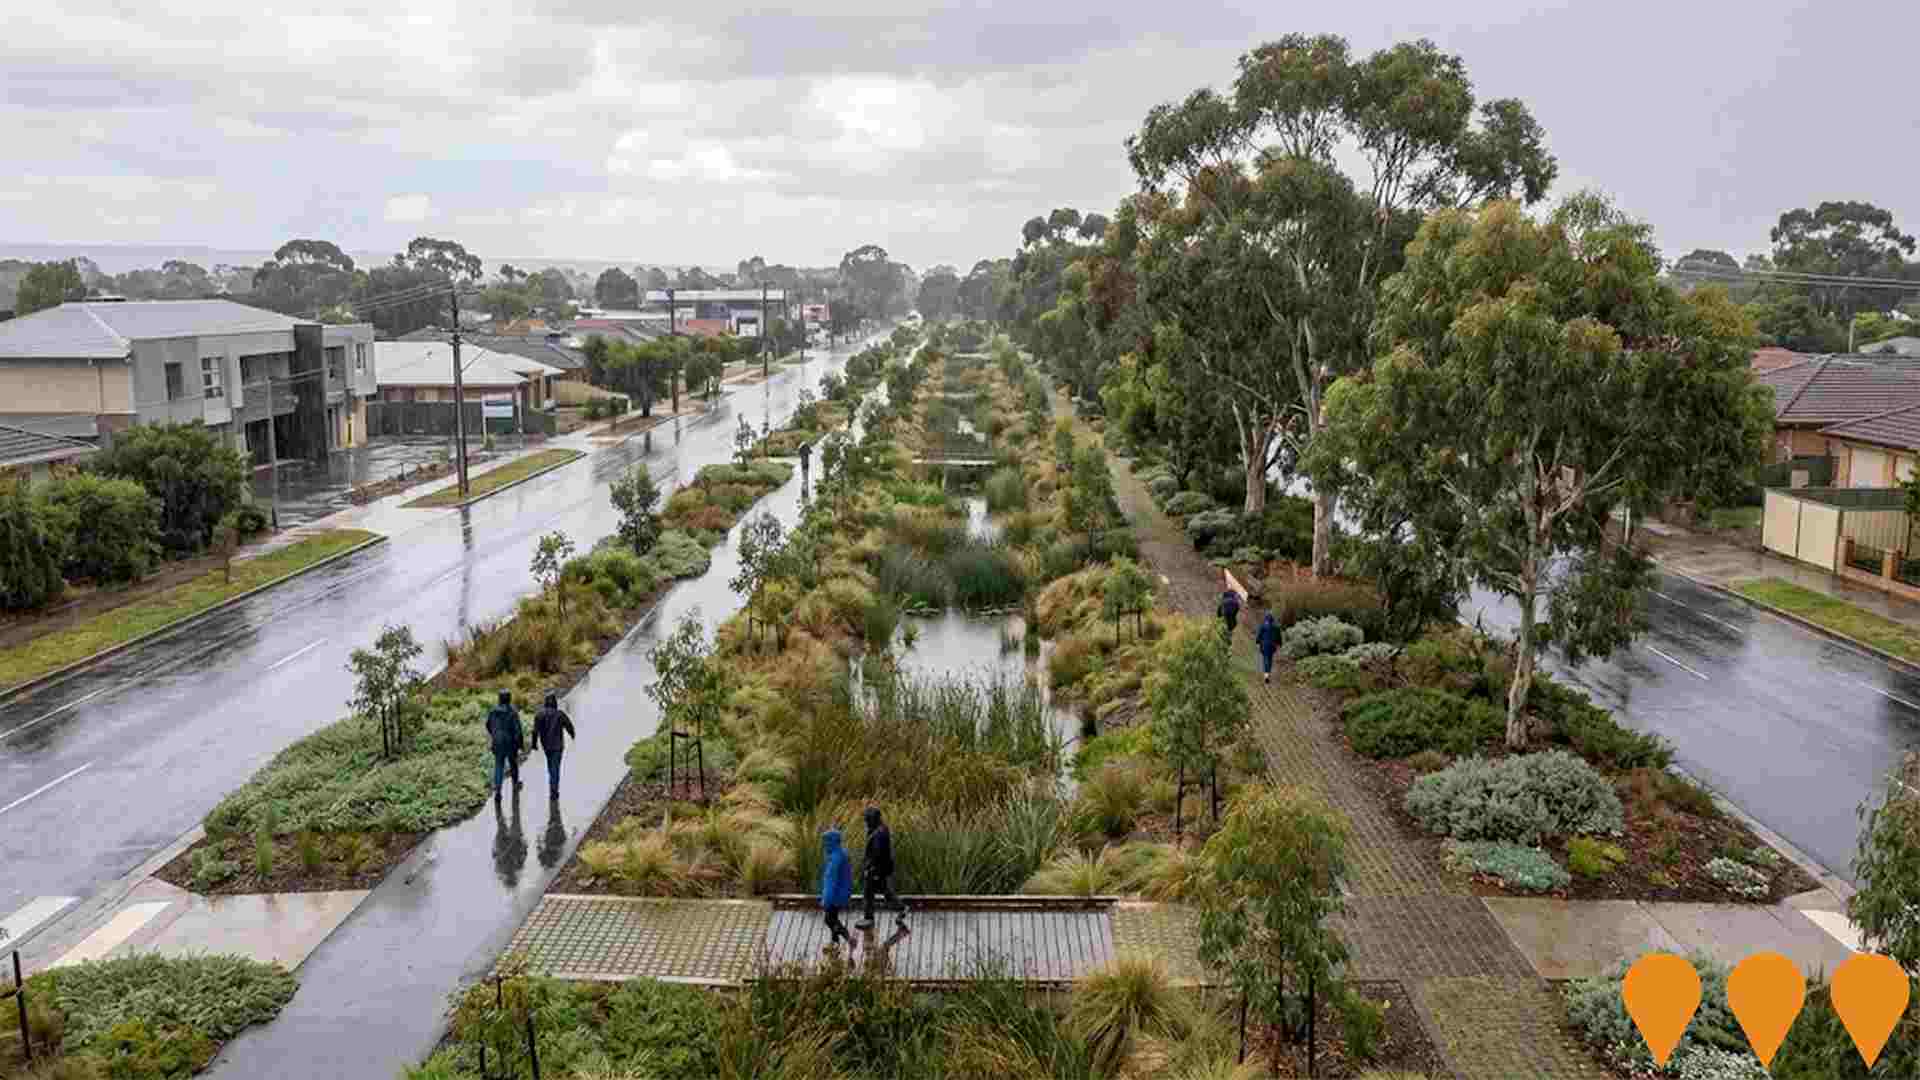
Findon Green Corridor
Environmental restoration and green infrastructure project creating connected parklands, stormwater management, and biodiversity corridors.
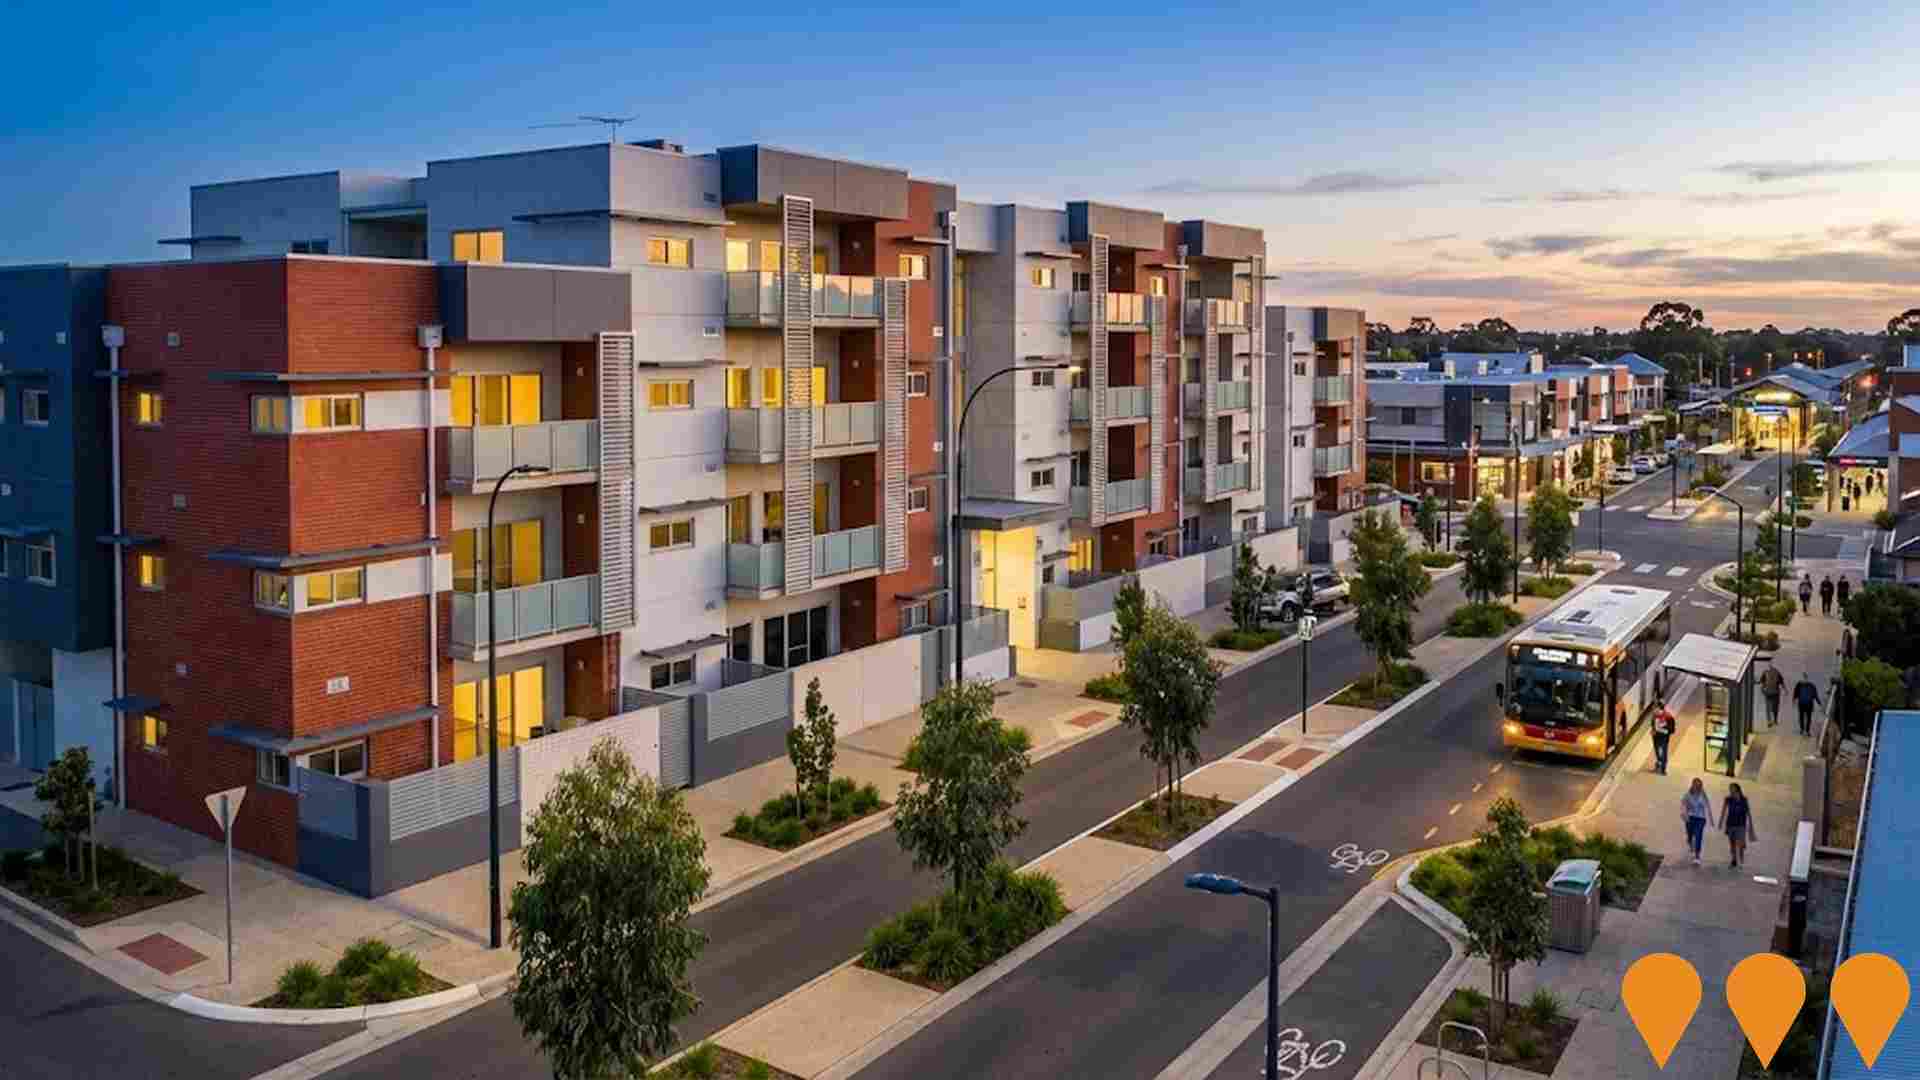
Woodville Village Masterplan
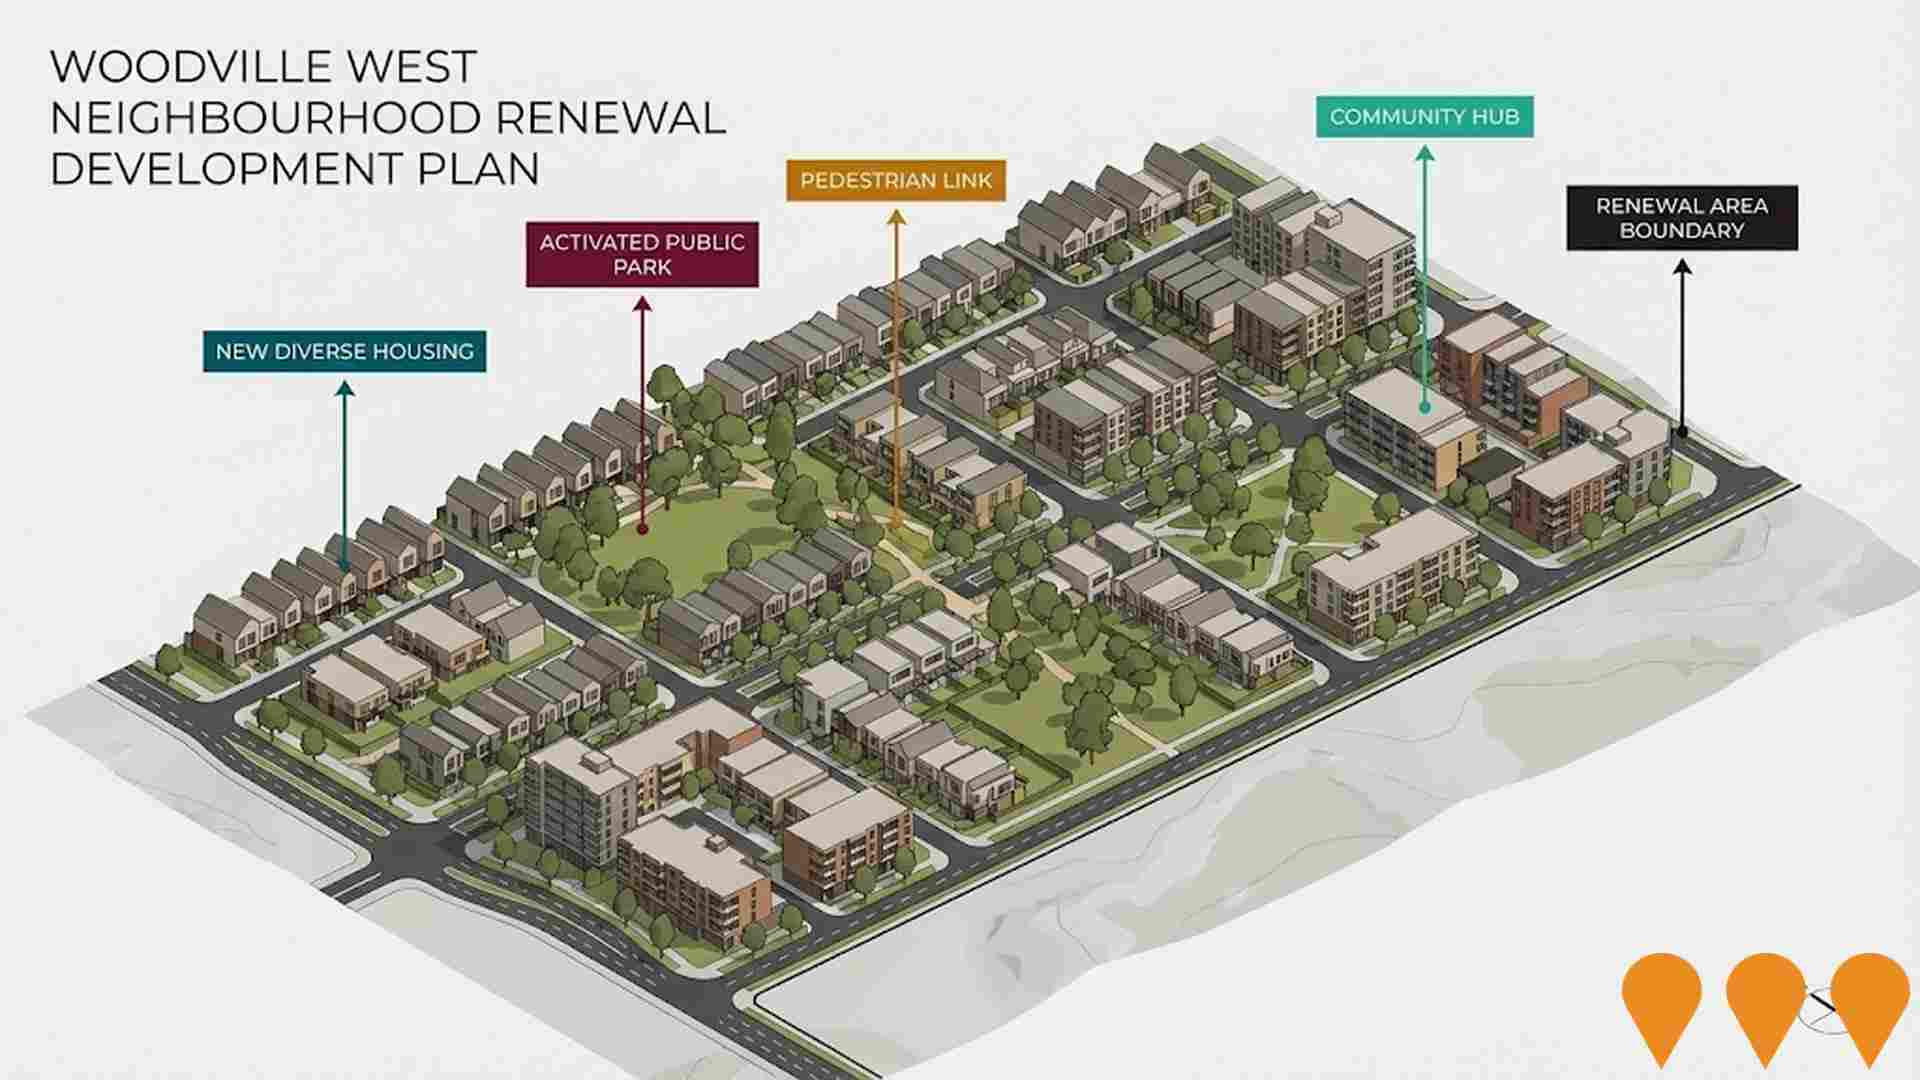
A long-term strategic and visionary direction for the Woodville Village precinct, identified as a significant Transit Oriented Development (TOD). The masterplan outlines future redevelopment, including increased densities, mixed-use development, streetscape improvements, and public art.
Employment
The labour market in Beverley shows considerable strength compared to most other Australian regions
Beverley's workforce is well-educated with significant representation in essential services. The unemployment rate was 3.3% as of September 2025, lower than Greater Adelaide's 3.9%.
Employment growth over the past year was estimated at 4.8%. As of September 2025, 5,768 residents were employed with an unemployment rate of 0.6% below Greater Adelaide's and workforce participation at 68.7%, higher than Greater Adelaide's 61.7%. Dominant employment sectors include health care & social assistance, retail trade, and construction. Beverley specializes in transport, postal & warehousing with an employment share 1.2 times the regional level but has lower representation in education & training at 8.0% versus the regional average of 9.3%.
The worker-to-resident ratio was 0.7 as of the Census, indicating above-normal local employment opportunities. Between September 2024 and September 2025, employment increased by 4.8%, labour force by 4.2%, reducing the unemployment rate by 0.6 percentage points. In comparison, Greater Adelaide recorded employment growth of 3.0% with a 0.1 percentage point decrease in unemployment. State-level data to 25-Nov-25 showed SA employment grew by 1.19% year-on-year, with the state unemployment rate at 4.0%, outperforming the national average of 4.3%. Jobs and Skills Australia's forecasts from May-25 project national employment growth of 6.6% over five years and 13.7% over ten years. Applying these projections to Beverley's employment mix suggests local employment should increase by 6.6% over five years and 13.8% over ten years, assuming constant population projections for illustrative purposes.
Frequently Asked Questions - Employment
Income
The economic profile demonstrates above-average performance, with income metrics exceeding national benchmarks based on AreaSearch comparative assessment
AreaSearch's latest postcode level ATO data for financial year 2022 shows that Beverley SA2 had a median income of $55,587 and an average income of $62,926. These figures are below the national averages of $52,592 (median) and $64,886 (average) for Greater Adelaide. Based on Wage Price Index growth of 12.83% since financial year 2022, current estimates suggest median income would be approximately $62,719 and average income would be around $70,999 by September 2025. The 2021 Census reveals that Beverley's household, family, and personal incomes cluster around the 52nd percentile nationally. Income brackets indicate that 35.4% of residents (3,432 people) fall into the $1,500 - $2,999 bracket, which is consistent with broader metropolitan trends at 31.8%. Housing affordability pressures are severe in Beverley, with only 83.9% of income remaining, ranking at the 47th percentile nationally. The area's SEIFA income ranking places it in the 5th decile.
Frequently Asked Questions - Income
Housing
Beverley is characterized by a predominantly suburban housing profile, with ownership patterns similar to the broader region
Beverley's dwelling structure, as per the latest Census, was 75.2% houses and 24.9% other dwellings (semi-detached, apartments, 'other' dwellings), compared to Adelaide metro's 66.1% houses and 33.9% other dwellings. Home ownership in Beverley stood at 26.1%, with mortgaged dwellings at 41.2% and rented ones at 32.6%. The median monthly mortgage repayment was $1,733, aligning with Adelaide metro's average, while the median weekly rent was $330, compared to Adelaide metro's $1,733 and $325 respectively. Nationally, Beverley's mortgage repayments were lower than the Australian average of $1,863, and rents were substantially below the national figure of $375.
Frequently Asked Questions - Housing
Household Composition
Beverley features high concentrations of group households, with a fairly typical median household size
Family households comprise 67.5% of all households, including 29.9% couples with children, 24.2% couples without children, and 12.0% single parent families. Non-family households account for the remaining 32.5%, with lone person households at 28.1% and group households comprising 4.6%. The median household size is 2.4 people, matching the Greater Adelaide average.
Frequently Asked Questions - Households
Local Schools & Education
Educational attainment in Beverley aligns closely with national averages, showing typical qualification patterns and performance metrics
Beverley has a higher percentage of university-qualified residents aged 15 and above (28.2%) compared to the South Australian average (25.7%). Bachelor degrees are most common among these qualifications at 20.0%, followed by postgraduate qualifications (6.0%) and graduate diplomas (2.2%). Vocational credentials are also prevalent, with 34.0% of residents aged 15 and above holding such qualifications.
This includes advanced diplomas (10.3%) and certificates (23.7%). Educational participation is high in Beverley, with 27.5% of residents currently enrolled in formal education. This includes primary education (9.2%), tertiary education (6.5%), and secondary education (6.0%).
Frequently Asked Questions - Education
Schools Detail
Nearby Services & Amenities
Transport
Transport servicing is moderate compared to other areas nationally based on assessment of service frequency, route connectivity and accessibility
Beverley has 25 active public transport stops, all bus services. These are covered by 24 different routes, offering a total of 1,562 weekly passenger trips. Residents enjoy good transport accessibility, with an average distance of 302 meters to the nearest stop.
On average, there are 223 trips per day across all routes, which equates to around 62 weekly trips per individual stop.
Frequently Asked Questions - Transport
Transport Stops Detail
Health
The level of general health in Beverley is notably higher than the national average with prevalence of common health conditions low among the general population though higher than the nation's average across older, at risk cohorts
Beverley demonstrates above-average health outcomes with prevalence of common health conditions low among its general population, though higher than the national average among older, at-risk cohorts.
Approximately 51% (~4,955 people) of Beverley's total population has private health cover, slightly lagging behind the average for SA2 areas. Mental health issues and asthma are the most common medical conditions in Beverley, impacting 7.9 and 7.7% of residents respectively, while 71.6% declare themselves completely clear of medical ailments compared to 68.9% across Greater Adelaide. Beverley has 13.7% (1,329 people) of its residents aged 65 and over, which is lower than the 20.0% in Greater Adelaide. Health outcomes among seniors present some challenges requiring more attention than the broader population.
Frequently Asked Questions - Health
Cultural Diversity
The level of cultural diversity witnessed in Beverley was found to be above average when compared nationally for a number of language and cultural background related metrics
Beverley's population showed high cultural diversity, with 27.8% born overseas and 28.8% speaking a language other than English at home. Christianity was the dominant religion, accounting for 50.0%. The 'Other' category comprised 2.9%, higher than Greater Adelaide's 1.8%.
Top ancestry groups were English (20.6%), Australian (20.1%), and Other (11.3%). Notable ethnic group representations included Polish at 1.8% (vs regional 1.4%), Serbian at 1.3% (vs 1.3%), and Italian at 10.0% (vs 10.2%).
Frequently Asked Questions - Diversity
Age
Beverley's population is slightly younger than the national pattern
The median age in Beverley is 36 years, which is slightly lower than Greater Adelaide's average of 39 and also lower than the Australian median of 38. Compared to Greater Adelaide, Beverley has a higher proportion of residents aged 25-34 (17.8%) but fewer residents aged 65-74 (7.5%). According to the 2021 Census, the age group of 35 to 44 has increased from 15.2% to 16.7% of Beverley's population, while the age group of 45 to 54 has decreased from 12.9% to 11.8%. By 2041, Beverley is projected to experience significant changes in its age composition, with the 45-54 age group expected to grow by 38% (436 people), reaching a total of 1,583 from the previous count of 1,146.
