Chart Color Schemes
This analysis uses ABS Statistical Areas Level 2 (SA2) boundaries, which can materially differ from Suburbs and Localities (SAL) even when sharing similar names.
SA2 boundaries are defined by the Australian Bureau of Statistics and are designed to represent communities for statistical reporting (e.g., census and ERP).
Suburbs and Localities (SAL) represent commonly-used suburb/locality names (postal-style areas) and may use different geographic boundaries. For comprehensive analysis, consider reviewing both boundary types if available.
est. as @ -- *
ABS ERP | -- people | --
2021 Census | -- people
Sales Activity
Curious about local property values? Filter the chart to assess the volume and appreciation (including resales) trends and regional comparisons, or scroll to the map below view this information at an individual property level.
Find a Recent Sale
Sales Detail
Population
Seaton - Grange has seen population growth performance typically on par with national averages when looking at short and medium term trends
Seaton-Grange's population was 17,501 as of March 2021. By Nov 2025, it had increased to around 18,516, reflecting a growth of 1,015 people (5.8%) since the census. This increase is inferred from ABS's estimated resident population of 18,261 in June 2024 and an additional 352 validated new addresses since March 2021. The population density was 2,244 persons per square kilometer, above the national average assessed by AreaSearch. Seaton-Grange's growth rate of 5.8% since the census was within 1.3 percentage points of the state's 7.1%, indicating competitive growth fundamentals. Overseas migration contributed approximately 95.0% of overall population gains during recent periods.
AreaSearch uses ABS/Geoscience Australia projections for each SA2 area, released in Dec 2024 with a base year of 2022. For areas not covered by this data and years post-2032, the SA State Government's Regional/LGA projections by age category are adopted, released in Aug 2023 based on 2021 data. Projected demographic shifts indicate a population increase just below the median of national areas to 2041, with an expected expansion of 1,706 persons, reflecting a total increase of 7.8% over the 17 years.
Frequently Asked Questions - Population
Development
AreaSearch assessment of residential development activity positions Seaton - Grange among the top 25% of areas assessed nationwide
Seaton - Grange averaged approximately 161 new dwelling approvals annually over the past five financial years, totalling 808 homes. As of FY26111 approvals have been recorded. Between FY21 and FY25, an average of 1.1 new residents per year was associated with each dwelling constructed. The average construction value for new properties is $328,000.
In FY26, commercial approvals totalled $27.9 million. Seaton - Grange maintains similar construction rates per person compared to Greater Adelaide, supporting market stability. Detached dwellings comprise 73.0% of new building activity, with townhouses or apartments making up the remaining 27.0%, reflecting the area's suburban identity.
The population density is around 106 people per approval, indicating a low-density area. According to AreaSearch's latest quarterly estimate, Seaton - Grange is projected to grow by 1,445 residents by 2041. At current development rates, new housing supply should comfortably meet demand, providing favourable conditions for buyers and potentially supporting growth beyond current population projections.
Frequently Asked Questions - Development
Infrastructure
Seaton - Grange has limited levels of nearby infrastructure activity, ranking in the 10thth percentile nationally
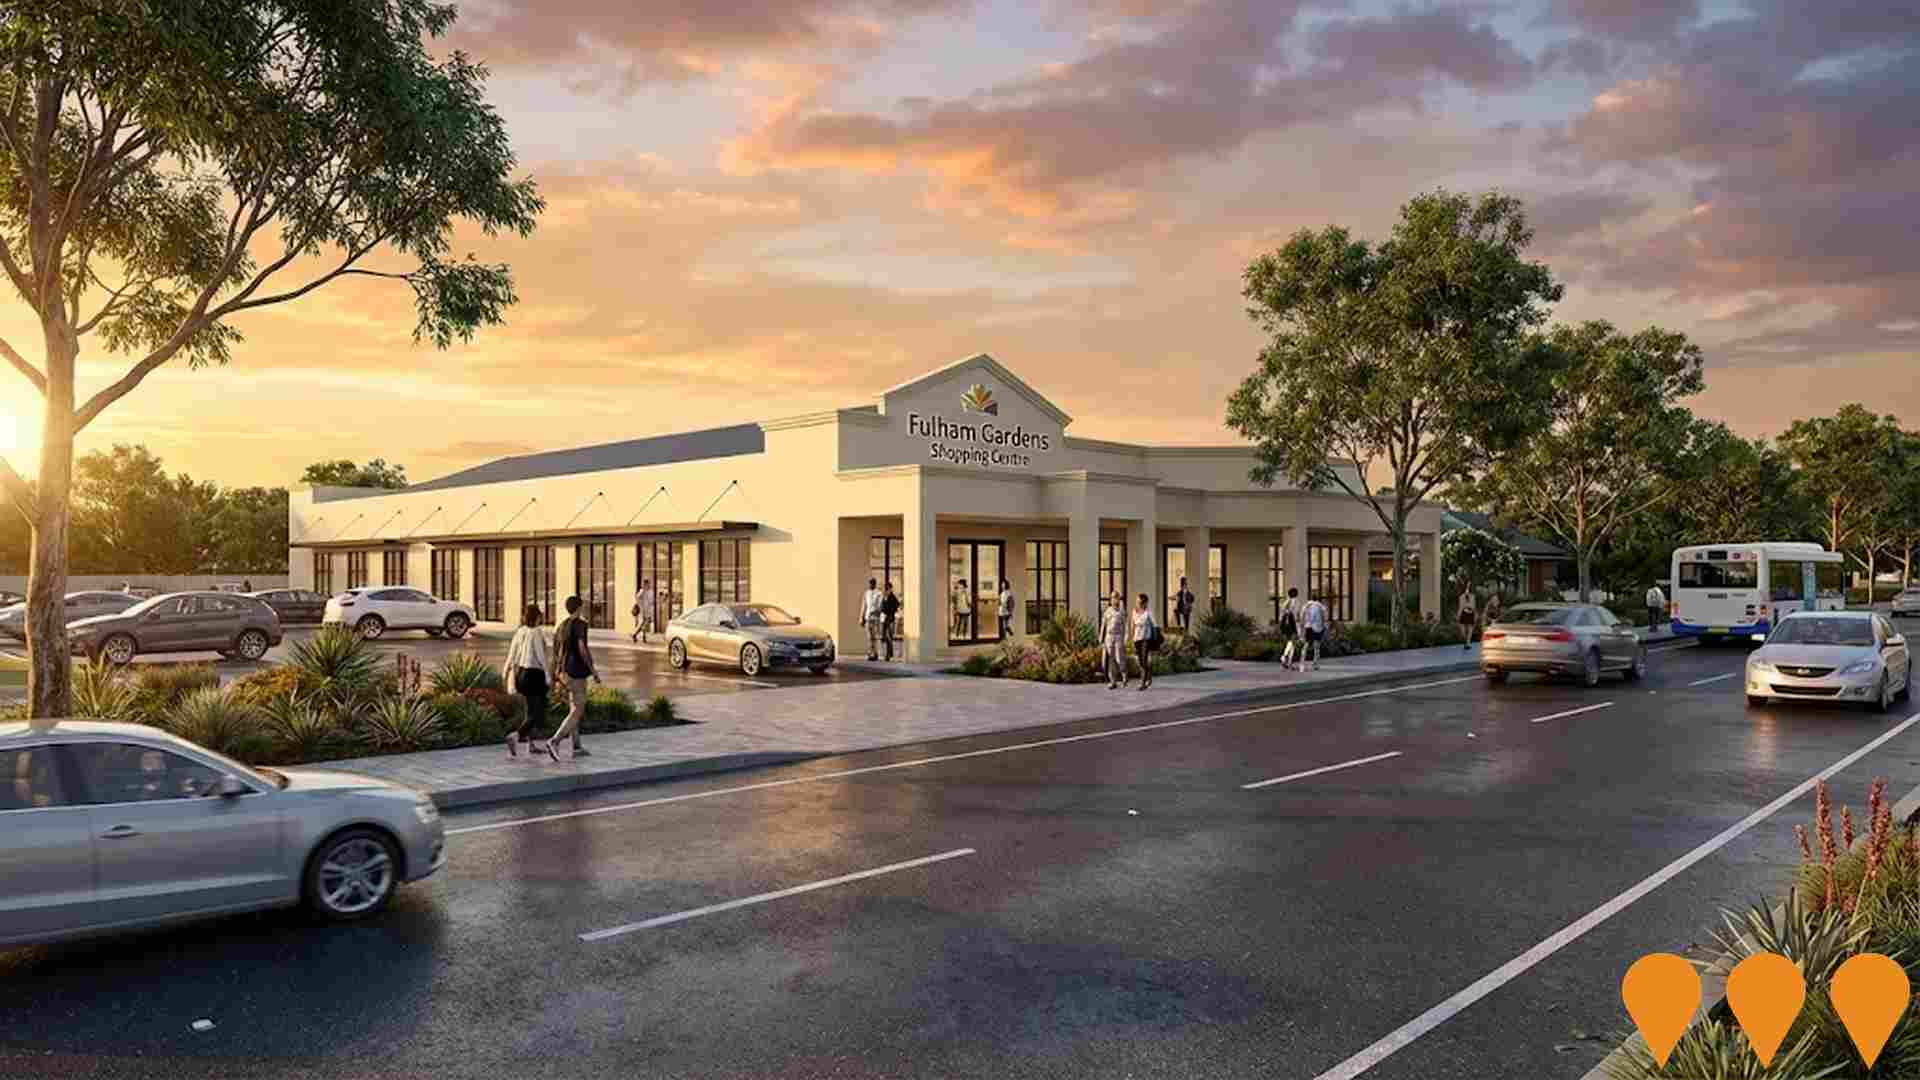
Changes to local infrastructure significantly impact an area's performance. AreaSearch has identified 29 projects likely affecting the region. Notable initiatives include Findon Energy Storage Facility, Gleneagles Reserve Stormwater Management & Reserve Upgrade, Grange Healthcare Precinct, and Fulham Gardens Shopping Centre Redevelopment. The following list details those most relevant.
Professional plan users can use the search below to filter and access additional projects.
INFRASTRUCTURE SEARCH
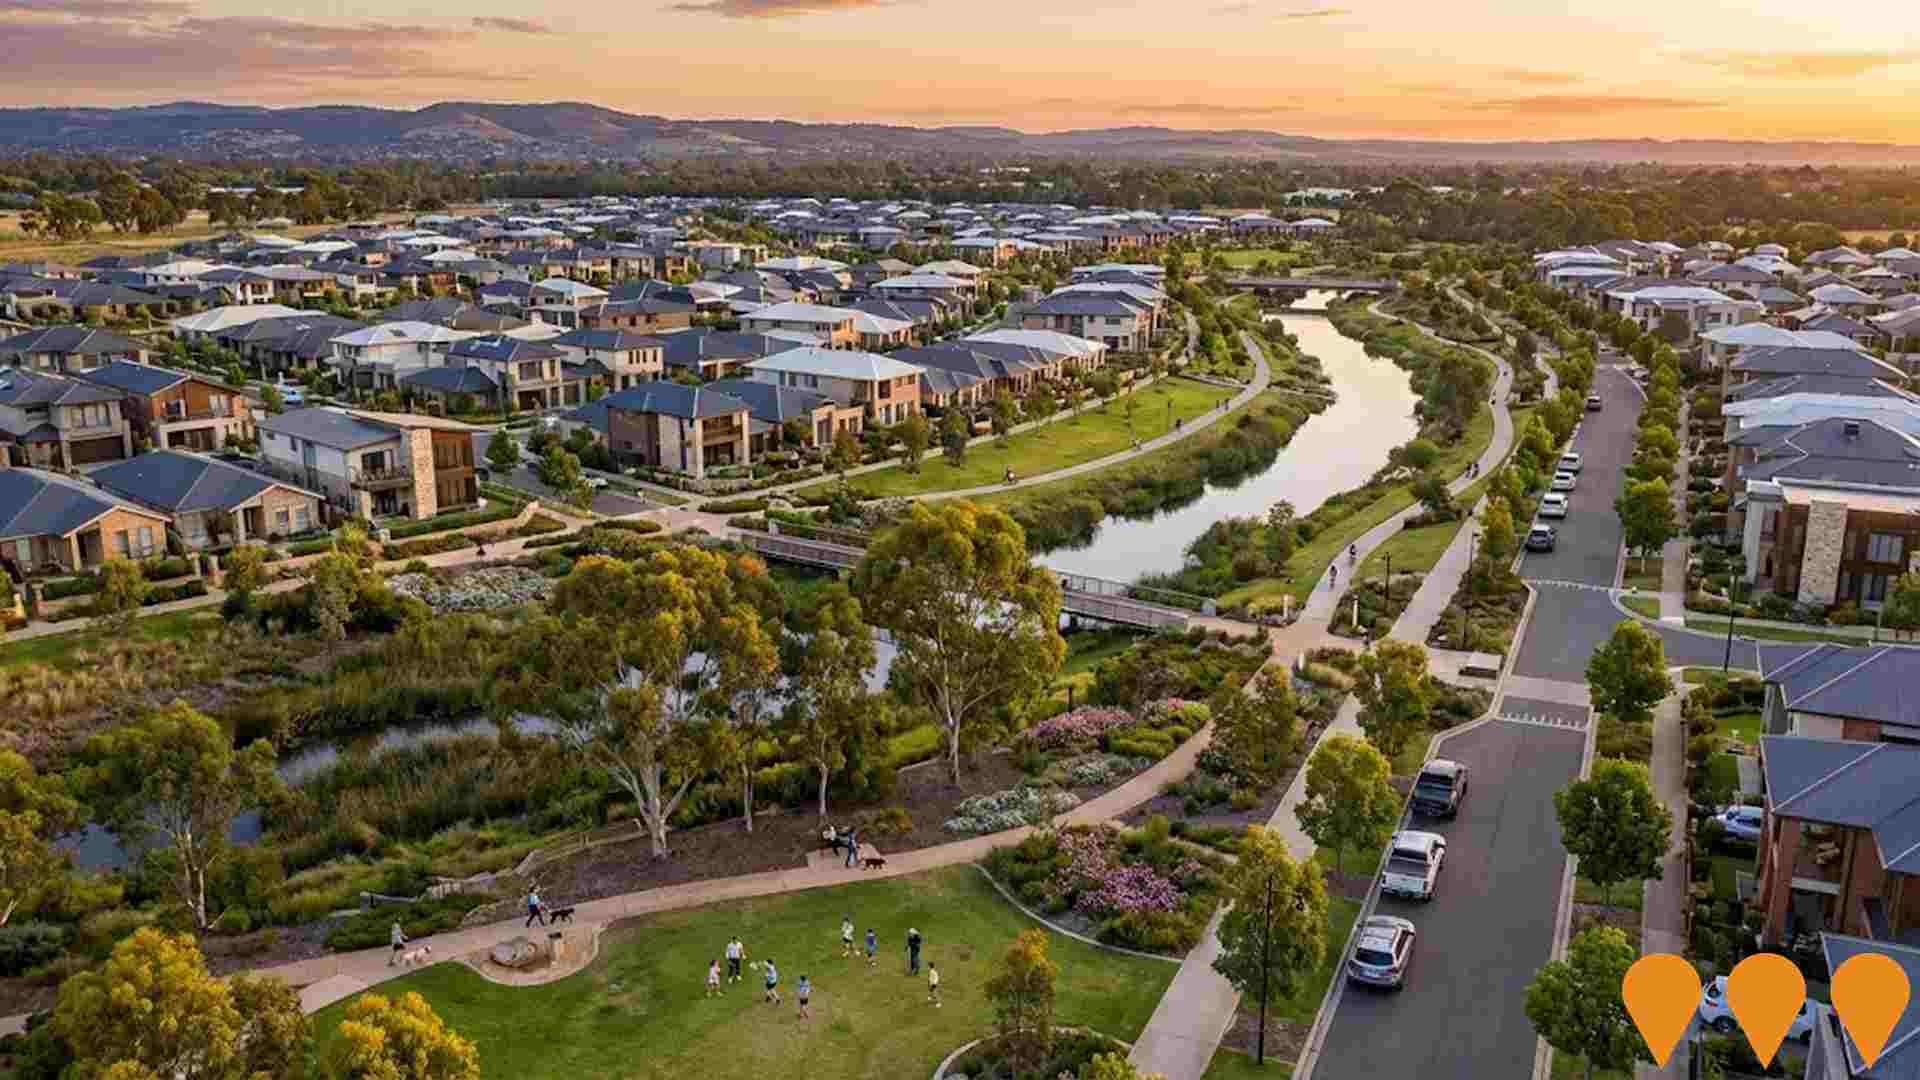
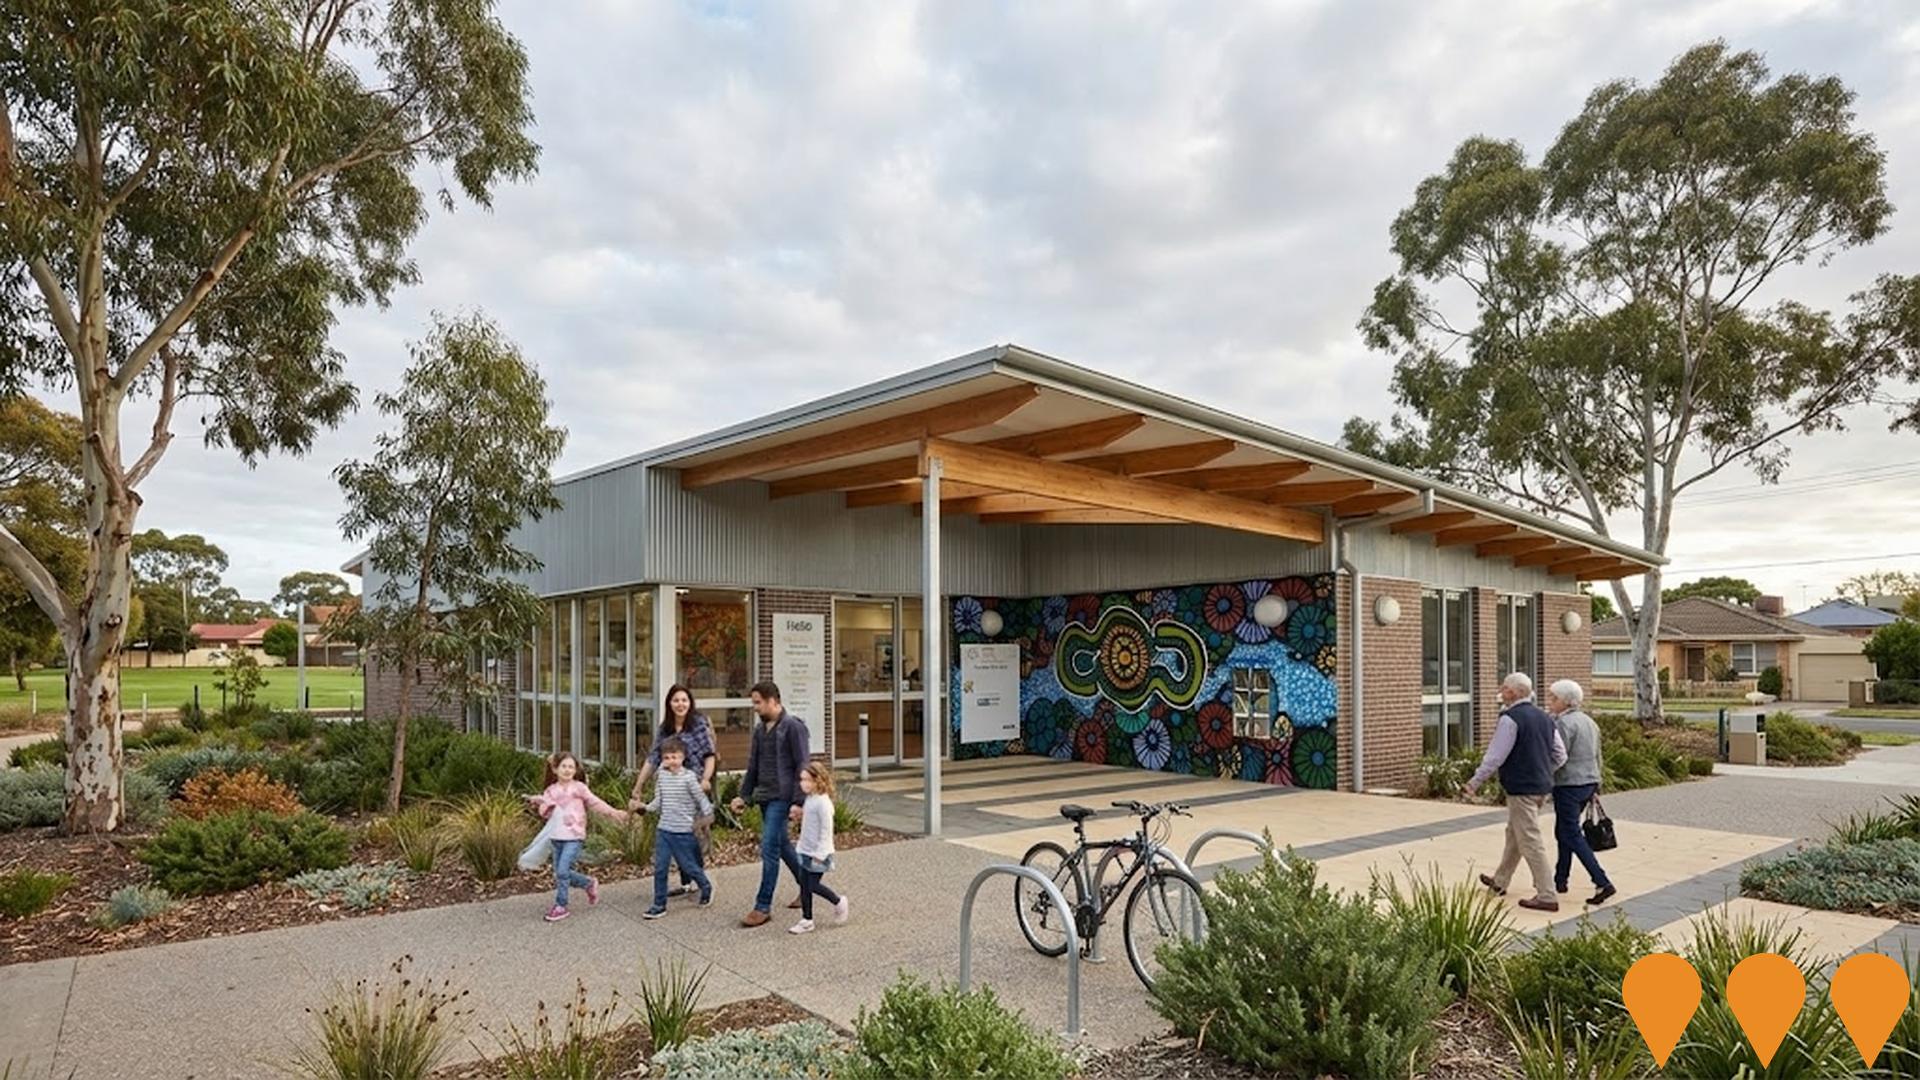
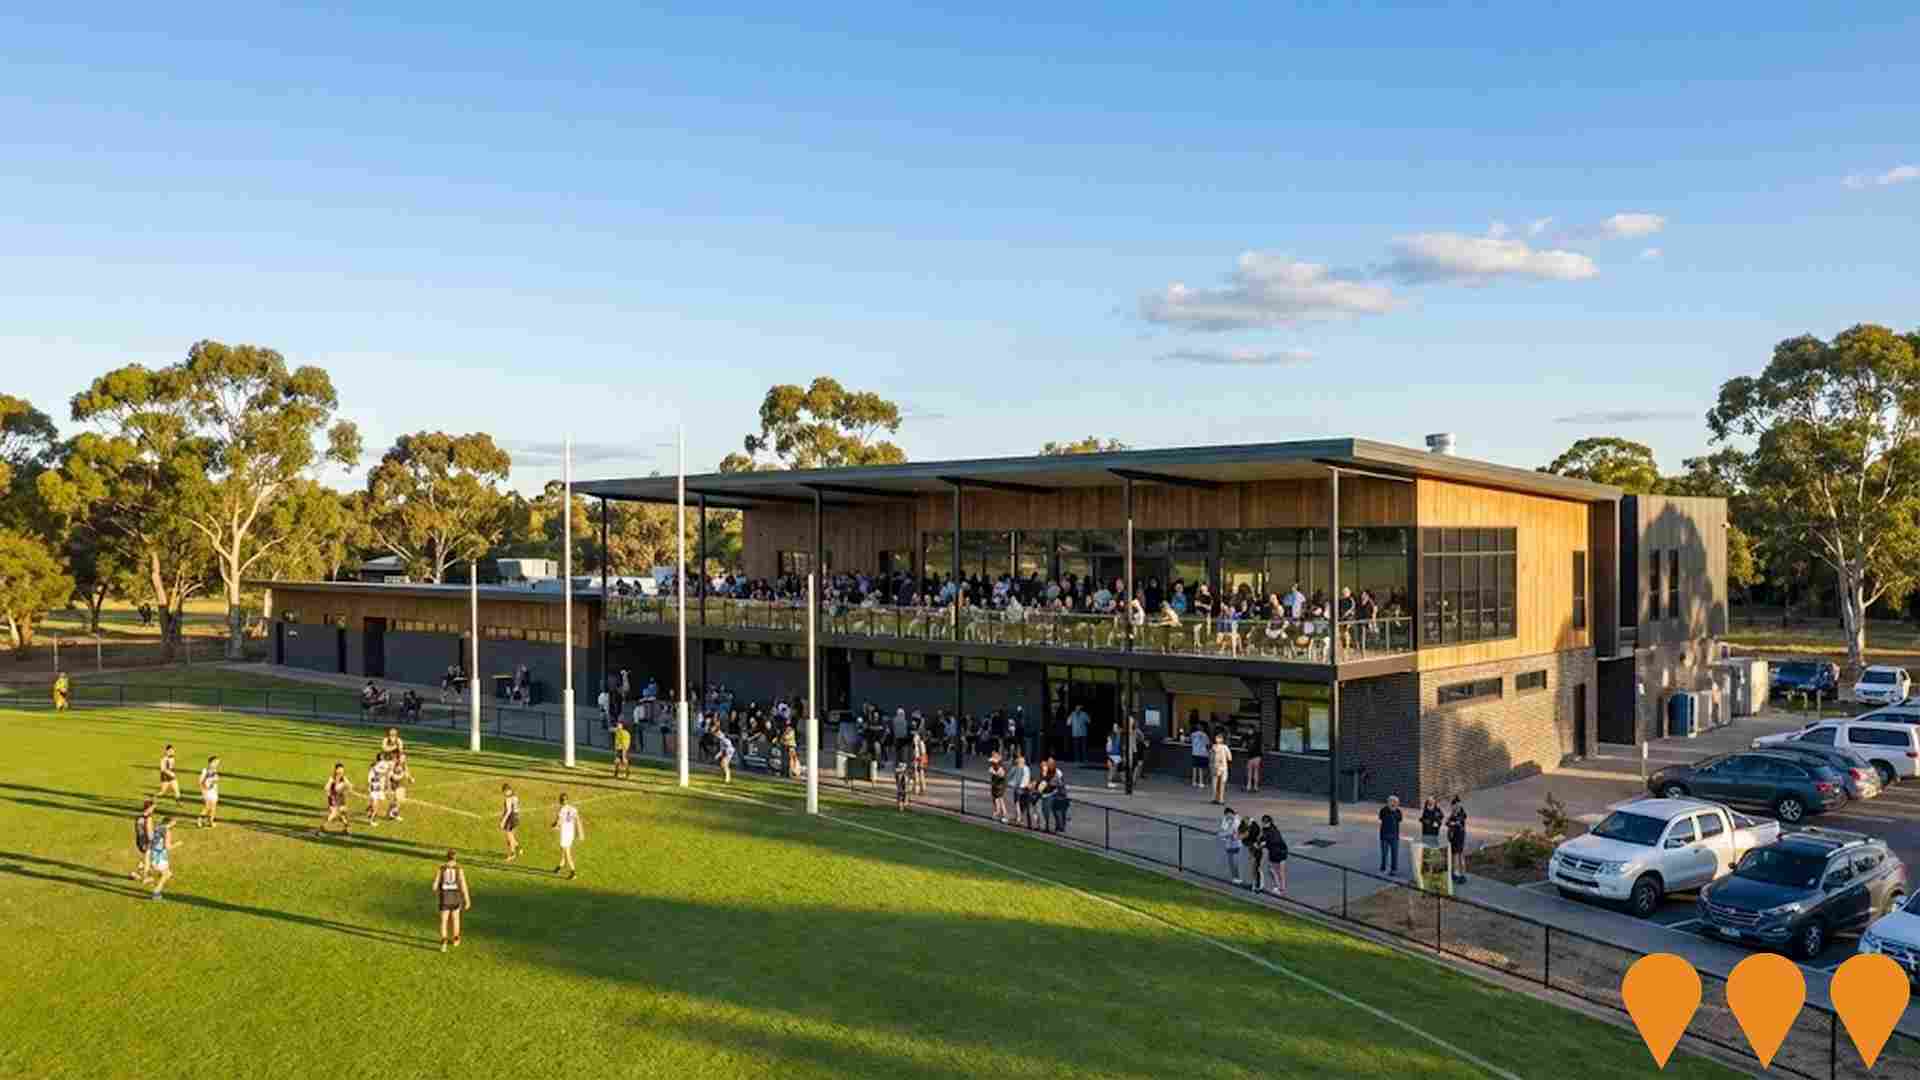
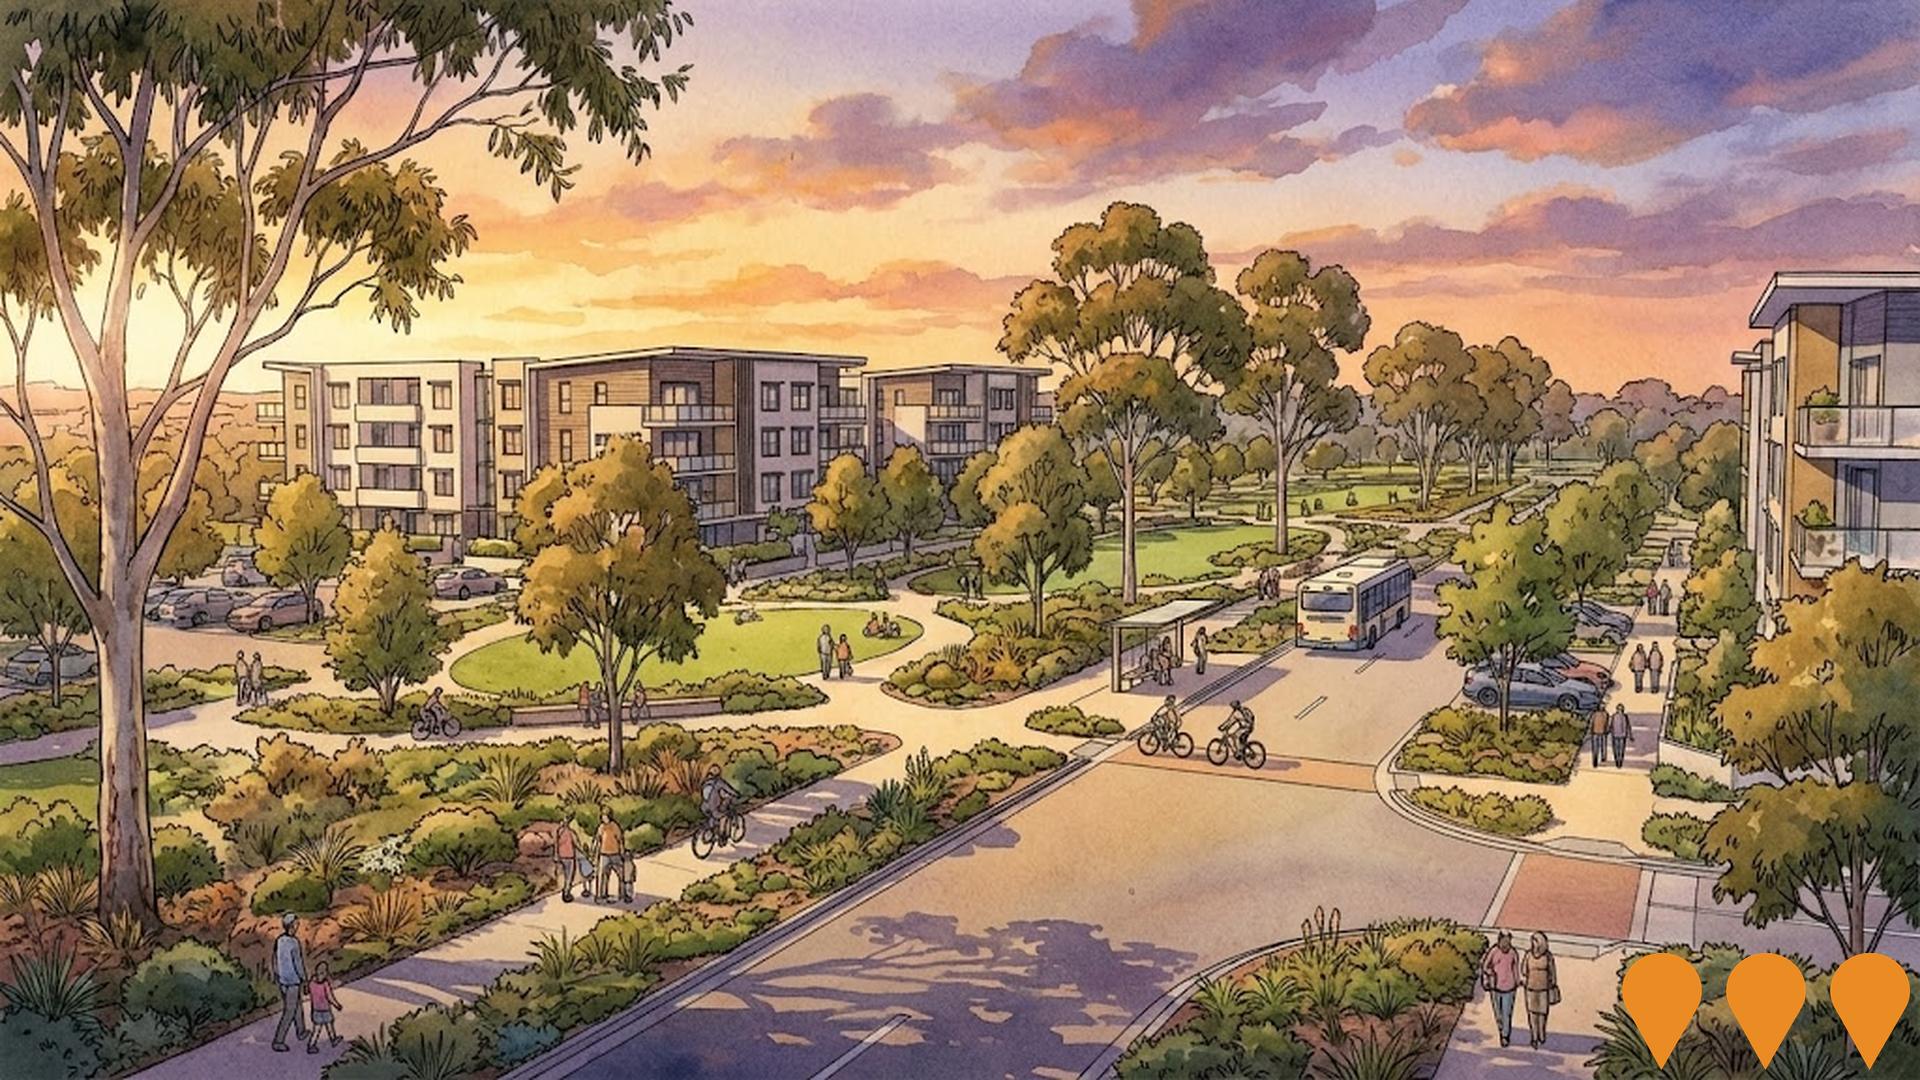
 Denotes AI-based impression for illustrative purposes only, not to be taken as definitive under any circumstances. Please follow links and conduct other investigations from the project's source for actual imagery. Developers and project owners wishing us to use original imagery please Contact Us and we will do so.
Frequently Asked Questions - Infrastructure
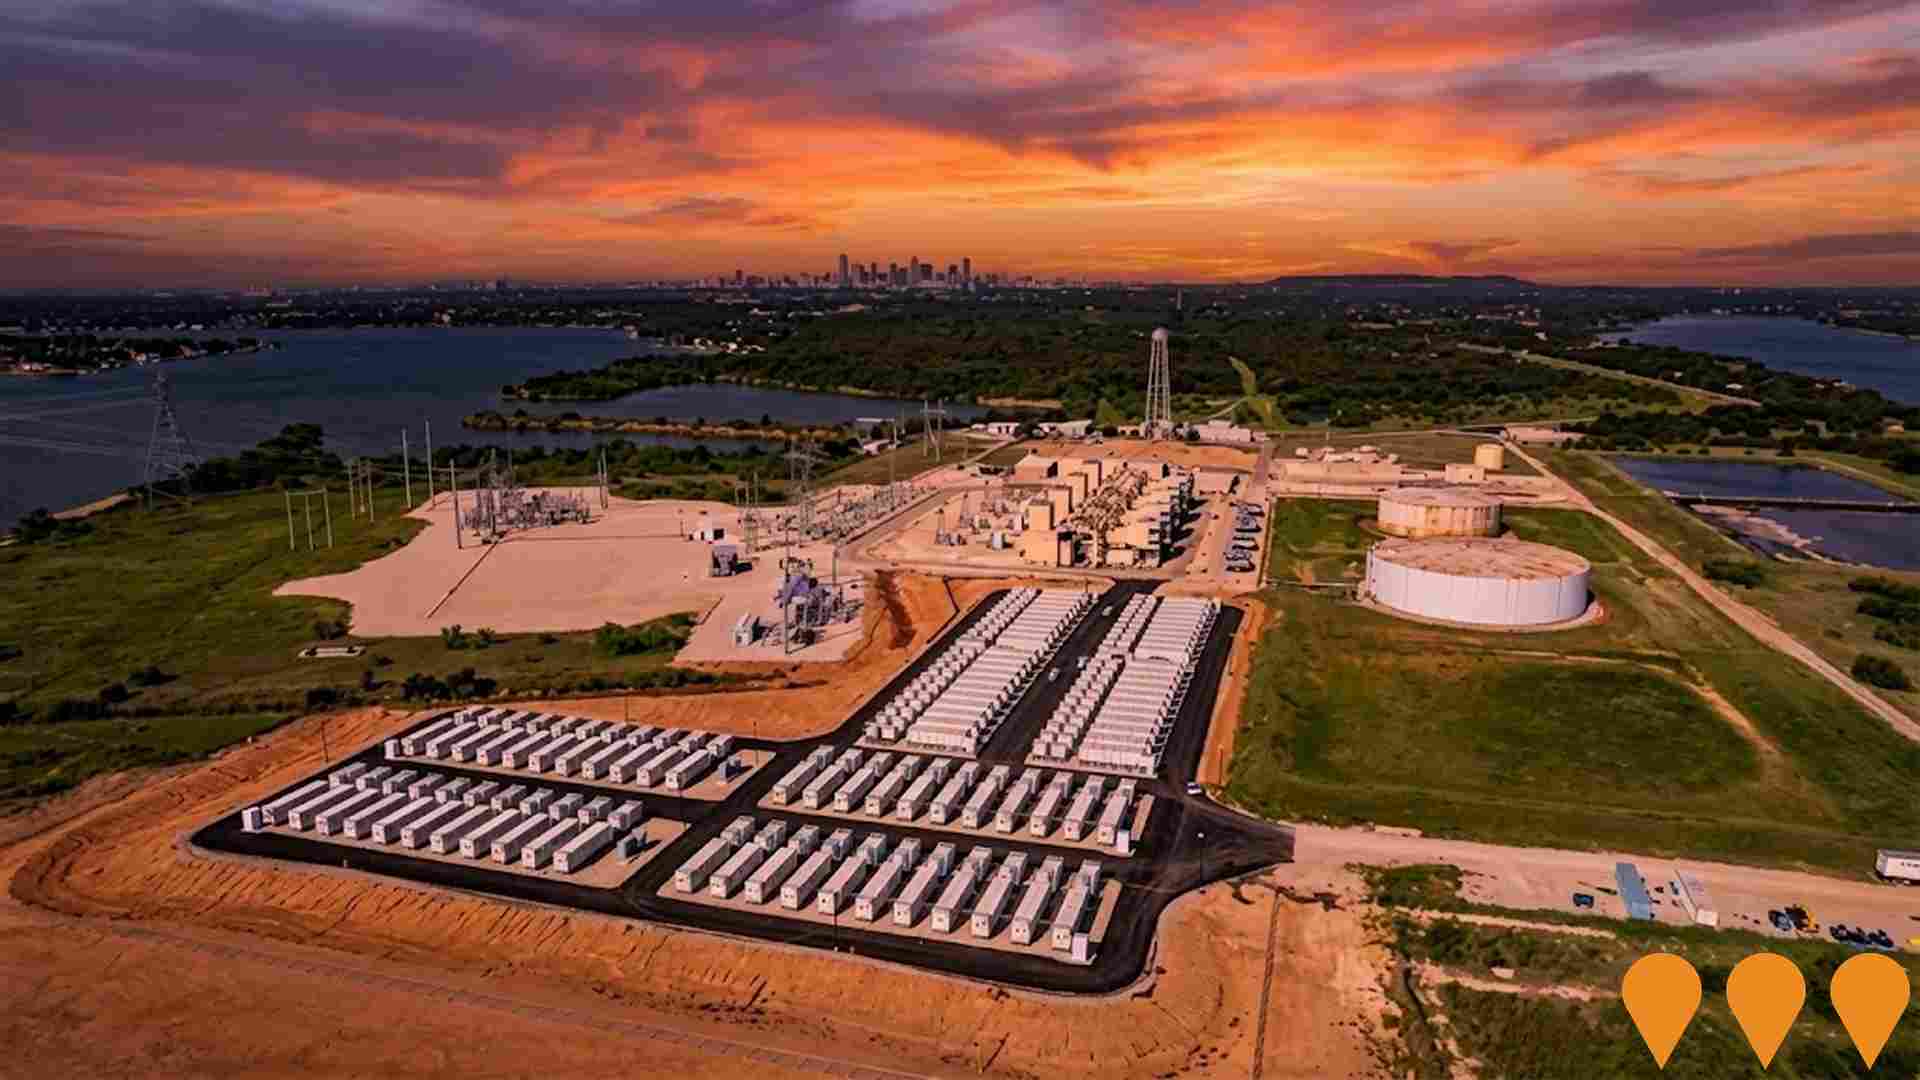
Findon Energy Storage Facility
Large-scale battery energy storage system supporting grid stability and renewable energy integration for the western Adelaide region.
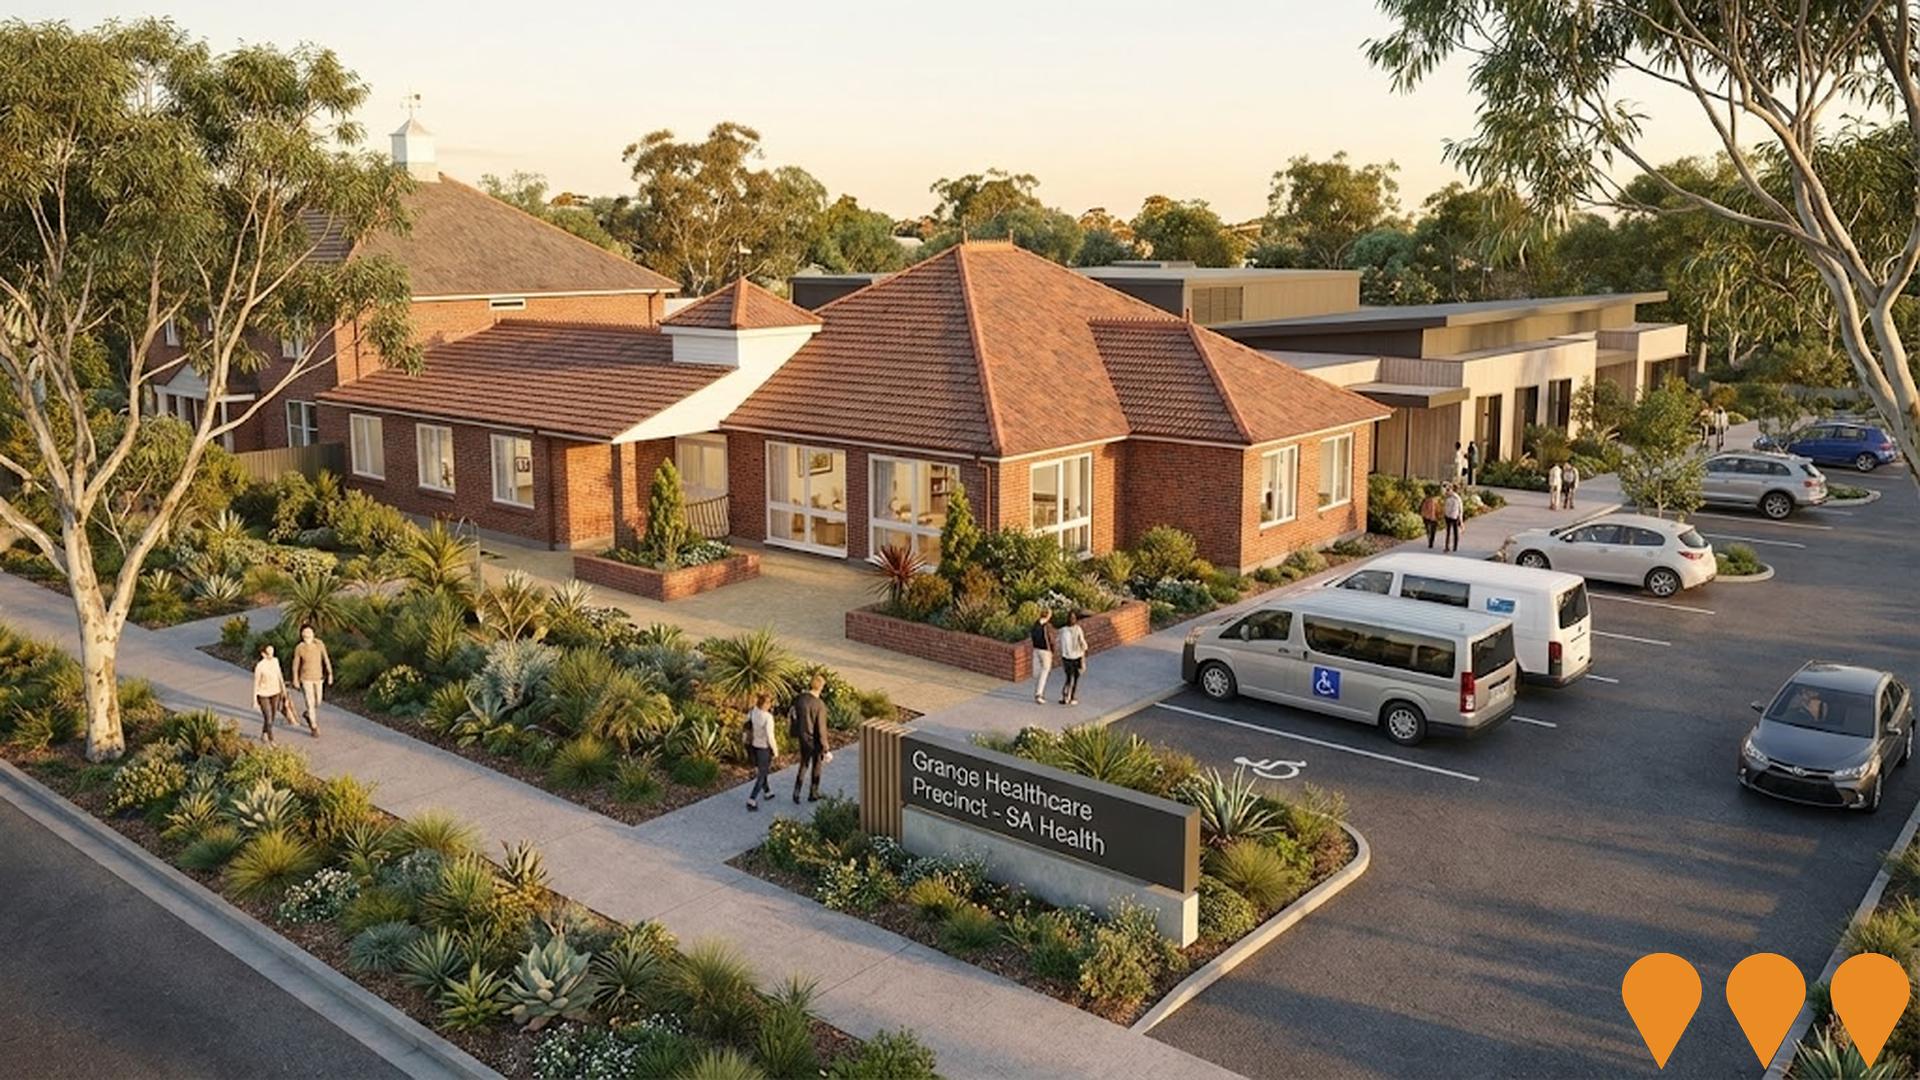
Grange Healthcare Precinct
Proposed SA Health healthcare precinct in the Grange Findon corridor in western Adelaide, expanding aged care, community mental health and primary health services for older residents and the local community. The project remains in the proposal and planning phase with an indicative completion target around 2027.
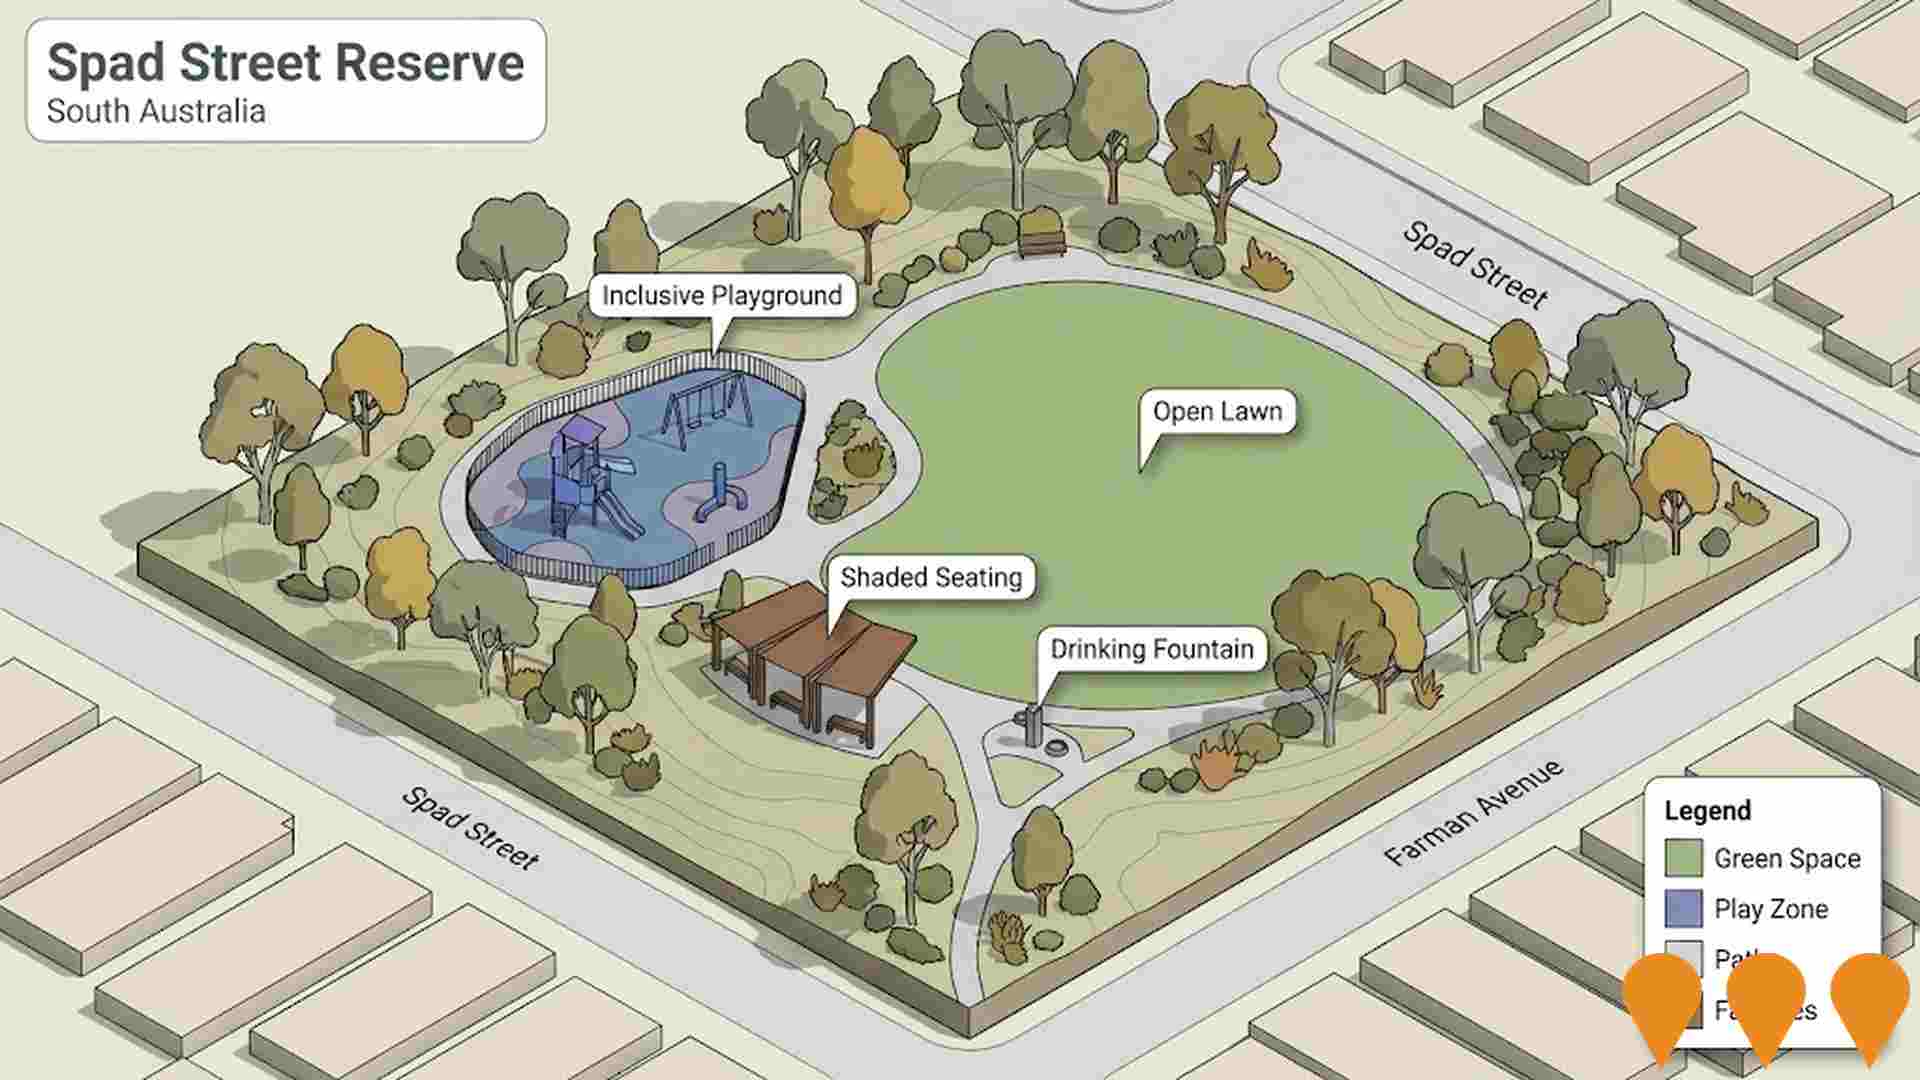
Spad Street Reserve
New neighbourhood reserve delivered by the City of Charles Sturt at the corner of Spad Street and Farman Avenue. Key features include a fenced inclusive playground with a communications board, shaded seating, open lawn space and a drinking fountain with dog bowl. The reserve addresses the local need for accessible open space and was officially opened in 2024.
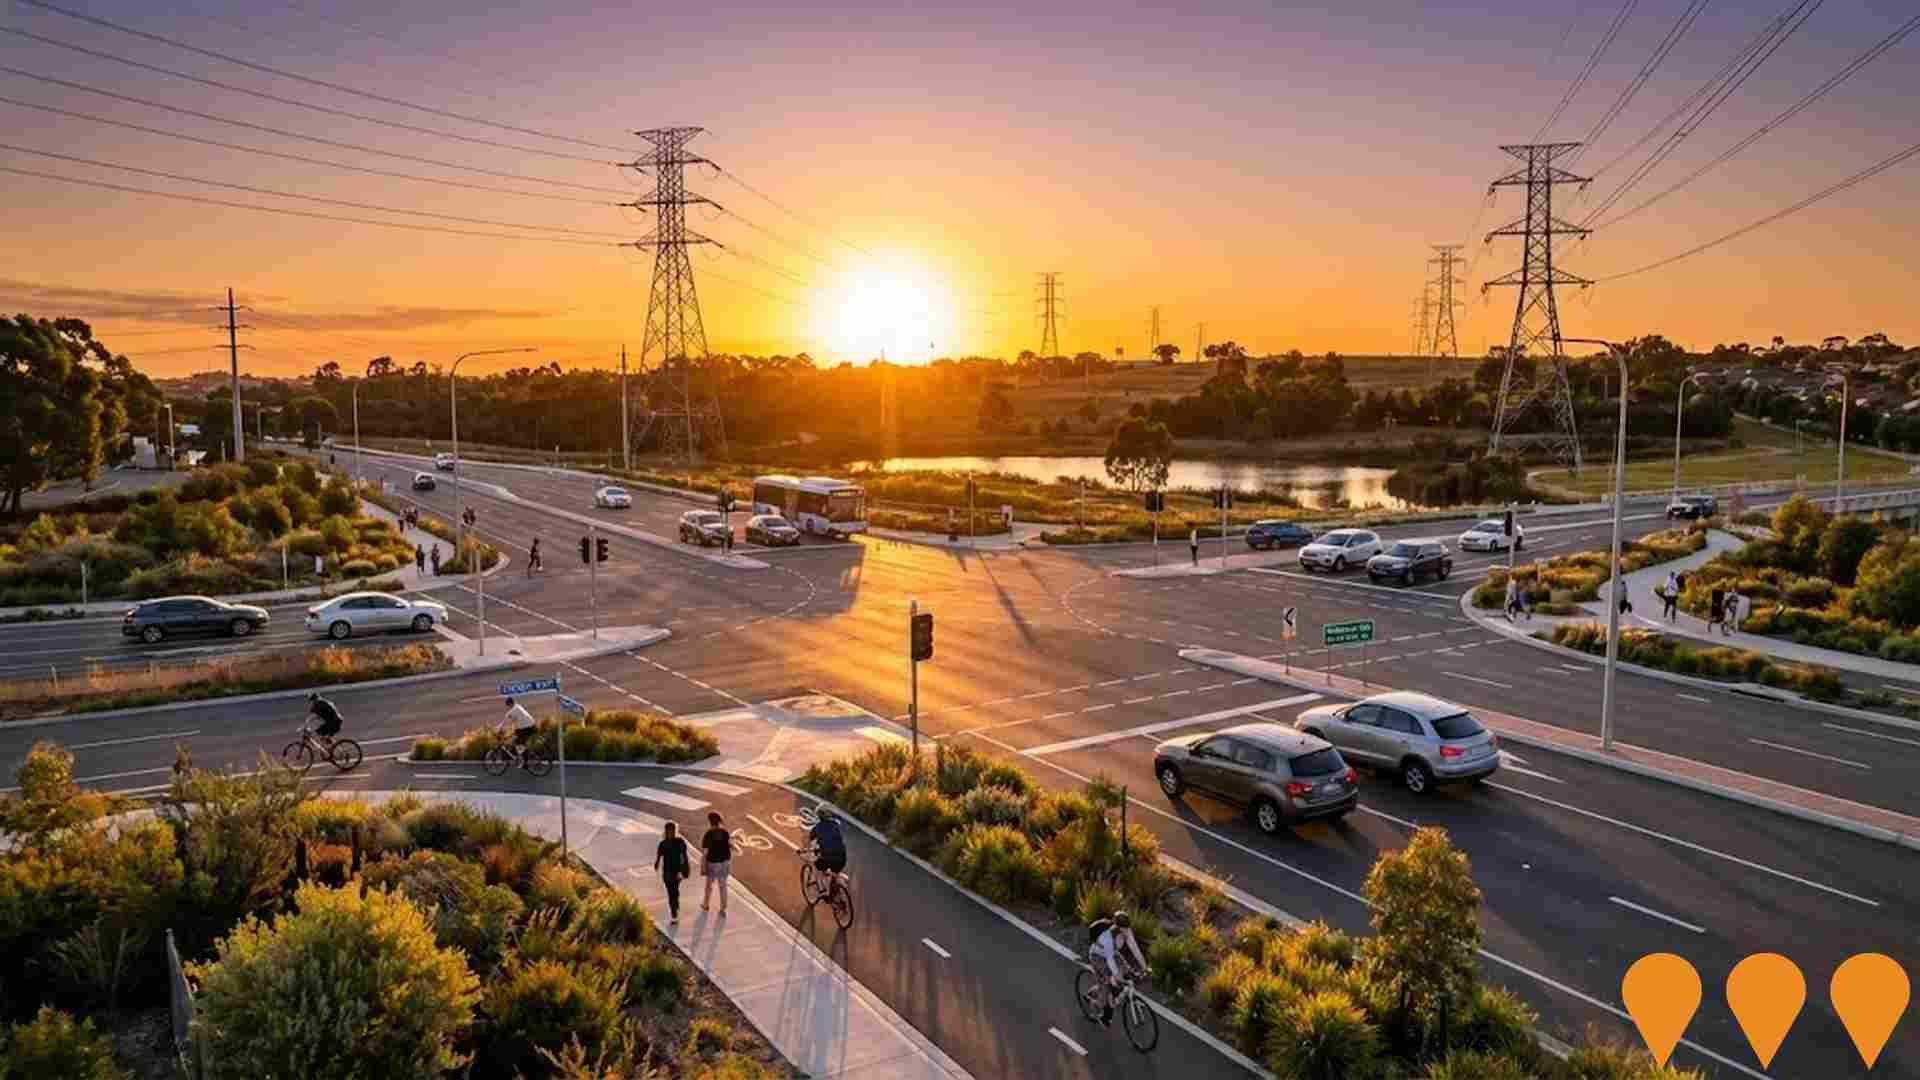
Findon Road Upgrade
Major road infrastructure upgrade including intersection improvements, cycling infrastructure, and public transport enhancements along Findon Road corridor.
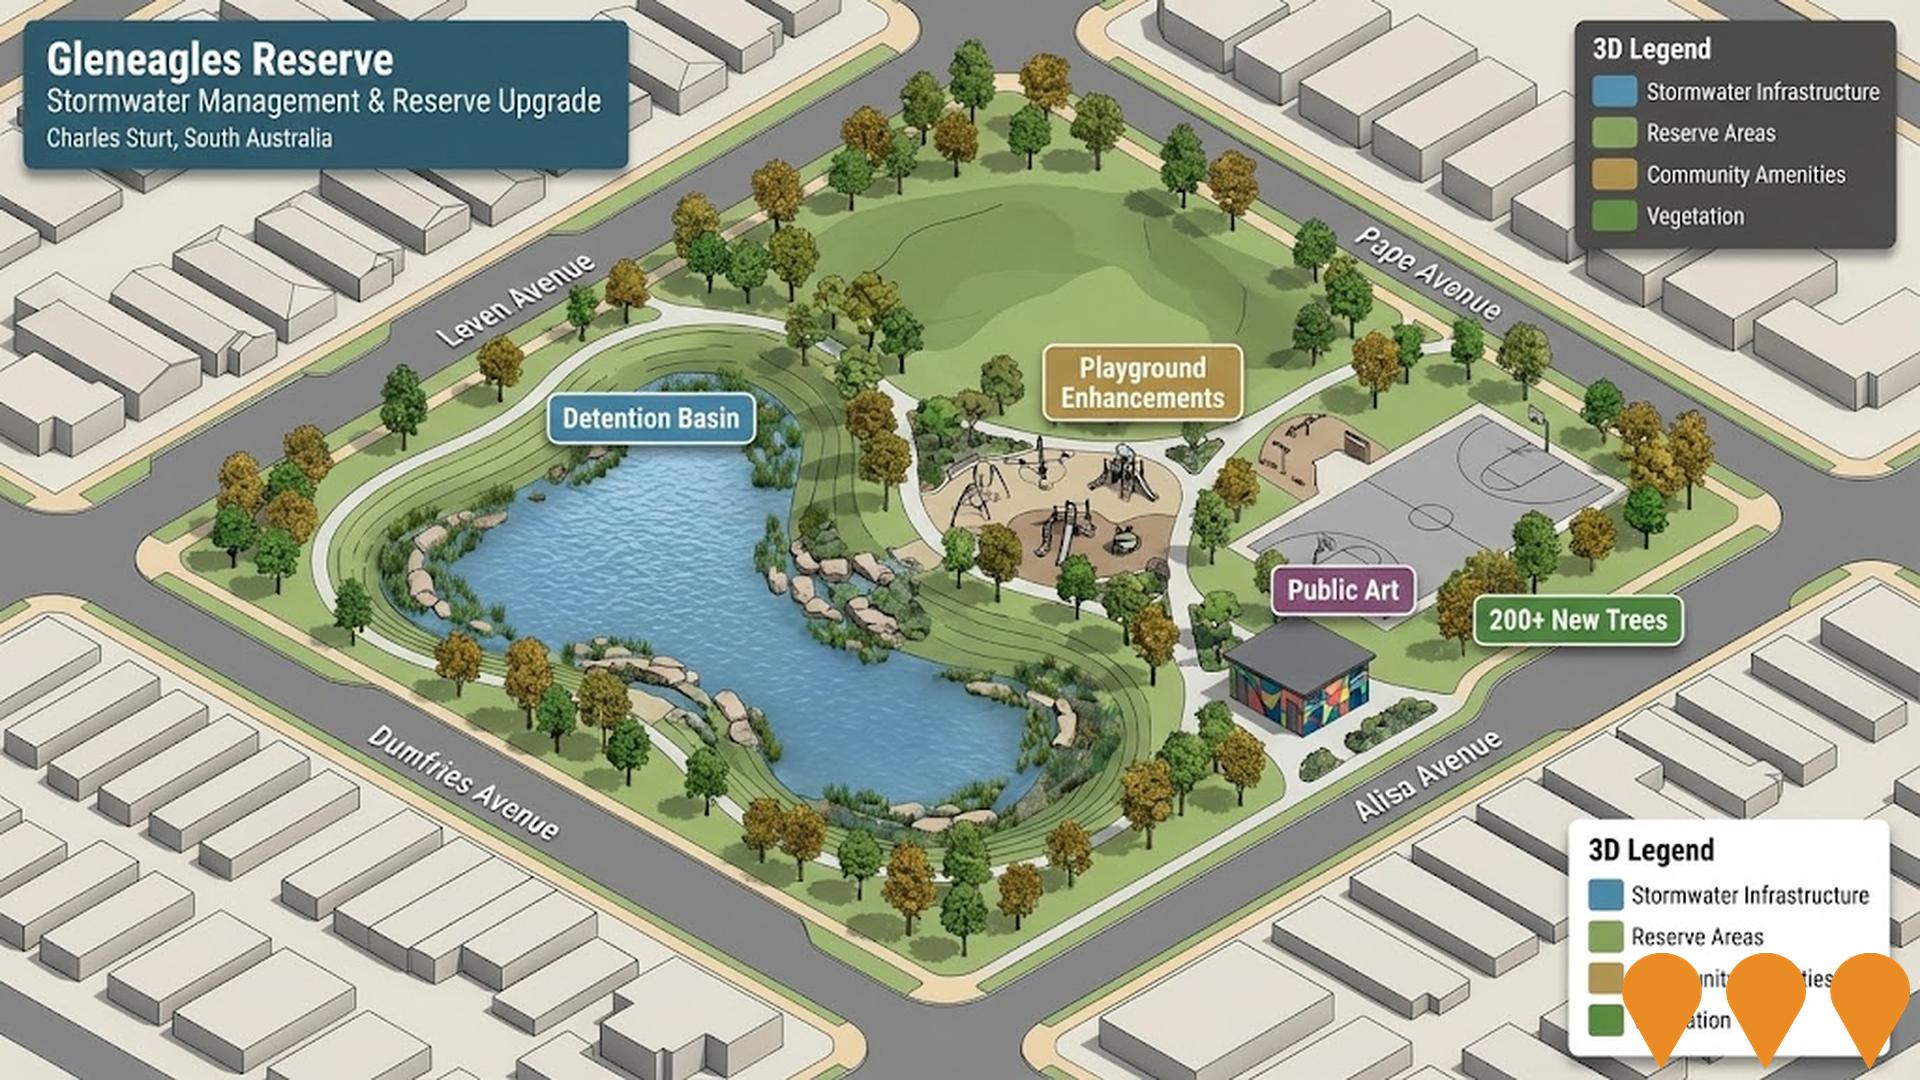
Gleneagles Reserve Stormwater Management & Reserve Upgrade
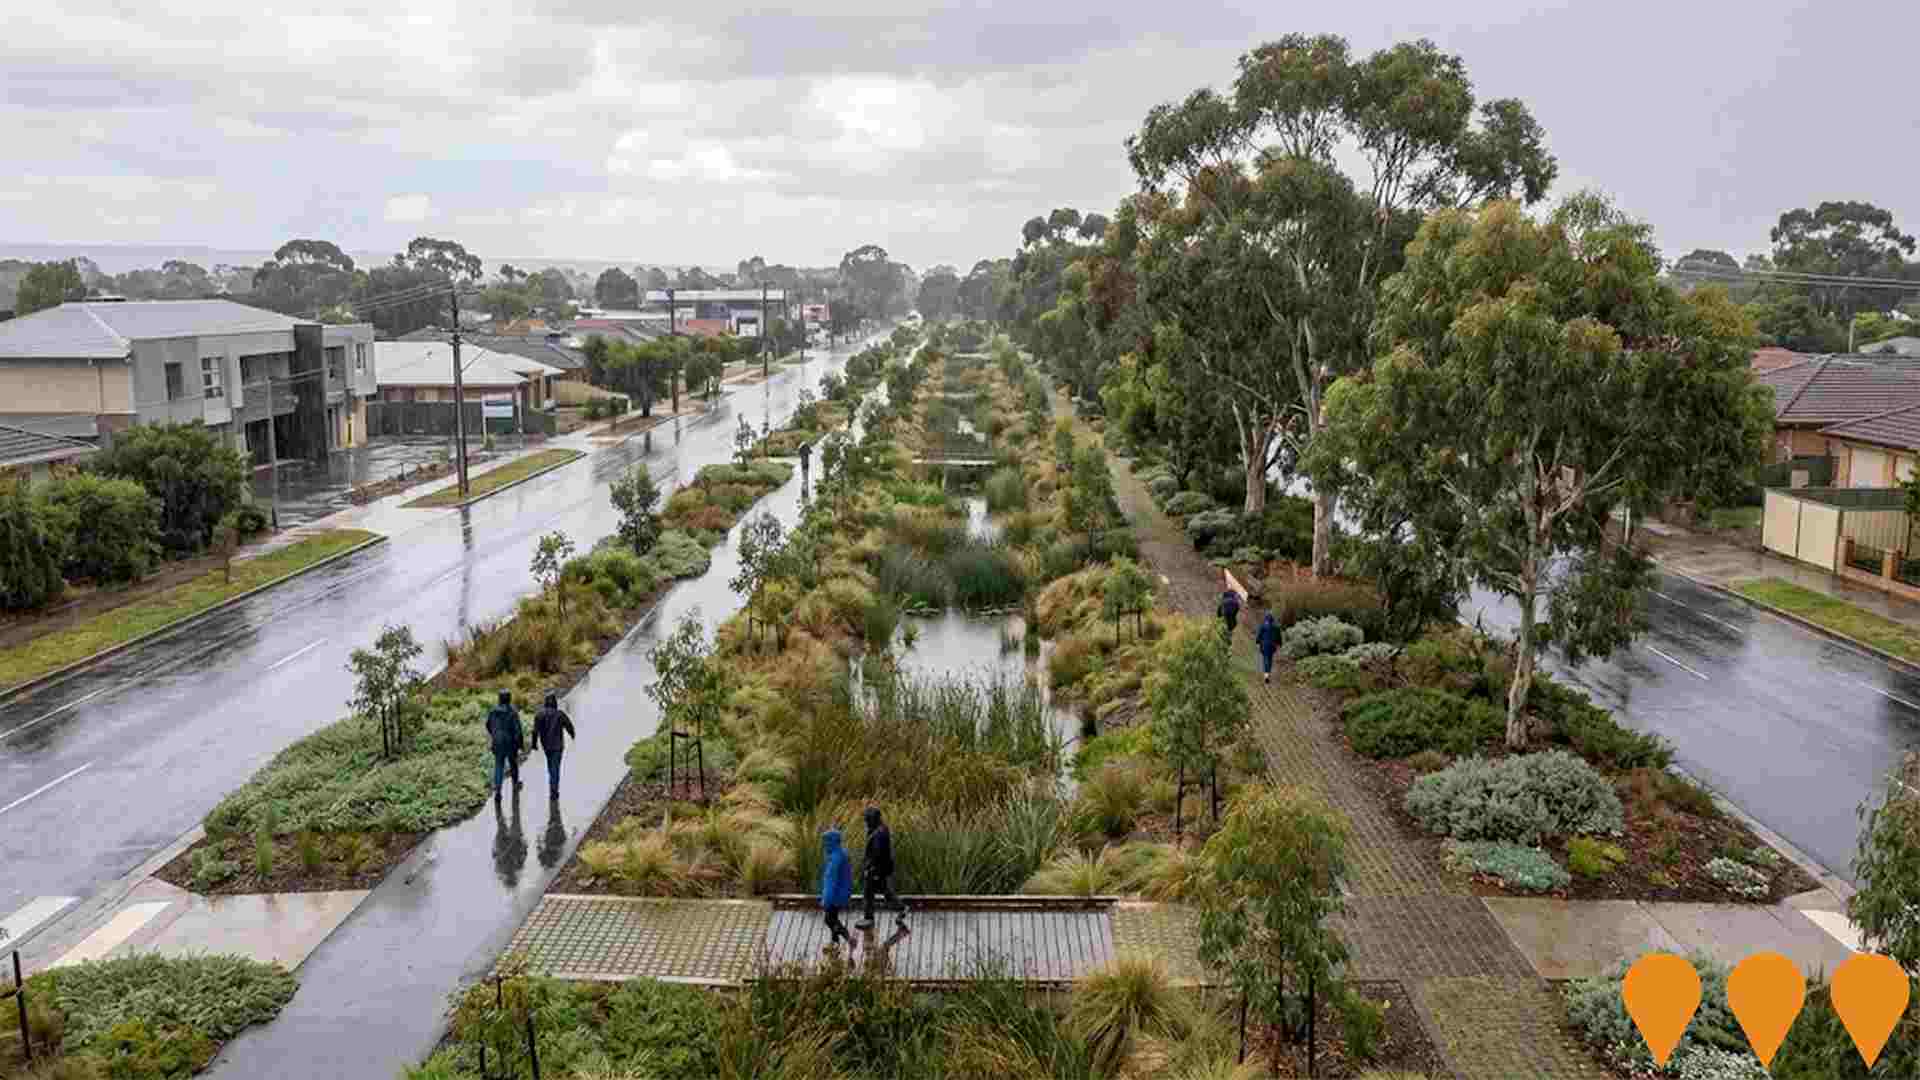
Multi-stage stormwater detention basin project to manage flooding in the Meakin Terrace sub-catchment, reducing flood risk for surrounding streets including Leven Avenue, Tapleys Hill Road, Wilford and Prior Avenues. The stormwater infrastructure is now complete with over 200 trees planted. Stage 2 reserve upgrades will commence October 2025, featuring enhanced community amenities, public toilet artwork by artist Cat Dean, and improvements reflecting community feedback priorities including playground enhancements and expanded recreational facilities.
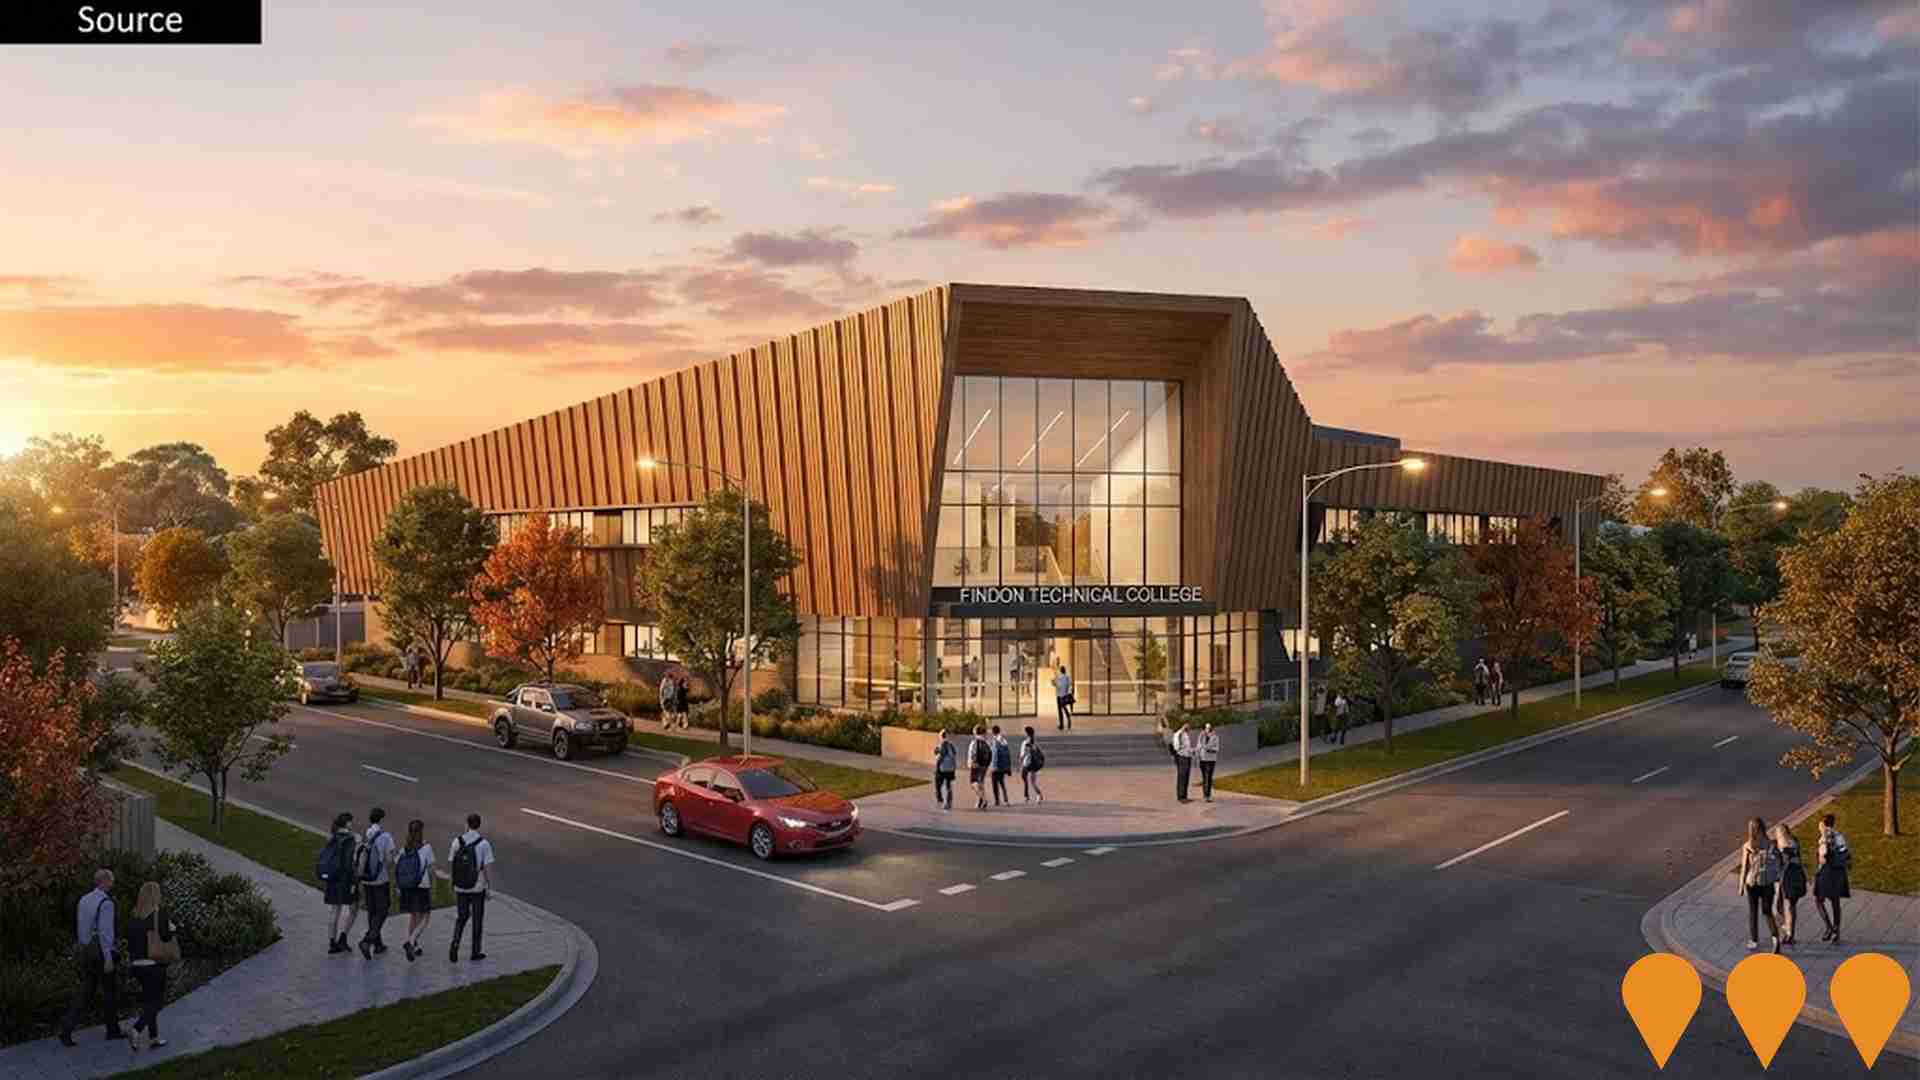
Findon Technical College
Multi-million-dollar technical college focused on advanced manufacturing, early childhood care and health. Part of $208.8 million commitment to build five technical colleges across South Australia. Includes $10 million in infrastructure upgrades to Findon High School.
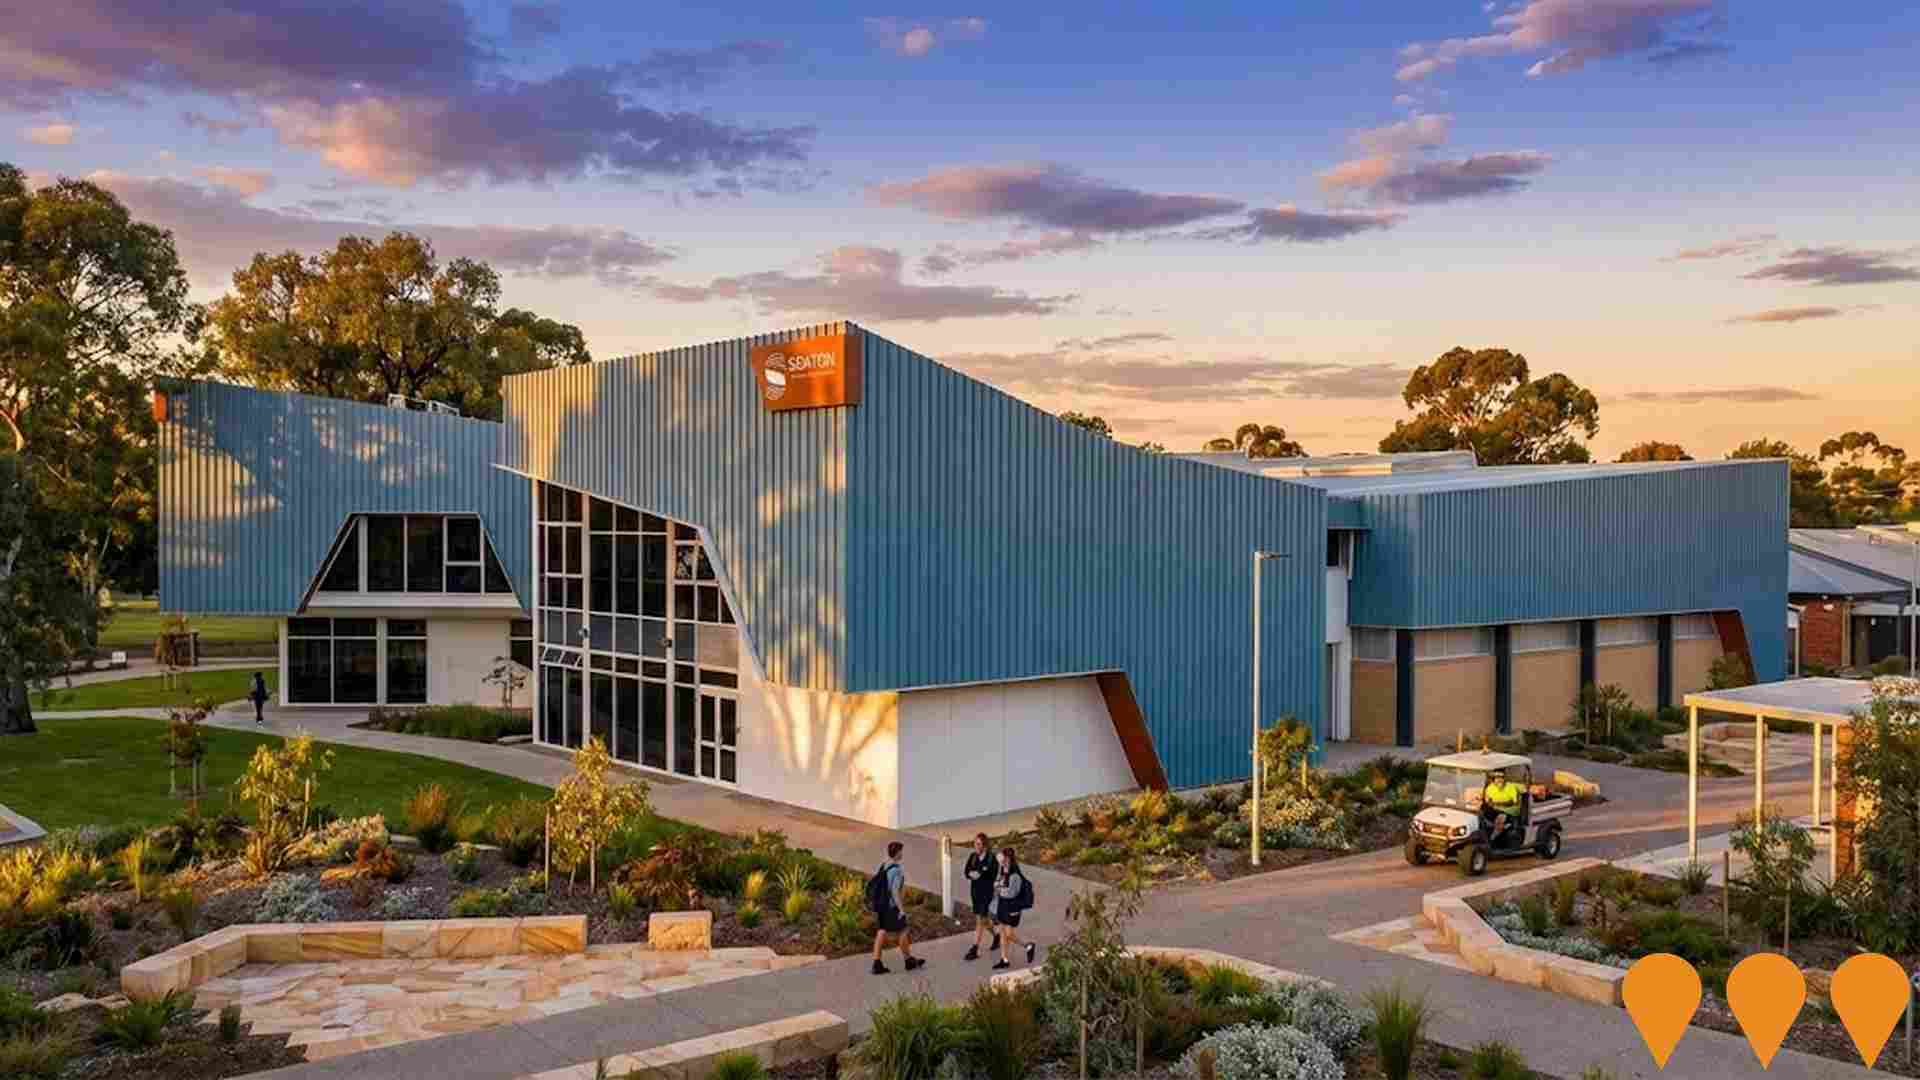
Seaton High School Redevelopment
Major $19.8 million redevelopment completed in 2024 including new two-storey learning centre with administration, 21st century learning spaces, resource centre, and senior school services. Features entrepreneurial hub with modern indoor and outdoor learning spaces, refurbished arts/music/drama precinct, and gymnasium extension. The upgrade increased school capacity to 1,200 students. Seaton High School is designated as one of South Australia's five Entrepreneurial Specialist Schools.
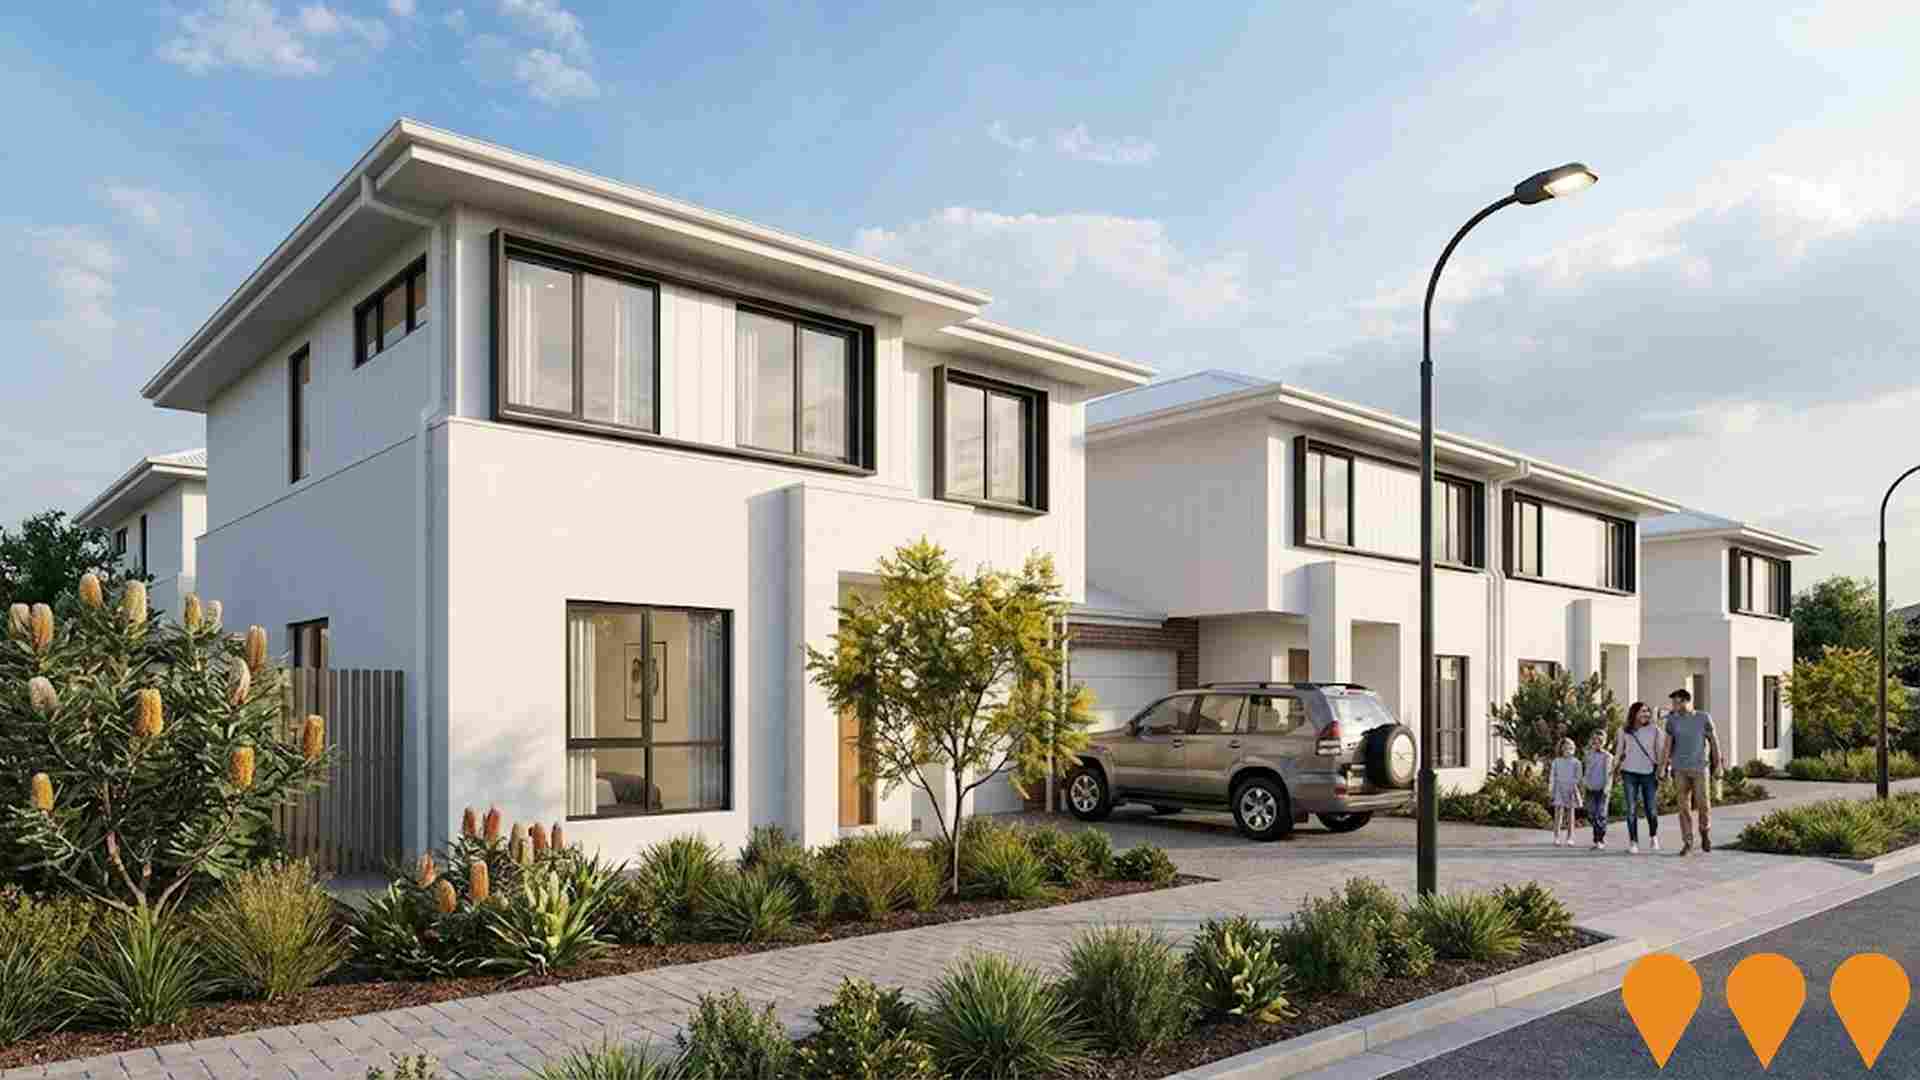
Findon Residential Development
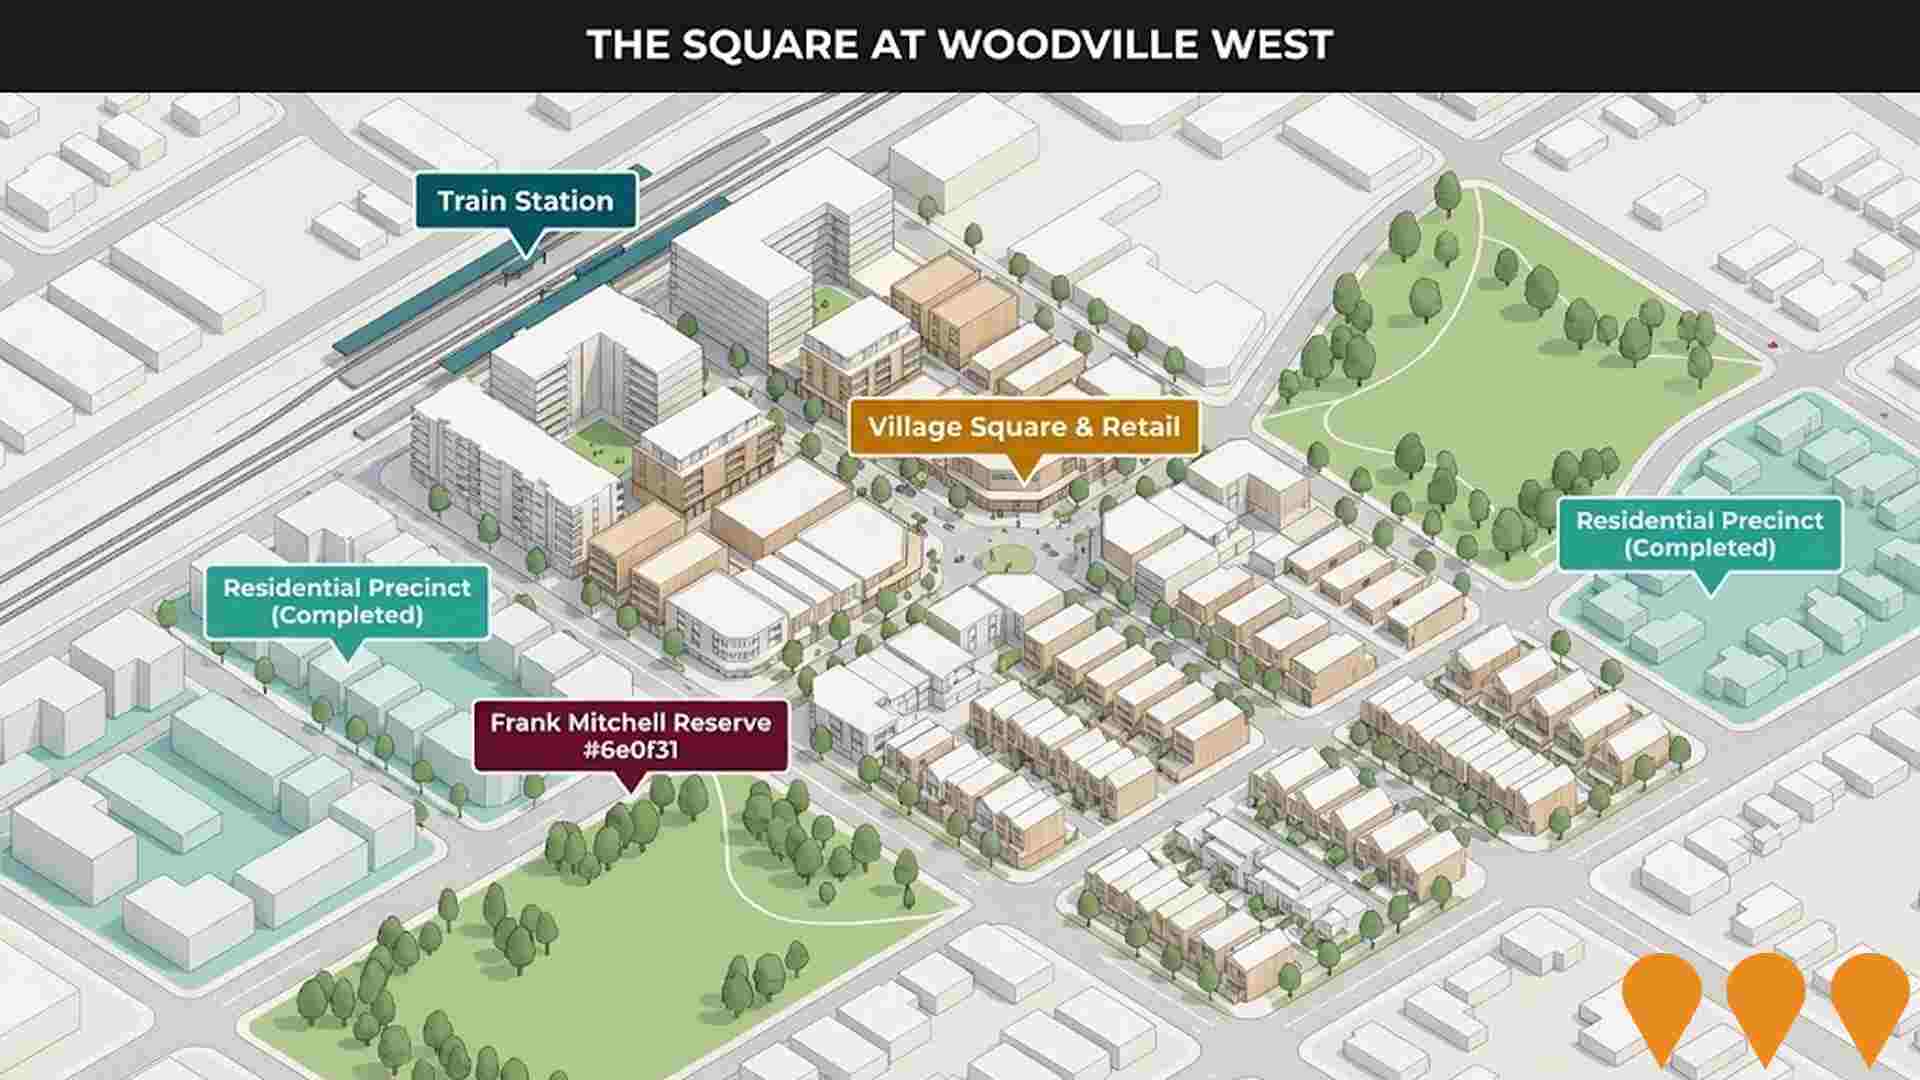
Medium-density residential development providing affordable housing options and supporting local population growth projections.
Employment
AreaSearch analysis indicates Seaton - Grange maintains employment conditions that align with national benchmarks
Seaton - Grange has a skilled workforce with an unemployment rate of 3.9% as of September 2025. In the past year, employment grew by 4.4%.
The area's key industries include health care & social assistance, retail trade, and construction. It shows strong specialization in transport, postal & warehousing (1.4 times the regional level). However, health care & social assistance has limited presence with 16.0% employment compared to 17.7% regionally. Employment opportunities locally may be limited as indicated by Census data.
Over the year to September 2025, employment increased by 4.4% while labour force increased by 4.0%, reducing unemployment rate by 0.3 percentage points. In comparison, Greater Adelaide recorded employment growth of 3.0%. State-level data from 25-Nov shows SA employment grew by 1.19% year-on-year with an unemployment rate of 4.0%. Jobs and Skills Australia's national employment forecasts project a 6.6% increase over five years and 13.7% over ten years. Applying these projections to Seaton - Grange's employment mix suggests local employment should increase by 6.5% over five years and 13.5% over ten years.
Frequently Asked Questions - Employment
Income
Income levels align closely with national averages, indicating typical economic conditions for Australian communities according to AreaSearch analysis
AreaSearch's latest postcode level ATO data for financial year 2022 shows Seaton - Grange SA2 had a median income among taxpayers of $54,613 and an average of $69,520. Both figures are above the national average. Greater Adelaide's median was $52,592 with an average of $64,886. By September 2025, estimated median income would be approximately $61,620 and average $78,439 based on Wage Price Index growth of 12.83% since financial year 2022. Census data indicates household, family, and personal incomes in Seaton - Grange rank modestly, between the 30th and 38th percentiles. Income analysis reveals that 29.3% of locals (5,425 people) fall into the $1,500-$2,999 income bracket, similar to surrounding regions at 31.8%. Housing affordability pressures are severe with only 83.7% of income remaining, ranking at the 30th percentile. The area's SEIFA income ranking places it in the 5th decile.
Frequently Asked Questions - Income
Housing
Seaton - Grange displays a diverse mix of dwelling types, with above-average rates of outright home ownership
In Seaton - Grange, as per the latest Census, 64.6% of dwellings were houses while 35.5% consisted of other types such as semi-detached homes, apartments, and 'other' dwellings. In comparison, Adelaide metro had 66.1% houses and 33.9% other dwellings. Home ownership in Seaton - Grange stood at 35.5%, with mortgaged dwellings at 32.0% and rented ones at 32.5%. The median monthly mortgage repayment was $1,733, aligning with the Adelaide metro average, while the median weekly rent was $320 compared to Adelaide metro's $325. Nationally, Seaton - Grange's mortgage repayments were lower than the Australian average of $1,863, and rents were substantially below the national figure of $375.
Frequently Asked Questions - Housing
Household Composition
Seaton - Grange features high concentrations of lone person households, with a lower-than-average median household size
Family households compose 64.8% of all households, including 25.2% couples with children, 26.4% couples without children, and 11.9% single parent families. Non-family households constitute the remaining 35.2%, with lone person households at 32.2% and group households comprising 3.0%. The median household size is 2.3 people, which is smaller than the Greater Adelaide average of 2.4.
Frequently Asked Questions - Households
Local Schools & Education
Educational attainment in Seaton - Grange aligns closely with national averages, showing typical qualification patterns and performance metrics
University qualification levels in Seaton - Grange stand at 26.1%, slightly below the Australian average of 30.4%. Bachelor degrees are most common at 18.3%, followed by postgraduate qualifications (5.4%) and graduate diplomas (2.4%). Vocational credentials are held by 32.5% of residents aged 15+, with advanced diplomas at 10.5% and certificates at 22.0%.
A total of 24.0% of the population is actively engaged in formal education, including 8.4% in primary, 5.7% in secondary, and 5.0% in tertiary education.
Frequently Asked Questions - Education
Schools Detail
Nearby Services & Amenities
Transport
Transport servicing is moderate compared to other areas nationally based on assessment of service frequency, route connectivity and accessibility
Seaton-Grange has 87 active public transport stops, served by a mix of trains and buses. These stops are connected by 37 routes that facilitate 2,153 weekly passenger trips in total. Residents enjoy good accessibility to these services, with an average distance of 202 meters to the nearest stop.
The service frequency across all routes is 307 trips per day, which translates to approximately 24 weekly trips per individual stop.
Frequently Asked Questions - Transport
Transport Stops Detail
Health
Health performance in Seaton - Grange is lower than average with prevalence of common health conditions notable across both younger and older age cohorts
Seaton - Grange faces significant health challenges, with common health conditions notably prevalent across both younger and older age cohorts.
The rate of private health cover stands at approximately 54% of the total population (~10,072 people). The most common medical conditions in the area are arthritis and mental health issues, affecting 9.5% and 8.1% of residents respectively. Meanwhile, 66.8% of residents declare themselves completely clear of medical ailments, compared to 68.9% across Greater Adelaide. As of 2021, 23.2% of residents are aged 65 and over (4,290 people), which is higher than the 20.0% figure in Greater Adelaide. Health outcomes among seniors present some challenges, broadly in line with the general population's health profile.
Frequently Asked Questions - Health
Cultural Diversity
The level of cultural diversity witnessed in Seaton - Grange was found to be above average when compared nationally for a number of language and cultural background related metrics
Seaton-Grange has a higher cultural diversity than most local markets, with 27.6% of its population born overseas and 24.5% speaking a language other than English at home. Christianity is the predominant religion in Seaton-Grange, accounting for 55.4% of its population. The 'Other' religious category comprises 1.9% of Seaton-Grange's population, slightly higher than Greater Adelaide's 1.8%.
In terms of ancestry, the top three groups are English (23.4%), Australian (20.6%), and Italian (12.8%). Notably, Serbian (1.4%) is overrepresented compared to the regional average of 1.3%, while Polish (1.3%) and Greek (4.2%) show slight underrepresentation compared to their respective regional averages of 1.4% and 4.7%.
Frequently Asked Questions - Diversity
Age
Seaton - Grange's median age exceeds the national pattern
The median age in Seaton-Grange is 43 years, which is significantly higher than Greater Adelaide's average of 39 years and Australia's average of 38 years. Compared to Greater Adelaide, Seaton-Grange has a higher proportion of residents aged 65-74 (11.5%) but fewer residents aged 15-24 (9.8%). According to the 2021 Census, the age group of 35 to 44 has increased from 12.2% to 13.8% of the population, while the 45 to 54 age group has declined from 12.4% to 11.3%. By 2041, demographic projections show significant shifts in Seaton-Grange's age structure. The 75 to 84 age group is projected to grow by 41%, reaching 2,119 people from 1,507. Notably, the combined age groups of 65 and above will account for 65% of total population growth, reflecting the area's aging demographic profile. In contrast, both the 0 to 4 and 25 to 34 age groups are projected to decrease in numbers.
