Chart Color Schemes
This analysis uses ABS Statistical Areas Level 2 (SA2) boundaries, which can materially differ from Suburbs and Localities (SAL) even when sharing similar names.
SA2 boundaries are defined by the Australian Bureau of Statistics and are designed to represent communities for statistical reporting (e.g., census and ERP).
Suburbs and Localities (SAL) represent commonly-used suburb/locality names (postal-style areas) and may use different geographic boundaries. For comprehensive analysis, consider reviewing both boundary types if available.
est. as @ -- *
ABS ERP | -- people | --
2021 Census | -- people
Sales Activity
Curious about local property values? Filter the chart to assess the volume and appreciation (including resales) trends and regional comparisons, or scroll to the map below view this information at an individual property level.
Find a Recent Sale
Sales Detail
Population
Population growth drivers in Flinders Park are strong compared to national averages based on AreaSearch's ranking of recent, and medium to long-term trends
As of November 2025, Flinders Park's population is approximately 18,195, showing an increase of 1,834 people since the 2021 Census. The 2021 Census recorded a population of 16,361 in Flinders Park. This growth was inferred from ABS estimated resident population data of 17,783 as of June 2024 and an additional 505 validated new addresses since the Census date. This results in a population density of 2,843 persons per square kilometer, placing Flinders Park in the upper quartile nationally according to AreaSearch's assessments. Flinders Park's 11.2% growth from the 2021 census surpassed both the state (7.1%) and metropolitan area averages, positioning it as a region growth leader. Overseas migration contributed approximately 50.1% of overall population gains during recent periods, though all drivers including interstate migration and natural growth were positive factors.
AreaSearch adopts ABS/Geoscience Australia projections for each SA2 area released in 2024 with a base year of 2022. For areas not covered by this data and years post-2032, the SA State Government's Regional/LGA projections by age category are used, based on 2021 data and released in 2023, with adjustments made via weighted aggregation from LGA to SA2 levels. Projected demographic shifts indicate above median population growth for national areas. By 2041, Flinders Park is projected to increase by 4,045 persons, reflecting a total increase of 20.0% over the 17-year period, based on the latest annual ERP population numbers.
Frequently Asked Questions - Population
Development
The level of residential development activity in Flinders Park was found to be higher than 90% of real estate markets across the country
Flinders Park has averaged approximately 150 new dwelling approvals per year. Between FY-21 and FY-25, a total of 752 homes were approved, with an additional 137 approved so far in FY-26. Each dwelling built over the past five financial years has attracted an average of 2.6 new residents annually, indicating strong demand that supports property values.
The average expected construction cost value for new homes is $252,000. In terms of commercial development, $10.7 million in approvals have been recorded this financial year, demonstrating consistent investment activity. Compared to Greater Adelaide, Flinders Park maintains similar development levels per capita, contributing to market stability aligned with regional trends.
New developments consist of 67% detached houses and 33% attached dwellings, offering a range of housing types from spacious family homes to more affordable compact options. With approximately 137 people per dwelling approval, Flinders Park exhibits characteristics of a growth area. According to the latest AreaSearch quarterly estimate, the population is projected to increase by 3,633 residents by 2041. Given current development patterns, new housing supply should meet demand effectively, presenting favorable conditions for buyers and potentially facilitating further population growth beyond existing projections.
Frequently Asked Questions - Development
Infrastructure
Flinders Park has limited levels of nearby infrastructure activity, ranking in the 10thth percentile nationally
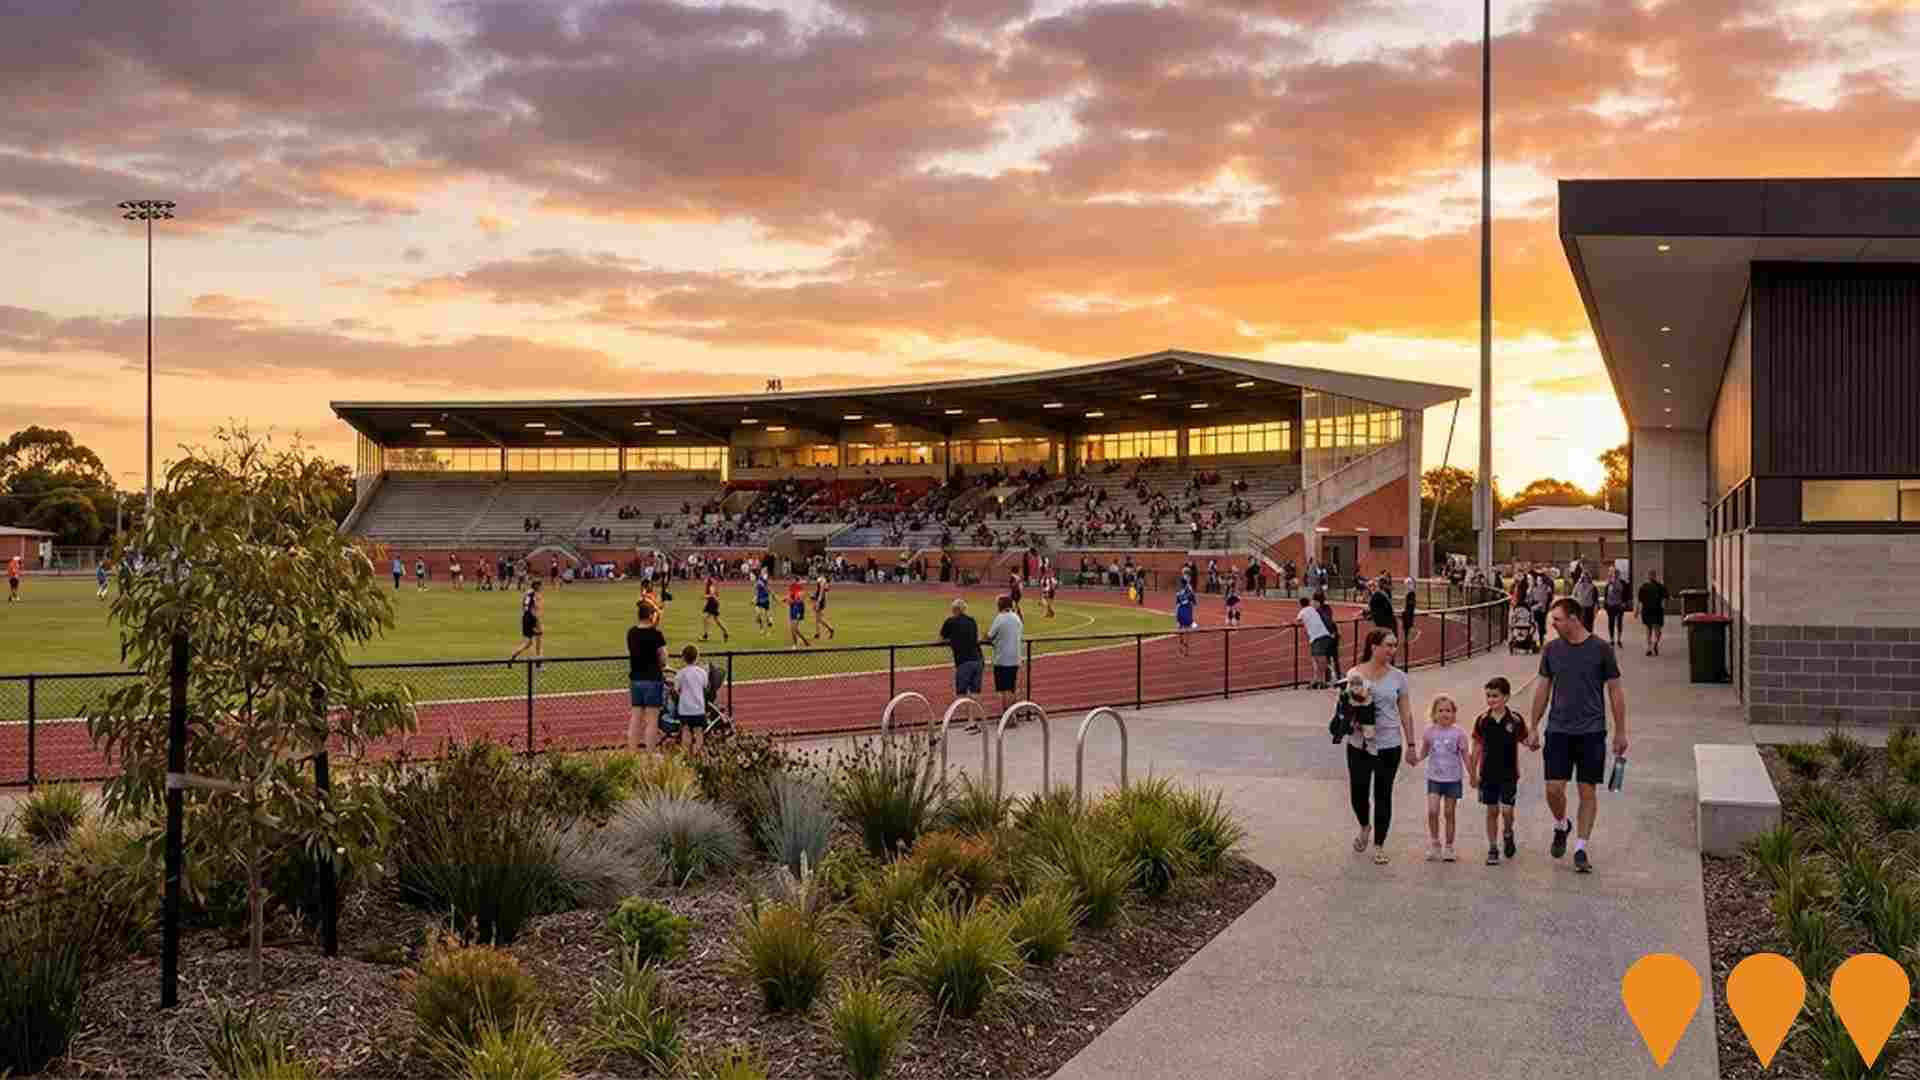
Changes to local infrastructure significantly impact an area's performance. AreaSearch has identified 14 projects likely to affect the area. Notable ones include Gleneagles Reserve Stormwater Management & Reserve Upgrade, TPW20-0238 Glengarry Street, Woodville South Water Main, Findon High School Upgrade, and Findon Sports Complex Redevelopment. The following list details those most relevant.
Professional plan users can use the search below to filter and access additional projects.
INFRASTRUCTURE SEARCH
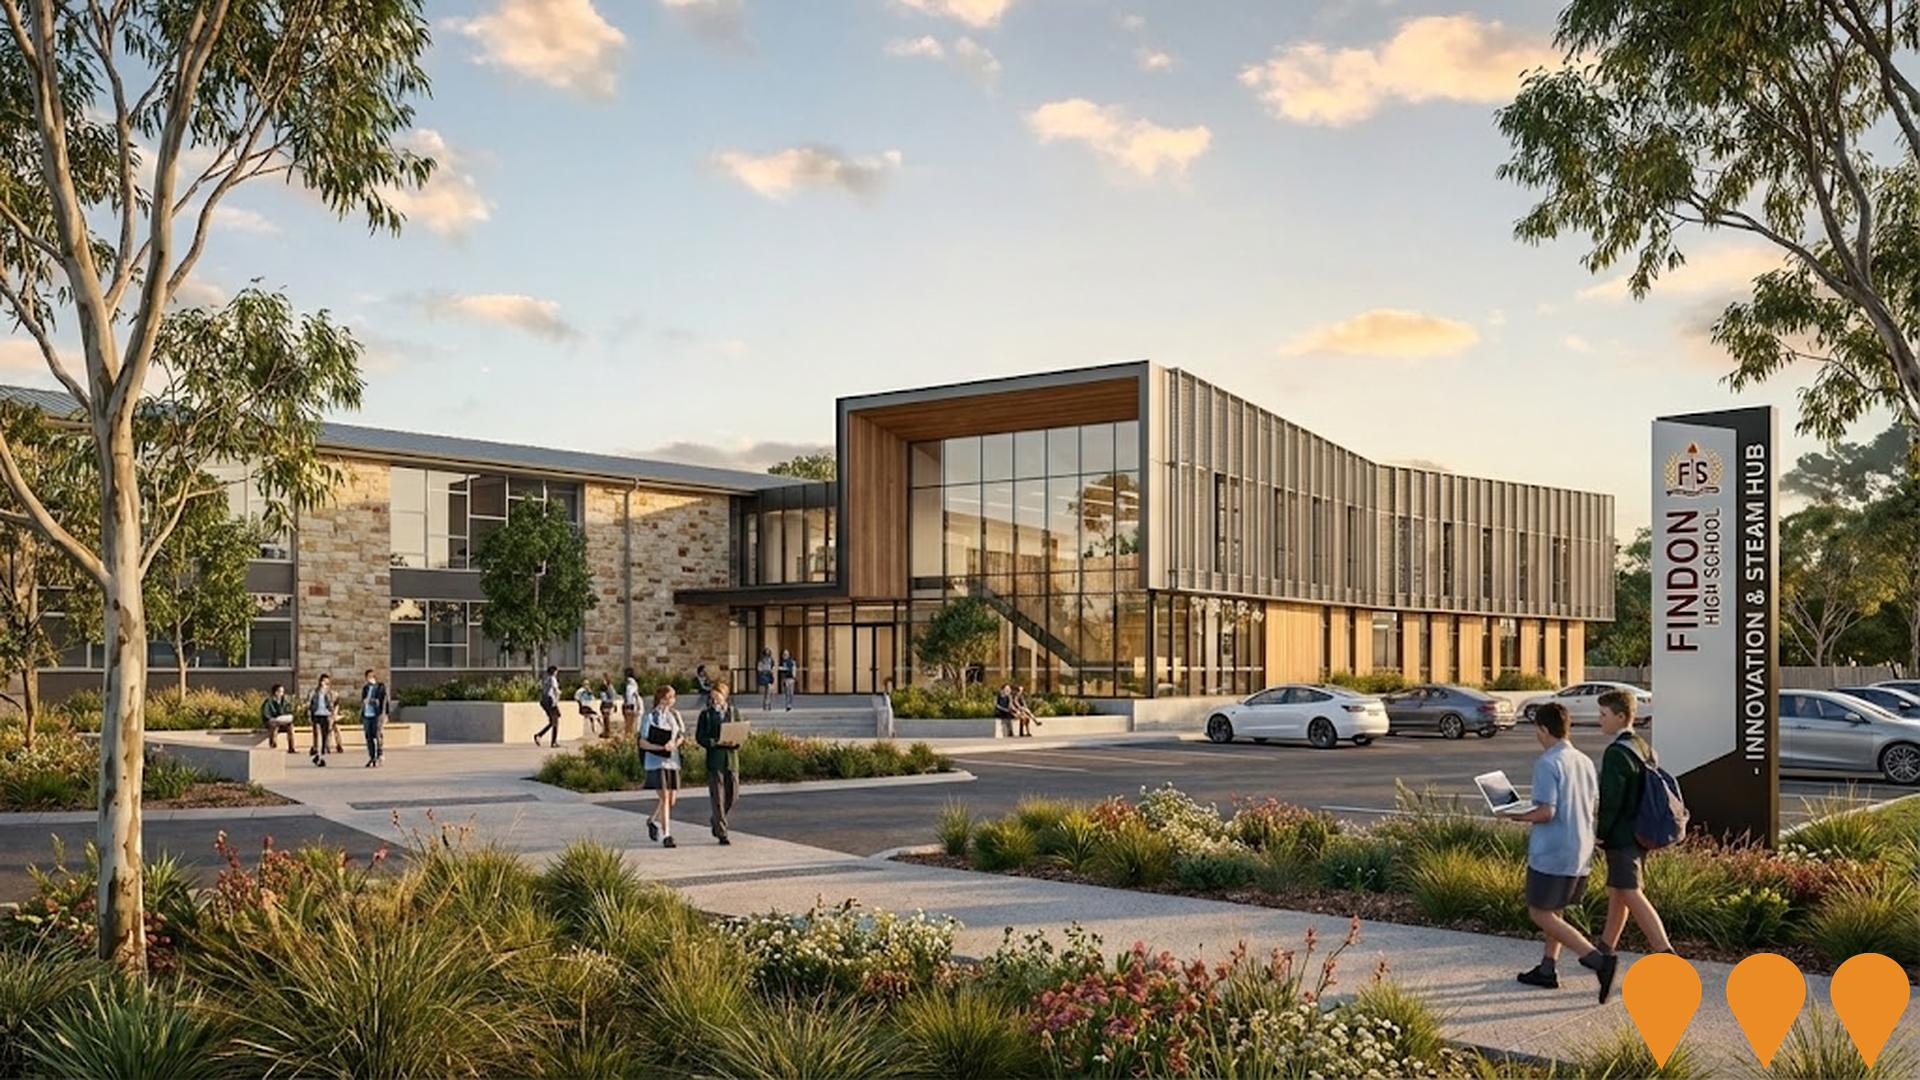
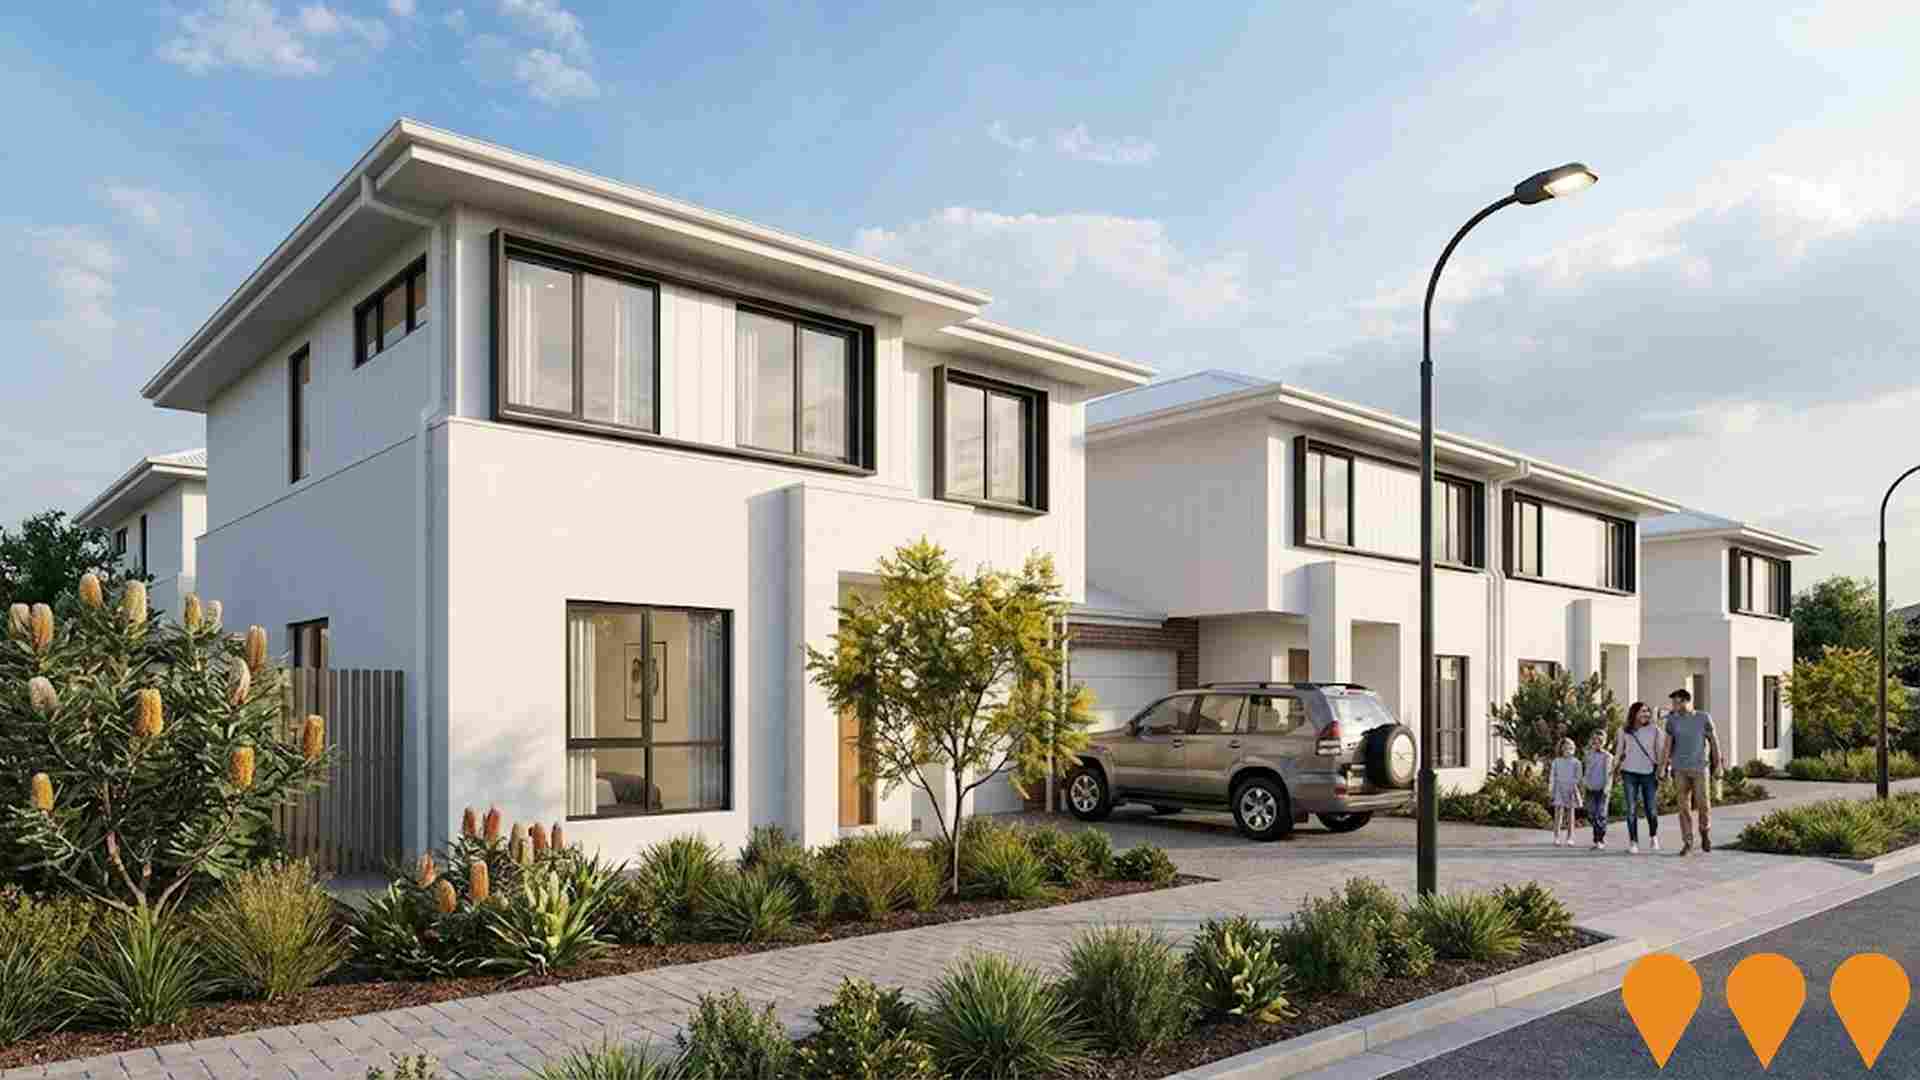
 Denotes AI-based impression for illustrative purposes only, not to be taken as definitive under any circumstances. Please follow links and conduct other investigations from the project's source for actual imagery. Developers and project owners wishing us to use original imagery please Contact Us and we will do so.
Frequently Asked Questions - Infrastructure
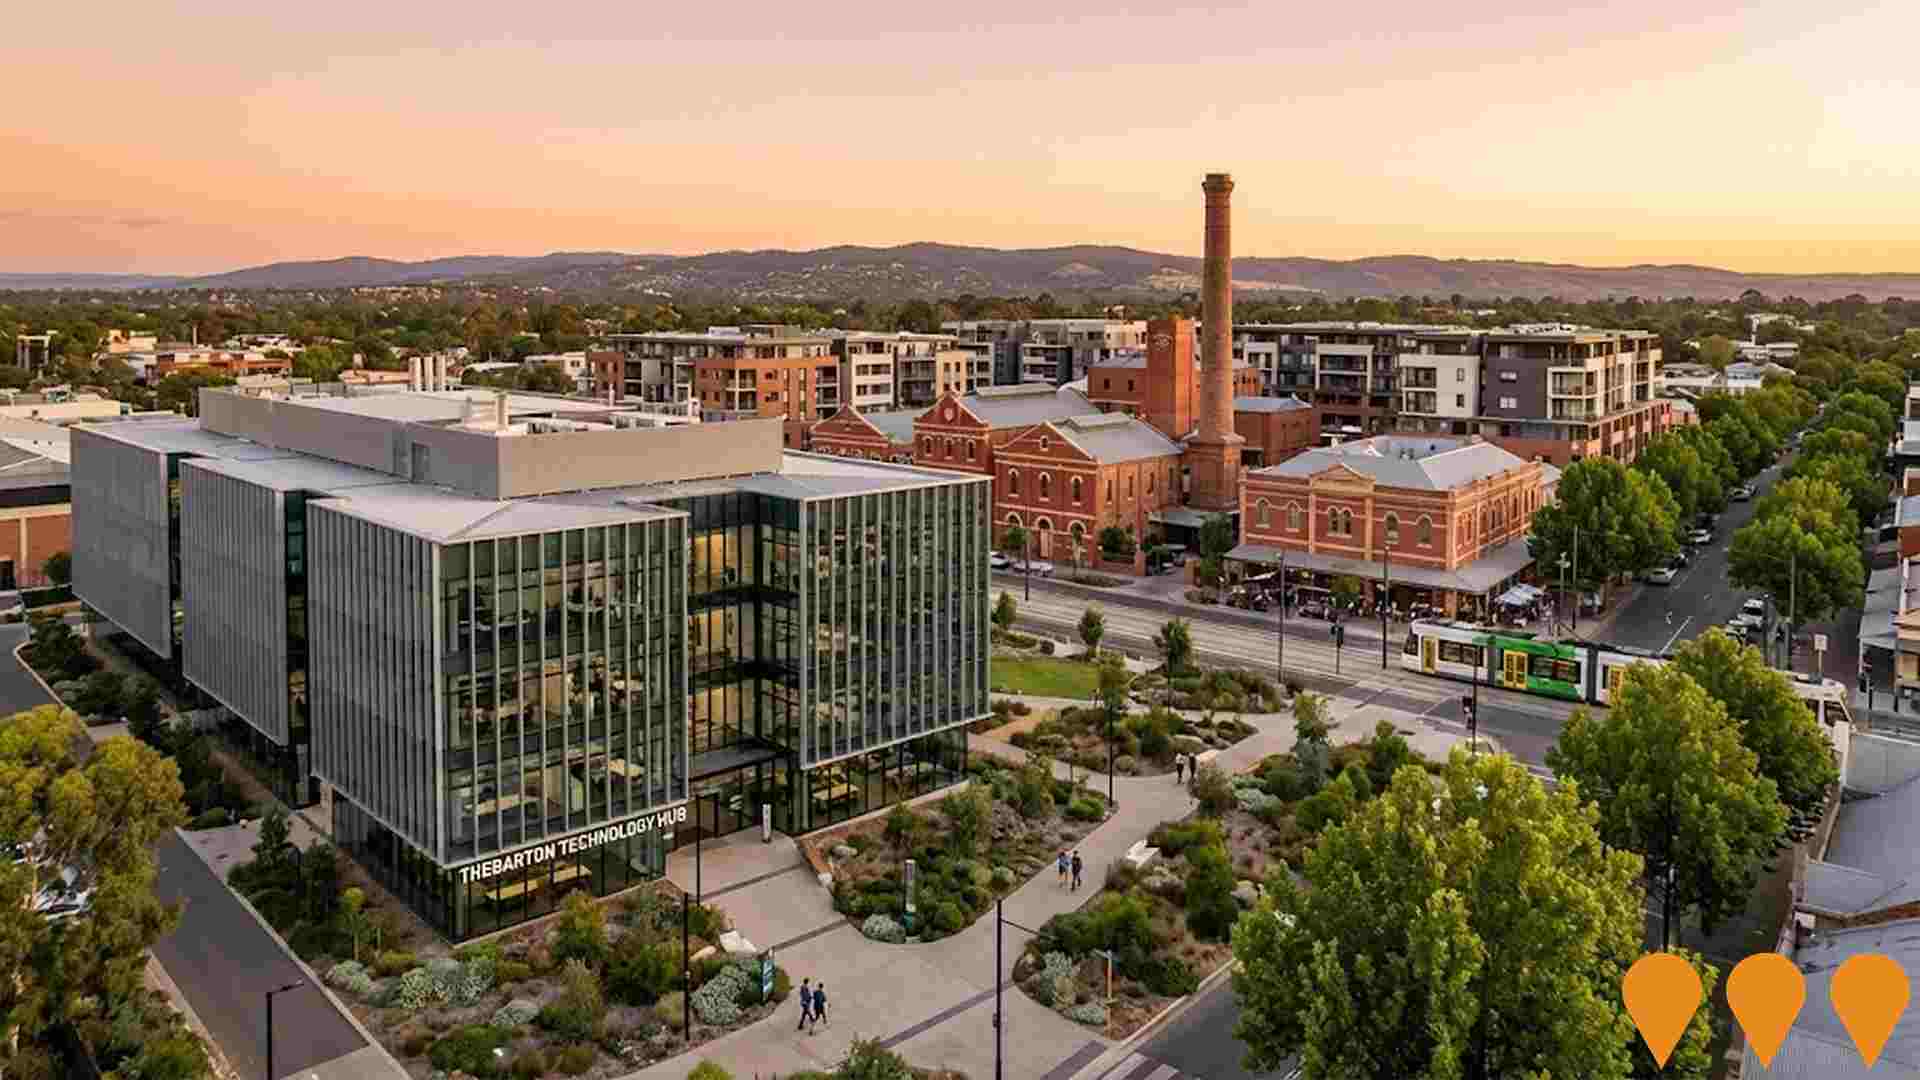
Thebarton Technology Hub
A key development for the City of West Torrens, focusing on attracting and growing bioscience, technology, and advanced manufacturing companies. The broader area includes the University of Adelaide's Thebarton Campus. The City of West Torrens' Economic Development Plan supports the investigation of establishing a digital hub and fast broadband to industrial precincts. The former West End Brewery site (now called Southwark Grounds) is undergoing a major $1 billion mixed-use masterplan by Renewal SA, with construction expected to start in mid-2025.
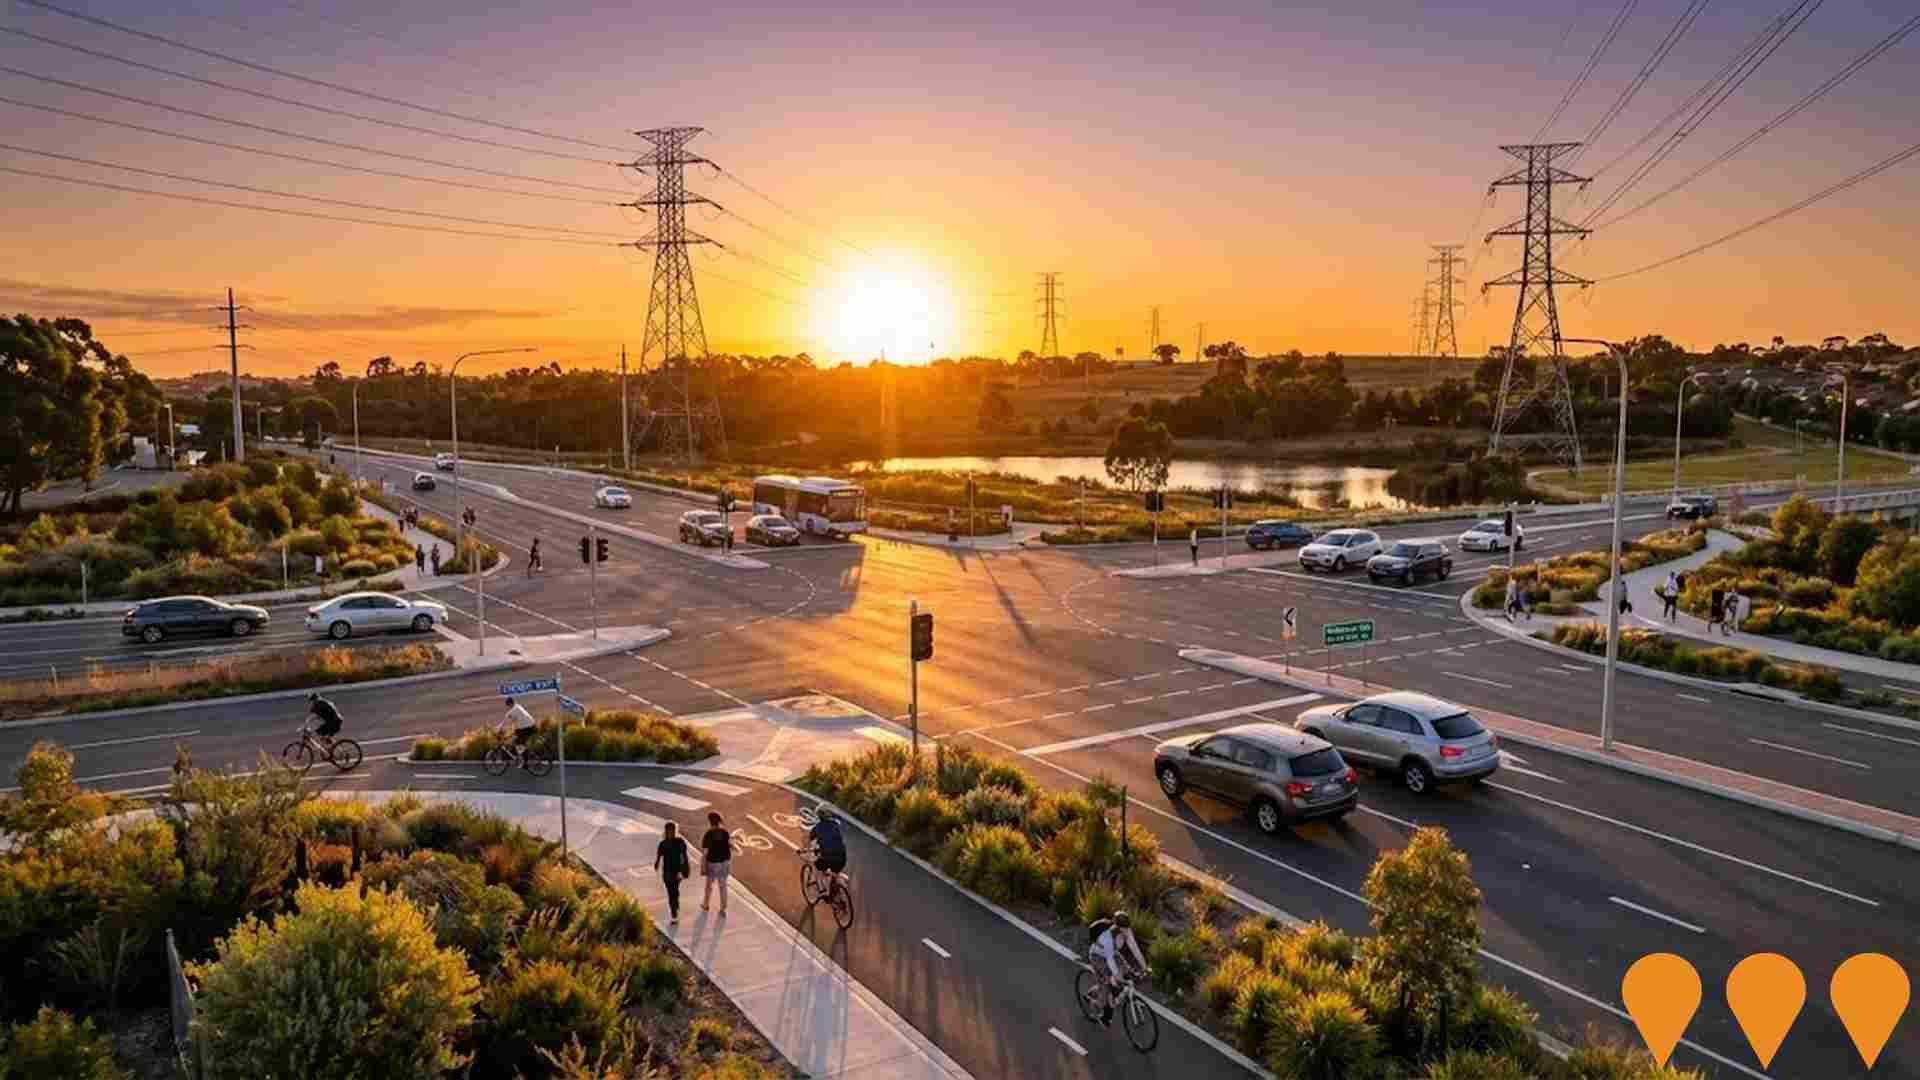
Findon Road Upgrade
Major road infrastructure upgrade including intersection improvements, cycling infrastructure, and public transport enhancements along Findon Road corridor.
Henley Beach Road Visioning Project
City of West Torrens long-term main street renewal for a ~3 km corridor between Airport Road and the Bakewell Underpass. Council adopted the final Vision and Guiding Principles in Dec 2024 and is now developing action and project plans, with staged implementation and pilot projects to test streetscape, transport and dining precinct upgrades.
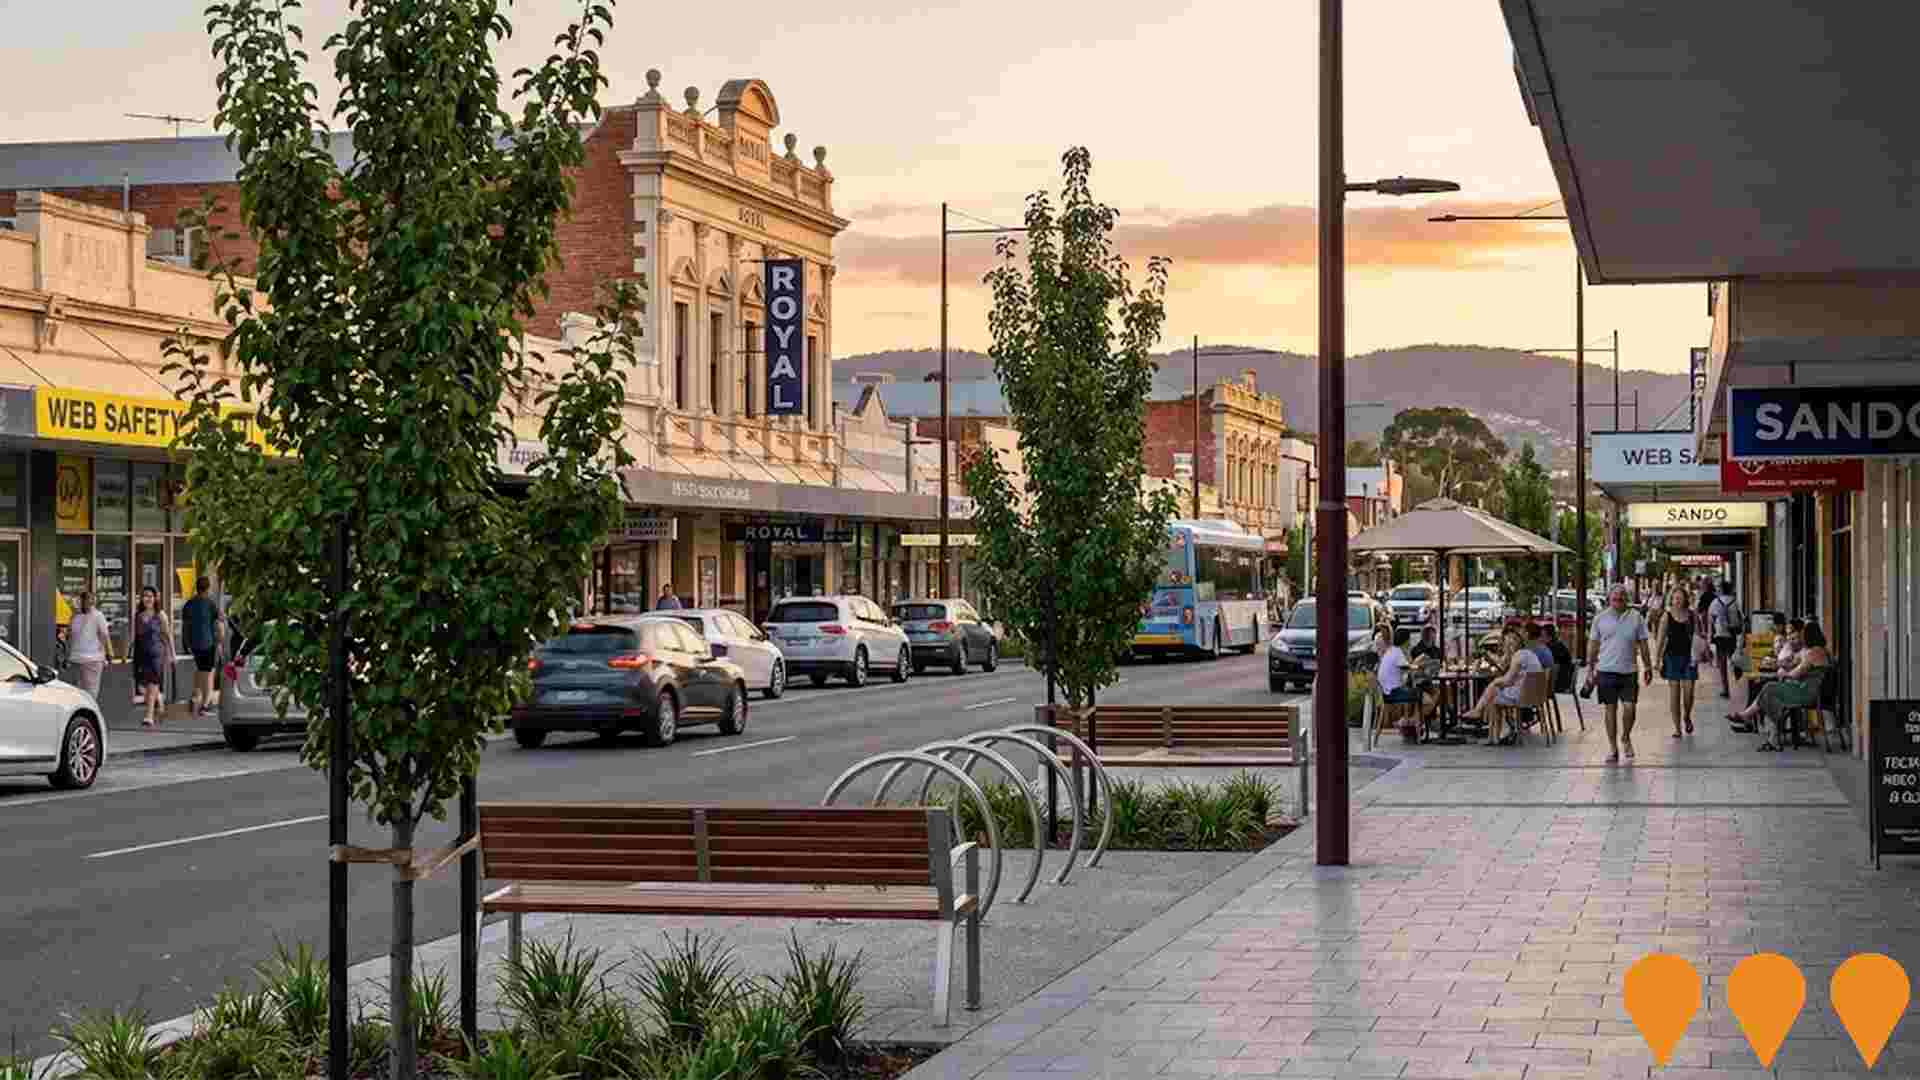
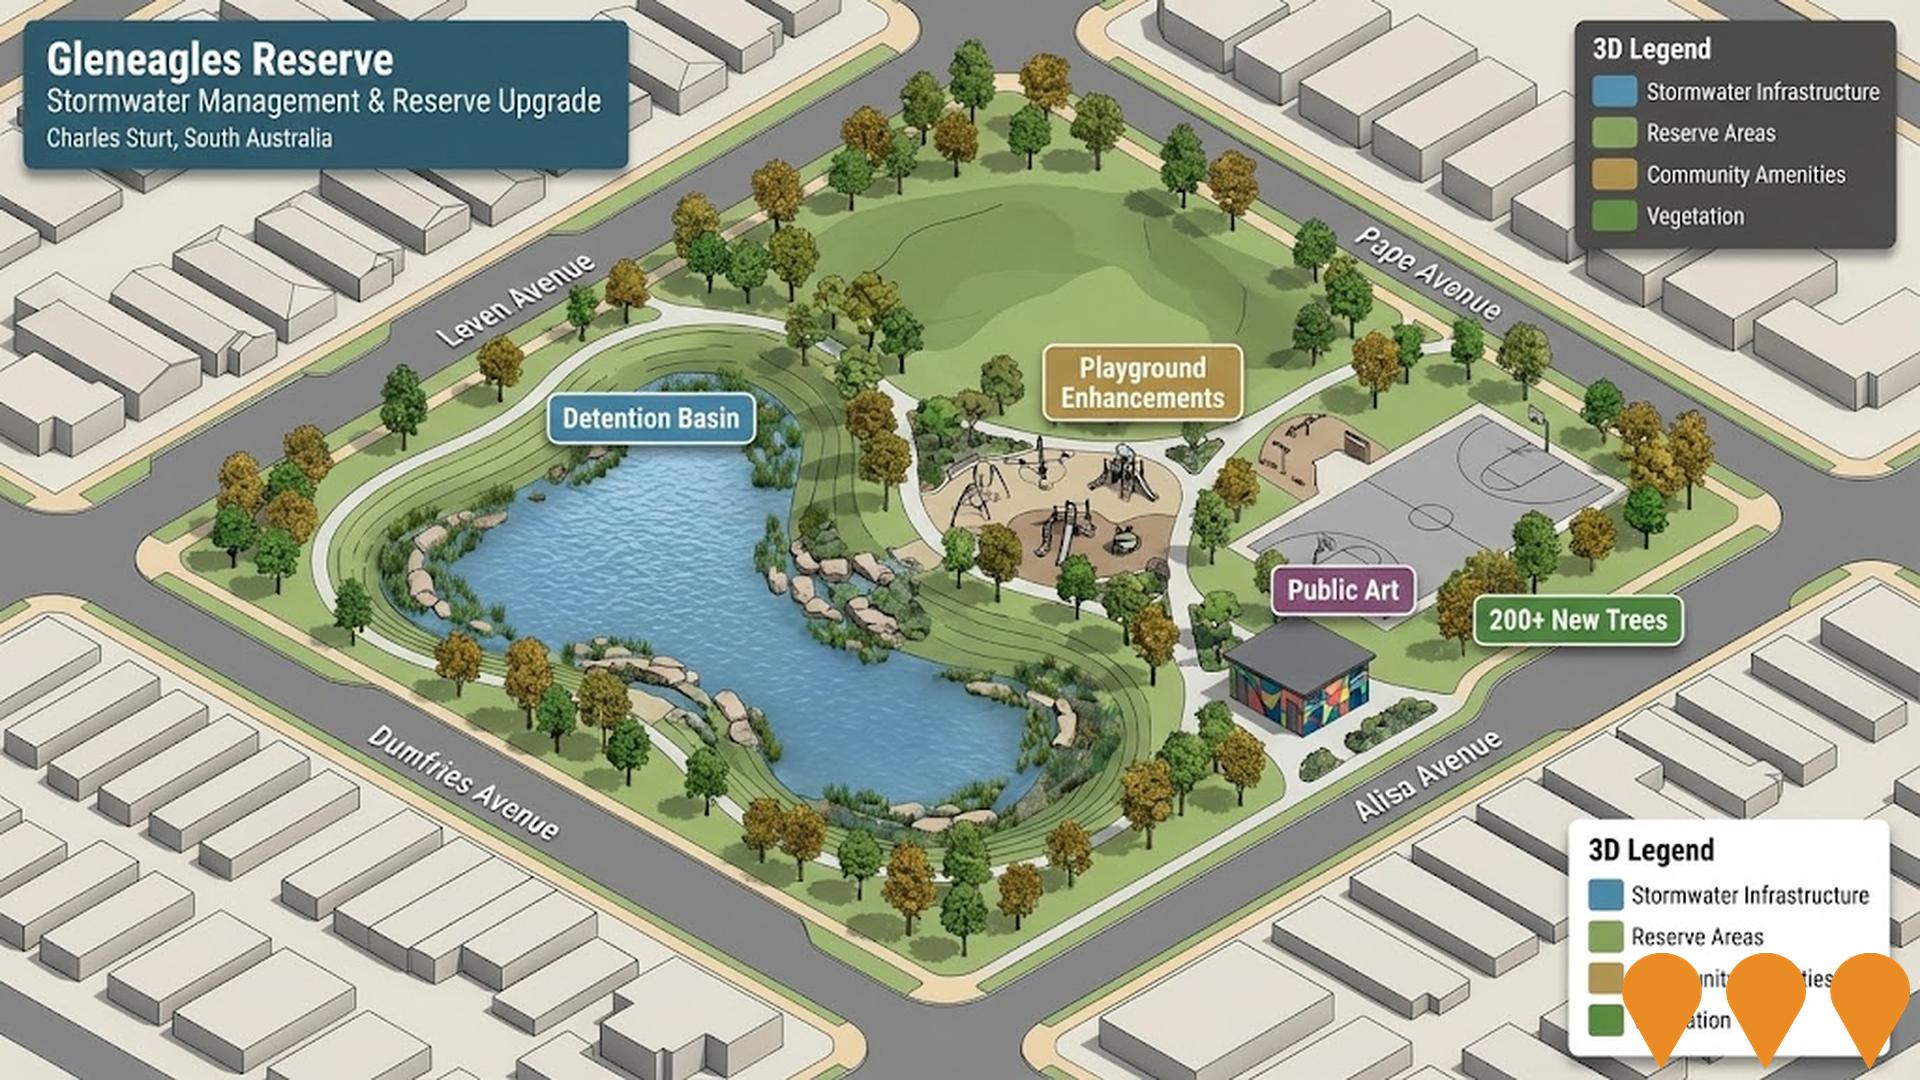
Gleneagles Reserve Stormwater Management & Reserve Upgrade
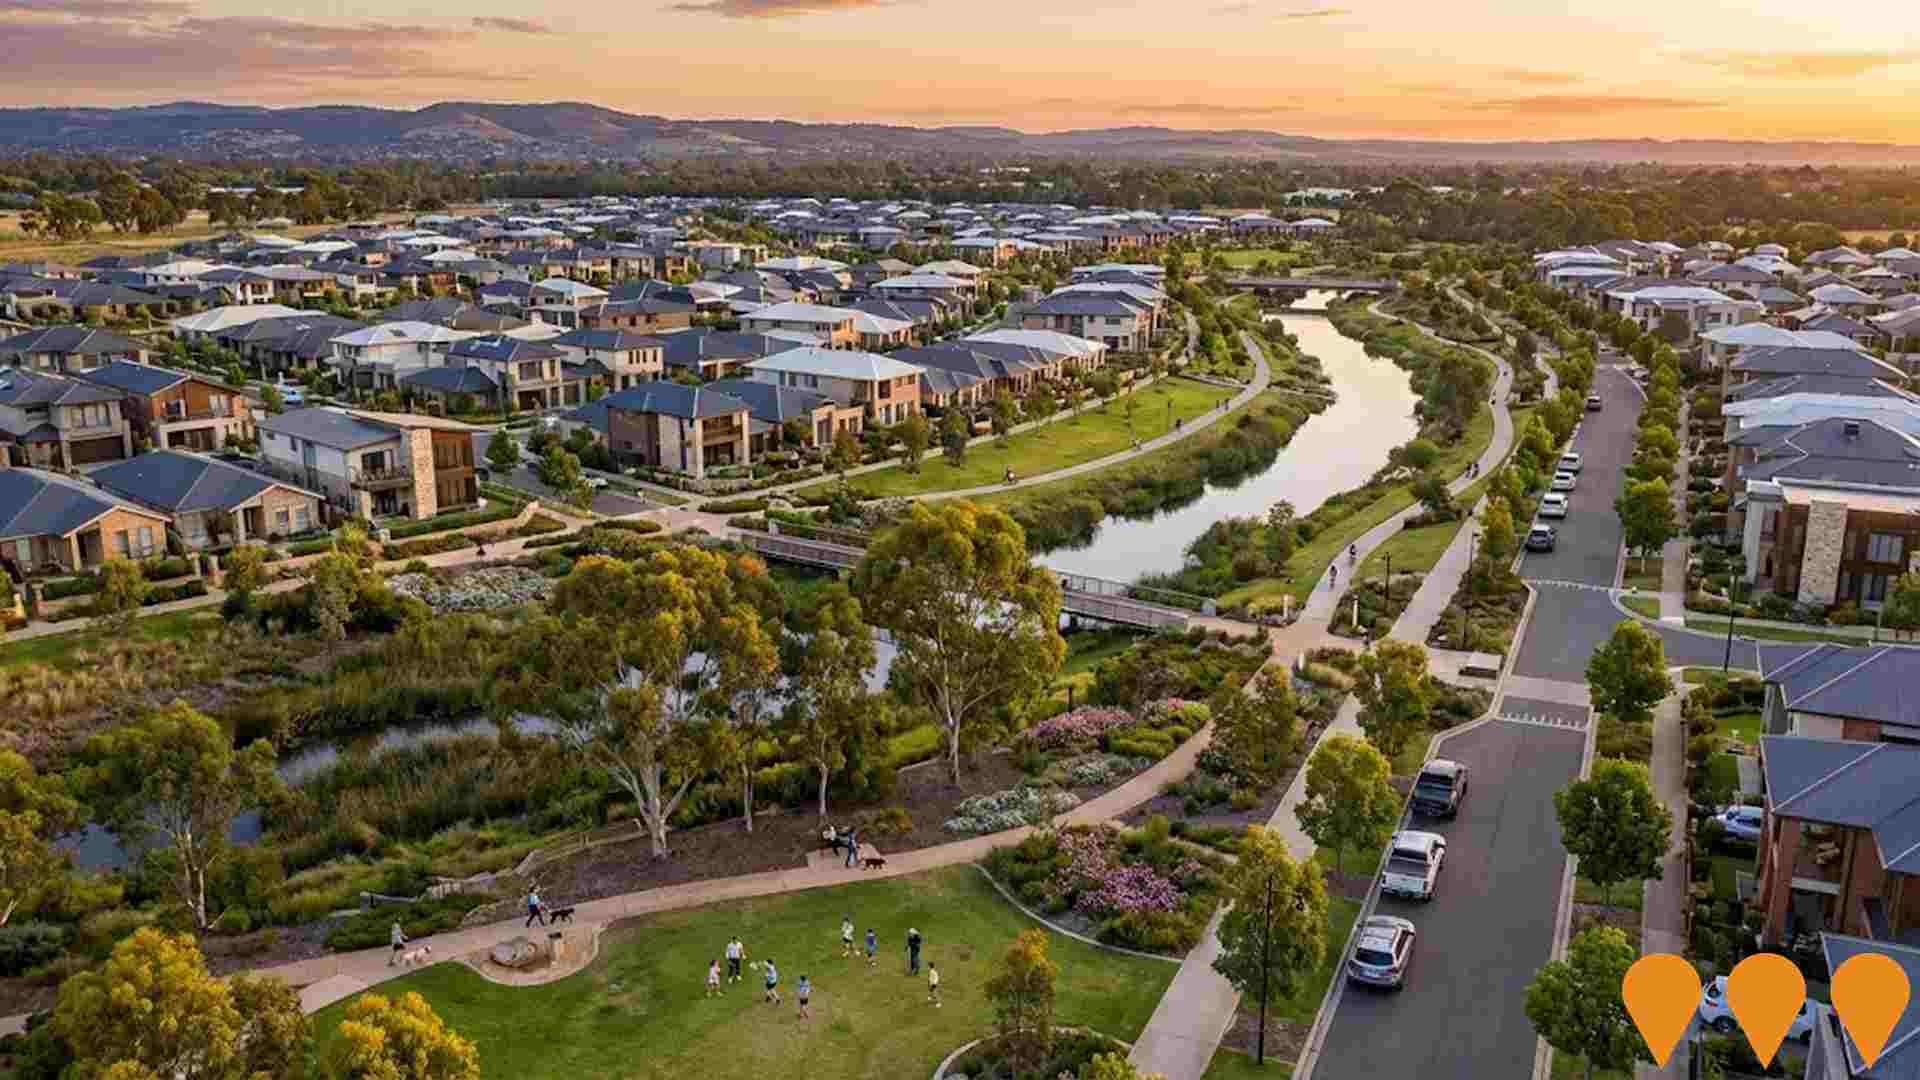
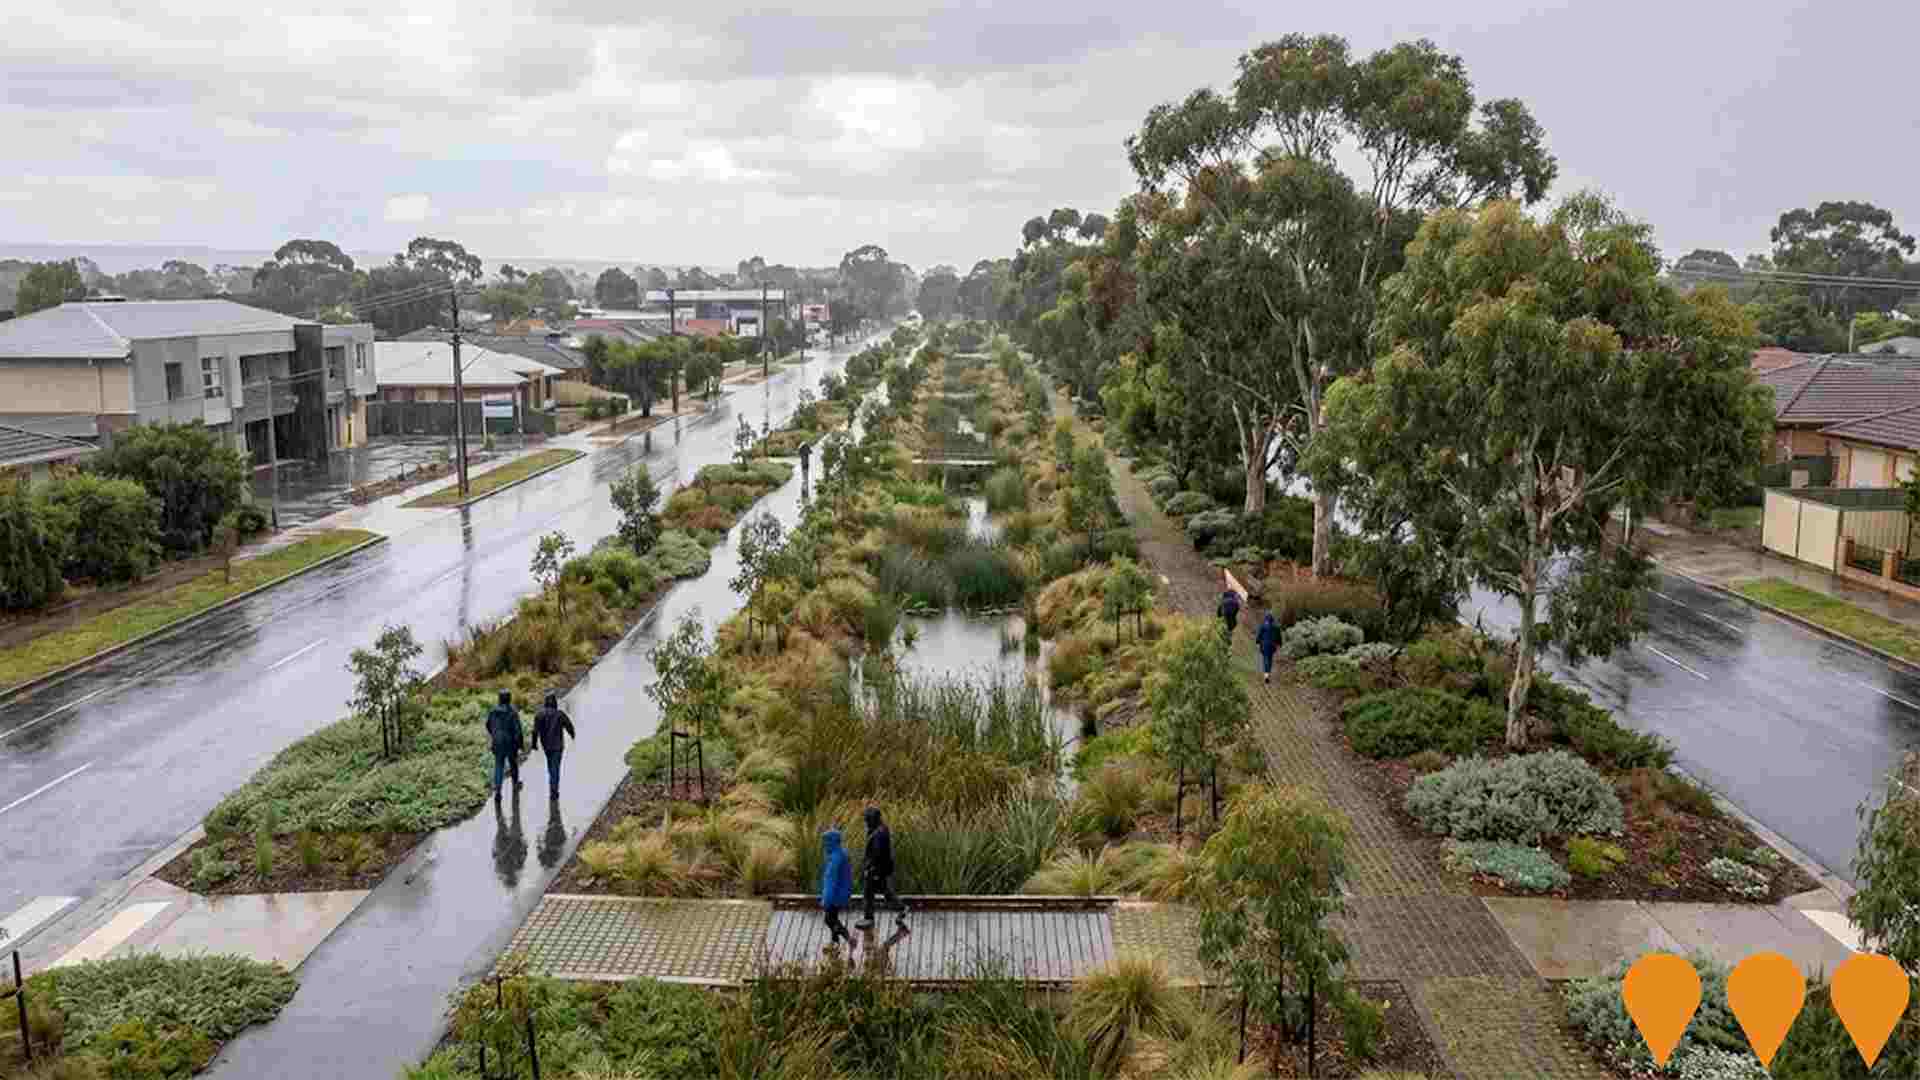
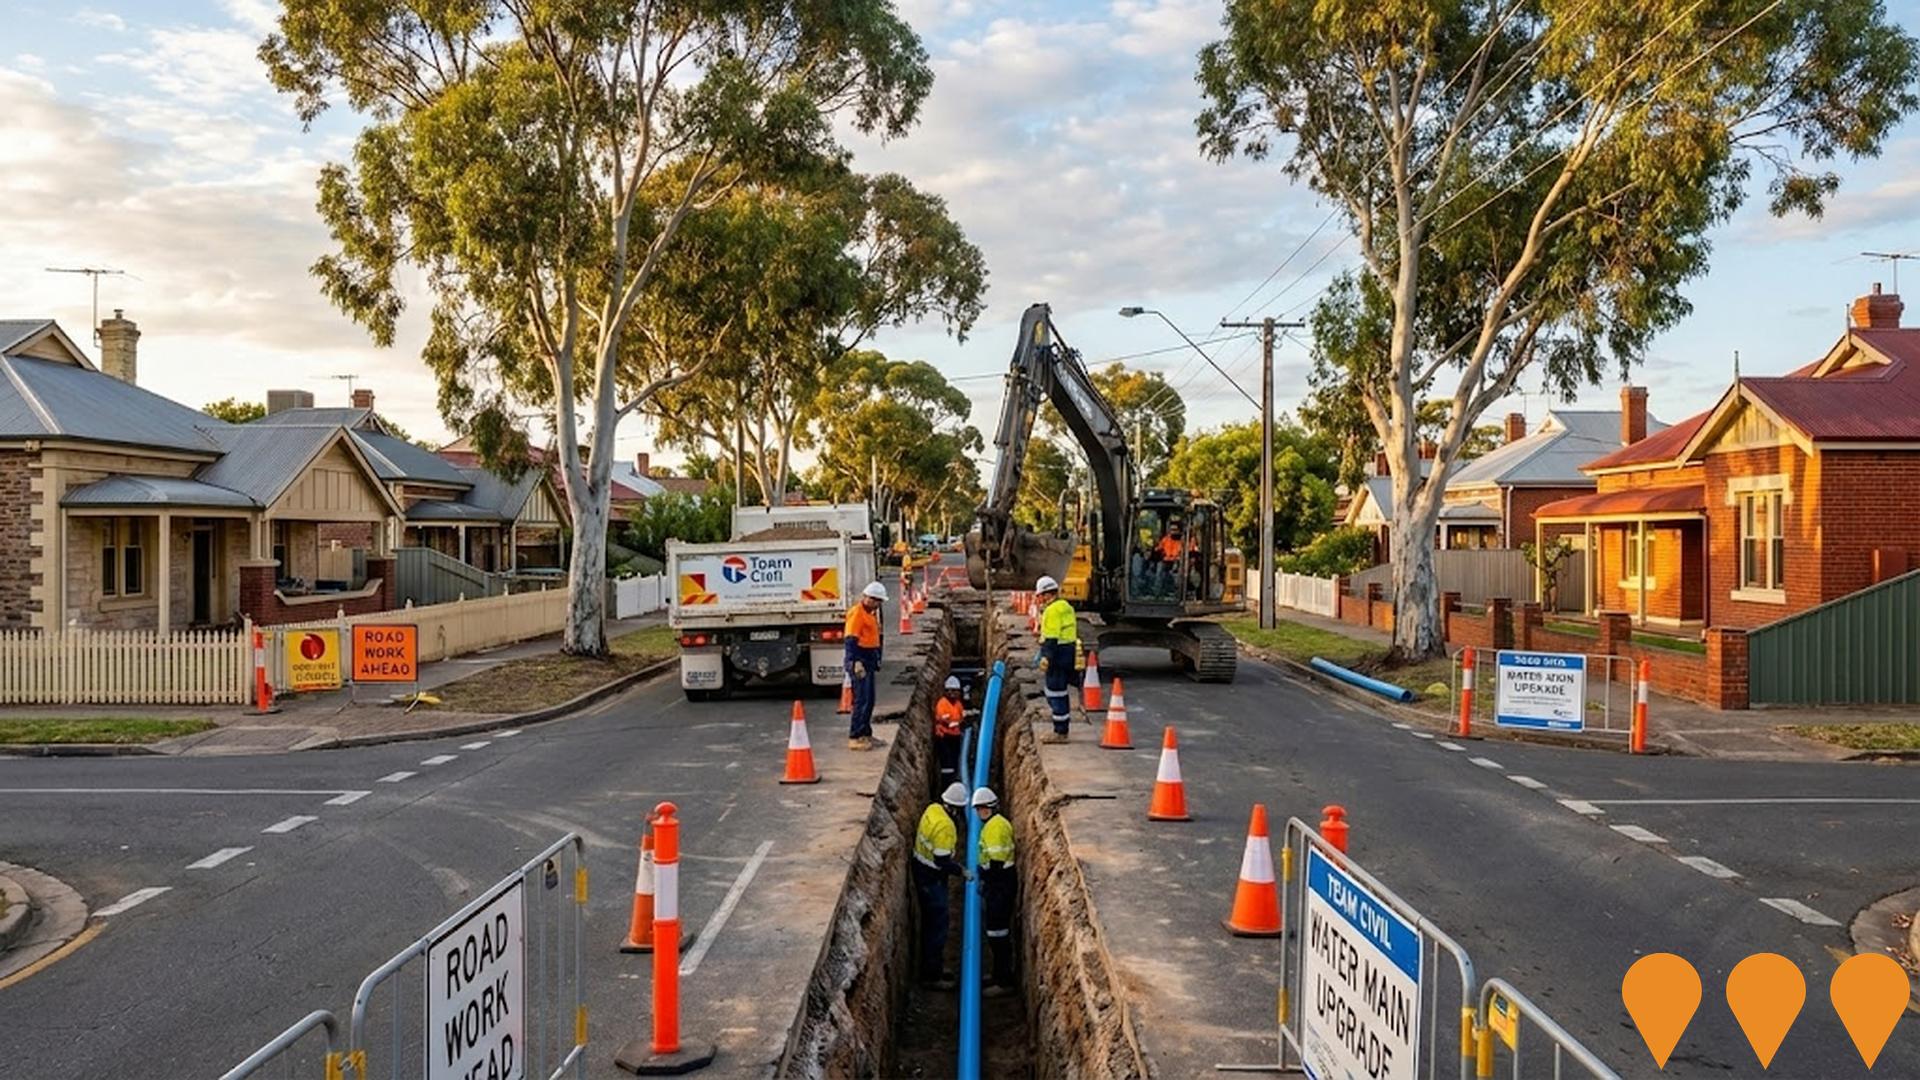
Multi-stage stormwater detention basin project to manage flooding in the Meakin Terrace sub-catchment, reducing flood risk for surrounding streets including Leven Avenue, Tapleys Hill Road, Wilford and Prior Avenues. The stormwater infrastructure is now complete with over 200 trees planted. Stage 2 reserve upgrades will commence October 2025, featuring enhanced community amenities, public toilet artwork by artist Cat Dean, and improvements reflecting community feedback priorities including playground enhancements and expanded recreational facilities.
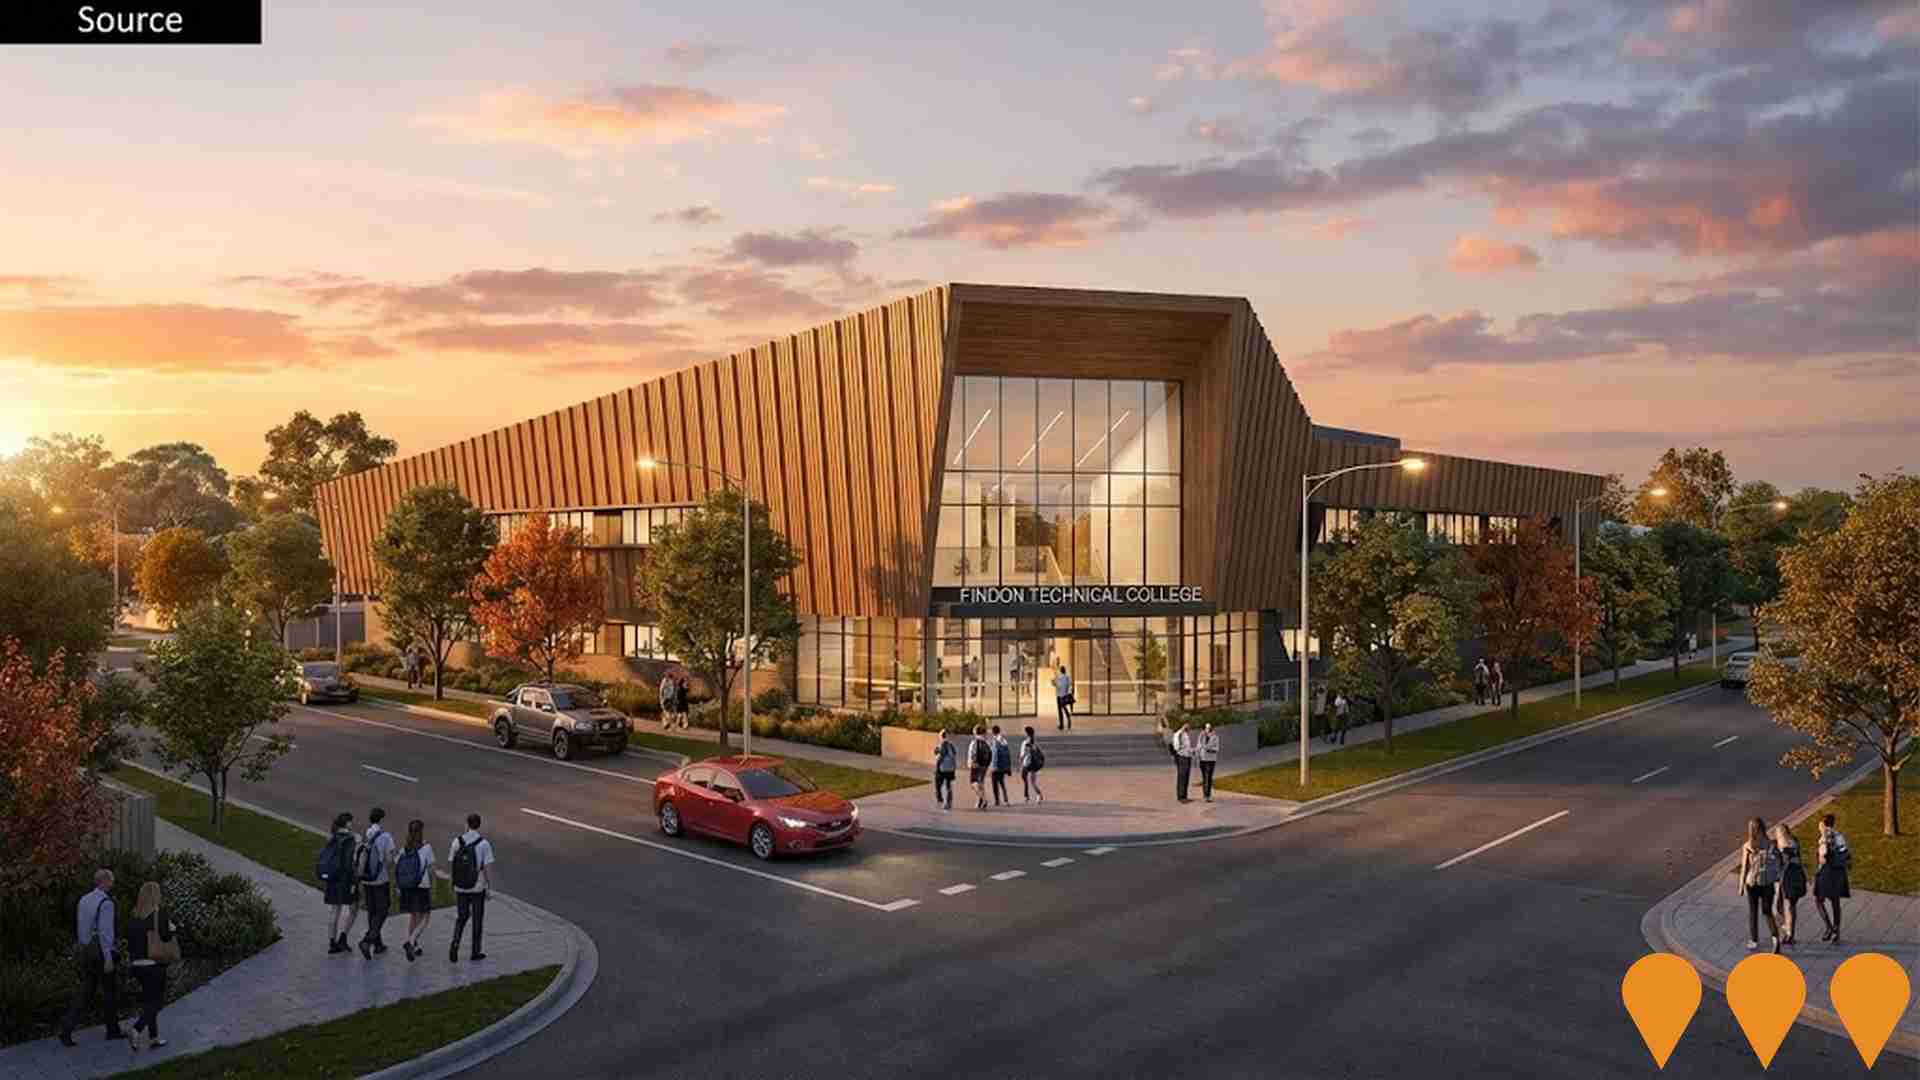
Findon Technical College
Multi-million-dollar technical college focused on advanced manufacturing, early childhood care and health. Part of $208.8 million commitment to build five technical colleges across South Australia. Includes $10 million in infrastructure upgrades to Findon High School.
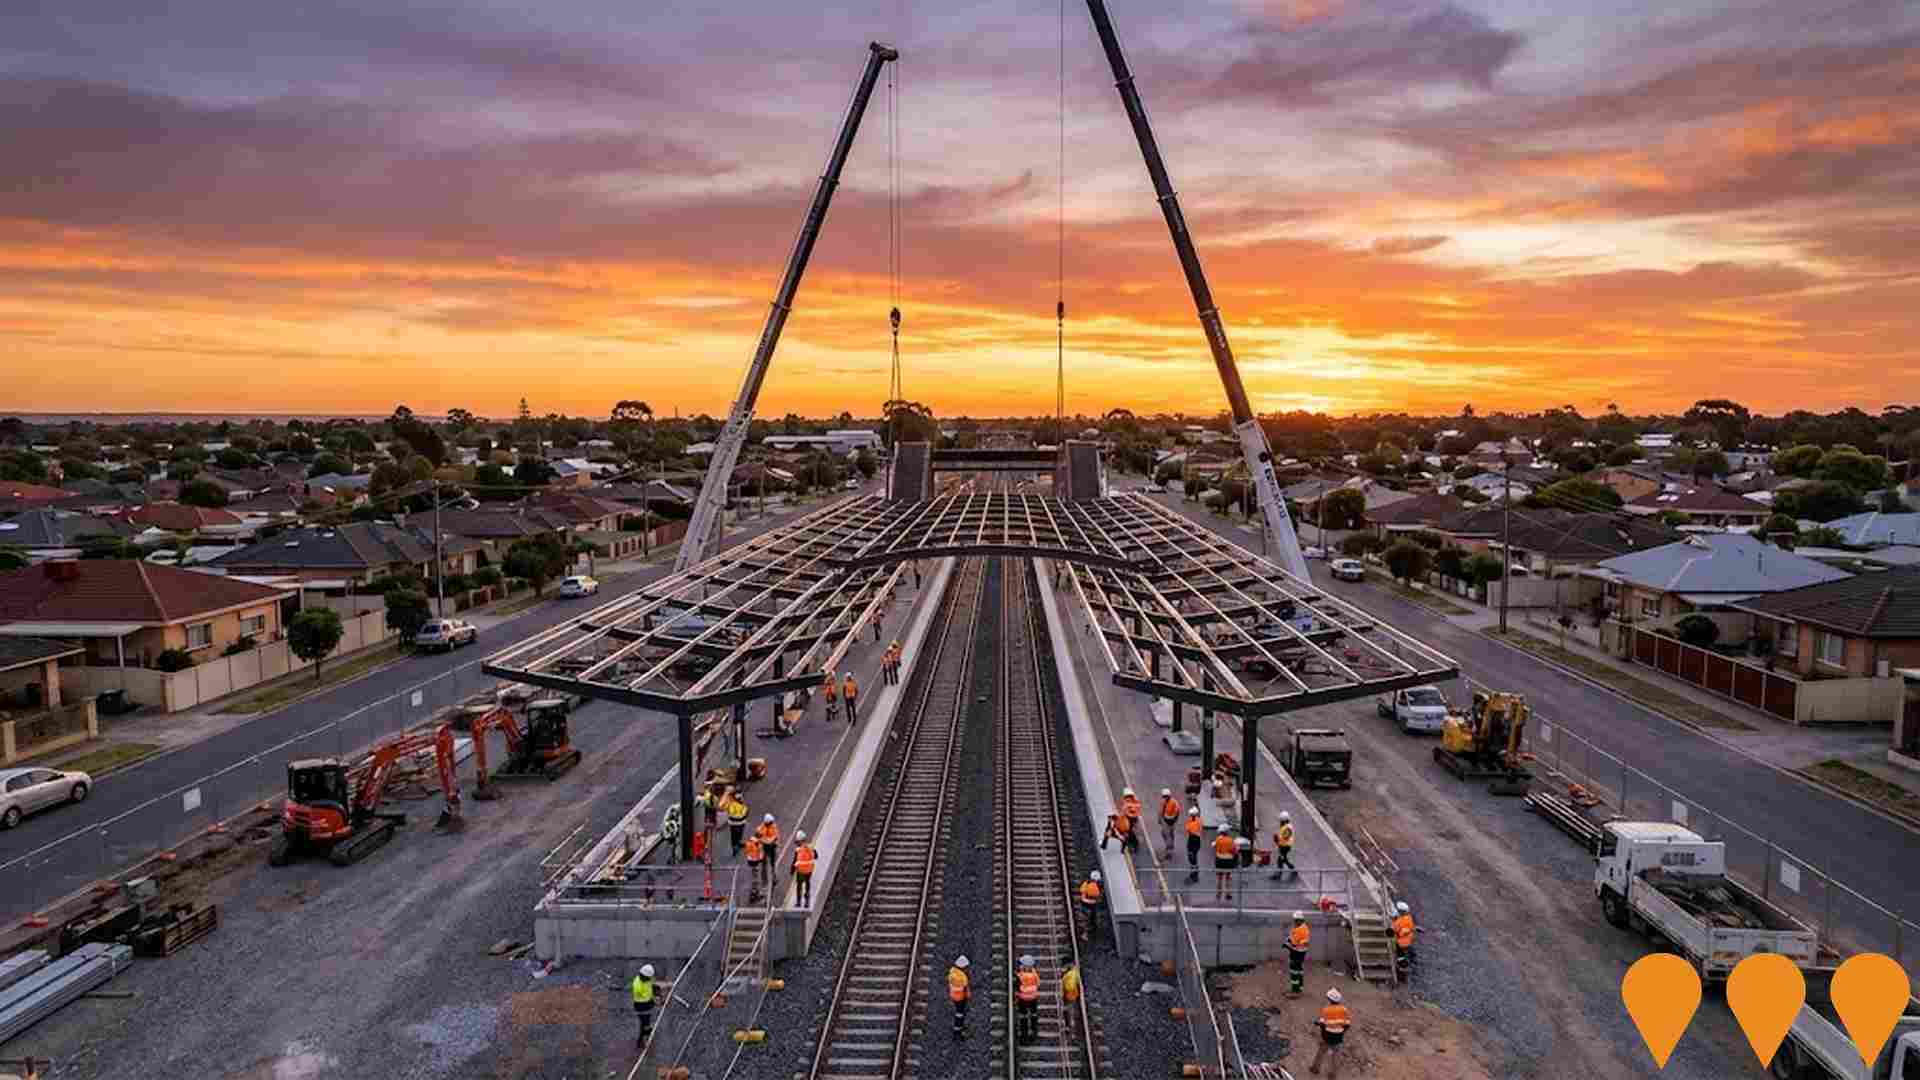
Findon Railway Station Upgrade
Railway station modernization including platform extensions, accessibility improvements, and integration with Gawler line electrification project.
Findon High School Upgrade
South Australia's Department for Education delivered a $10 million upgrade at Findon High School. Works included refurbishing specialist learning areas (food technology, textile design, digital design and art), outdoor connection for the disability unit, creation of advanced manufacturing and STEAM spaces, relocation and upgrade of the resource centre, music and drama areas, student amenities, ICT/security/fire upgrades, landscaping and demolition of aged accommodation. Construction is complete.
Findon Residential Development
Medium-density residential development providing affordable housing options and supporting local population growth projections.
Employment
Employment performance in Flinders Park exceeds national averages across key labour market indicators
Flinders Park has an educated workforce with notable representation in essential services sectors. Its unemployment rate is 3.3%, below Greater Adelaide's 3.9%.
Employment growth over the past year was estimated at 4.2%. As of September 2025, 9,912 residents are employed, with an unemployment rate of 0.7% lower than Greater Adelaide's. Workforce participation is similar to Greater Adelaide's 61.7%. Key industries include health care & social assistance, retail trade, and construction.
The area specializes in transport, postal & warehousing, with employment share at 1.3 times the regional level. Health care & social assistance has limited presence, at 16.8% compared to 17.7% regionally. Employment opportunities locally may be limited, as indicated by Census data comparing working population and resident population. Over the 12 months to September 2025, employment increased by 4.2%, while labour force also rose by 4.2%. Unemployment remained essentially unchanged. In Greater Adelaide, employment grew by 3.0% over the same period, with unemployment falling slightly. State-level data from 25-Nov shows SA employment grew by 1.19% year-on-year, with an unemployment rate of 4.0%, outperforming the national average of 0.14%. Jobs and Skills Australia's national employment forecasts from May-25 project a 6.6% increase over five years and 13.7% over ten years. Applying these projections to Flinders Park's employment mix suggests local employment should increase by similar rates over these periods.
Frequently Asked Questions - Employment
Income
Income levels align closely with national averages, indicating typical economic conditions for Australian communities according to AreaSearch analysis
AreaSearch aggregated latest postcode level ATO data released for financial year ending June 2022. Flinders Park SA2 had median taxpayer income of $53,130 and average income of $62,754. Nationally, median income was $53,894 and average was $67,477. In Greater Adelaide, median income was $52,592 and average was $64,886. Based on Wage Price Index growth of 12.83% from July 2022 to September 2025, estimated incomes would be approximately $59,947 (median) and $70,805 (average). According to the 2021 Census, household, family, and personal incomes ranked modestly in Flinders Park, between 39th and 40th percentiles. Income data showed 32.0% of population (5,822 individuals) fell within $1,500 - 2,999 income range, consistent with surrounding region's 31.8%. Housing affordability pressures were severe, with only 84.5% of income remaining, ranking at 40th percentile. Flinders Park's SEIFA income ranking placed it in the 5th decile.
Frequently Asked Questions - Income
Housing
Flinders Park is characterized by a predominantly suburban housing profile, with above-average rates of outright home ownership
In Flinders Park, as per the latest Census evaluation, 75.8% of dwellings were houses while 24.2% consisted of other types such as semi-detached homes, apartments, and 'other' dwellings. This differs from Adelaide metro's figures which stood at 66.1% houses and 33.9% other dwellings. Home ownership in Flinders Park was 35.0%, aligning with Adelaide metro's rate. Mortgaged dwellings constituted 34.5% and rented dwellings made up 30.5%. The median monthly mortgage repayment in the area was $1,746, surpassing Adelaide metro's average of $1,733. The median weekly rent figure for Flinders Park was $340, compared to Adelaide metro's $325. Nationally, Flinders Park's mortgage repayments were lower than the Australian average of $1,863, and rents were less than the national figure of $375.
Frequently Asked Questions - Housing
Household Composition
Flinders Park features high concentrations of group households, with a fairly typical median household size
Family households account for 68.5% of all households, including 29.9% couples with children, 25.7% couples without children, and 11.4% single parent families. Non-family households constitute the remaining 31.5%, with lone person households at 27.4% and group households comprising 4.1%. The median household size is 2.4 people, which aligns with the Greater Adelaide average.
Frequently Asked Questions - Households
Local Schools & Education
Educational attainment in Flinders Park aligns closely with national averages, showing typical qualification patterns and performance metrics
University qualification levels in Flinders Park are at 28.0%, slightly below the Australian average of 30.4%. Bachelor degrees are most common at 20.0%, followed by postgraduate qualifications (6.0%) and graduate diplomas (2.0%). Vocational credentials are prominent, with 30.3% of residents aged 15+ holding them, including advanced diplomas (9.9%) and certificates (20.4%).
Educational participation is high at 26.6%, with 8.7% in primary education, 6.2% in tertiary education, and 6.1% pursuing secondary education.
Frequently Asked Questions - Education
Schools Detail
Nearby Services & Amenities
Transport
Transport servicing is moderate compared to other areas nationally based on assessment of service frequency, route connectivity and accessibility
Transport analysis shows 66 active stops in Flinders Park, served by buses via 29 routes offering 1,663 weekly passenger trips. Residents' average distance to the nearest stop is 220 meters, with service frequency averaging 237 daily trips across all routes, equating to about 25 weekly trips per stop.
Service frequency averages 237 trips per day across all routes, equating to approximately 25 weekly trips per individual stop.
Frequently Asked Questions - Transport
Transport Stops Detail
Health
Flinders Park's residents are relatively healthy in comparison to broader Australia with common health conditions slightly more prevalent than average across both younger and older age cohorts
Flinders Park's health metrics are close to national benchmarks.
Common health conditions are slightly more prevalent than average across both younger and older age cohorts. Private health cover stands at approximately 51% of the total population (~9,297 people), lagging behind the average SA2 area. The most common medical conditions in the area are arthritis (8.1%) and mental health issues (7.3%). A total of 70.2% of residents declare themselves completely clear of medical ailments, compared to 68.9% across Greater Adelaide. The area has 18.8% of residents aged 65 and over (3,417 people), which is lower than the 20.0% in Greater Adelaide. Overall, Flinders Park's health profile is broadly in line with that of the general population.
Frequently Asked Questions - Health
Cultural Diversity
Flinders Park was found to be more culturally diverse than the vast majority of local markets in Australia, upon assessment of a range of language and cultural background related metrics
Flinders Park, surveyed in July-August 2016, had a higher cultural diversity than most local areas, with 31.0% of its population born overseas and 34.2% speaking languages other than English at home. Christianity was the predominant religion, accounting for 57.7% of people. The category 'Other' religions comprised 3.4%, compared to 1.8% in Greater Adelaide.
Regarding ancestry, the top groups were English (18.7%), Australian (17.6%), and Italian (16.2%), with Italian being significantly higher than the regional average of 10.2%. Notable differences existed for Greek (6.6% vs 4.7%), Serbian (1.2% vs 1.3%), and Croatian (1.0% vs 1.1%) groups.
Frequently Asked Questions - Diversity
Age
Flinders Park's population aligns closely with national norms in age terms
Flinders Park's median age is 39 years, matching Greater Adelaide's average of 39 and aligning with Australia's median of 38. Locally, the 25-34 cohort is notably over-represented at 16.6%, while the 5-14 year-olds are under-represented at 10.0%. Post-2021 Census, the 25 to 34 age group has increased from 15.6% to 16.6%, and the 45 to 54 cohort has decreased from 12.6% to 11.8%. By 2041, Flinders Park's age profile is projected to change significantly. The 85+ cohort is expected to grow by 93%, adding 554 residents to reach 1,149. The 5-14 group is projected to grow by 6%, adding 105 residents.
