Chart Color Schemes
This analysis uses ABS Statistical Areas Level 2 (SA2) boundaries, which can materially differ from Suburbs and Localities (SAL) even when sharing similar names.
SA2 boundaries are defined by the Australian Bureau of Statistics and are designed to represent communities for statistical reporting (e.g., census and ERP).
Suburbs and Localities (SAL) represent commonly-used suburb/locality names (postal-style areas) and may use different geographic boundaries. For comprehensive analysis, consider reviewing both boundary types if available.
est. as @ -- *
ABS ERP | -- people | --
2021 Census | -- people
Sales Activity
Curious about local property values? Filter the chart to assess the volume and appreciation (including resales) trends and regional comparisons, or scroll to the map below view this information at an individual property level.
Find a Recent Sale
Sales Detail
Population
An assessment of population growth drivers in Richmond reveals an overall ranking slightly below national averages considering recent, and medium term trends
Richmond's population was 18,411 as of November 2025. This figure reflects an increase of 1,389 people since the 2021 Census, which reported a population of 17,022. The growth is inferred from ABS data showing an estimated resident population of 18,248 in June 2024 and an additional 198 validated new addresses since the Census date. This results in a population density ratio of 2,061 persons per square kilometer, higher than the average seen across national locations assessed by AreaSearch. Richmond's growth rate of 8.2% since the 2021 census exceeded both the state (7.1%) and SA3 area averages, making it a growth leader in the region. Overseas migration contributed approximately 89.2% of overall population gains during recent periods.
AreaSearch uses ABS/Geoscience Australia projections for each SA2 area, released in 2024 with 2022 as the base year. For areas not covered by this data and years post-2032, the SA State Government's Regional/LGA projections by age category are adopted, based on 2021 data and adjusted using a method of weighted aggregation of population growth from LGA to SA2 levels. Future trends project an above median population growth for Richmond. Based on the latest annual ERP population numbers, the area is expected to grow by 3,122 persons to 2041, reflecting an increase of 16.1% in total over the 17 years.
Frequently Asked Questions - Population
Development
AreaSearch assessment of residential development activity positions Richmond among the top 25% of areas assessed nationwide
Richmond has seen approximately 87 new homes approved annually. In the past five financial years, from FY-21 to FY-25, around 436 homes were approved, with an additional 55 approved so far in FY-26. On average, about 2.2 people have moved to the area per new home constructed over these years, indicating strong demand which supports property values.
New homes are being built at an average expected construction cost of $264,000. In terms of commercial development, around $114.3 million in approvals have been registered this financial year, suggesting robust momentum. Compared to Greater Adelaide, Richmond records about three-quarters the building activity per person and ranks among the 71st percentile nationally for new building activity.
The type of housing being built shows a balanced mix, with approximately 54.0% detached houses and 46.0% medium and high-density housing, offering choices across various price ranges. With around 182 people per dwelling approval, Richmond exhibits characteristics of a growth area. According to the latest AreaSearch quarterly estimate, Richmond is projected to gain approximately 2,959 residents by 2041. Development appears to be keeping pace with projected population growth, although increasing competition among buyers may arise as the population expands.
Frequently Asked Questions - Development
Infrastructure
Richmond has limited levels of nearby infrastructure activity, ranking in the 7thth percentile nationally
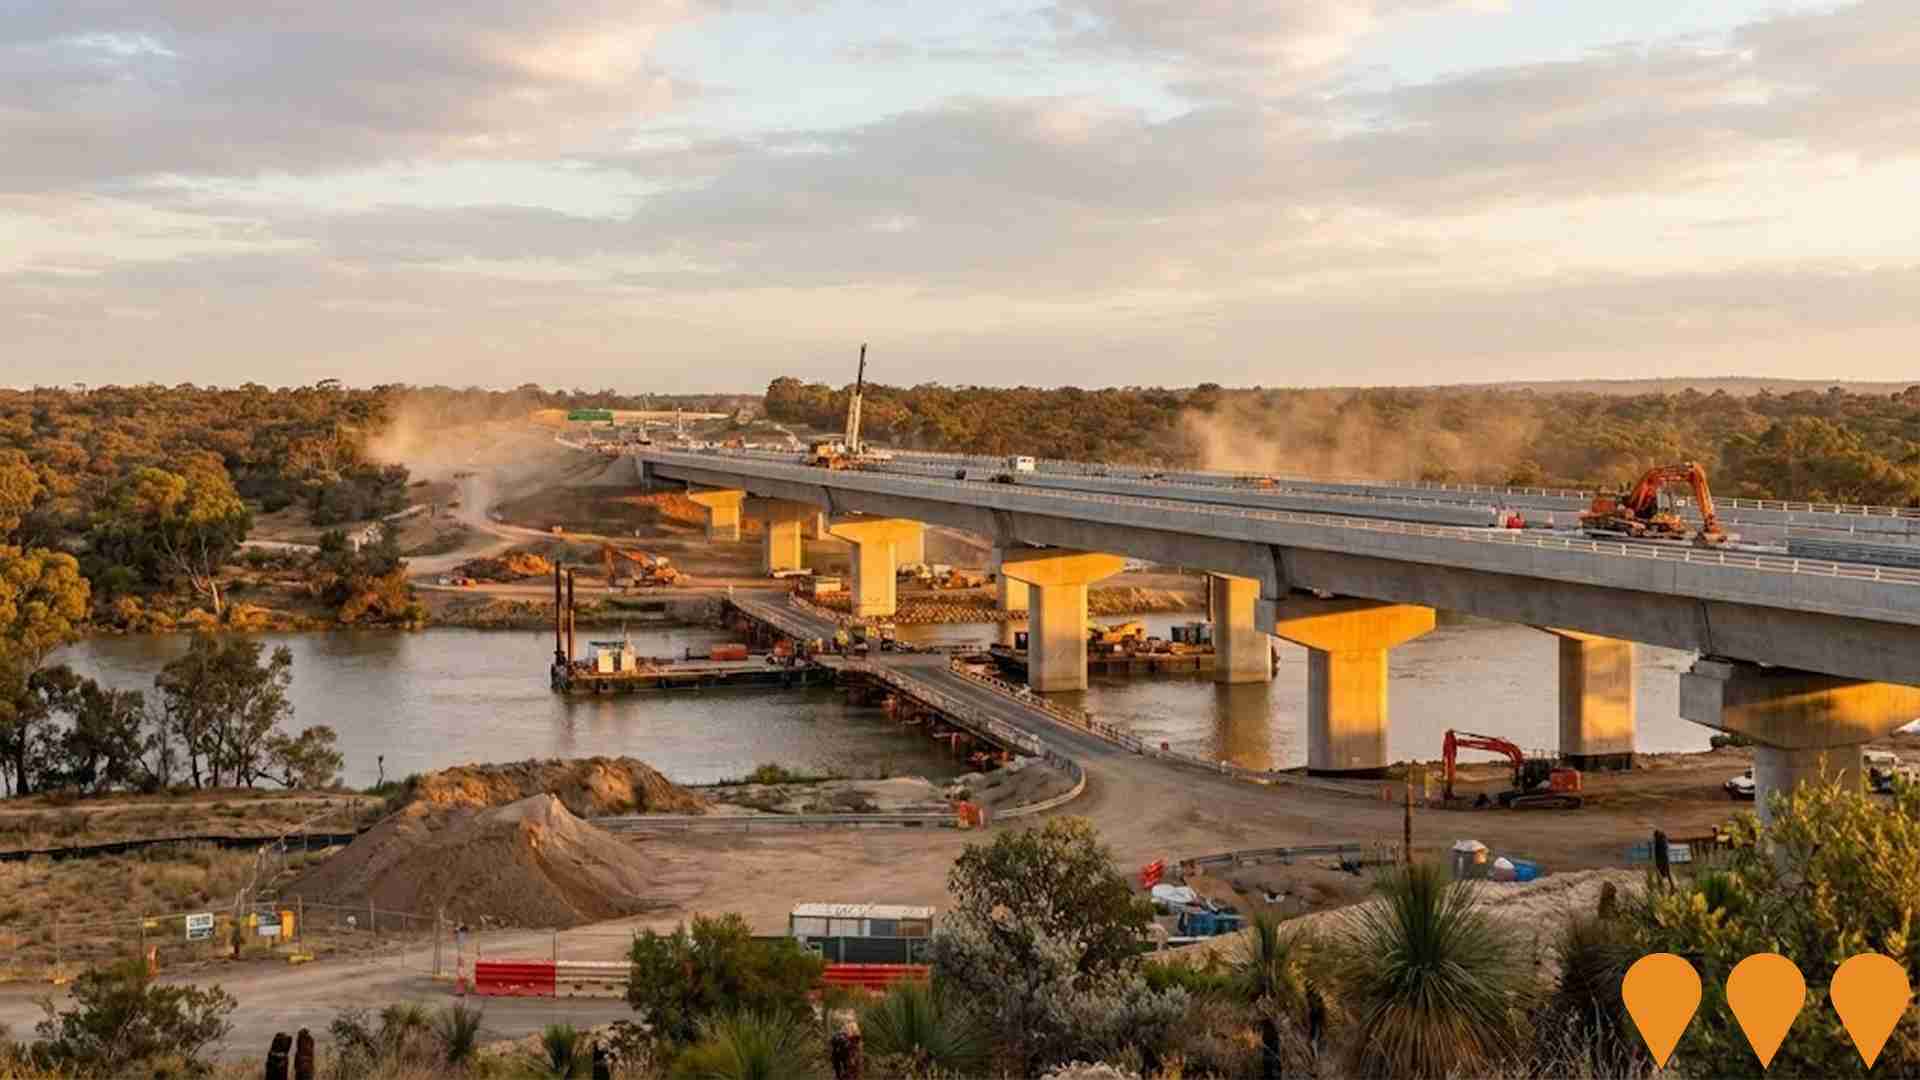
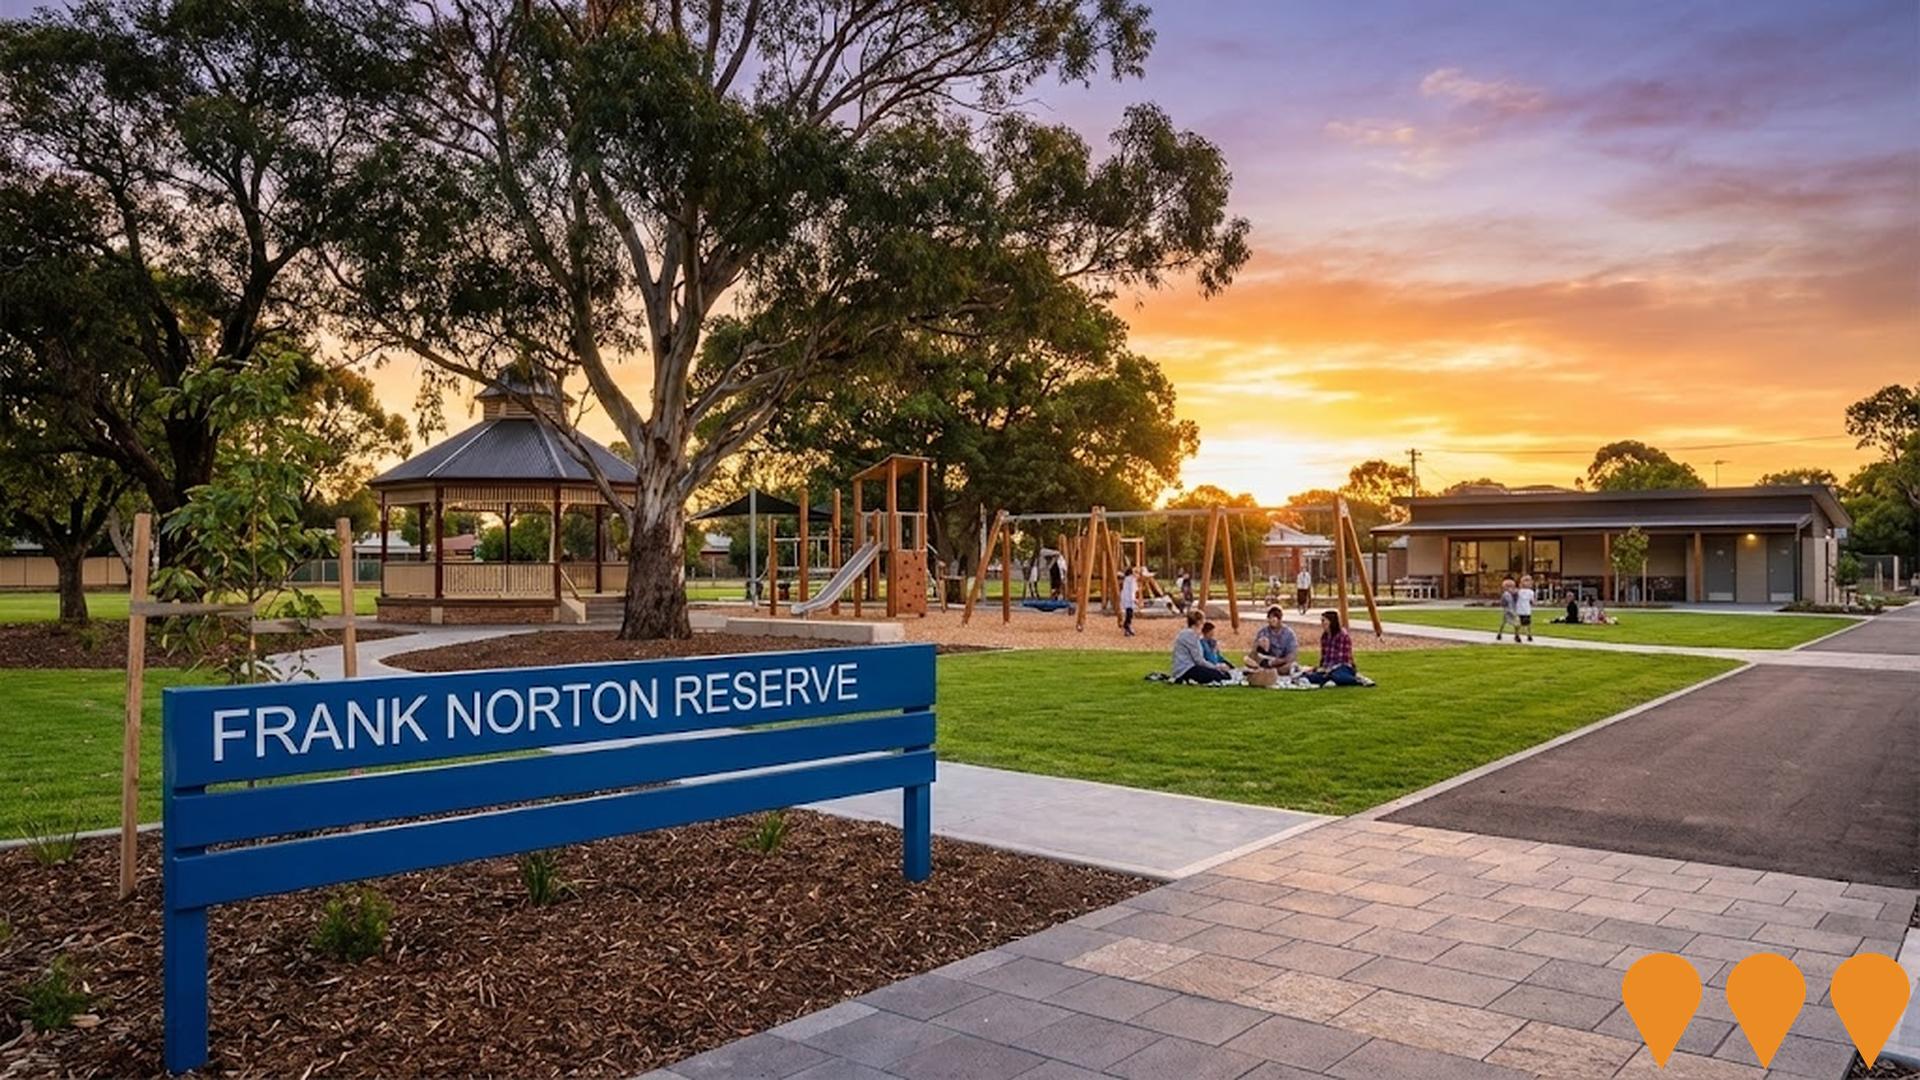
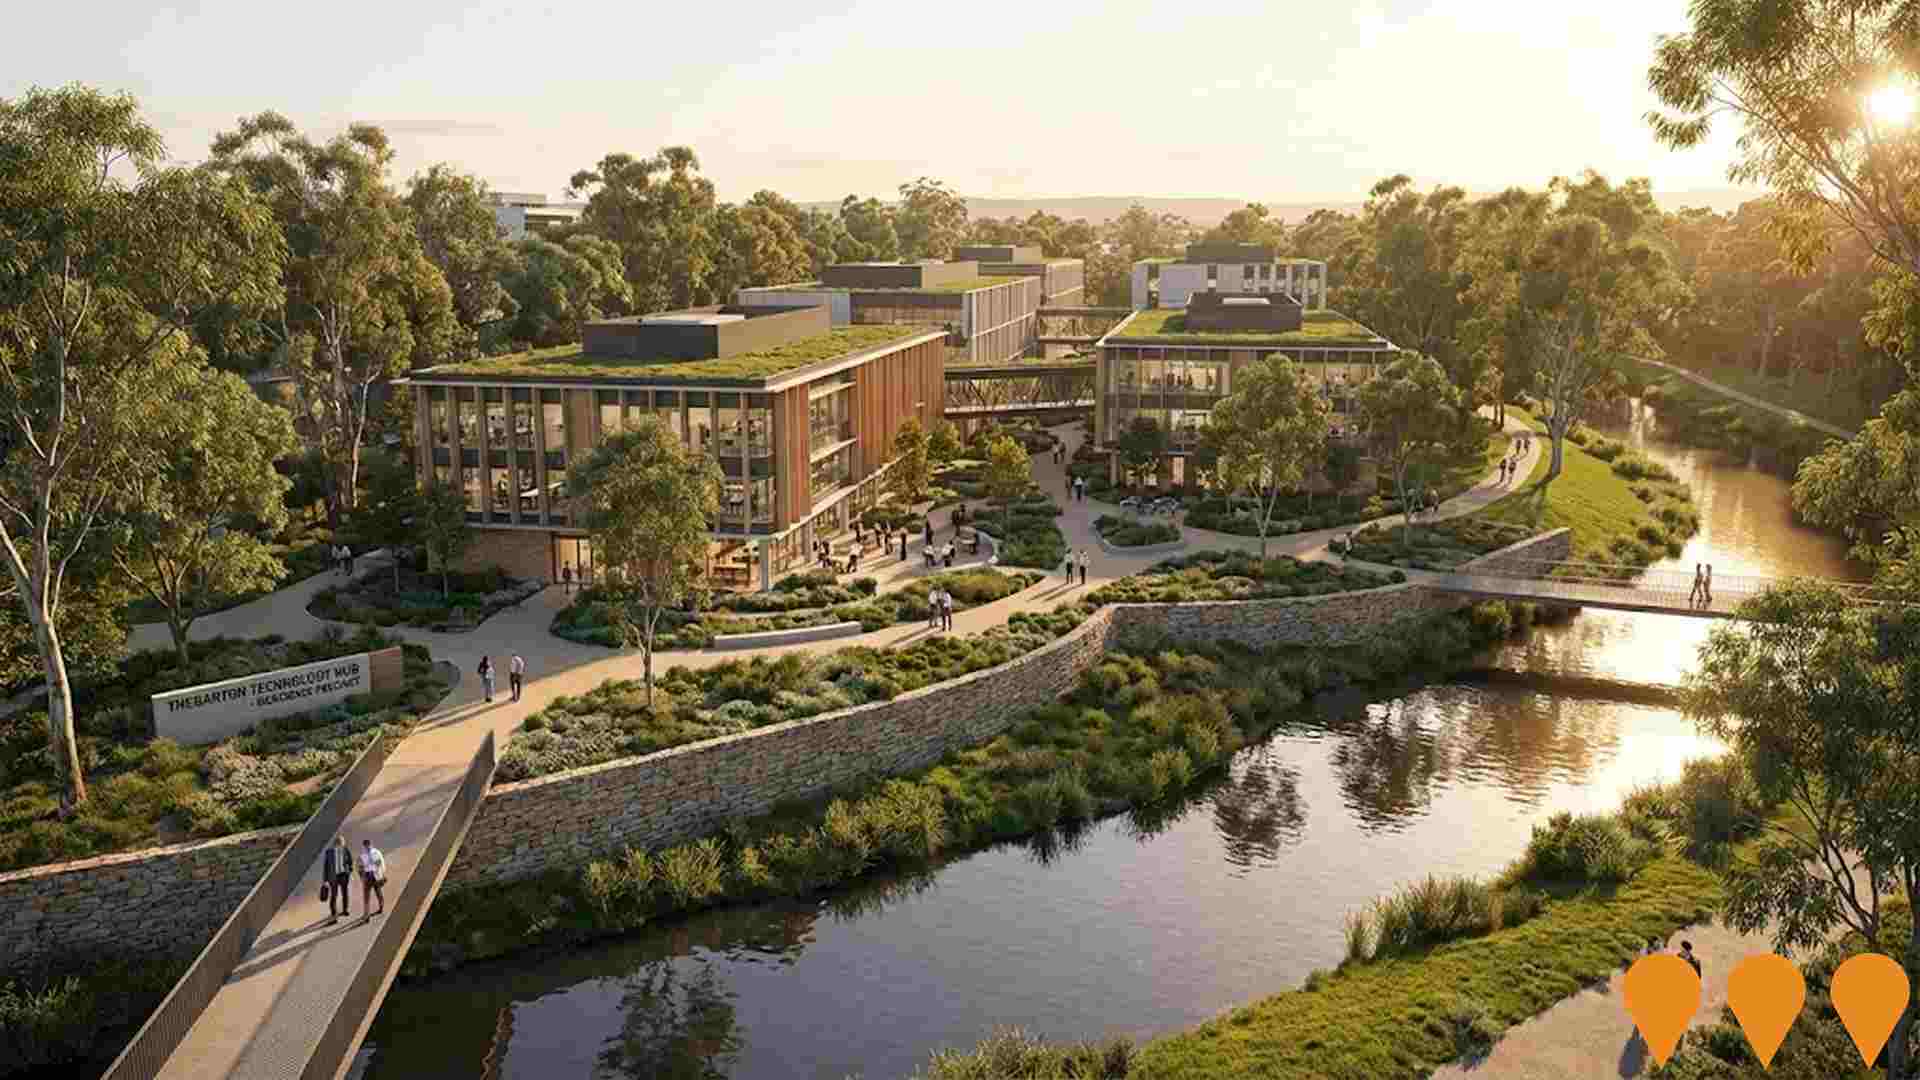
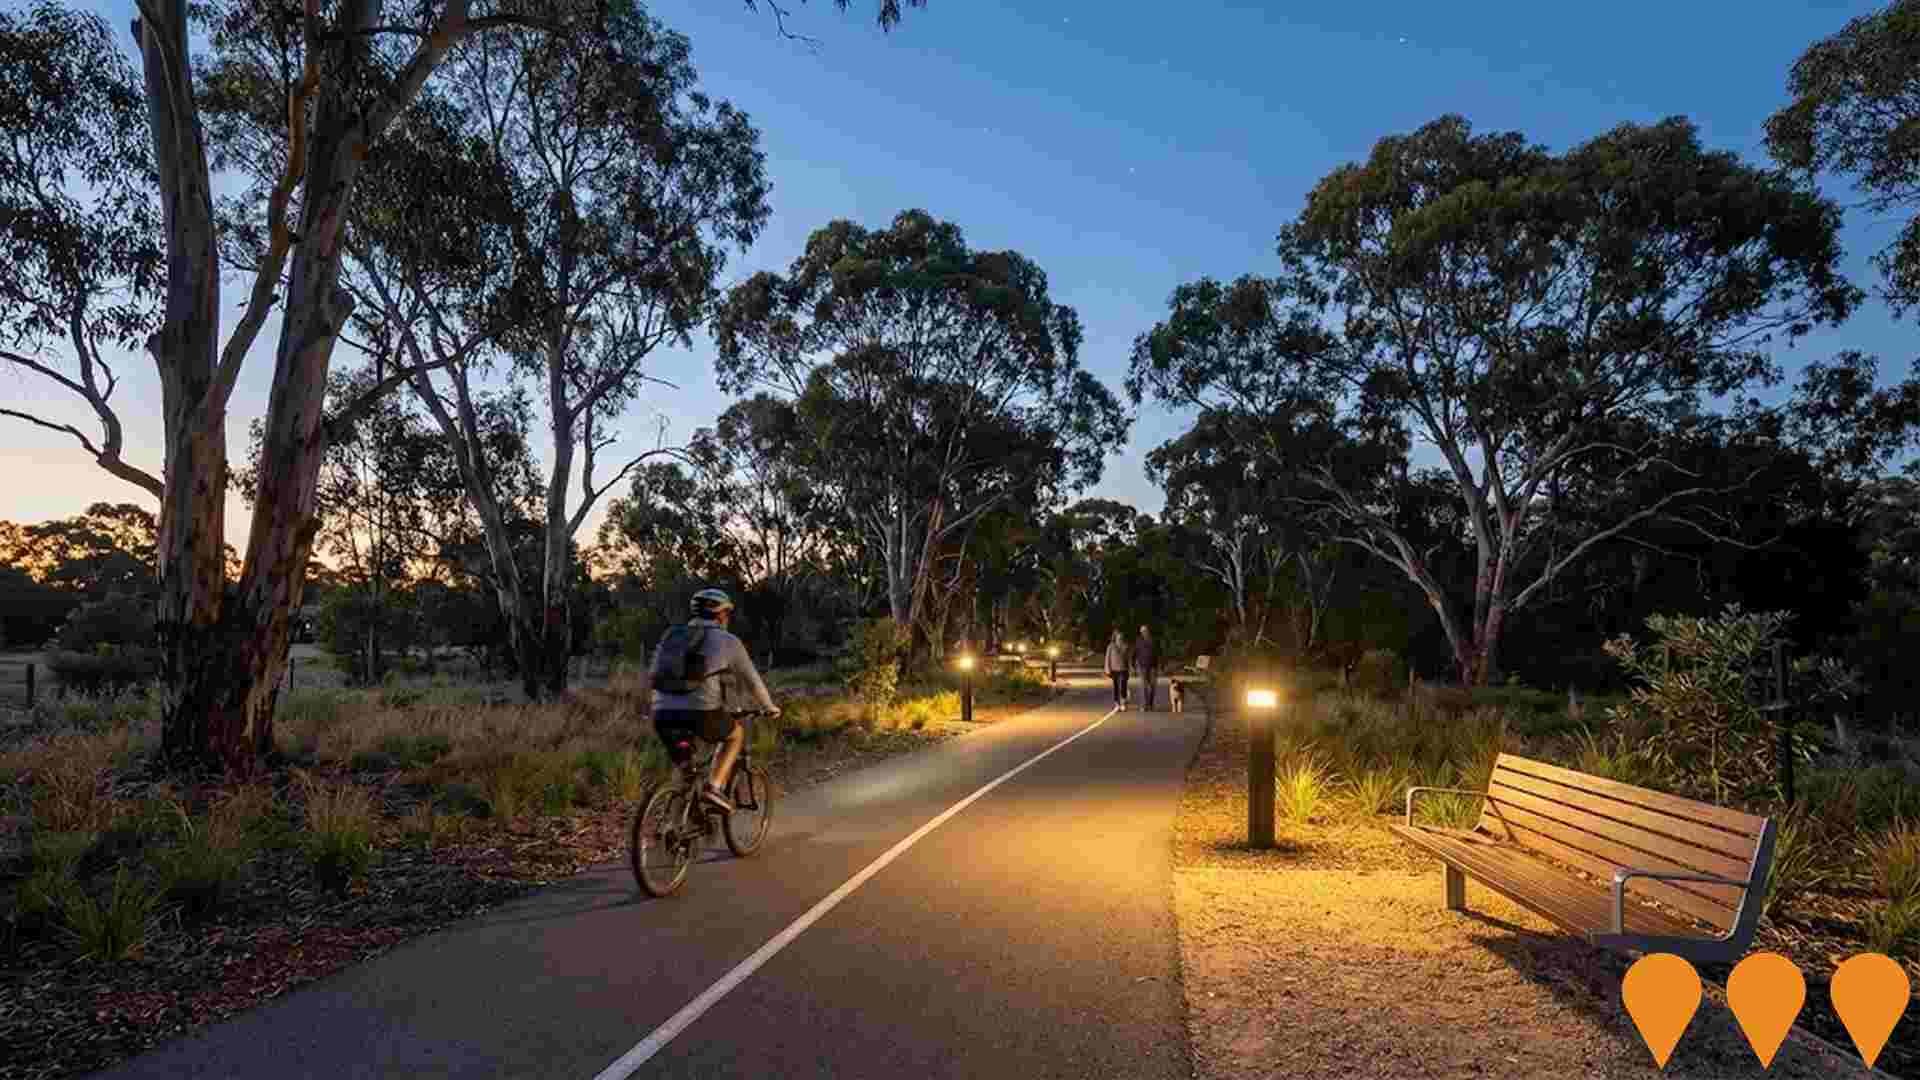
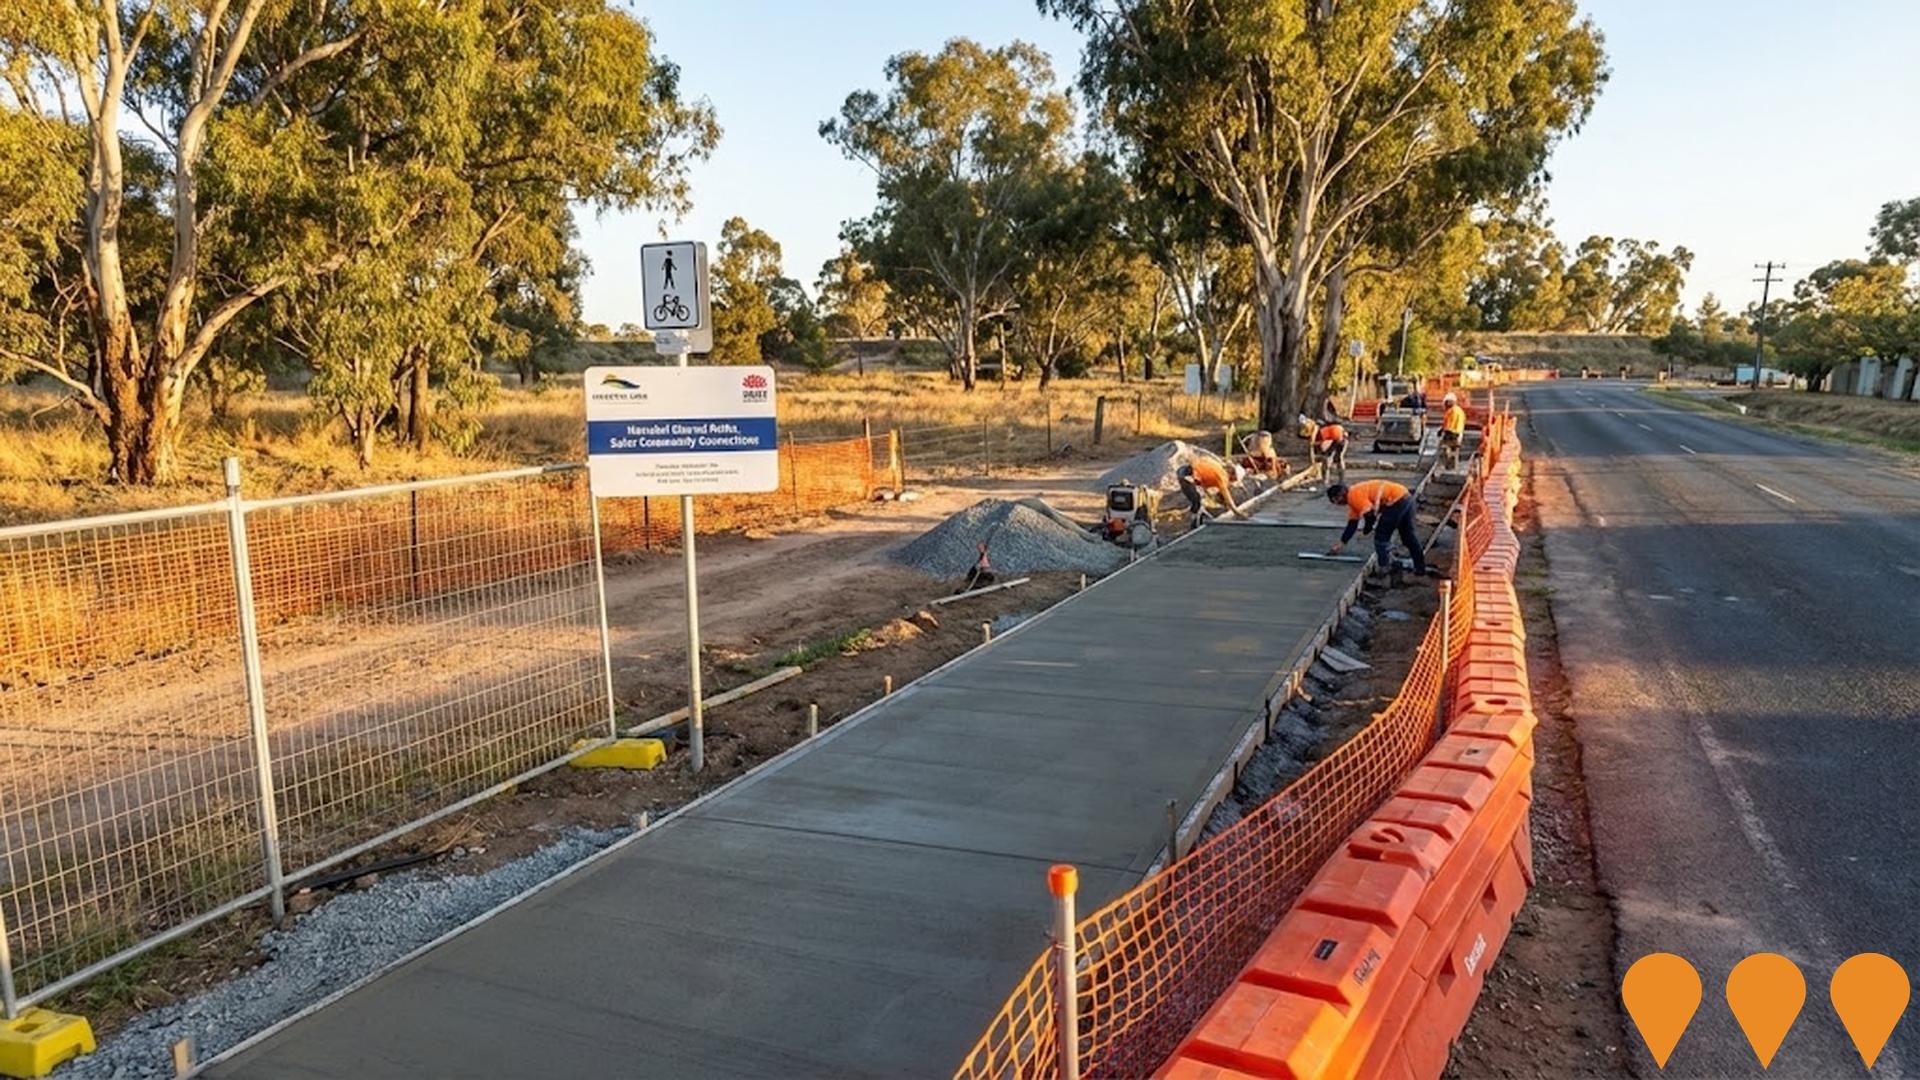
Changes to local infrastructure significantly affect an area's performance. AreaSearch has identified 13 projects that could impact this region. Notable ones include Thebarton Technology Hub, North South Corridor, Southwark Grounds, and Frank Norton Reserve Redevelopment. Below is a list of those likely to be most relevant.
Professional plan users can use the search below to filter and access additional projects.
INFRASTRUCTURE SEARCH
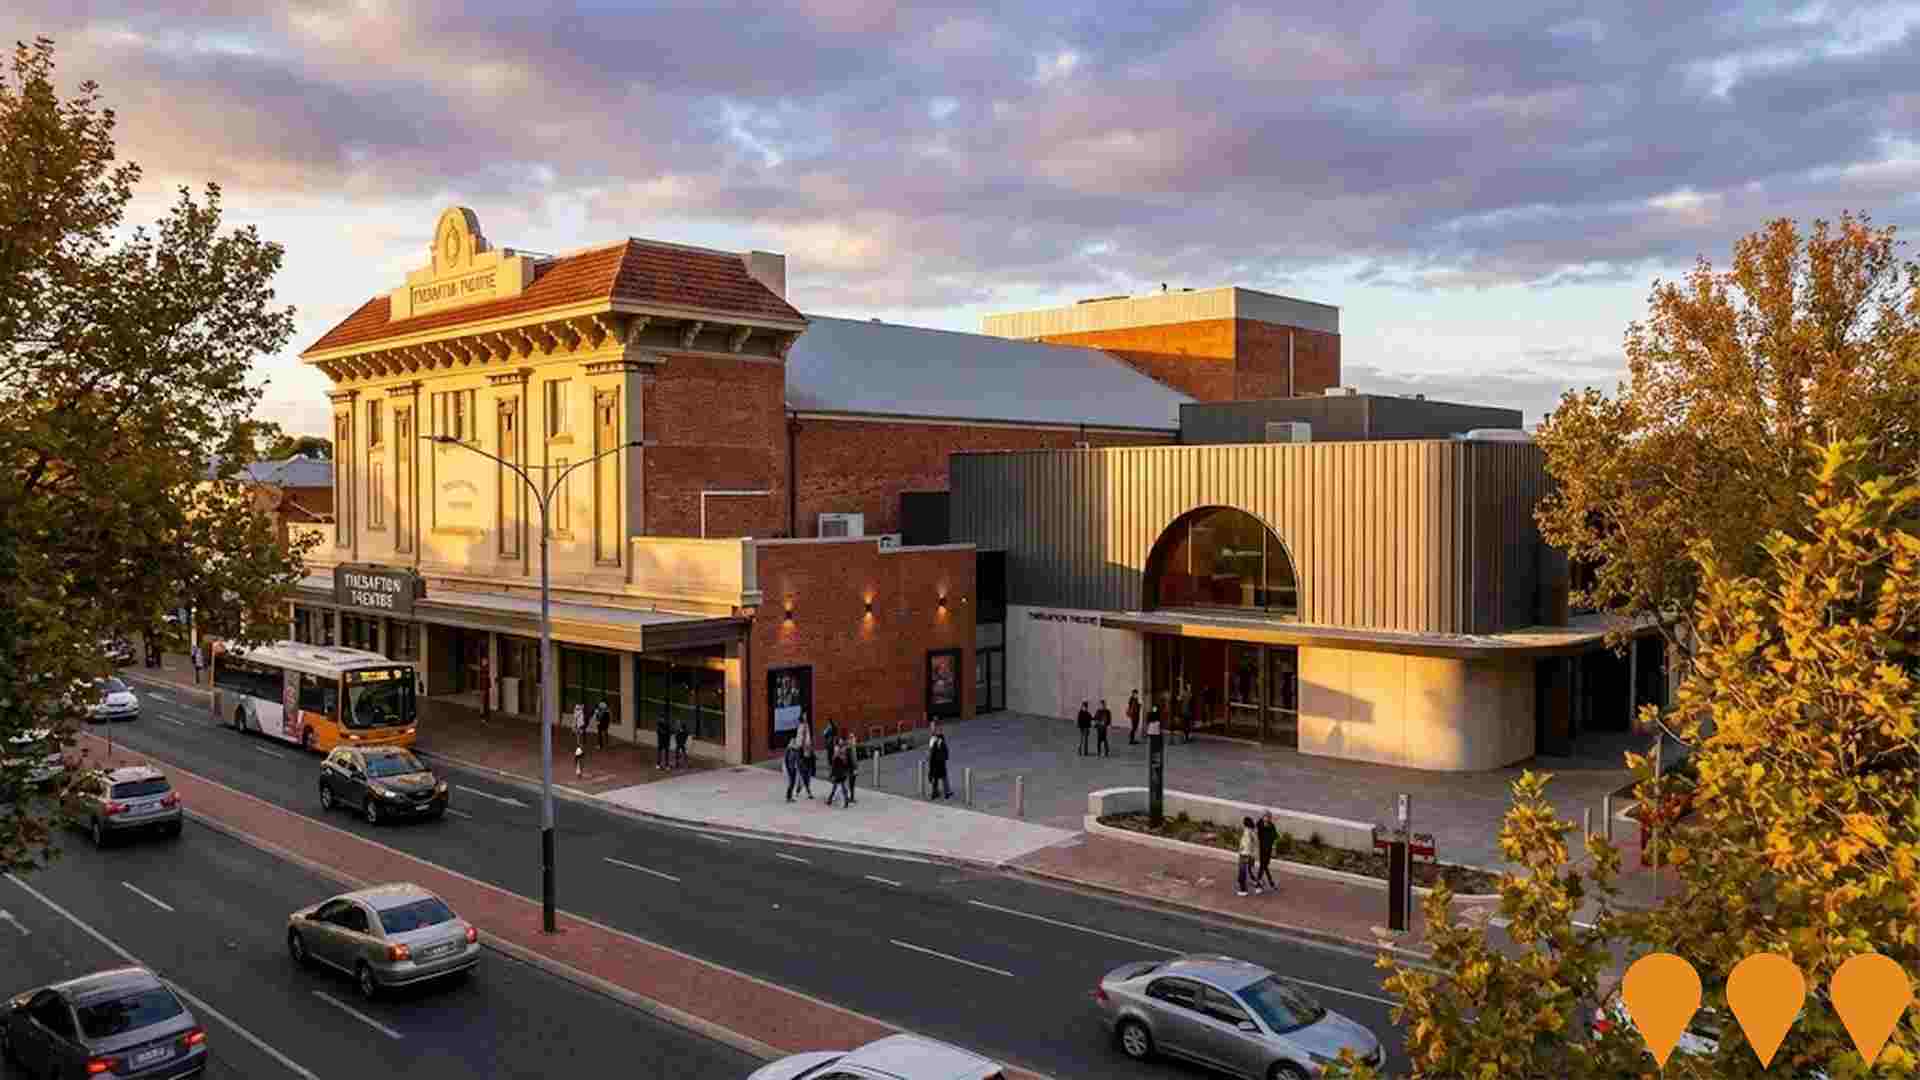
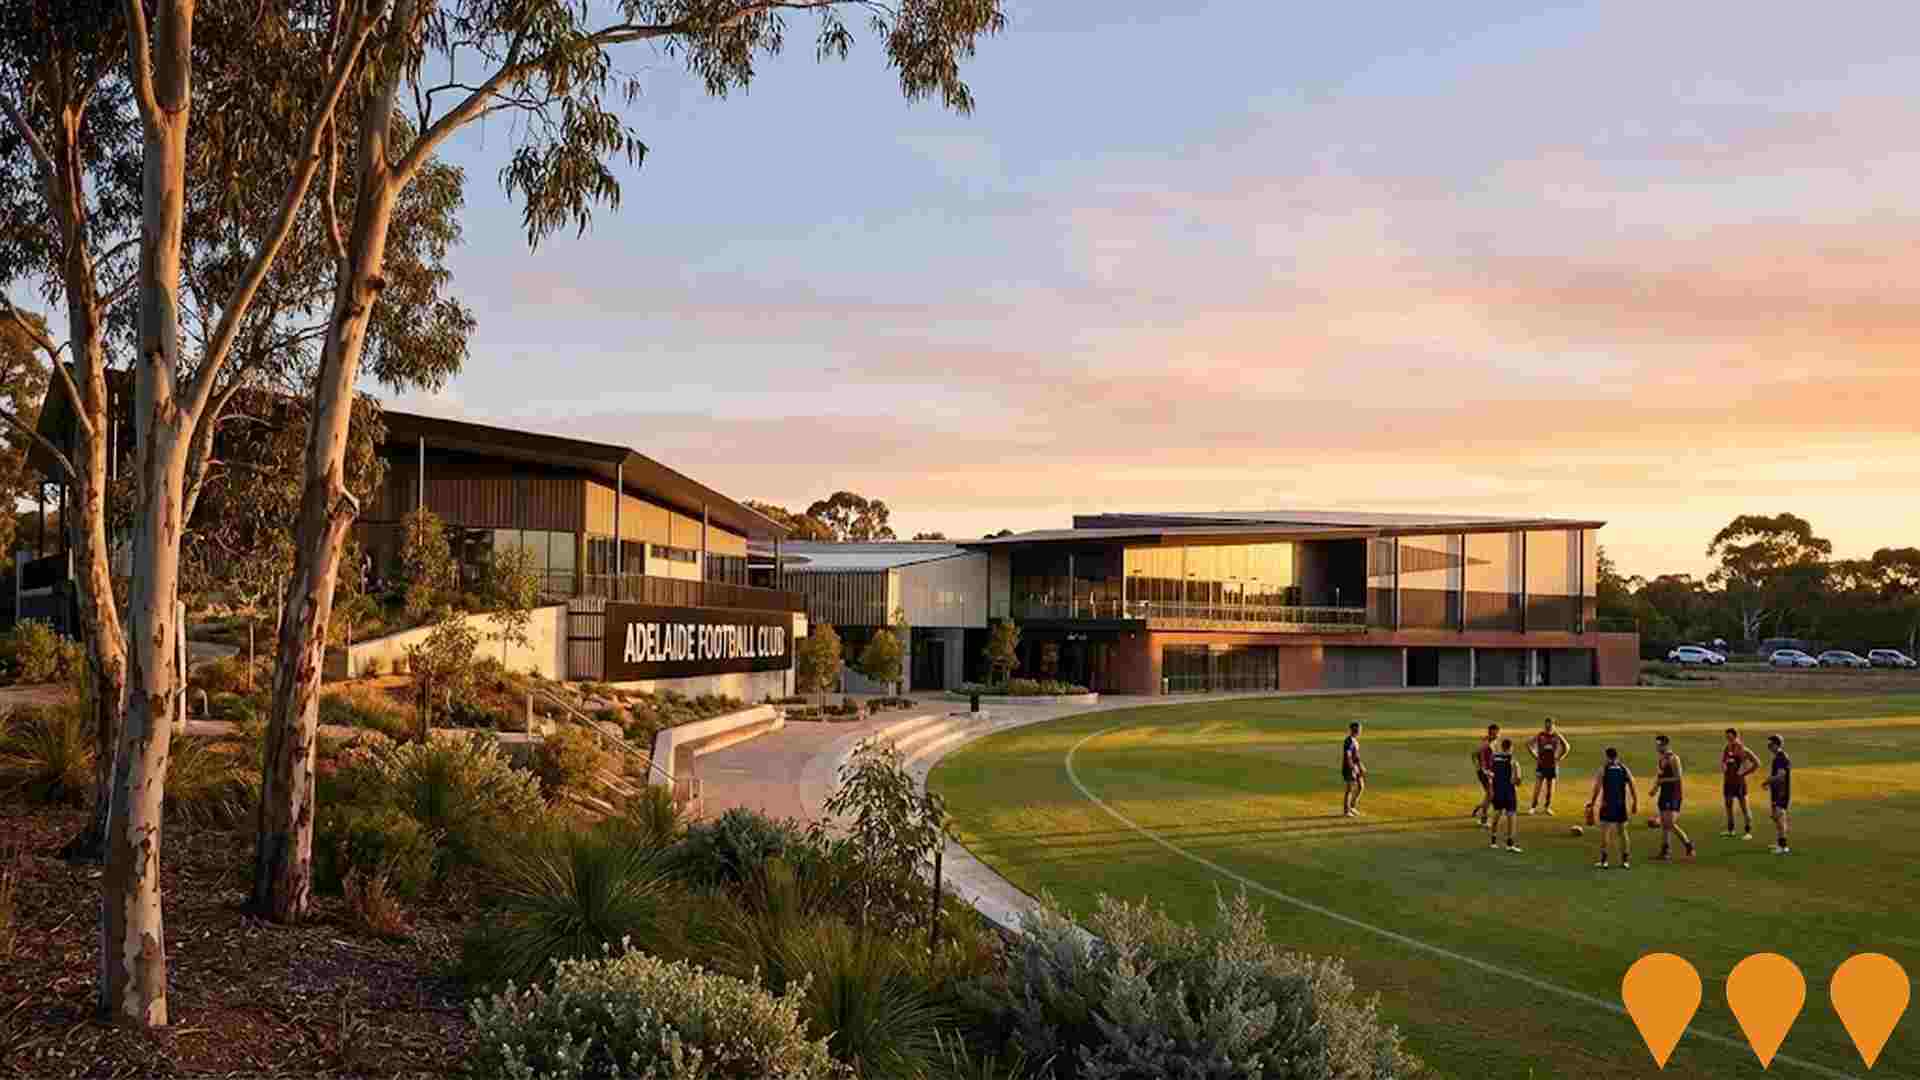
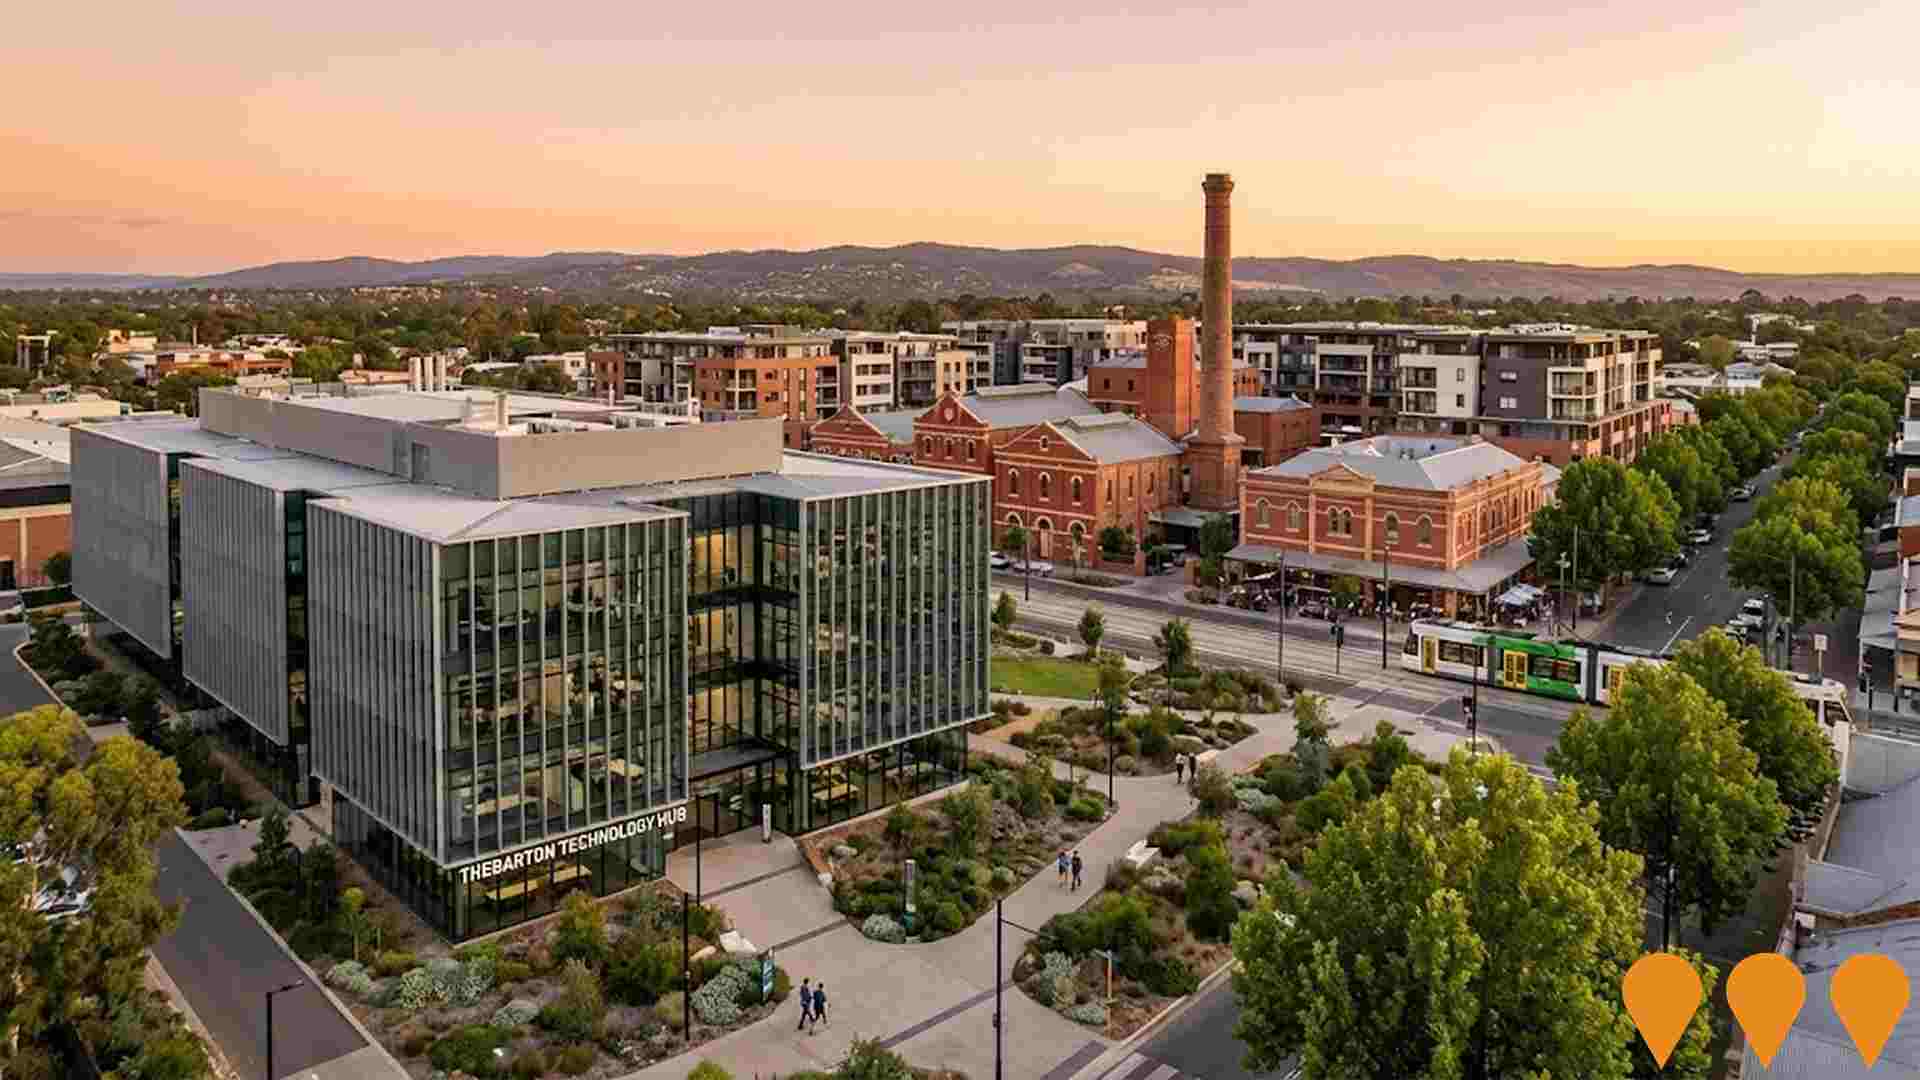
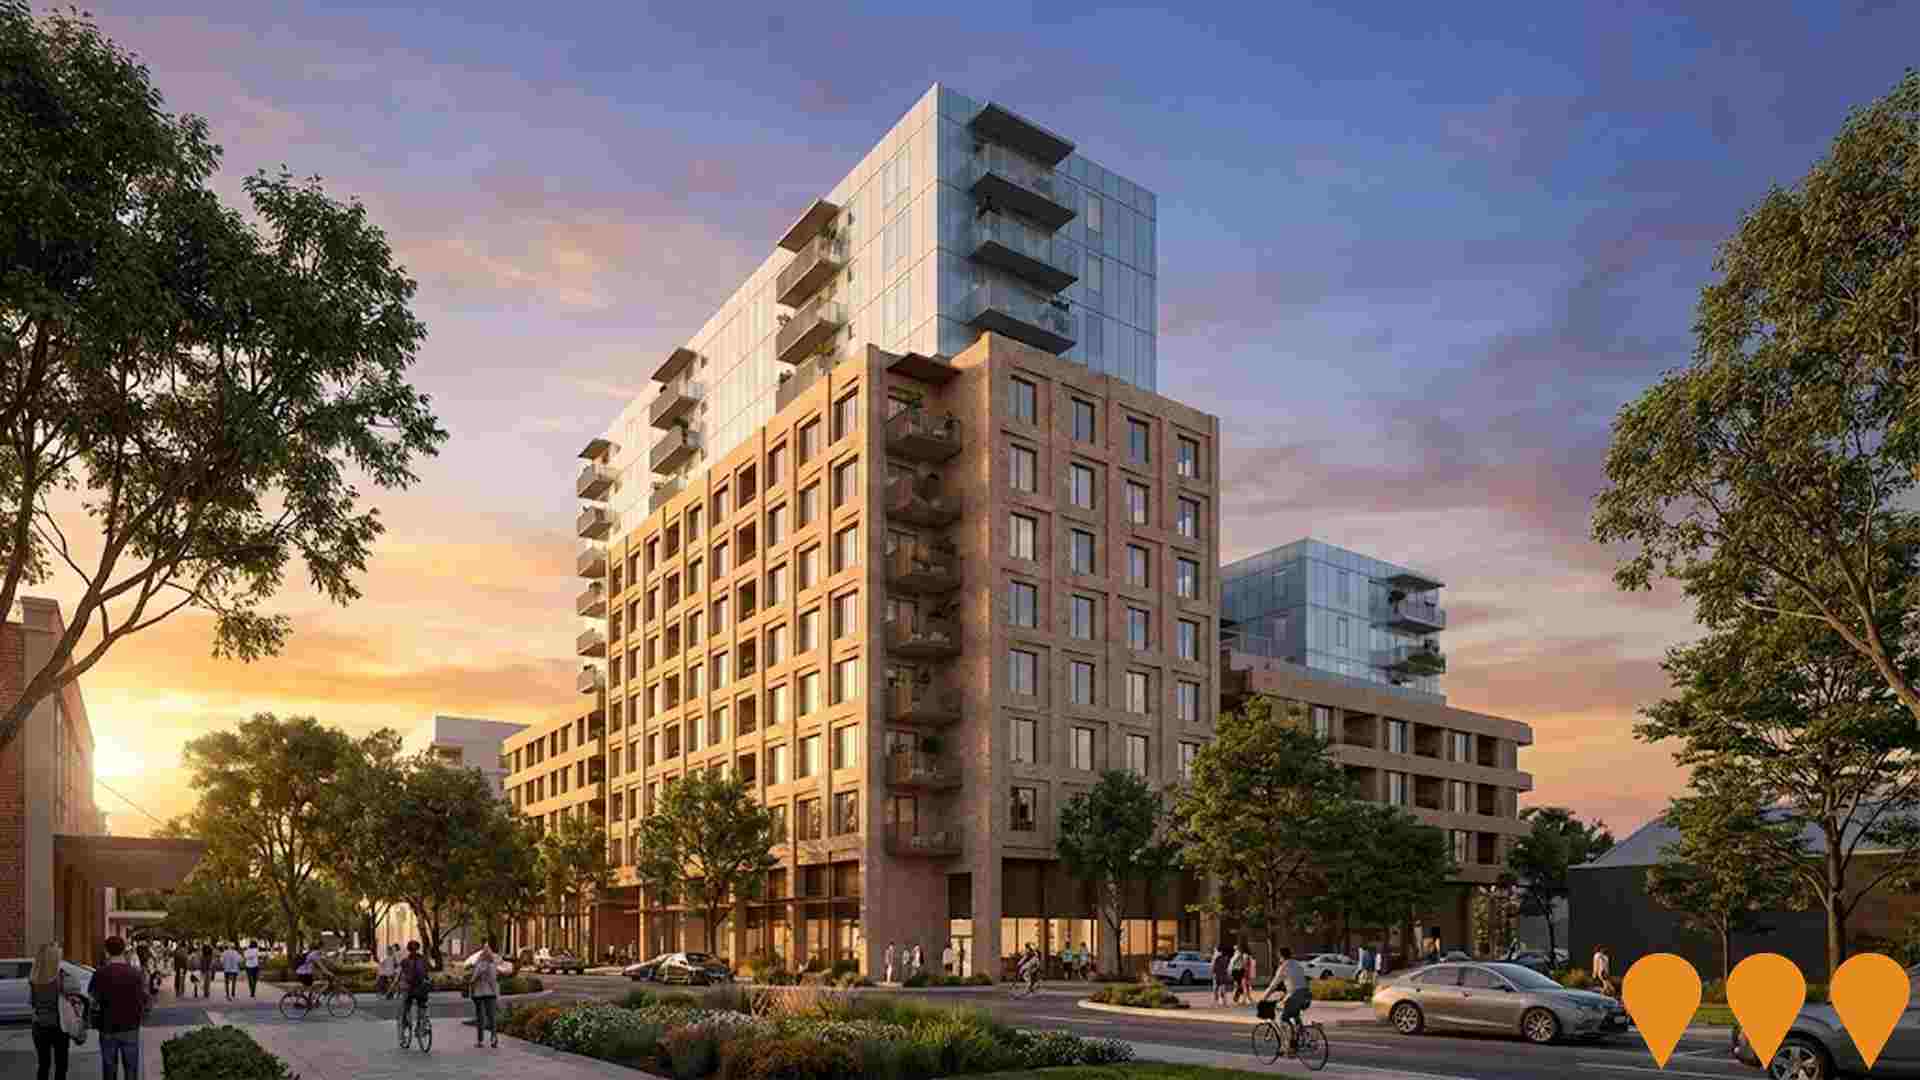
 Denotes AI-based impression for illustrative purposes only, not to be taken as definitive under any circumstances. Please follow links and conduct other investigations from the project's source for actual imagery. Developers and project owners wishing us to use original imagery please Contact Us and we will do so.
Frequently Asked Questions - Infrastructure
Thebarton Technology Hub
A key development for the City of West Torrens, focusing on attracting and growing bioscience, technology, and advanced manufacturing companies. The broader area includes the University of Adelaide's Thebarton Campus. The City of West Torrens' Economic Development Plan supports the investigation of establishing a digital hub and fast broadband to industrial precincts. The former West End Brewery site (now called Southwark Grounds) is undergoing a major $1 billion mixed-use masterplan by Renewal SA, with construction expected to start in mid-2025.
New Women's and Children's Hospital
A new $3.2 billion state-of-the-art hospital at the former SAPOL Barracks site with 414 overnight beds (56 more than current hospital) plus capacity for an additional 20 beds in future. Features include larger emergency department with 43 treatment spaces, Australia's first all-electric public hospital, integrated 4-bed ICU for women co-located with Paediatric ICU, on-site helipad with direct access to critical clinical areas, and all critical care services (birthing, theatres, PICU, NICU) co-located on one floor. Located in Adelaide BioMed City precinct near Royal Adelaide Hospital. Construction commenced April 2024 with $306 million Stage 1 works package (1,300-space car park and central energy facility) and $427 million Stage 2 foundational works package confirmed November 2024. New design team appointed June 2025. Expected completion 2030-31.
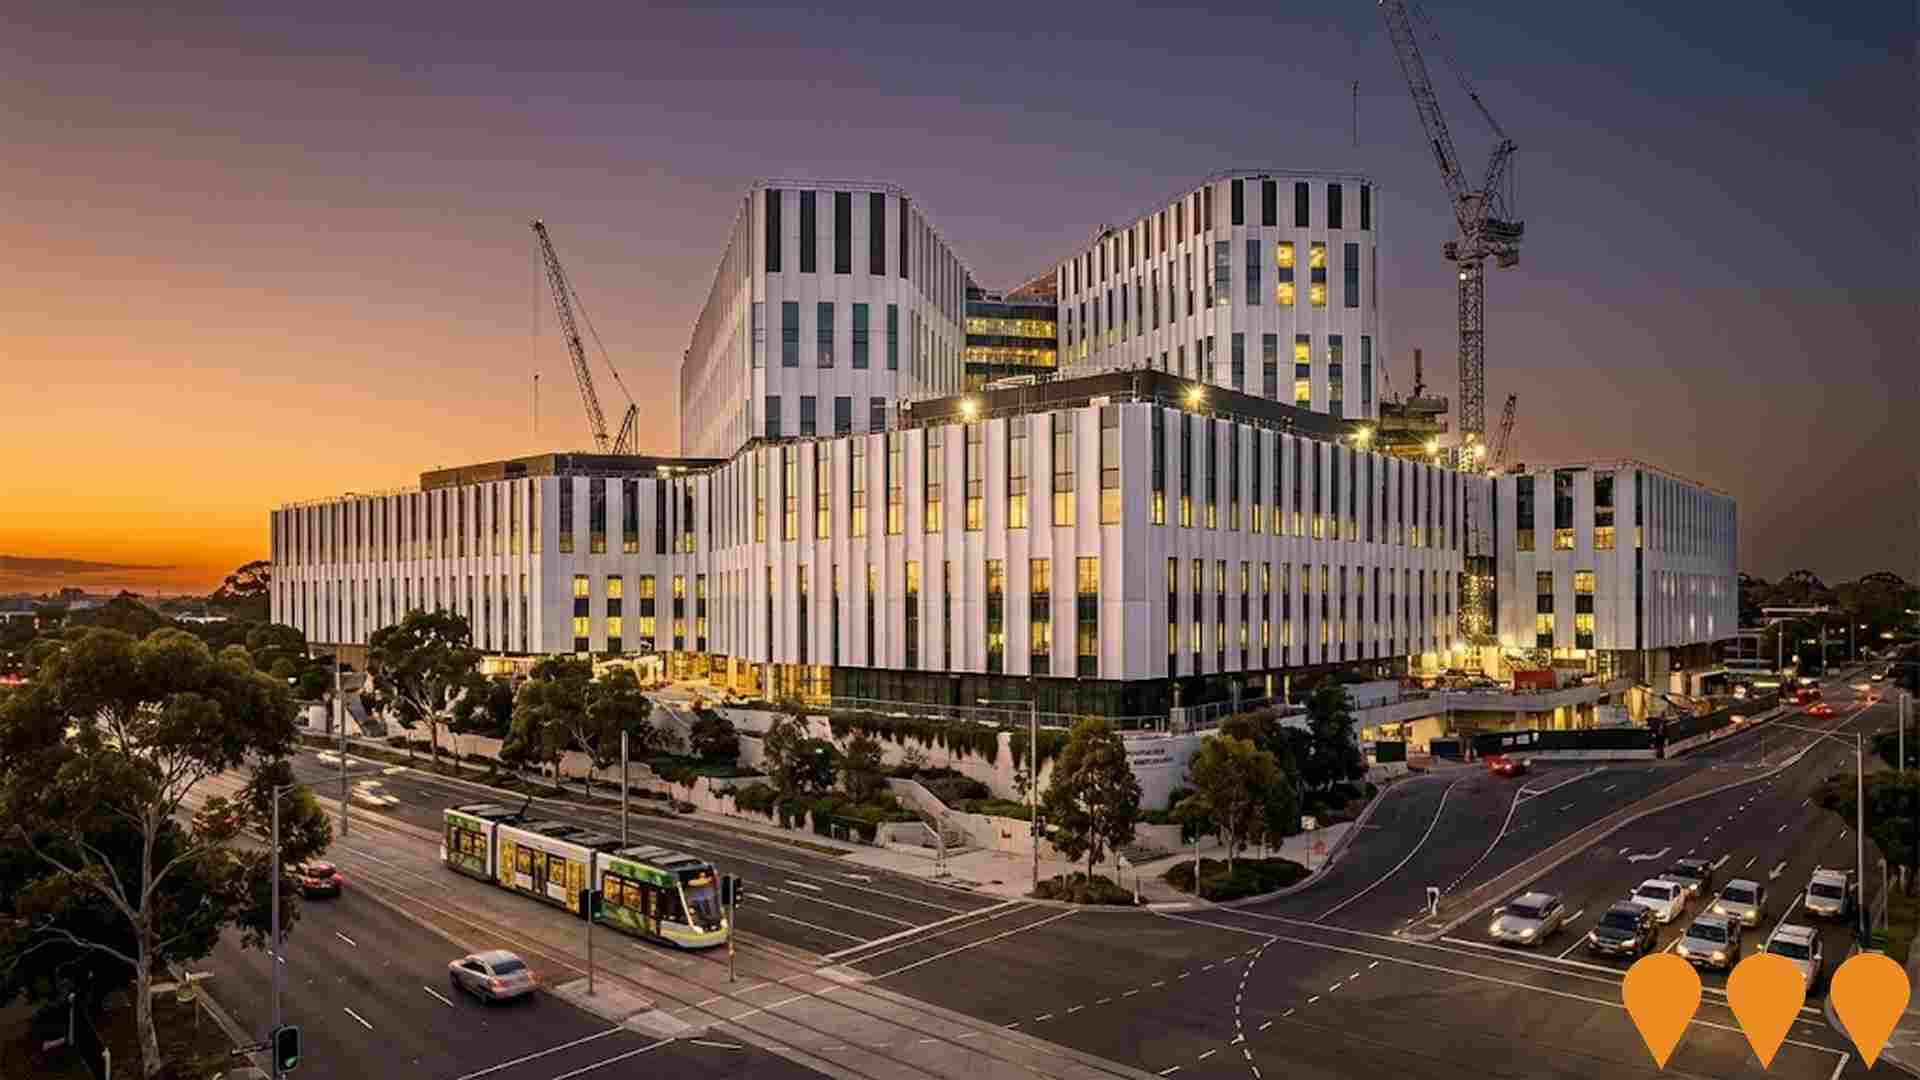
Southwark Grounds
Renewal SA is delivering a $1 billion mixed-use precinct on the former West End Brewery site in Thebarton. The 8.4-hectare riverfront development will provide up to 1,300 new homes (20% affordable), retail and hospitality tenancies, commercial office space, and more than 15% public open space linked to the River Torrens linear park. Heritage features including the Brew Tower and foundations of Colonel Light's Theberton Cottage are being retained. Early civil and remediation works commenced in mid-2025, with the first buildings now under construction and initial residents expected in late 2026.

Festival Plaza Tower 2
Adelaide's first skyscraper - a 38-storey, 160m commercial tower featuring 50,000 sqm of office space across 36 floors, 1,000 sqm of retail including restaurants, cafes and bars, a signature rooftop bar and restaurant with panoramic views of Adelaide Hills, and 800 sqm of additional public realm. Set to become Adelaide's largest and most sustainable commercial building, targeting 6 Star NABERS Energy rating and carbon neutrality by 2028. This will be the largest all-electric commercial building in South Australia with the city's largest solar array.
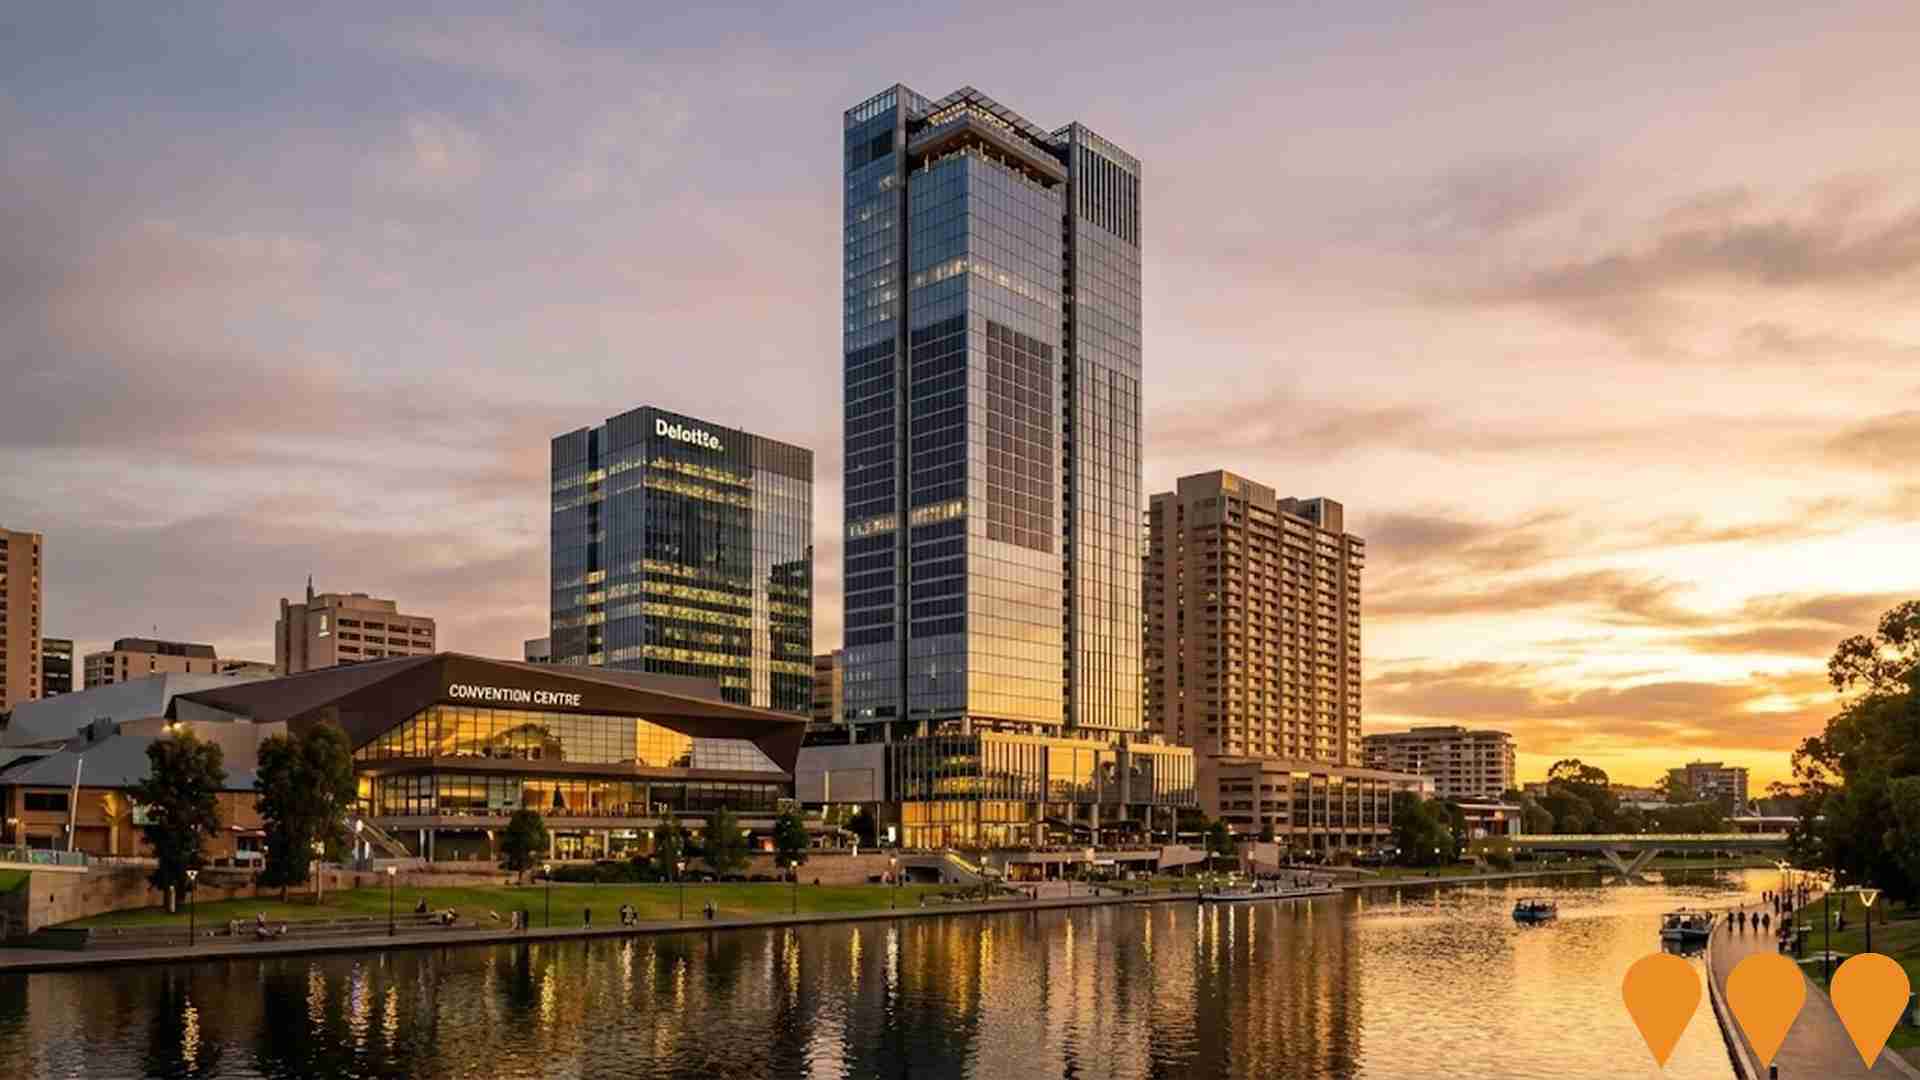
Calvary North Adelaide Hospital Redevelopment
Major $100m+ redevelopment and expansion of the private Calvary North Adelaide Hospital including a new theatre complex, expanded maternity and birthing suites, and additional inpatient beds.
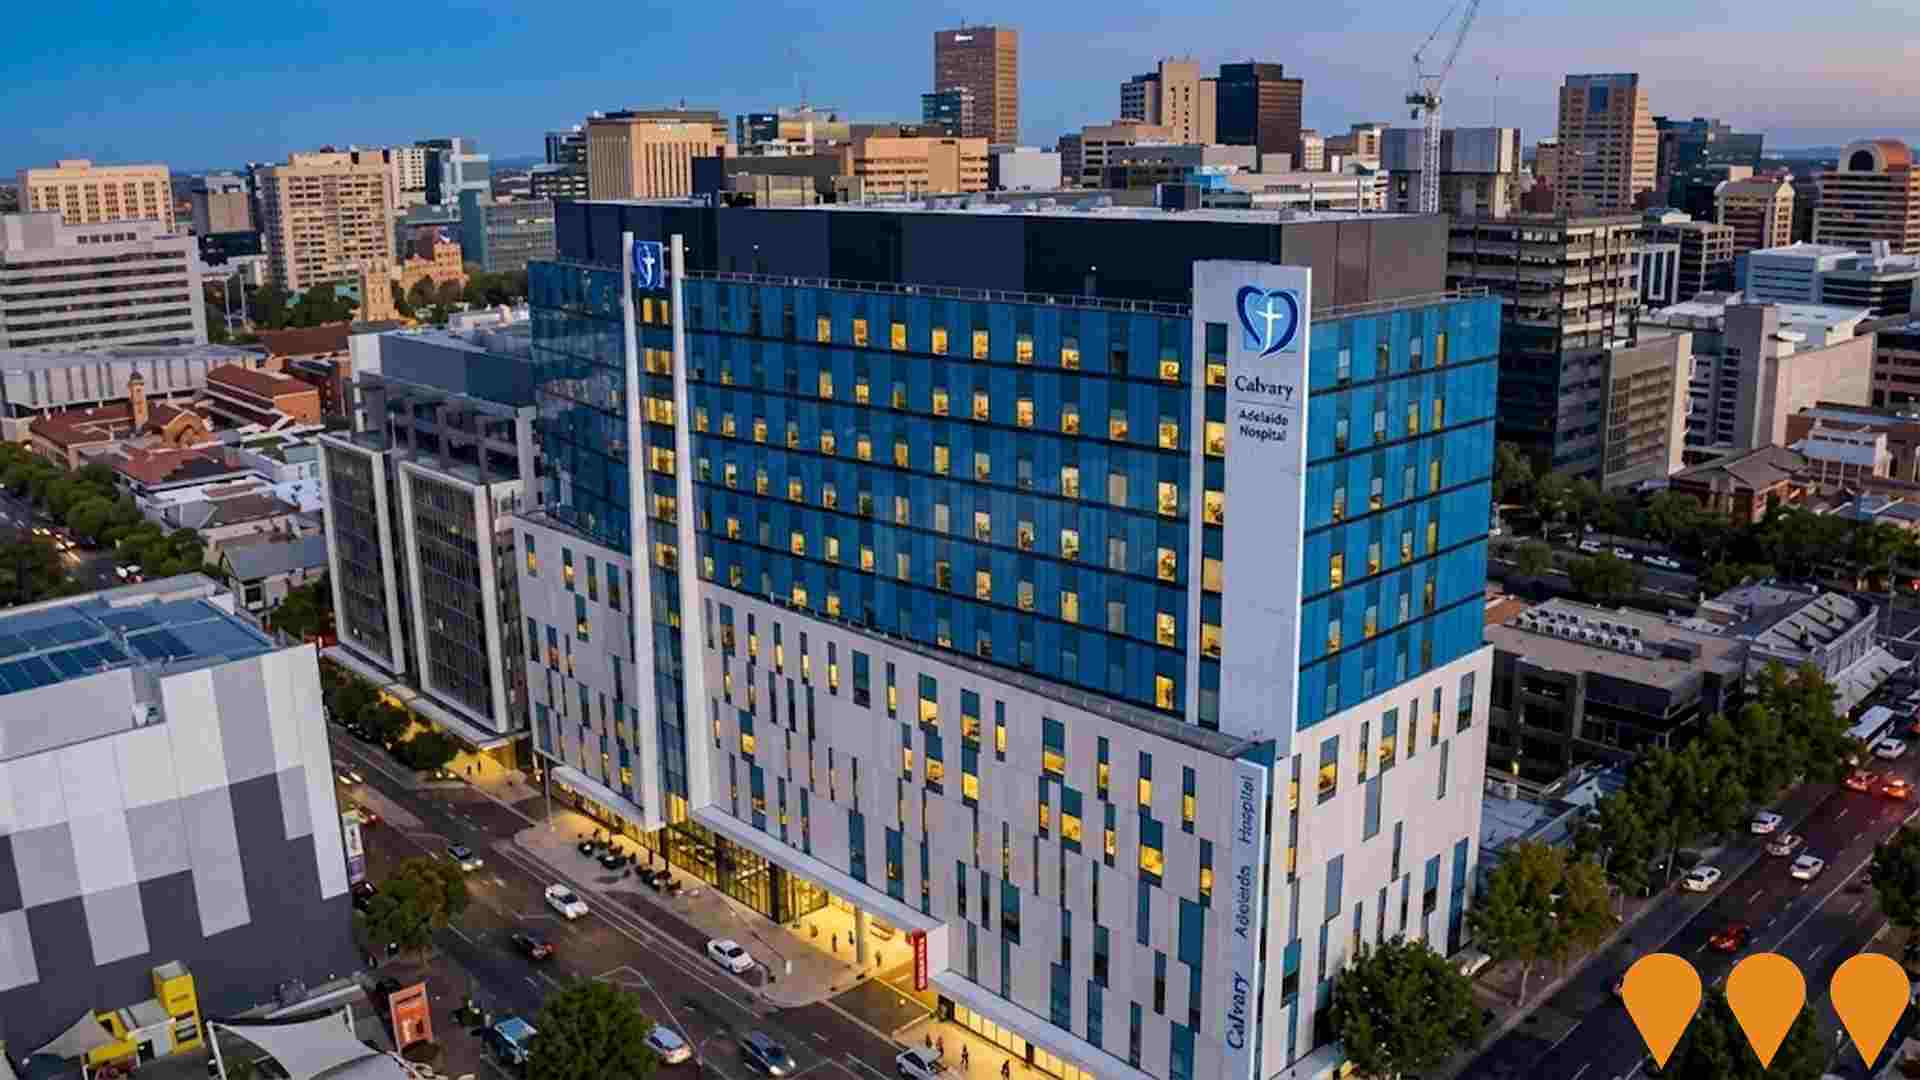
Grote & Gouger Precinct (Gurner x Kennards)
$1.25b mixed-use urban renewal of the former Australia Post site led by Gurner with Kennards Self Storage. Plans approved by SCAP in Nov 2023 for five towers (15-28 storeys) delivering around 600 apartments, a 220-room hotel, retail and commercial space, public plaza and wellness facilities. Subsequent DA variation in Jun 2024 increased dwellings and adjusted Tower 1 configuration. Architect: Fraser & Partners (formerly Elenberg Fraser).
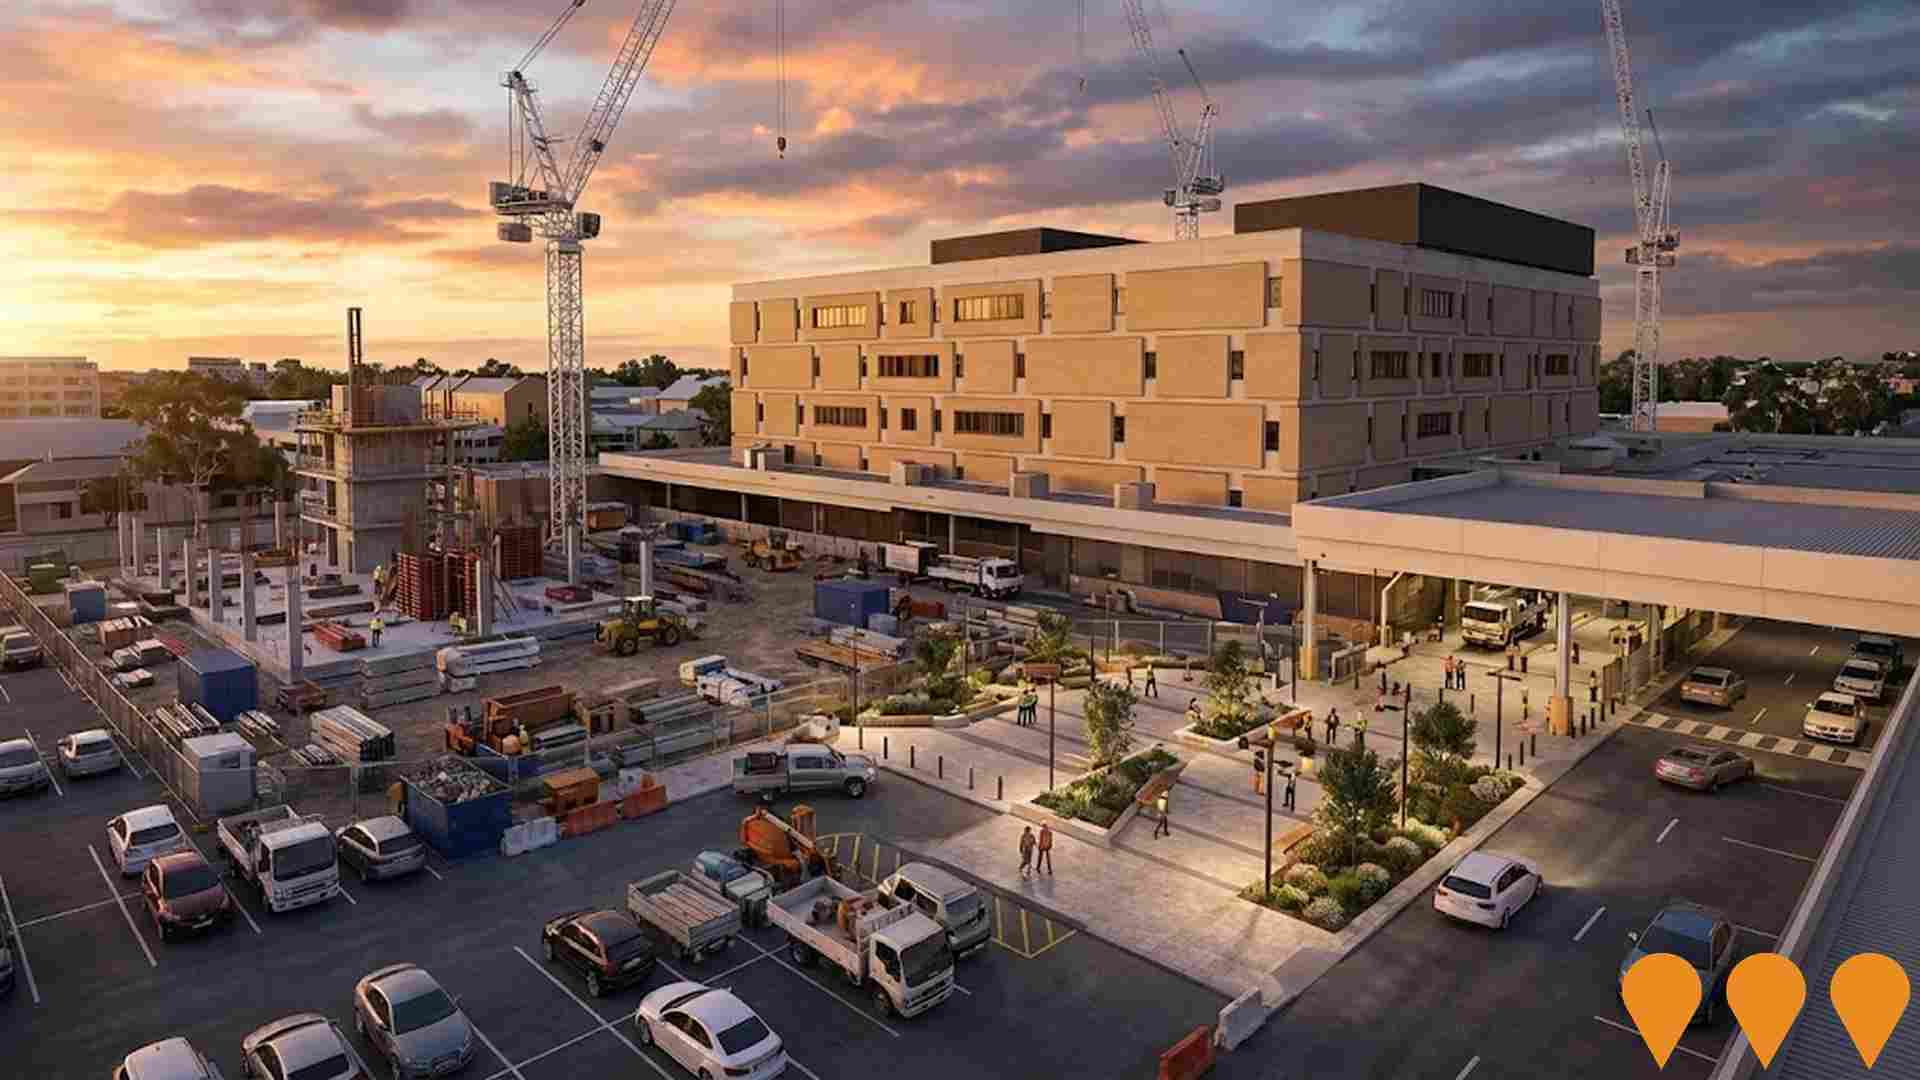
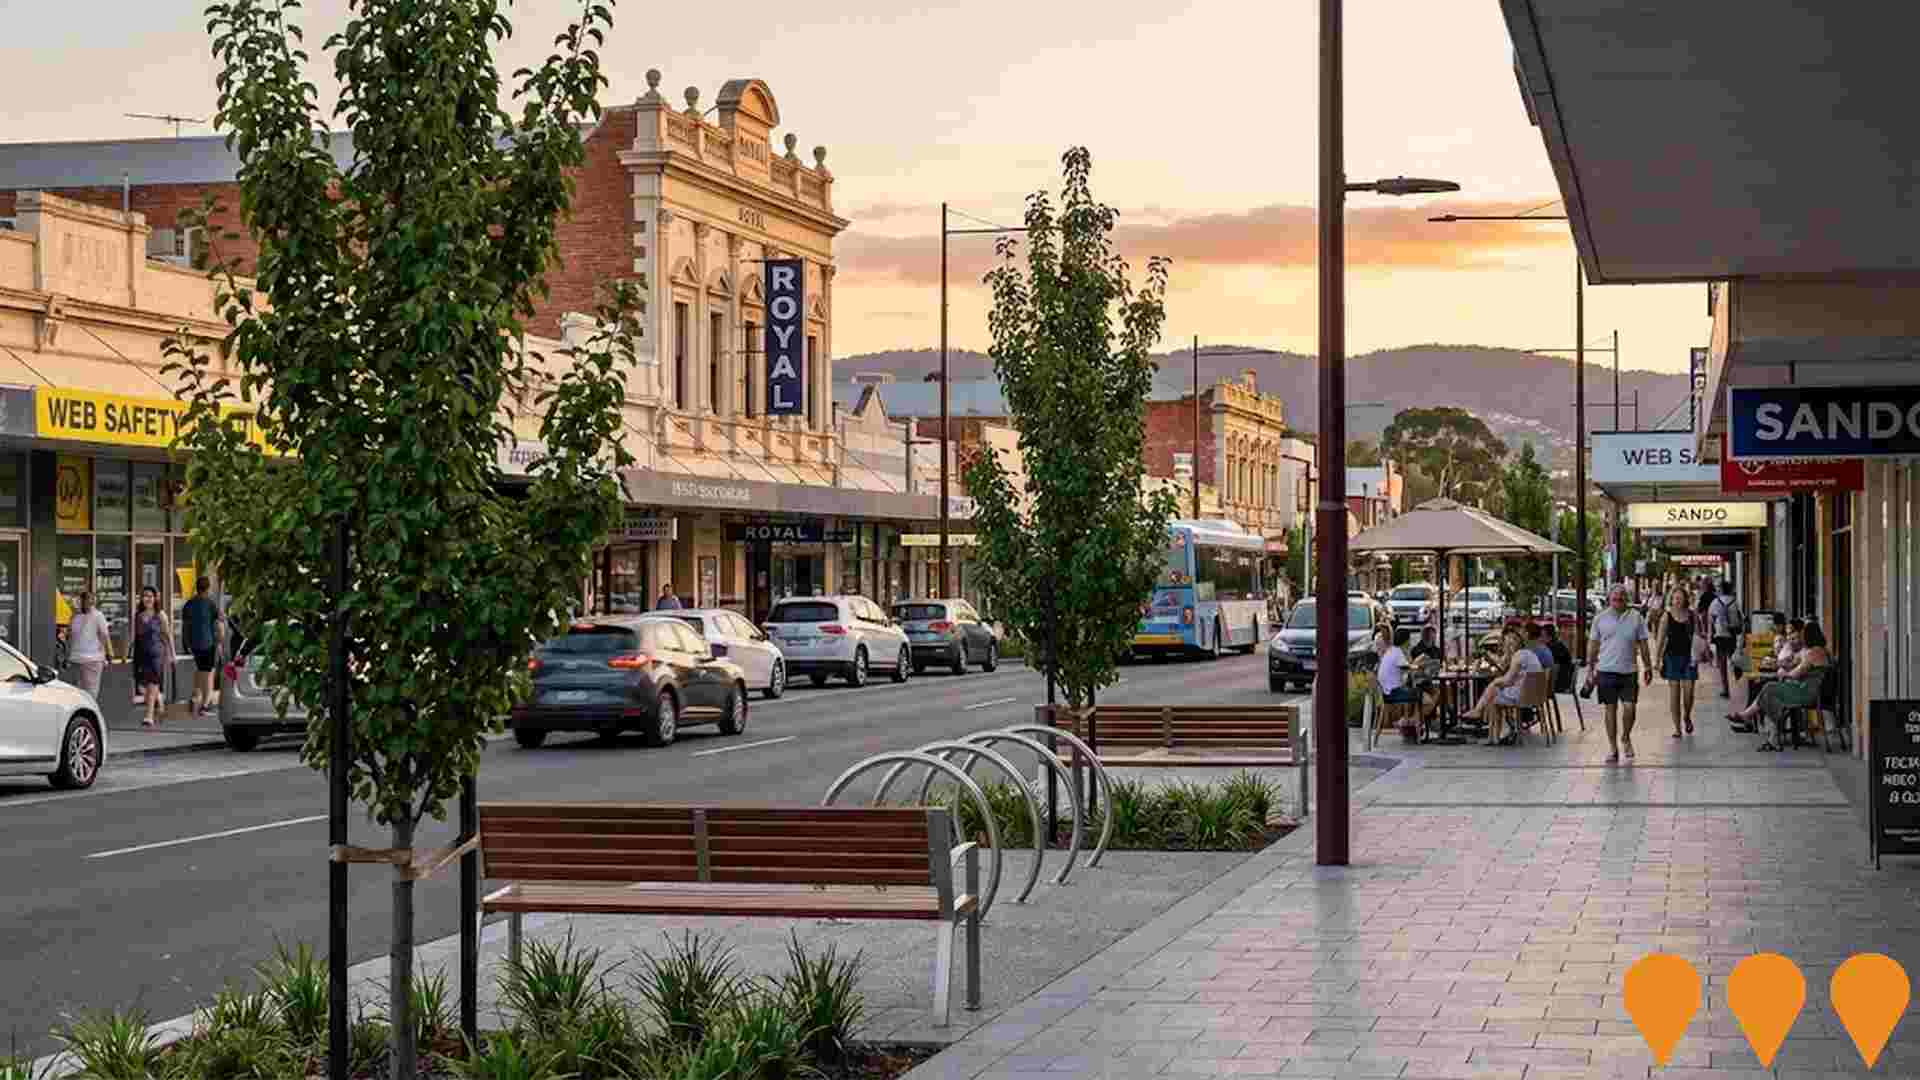
Henley Beach Road Visioning Project
City of West Torrens long-term main street renewal for a ~3 km corridor between Airport Road and the Bakewell Underpass. Council adopted the final Vision and Guiding Principles in Dec 2024 and is now developing action and project plans, with staged implementation and pilot projects to test streetscape, transport and dining precinct upgrades.
Sentinel Build-to-Rent Project (Bowden)
South Australia's first institutional build-to-rent community by Sentinel Australia. A 12-storey plus mezzanine development of about 240 rental apartments (studio, 1, 2 and 3 bed) with pet-friendly amenities, SOHO spaces, pool, fitness centre, resident lounge, BBQ areas and podium green terraces. Ground floor to include retail and on-site Kinleaf leasing/management office. Planning approval secured by SCAP; construction indicated to commence in 2025.
Employment
Employment conditions in Richmond demonstrate strong performance, ranking among the top 35% of areas assessed nationally
Richmond has a highly educated workforce with significant representation in essential services sectors. Its unemployment rate is 3.4%, lower than Greater Adelaide's 3.9%.
Employment growth over the past year was estimated at 4.5%. As of September 2025, Richmond has 11,118 residents employed with an unemployment rate of 0.5% below Greater Adelaide's. Workforce participation is higher at 66.8%, compared to Greater Adelaide's 61.7%. The leading employment industries are health care & social assistance, retail trade, and accommodation & food, with a strong specialization in the latter at 1.4 times the regional level.
Conversely, construction shows lower representation at 6.7% versus the regional average of 8.7%. Richmond functions as an employment hub with 1.2 workers per resident, hosting more jobs than residents and attracting workers from surrounding areas. Over the 12 months to September 2025, employment increased by 4.5% while labour force increased by 4.2%, resulting in a 0.3 percentage point decrease in unemployment. In contrast, Greater Adelaide experienced employment growth of 3.0% and labour force growth of 2.9%, with a 0.1 percentage point drop. State-level data to 25-Nov shows SA employment grew by 1.19% year-on-year, adding 10,710 jobs, with the state unemployment rate at 4.0%. National employment forecasts from May-25 project national employment growth of 6.6% over five years and 13.7% over ten years. Applying these projections to Richmond's employment mix suggests local employment should increase by 6.8% over five years and 14.1% over ten years, though this is a simple weighting extrapolation for illustrative purposes and does not account for localised population projections.
Frequently Asked Questions - Employment
Income
Income levels align closely with national averages, indicating typical economic conditions for Australian communities according to AreaSearch analysis
AreaSearch released postcode level ATO data for financial year 2022. Richmond SA2 had a median income among taxpayers of $52,505 and an average of $62,632. These figures were slightly below the national averages of $54,871 (median) and $71,971 (average). In Greater Adelaide, the median was $52,592 and the average was $64,886. Based on Wage Price Index growth of 12.83% since financial year 2022, estimated incomes for September 2025 would be approximately $59,241 (median) and $70,668 (average). According to the 2021 Census, Richmond's household, family, and personal incomes ranked modestly, between the 38th and 43rd percentiles. Income distribution showed that 31.6% of locals (5,817 people) earned between $1,500 and $2,999, similar to regional levels where 31.8% fell into this bracket. Housing affordability pressures were severe, with only 83.5% of income remaining after housing costs, ranking at the 39th percentile. Richmond's SEIFA income ranking placed it in the 5th decile.
Frequently Asked Questions - Income
Housing
Richmond displays a diverse mix of dwelling types, with a higher proportion of rental properties than the broader region
Richmond's latest Census data shows 66.2% houses and 33.8% other dwellings. Adelaide metro has 63.9% houses and 36.2% other dwellings. Home ownership in Richmond is 27.9%, with mortgaged dwellings at 29.3% and rented at 42.8%. The median monthly mortgage repayment in Richmond is $1,733, lower than Adelaide metro's $1,745 and the national average of $1,863. Median weekly rent in Richmond is $325, below Adelaide metro's $310 and the national figure of $375.
Frequently Asked Questions - Housing
Household Composition
Richmond features high concentrations of group households and lone person households, with a fairly typical median household size
Family households account for 59.3 percent of all households, including 23.0 percent couples with children, 23.5 percent couples without children, and 10.9 percent single parent families. Non-family households constitute the remaining 40.7 percent, with lone person households at 31.6 percent and group households comprising 9.1 percent of the total. The median household size is 2.3 people, which aligns with the Greater Adelaide average.
Frequently Asked Questions - Households
Local Schools & Education
The educational profile of Richmond exceeds national averages, with above-average qualification levels and academic performance metrics
Richmond's residents aged 15+ have a higher proportion with university qualifications (37.5%) compared to South Australia's average (25.7%) and Greater Adelaide's (28.9%). Bachelor degrees are the most common (24.9%), followed by postgraduate qualifications (9.3%) and graduate diplomas (3.3%). Vocational credentials are also prevalent, with 26.0% of residents holding them, including advanced diplomas (9.3%) and certificates (16.7%). Richmond has a high educational participation rate of 28.1%, comprising tertiary education (10.1%), primary education (7.2%), and secondary education (4.9%).
Educational participation is notably high, with 28.1% of residents currently enrolled in formal education. This includes 10.1% in tertiary education, 7.2% in primary education, and 4.9% pursuing secondary education.
Frequently Asked Questions - Education
Schools Detail
Nearby Services & Amenities
Transport
Transport servicing is good compared to other areas nationally based on assessment of service frequency, route connectivity and accessibility
Richmond has 91 active public transport stops offering a mix of train and bus services. These stops are served by 51 different routes, together facilitating 4,343 weekly passenger trips. The city's transport accessibility is rated good, with residents on average located 221 meters from the nearest stop.
Service frequency across all routes averages 620 trips per day, equating to about 47 weekly trips per individual stop.
Frequently Asked Questions - Transport
Transport Stops Detail
Health
Richmond's residents are healthier than average in comparison to broader Australia with prevalence of common health conditions quite low among the general population though higher than the nation's average across older, at risk cohorts
Richmond's health data shows a relatively positive picture with low prevalence of common conditions among its general population compared to national averages, but higher among older, at-risk cohorts.
Approximately 51% (~9,408 people) have private health cover, slightly lower than the average SA2 area. Mental health issues and arthritis are the most prevalent medical conditions, affecting 9.0% and 7.0% of residents respectively. About 70.4% of residents report no medical ailments, compared to 70.9% across Greater Adelaide. Richmond has 15.5% (2,859 people) of residents aged 65 and over, lower than Greater Adelaide's 17.6%. Health outcomes among seniors require more attention than the broader population.
Frequently Asked Questions - Health
Cultural Diversity
Richmond was found to be more culturally diverse than the vast majority of local markets in Australia, upon assessment of a range of language and cultural background related metrics
Richmond's cultural diversity is notable, with 33.0% of its population born overseas and 34.6% speaking a language other than English at home. Christianity is the predominant religion in Richmond, accounting for 43.0% of its residents. However, the category 'Other' in religion appears to be slightly overrepresented in Richmond compared to Greater Adelaide, with 2.6% versus 3.1%.
The top three ancestry groups in Richmond are English (20.2%), Australian (18.1%), and Other (11.9%). Some ethnic groups show notable differences in representation: Greeks make up 9.5% of Richmond's population compared to 6.1% regionally, Poles account for 1.1% versus 0.9%, and Italians comprise 6.9% versus 6.7%.
Frequently Asked Questions - Diversity
Age
Richmond's population is slightly younger than the national pattern
The median age in Richmond is 36 years, which is slightly lower than Greater Adelaide's average of 39 and also lower than Australia's median of 38. Compared to Greater Adelaide, Richmond has a higher proportion of residents aged 25-34 (22.0%), but fewer residents aged 5-14 (7.9%). This concentration of 25-34 year-olds is significantly higher than the national average of 14.5%. According to the 2021 Census, the proportion of Richmond's population aged 25 to 34 has increased from 20.6% to 22.0%, while the proportion of those aged 45 to 54 has decreased from 12.7% to 11.2%. By 2041, Richmond is projected to experience significant changes in its age distribution. Notably, the number of residents aged 75-84 is expected to grow by 57%, increasing from 828 to 1,303 people.
