Chart Color Schemes
This analysis uses ABS Statistical Areas Level 2 (SA2) boundaries, which can materially differ from Suburbs and Localities (SAL) even when sharing similar names.
SA2 boundaries are defined by the Australian Bureau of Statistics and are designed to represent communities for statistical reporting (e.g., census and ERP).
Suburbs and Localities (SAL) represent commonly-used suburb/locality names (postal-style areas) and may use different geographic boundaries. For comprehensive analysis, consider reviewing both boundary types if available.
est. as @ -- *
ABS ERP | -- people | --
2021 Census | -- people
Sales Activity
Curious about local property values? Filter the chart to assess the volume and appreciation (including resales) trends and regional comparisons, or scroll to the map below view this information at an individual property level.
Find a Recent Sale
Sales Detail
Population
Population growth drivers in Plympton are strong compared to national averages based on AreaSearch's ranking of recent, and medium to long-term trends
Plympton's population, as per AreaSearch's analysis, is approximately 28,466 as of November 2025. This figure reflects an increase of 1,986 people since the 2021 Census, which reported a population of 26,480. The change is inferred from the estimated resident population of 28,328 in June 2024 and an additional 307 validated new addresses since the Census date. This results in a population density ratio of 2,660 persons per square kilometer, placing Plympton in the upper quartile relative to national locations assessed by AreaSearch. The area's growth rate of 7.5% since the 2021 census exceeded both the state (7.1%) and SA3 area averages, indicating it as a growth leader in the region. Overseas migration contributed approximately 96.5% of overall population gains during recent periods.
AreaSearch adopts ABS/Geoscience Australia projections for each SA2 area, released in 2024 with a base year of 2022. For areas not covered by this data and years post-2032, the SA State Government's Regional/LGA projections by age category are adopted, based on 2021 data and released in 2023. These projections indicate a significant population increase for Plympton, with an expected growth of 7,481 persons to reach approximately 35,947 by 2041. This reflects a total gain of 25.8% over the 17-year period.
Frequently Asked Questions - Population
Development
AreaSearch assessment of residential development activity positions Plympton among the top 25% of areas assessed nationwide
Plympton has recorded approximately 208 residential properties granted approval annually. Over the past five financial years, from FY-21 to FY-25, around 1,040 homes have been approved, with an additional 90 approved in FY-26 so far. On average, each dwelling has accommodated about 2.1 new residents per year over these five years, reflecting strong demand that supports property values.
The average construction cost value of new homes being built is approximately $257,000. This financial year has seen around $116.5 million in commercial approvals, indicating robust local business investment. Compared to Greater Adelaide, Plympton exhibits moderately higher development activity, with an 18.0% increase per person over the five-year period, offering good buyer choice while sustaining existing property values. New developments comprise 40.0% standalone homes and 60.0% attached dwellings, shifting from the area's current housing composition of 58.0% houses. This denser development trend provides accessible entry options, appealing to downsizers, investors, and first-time buyers.
Plympton reflects a developing area with around 152 people per approval. Population forecasts indicate that Plympton will gain approximately 7,336 residents by 2041, according to the latest AreaSearch quarterly estimate. Development is keeping pace with projected growth, though increasing competition among buyers is expected as the population expands.
Frequently Asked Questions - Development
Infrastructure
Plympton has limited levels of nearby infrastructure activity, ranking in the 8thth percentile nationally
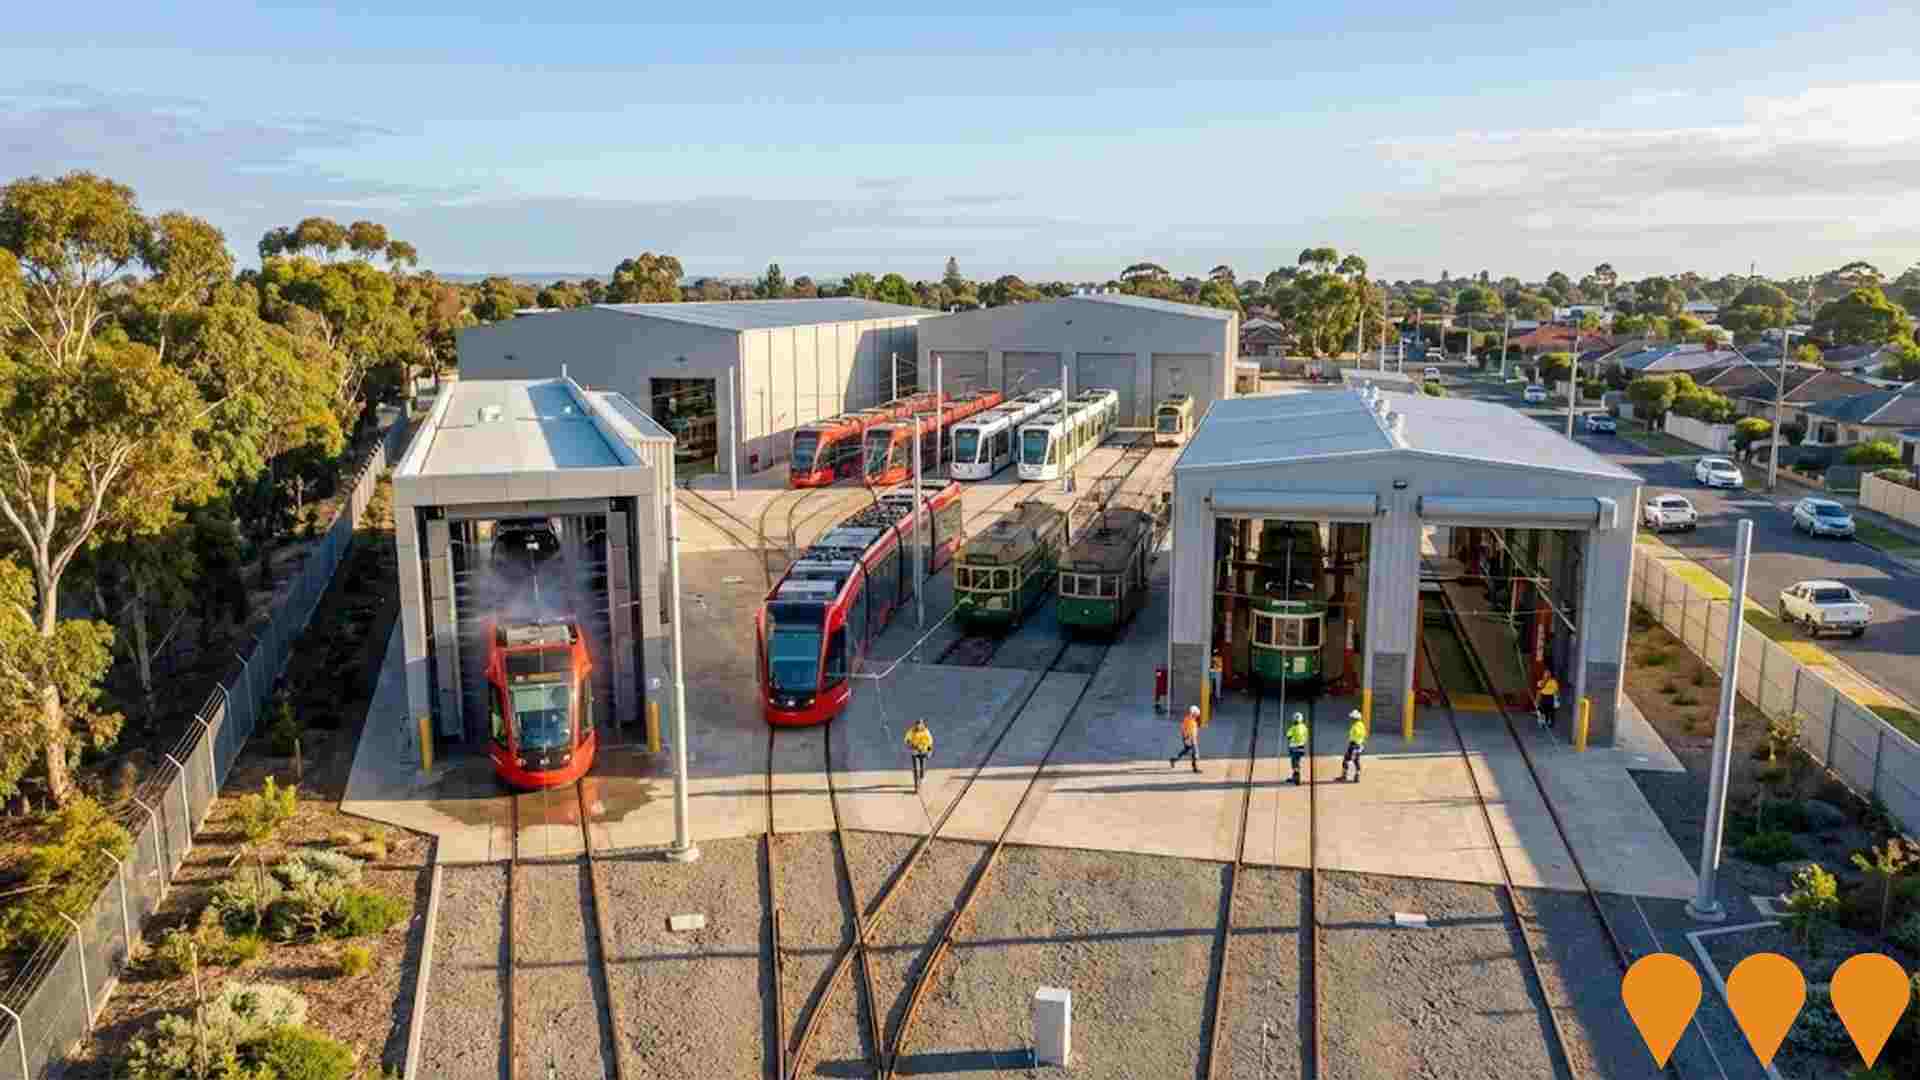
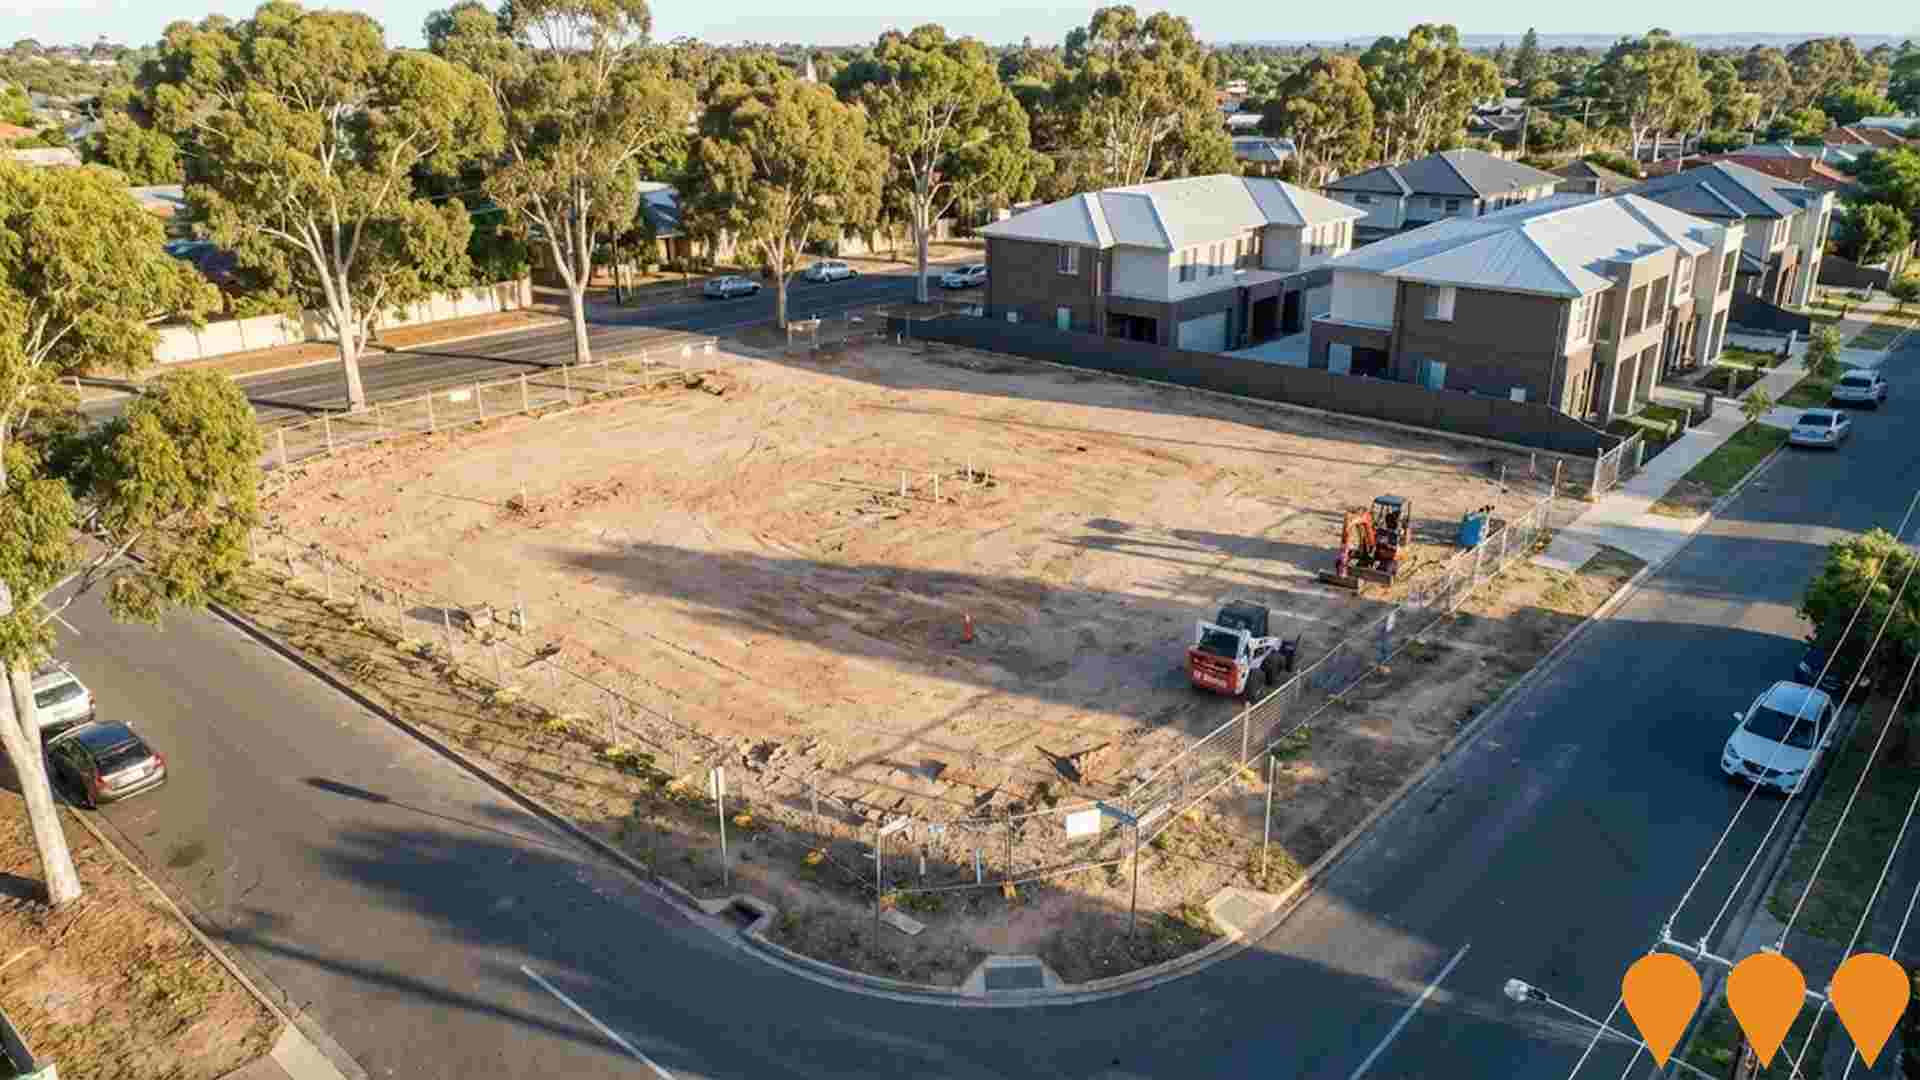
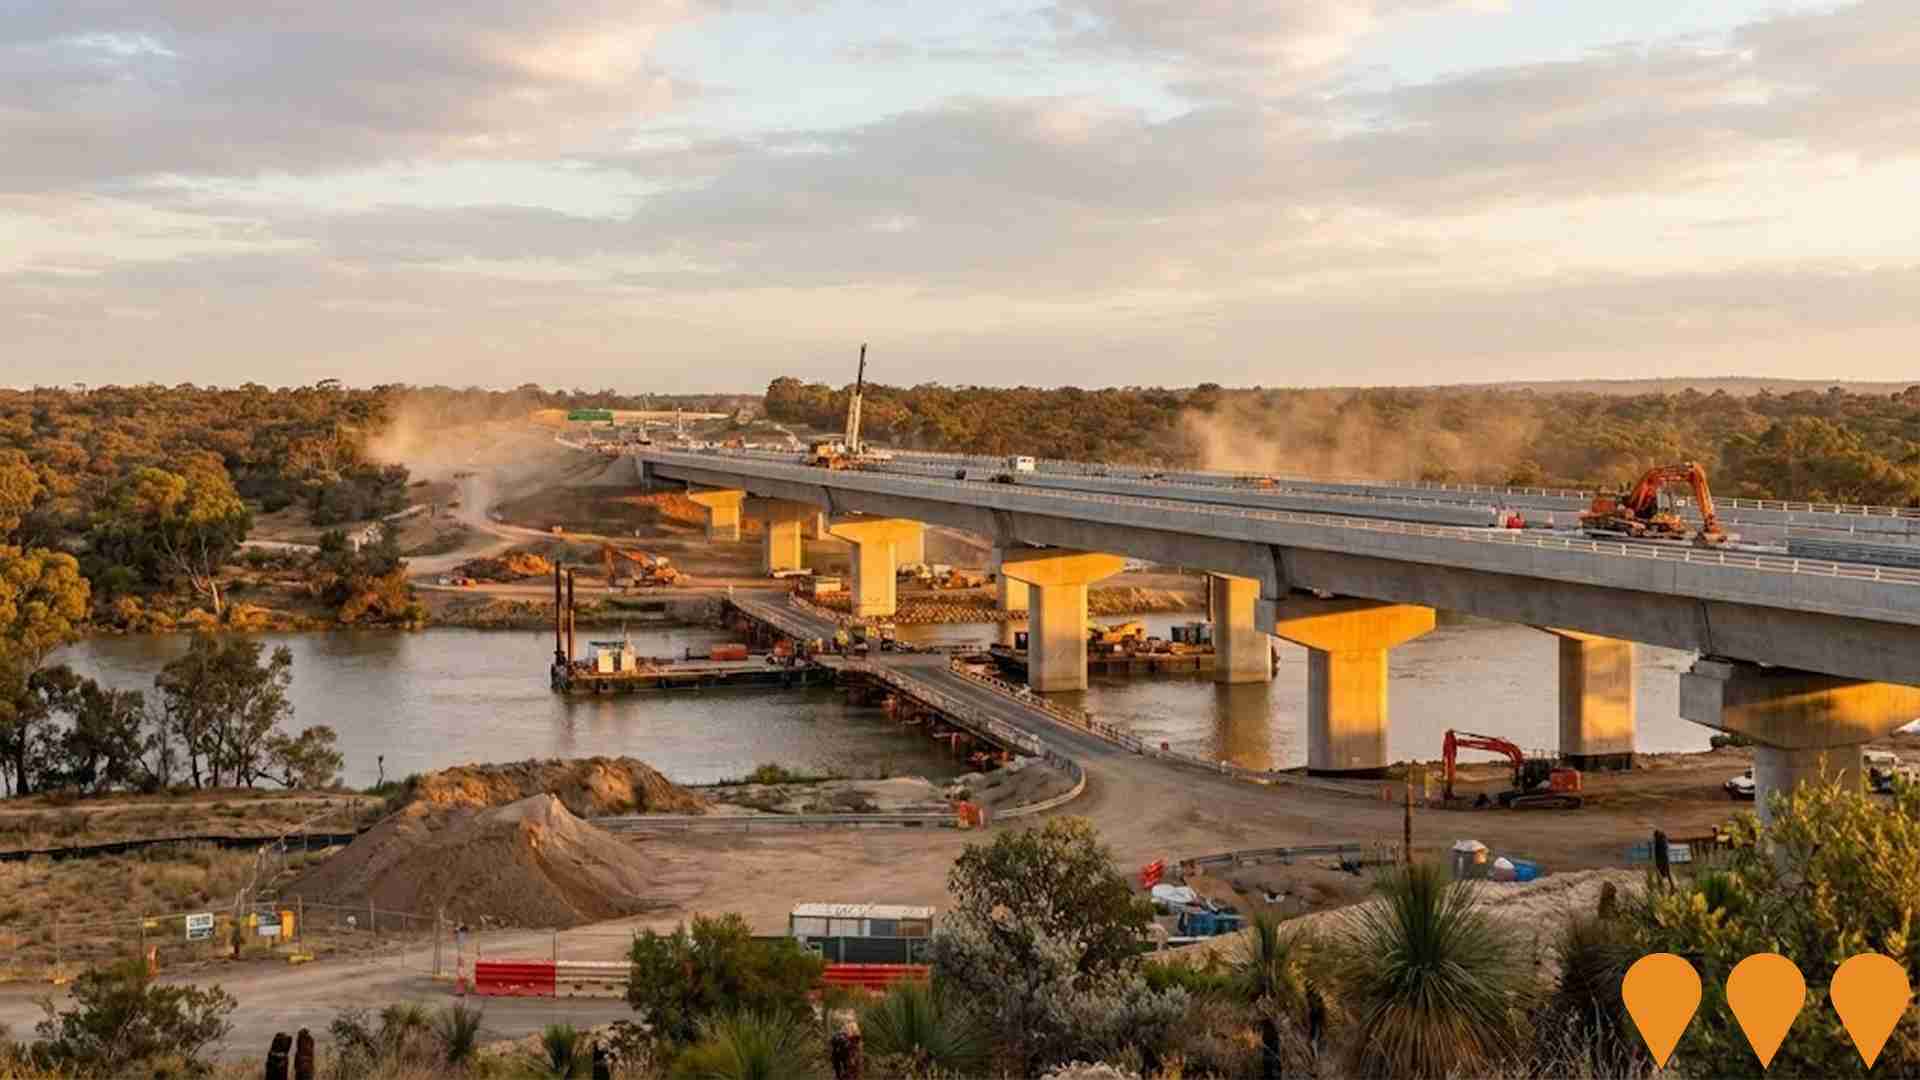
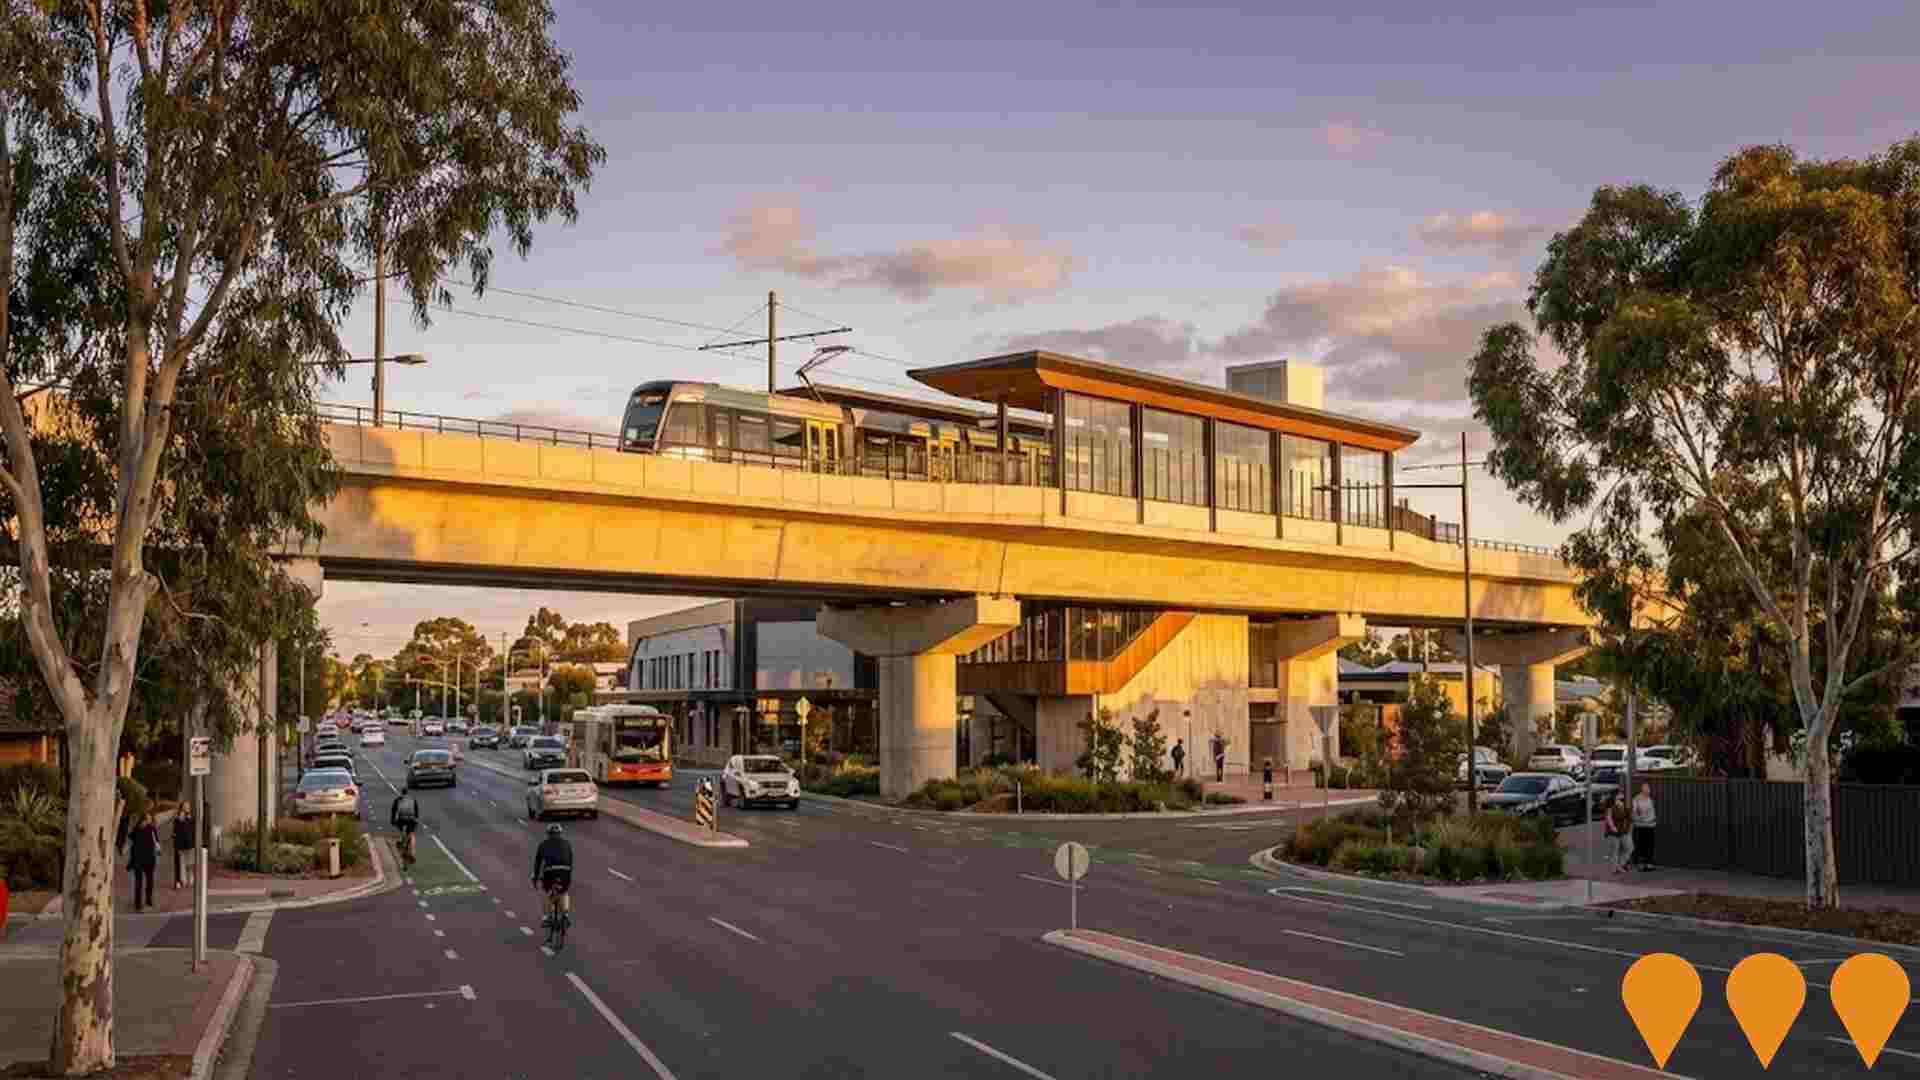
Changes to local infrastructure significantly impact an area's performance. AreaSearch identified 16 projects likely affecting the area. Notable ones are: Tram Grade Separation Projects, Mooringe Avenue Development in North Plympton, Tram Grade Separation Project along the Glenelg Line, and Project Flight - Adelaide Airport Terminal and Infrastructure Upgrade. The following list details those most relevant.
Professional plan users can use the search below to filter and access additional projects.
INFRASTRUCTURE SEARCH
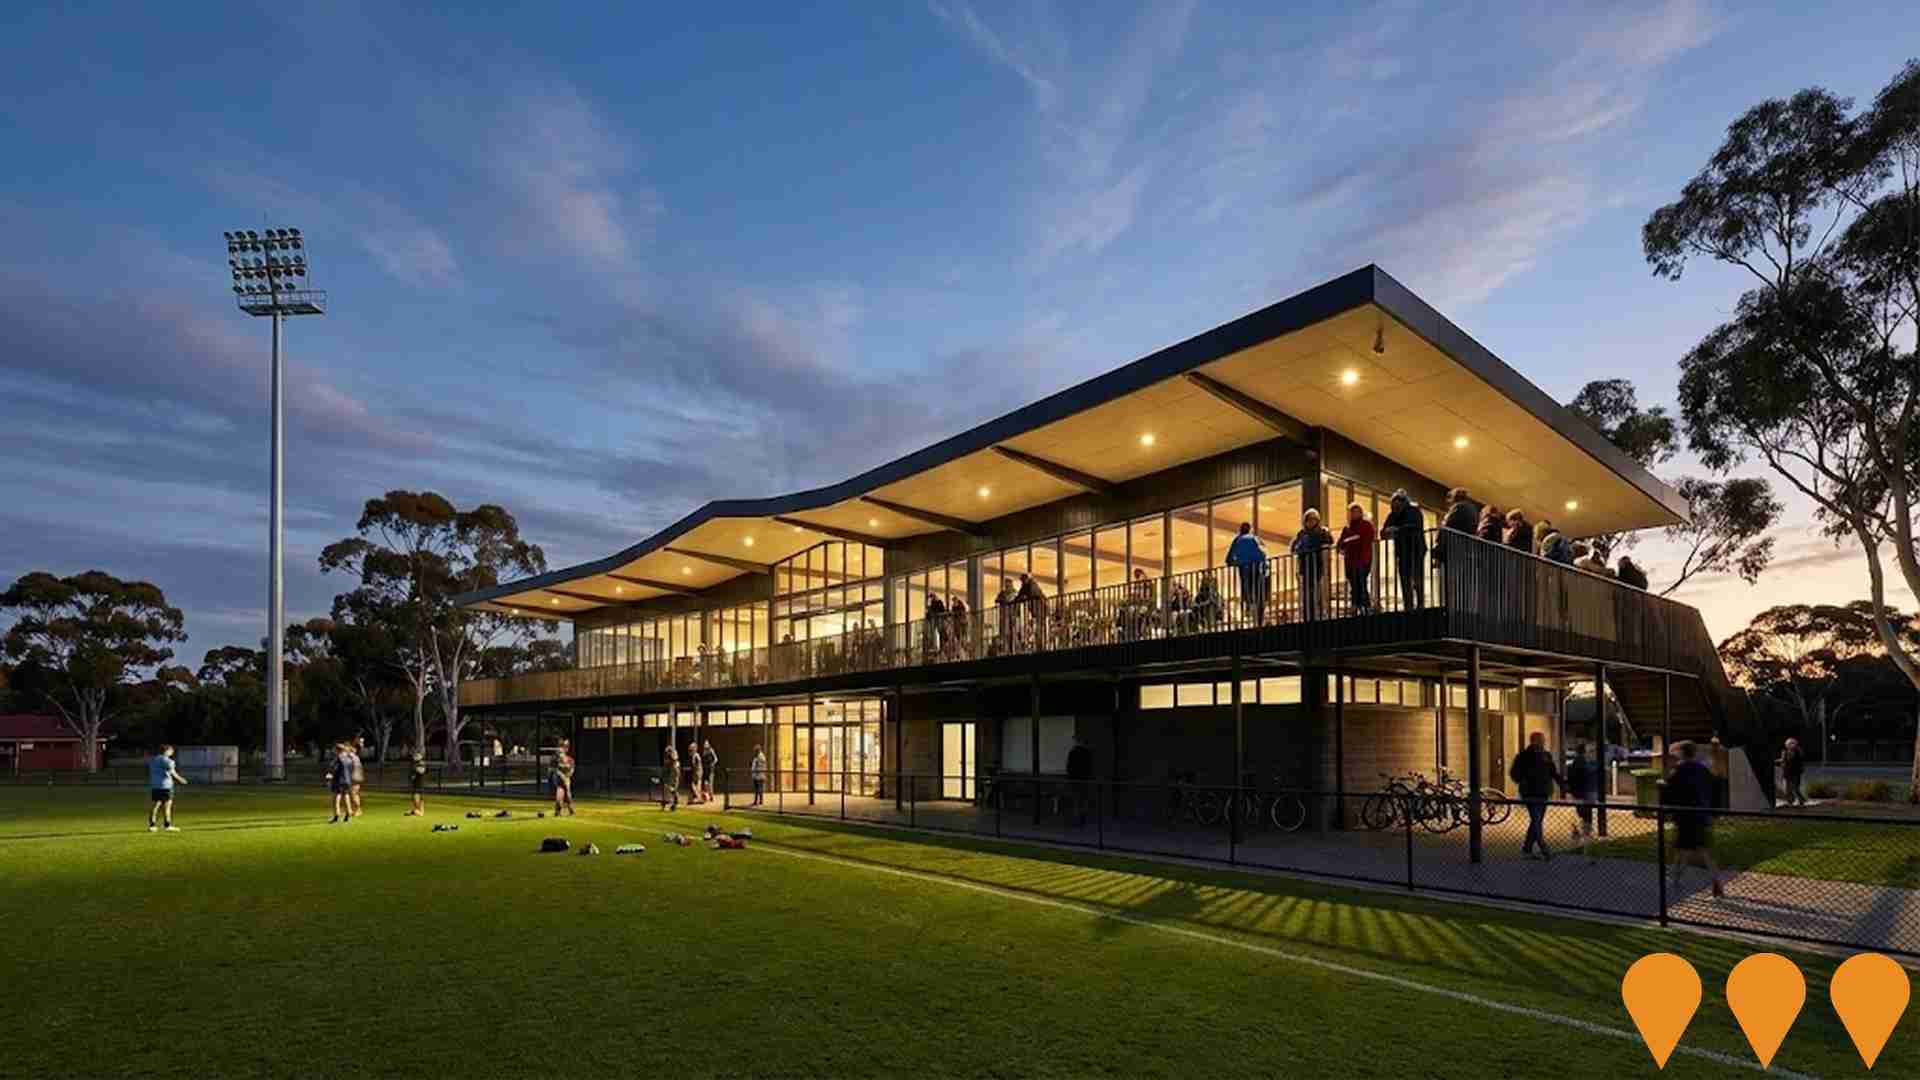
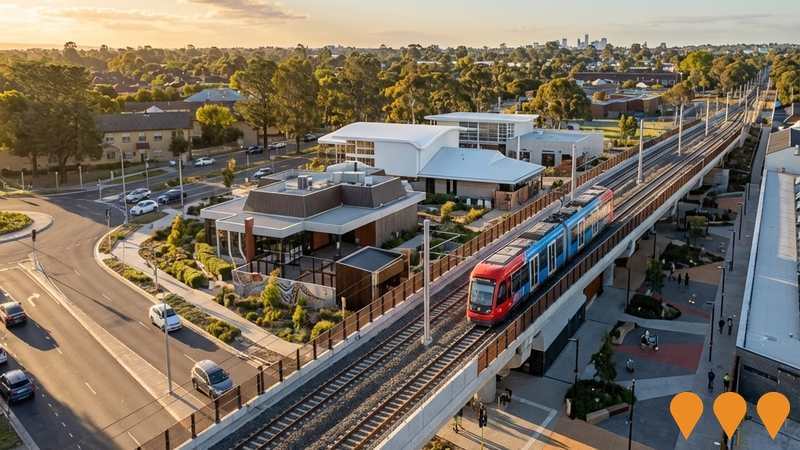
 Denotes AI-based impression for illustrative purposes only, not to be taken as definitive under any circumstances. Please follow links and conduct other investigations from the project's source for actual imagery. Developers and project owners wishing us to use original imagery please Contact Us and we will do so.
Frequently Asked Questions - Infrastructure
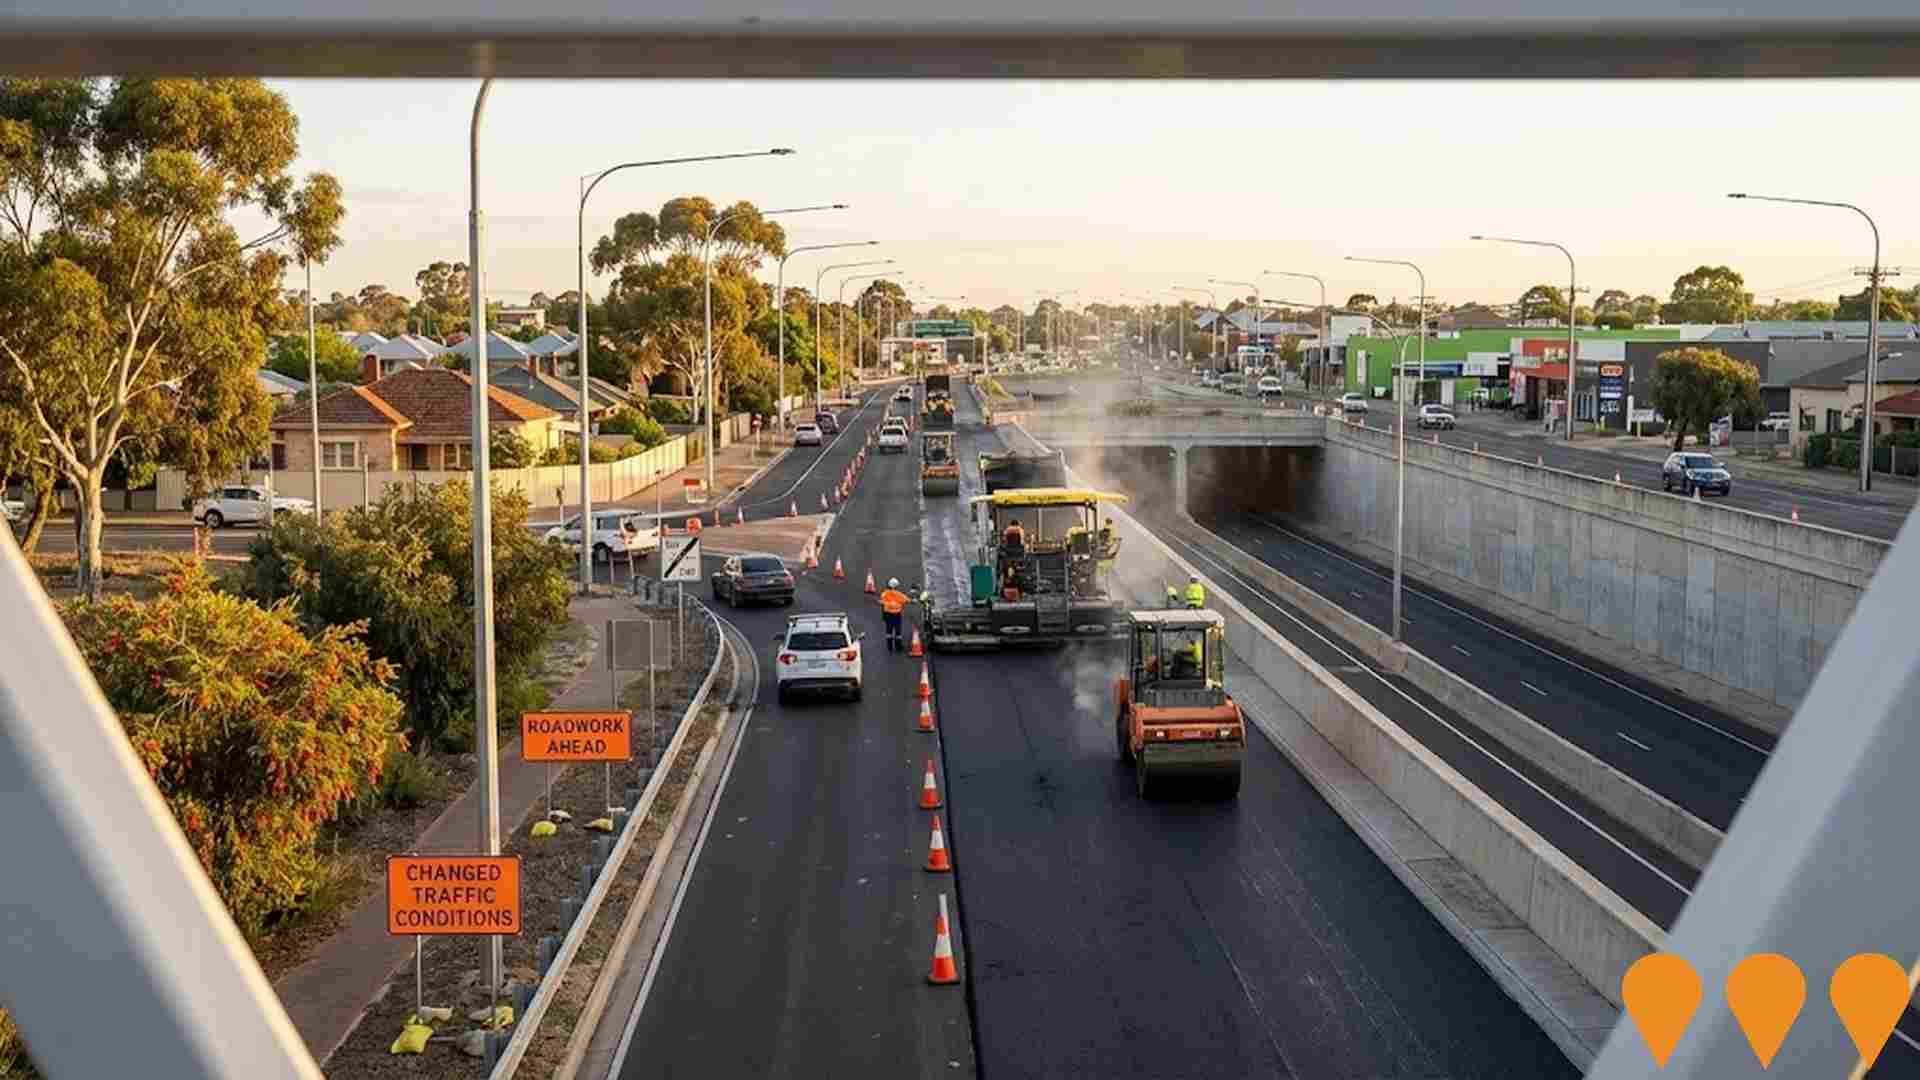
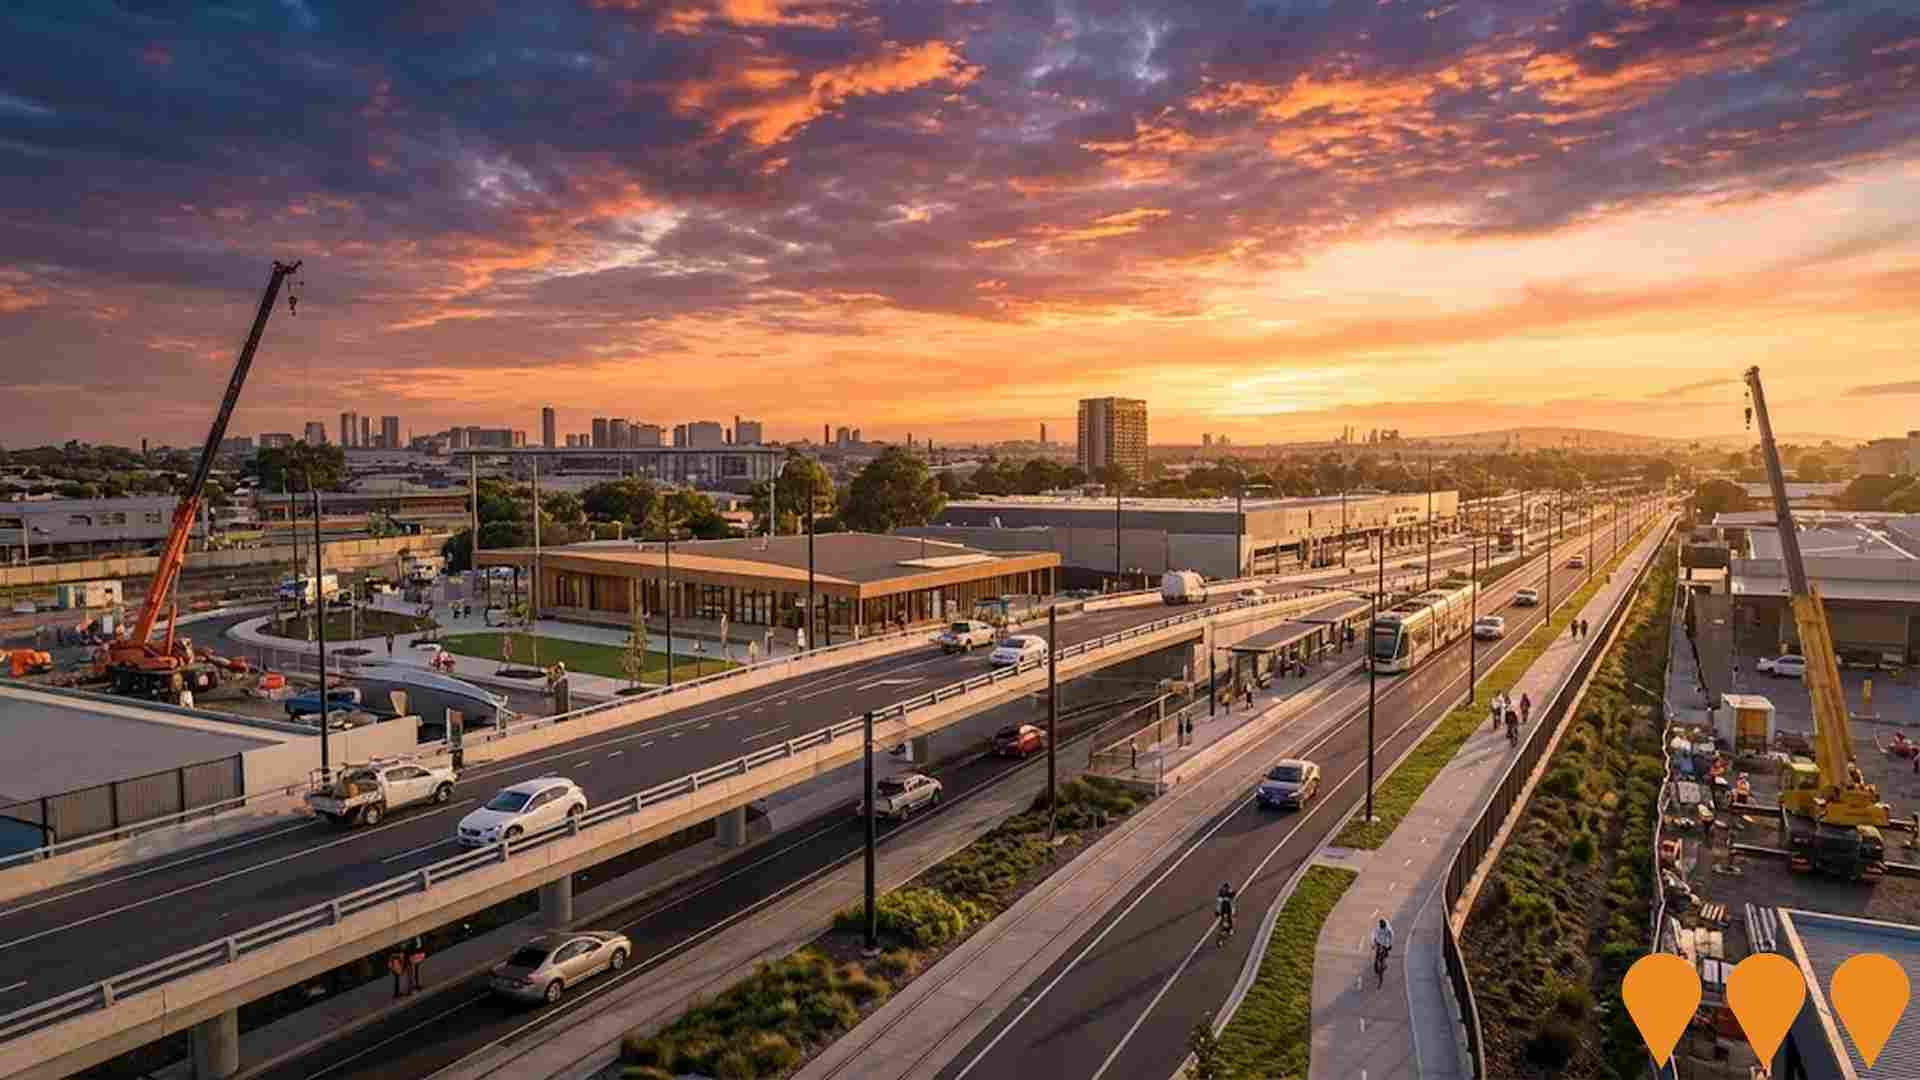
Tram Grade Separation Projects
South Australian Government project to remove three level crossings on the Glenelg tram line by raising the tram over Cross Road, Marion Road and Morphett Road. The existing South Road tram overpass is also being rebuilt. Works include new tram stops, shared-use paths, intersection upgrades and improved road/pedestrian connections. A six-month full tram line closure from Adelaide CBD to Glenelg commenced in August 2025 to enable major construction. The project will eliminate delays, improve safety and support future tram extensions.
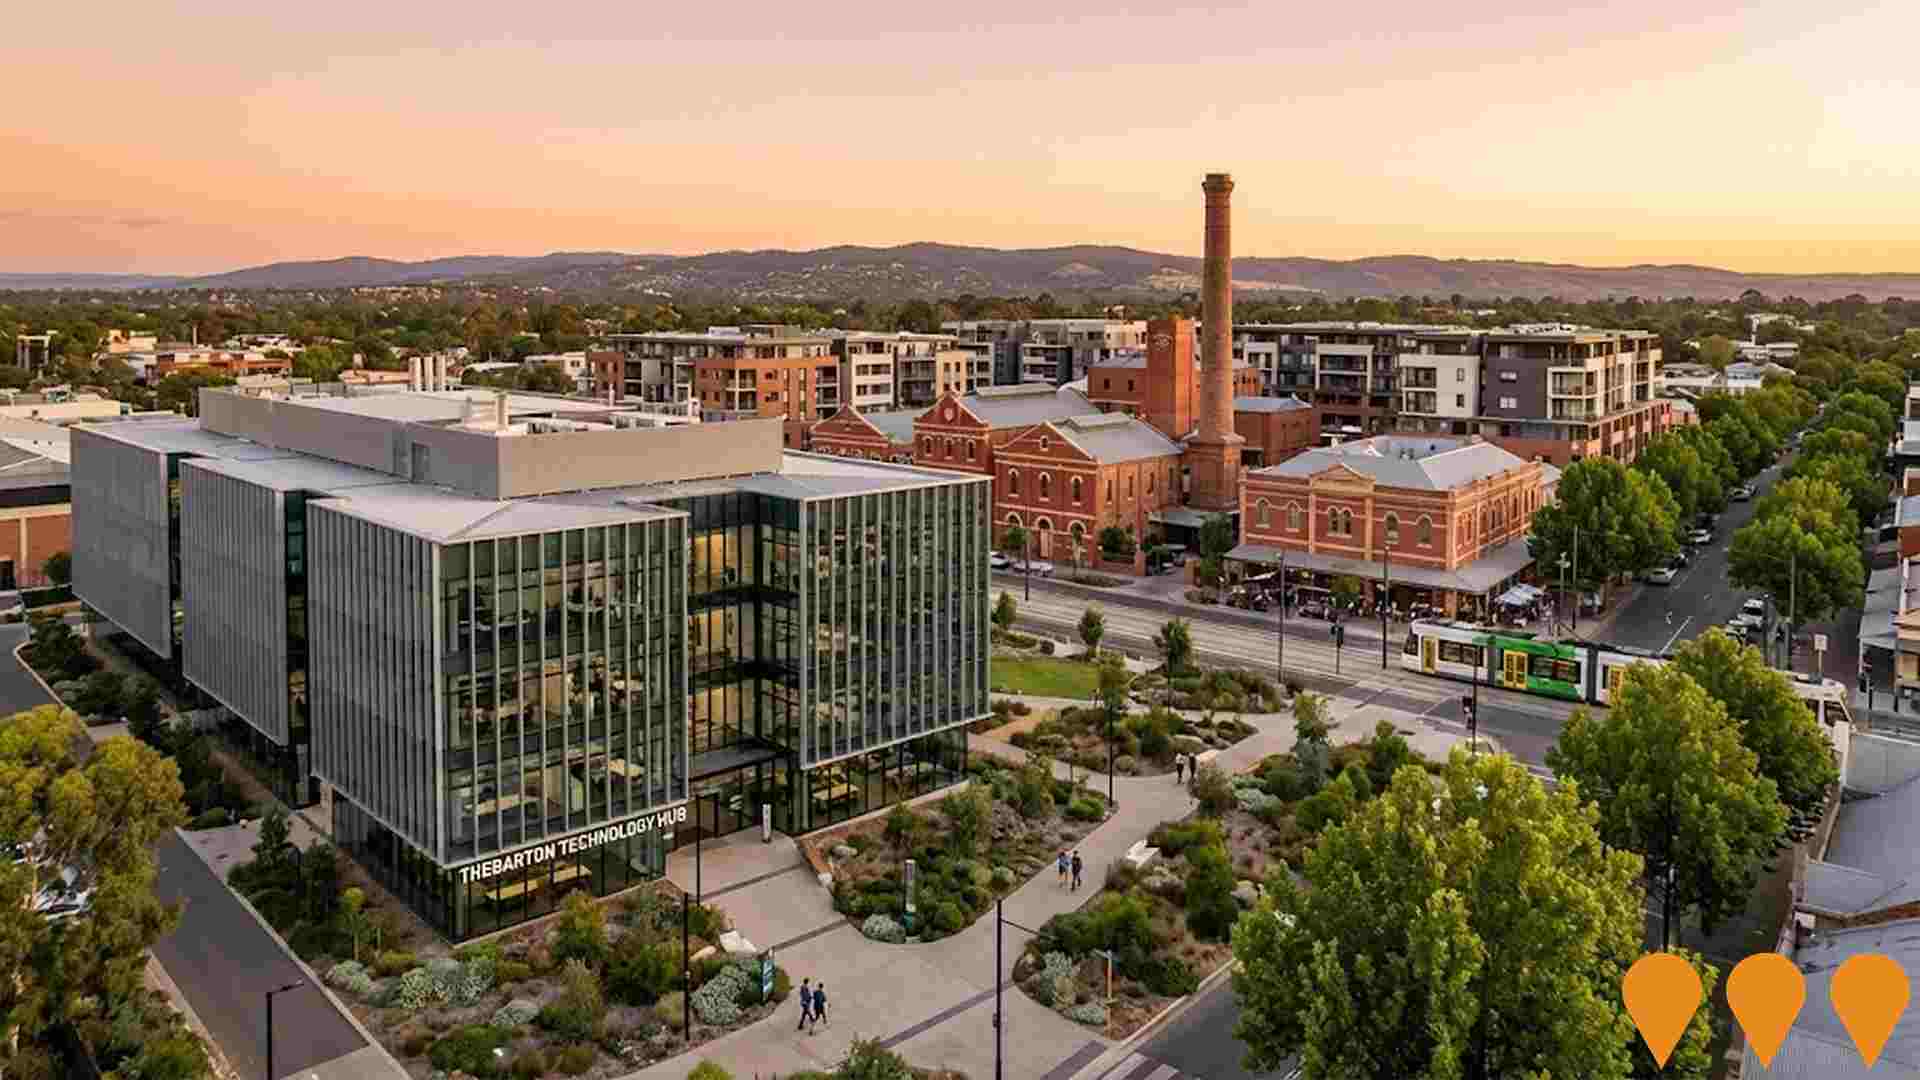
Thebarton Technology Hub
A key development for the City of West Torrens, focusing on attracting and growing bioscience, technology, and advanced manufacturing companies. The broader area includes the University of Adelaide's Thebarton Campus. The City of West Torrens' Economic Development Plan supports the investigation of establishing a digital hub and fast broadband to industrial precincts. The former West End Brewery site (now called Southwark Grounds) is undergoing a major $1 billion mixed-use masterplan by Renewal SA, with construction expected to start in mid-2025.
Project Flight - Adelaide Airport Terminal and Infrastructure Upgrade
Major multi-phased upgrade program to Adelaide Airport's terminal and airside infrastructure, planned to meet passenger growth through to 2050. Key works include: expansion of the check-in hall (1,500sqm) and northern terminal (10,000sqm) and southern terminal (5,500sqm), new domestic and regional gates/aerobridges, up to nine new aircraft parking bays, and a major upgrade of passenger and checked baggage security screening technology. Construction is progressing, with key milestones including completion of security screening upgrades by end of 2025 and expansion of the northern terminal starting early 2026.

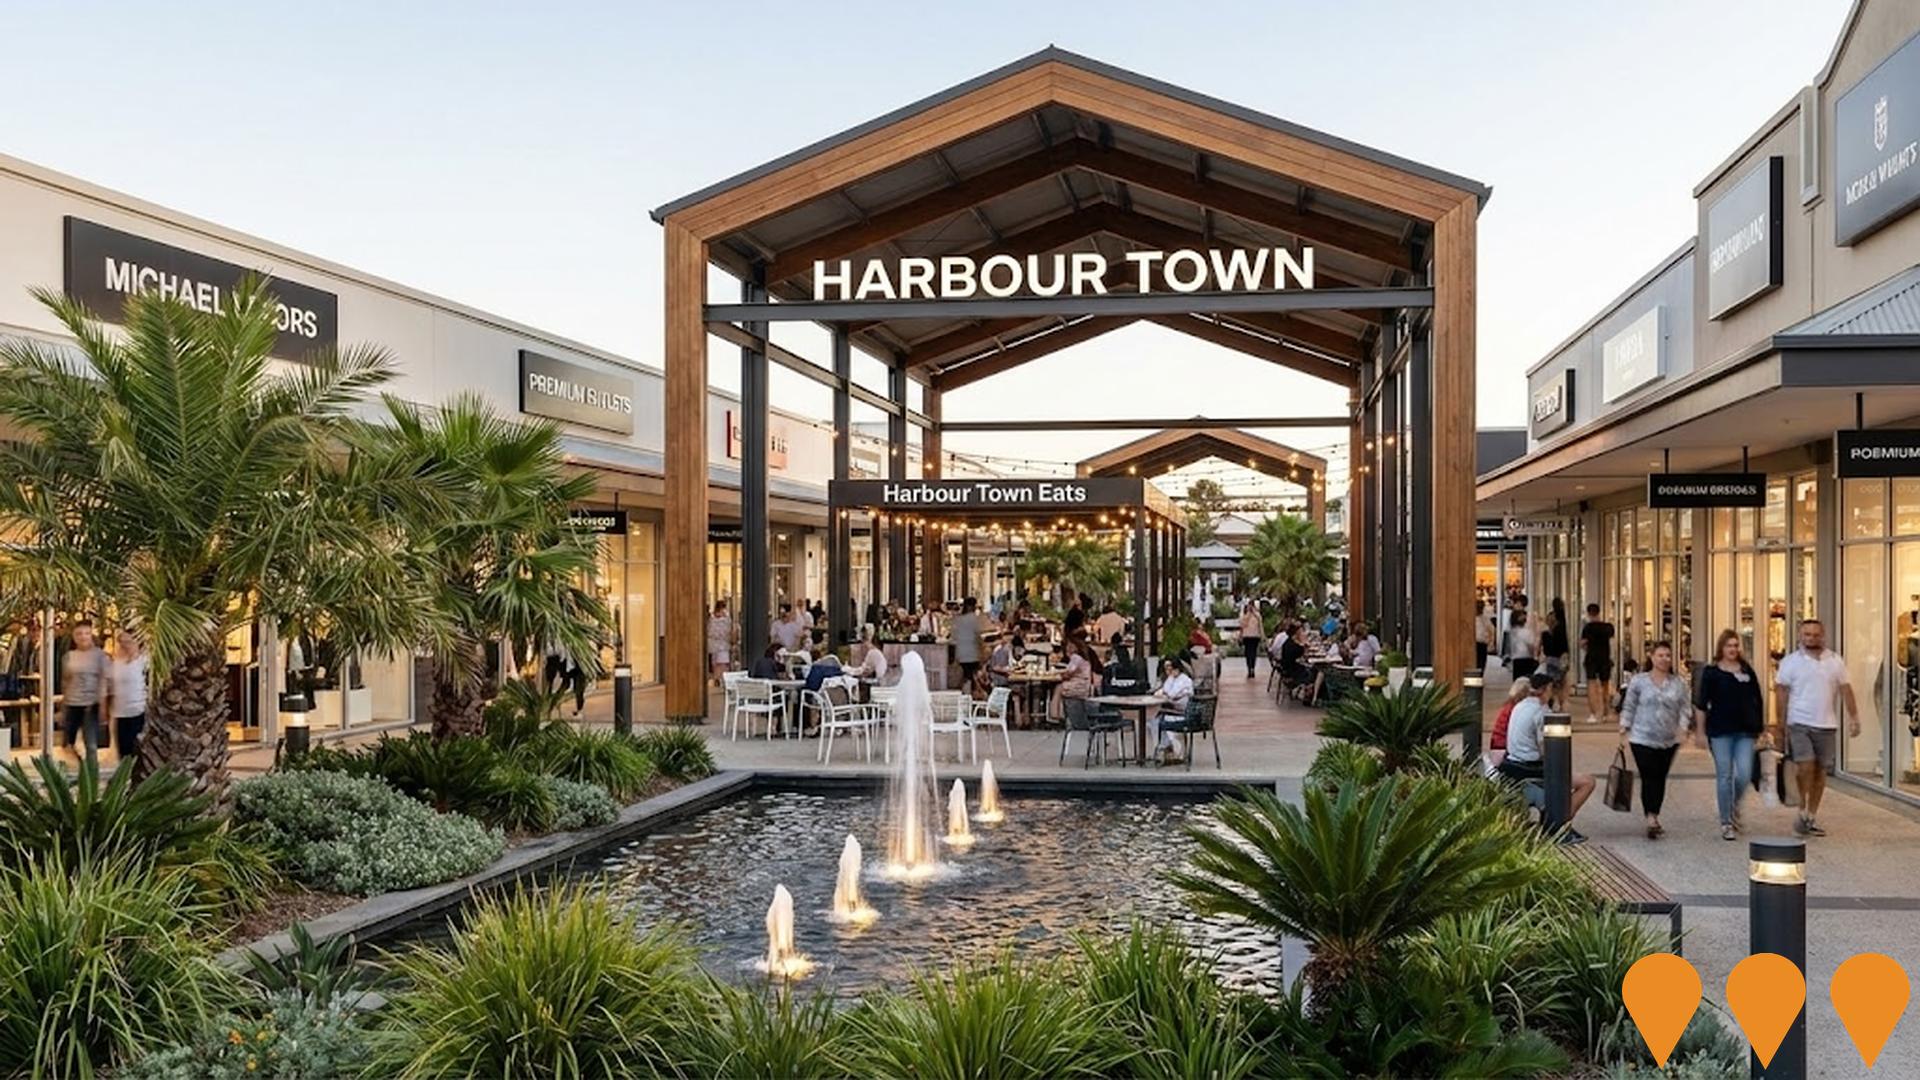
Harbour Town Premium Outlets Adelaide Expansion
Major redevelopment of Adelaide's only outlet shopping centre featuring the new 'Harbour Town Eats' dining precinct, upgraded amenities, renewed storefronts, and enhanced landscaping. The project introduces new premium brands and improved facilities.
Tram Grade Separation at Marion Road and Cross Road, Plympton
Removing the level crossing at Marion Road and Cross Road, Plympton, to make journeys safer and more reliable, improve safety for local residents, motorists, pedestrians, cyclists, and tram drivers, provide new, safer, and more accessible tram stops with improved pedestrian access, enhance community connection between suburbs, elevate the Mike Turtur bikeway as a shared use path alongside the tram line, and create new community open space under the overpasses. The upgrade involves upgrading Marion Road between Cross Road and the Anzac Highway, including a grade separation of the tram level crossings on Marion Road and Cross Road, widening of the Anzac Highway / Marion Road Intersection, widening of the Cross Road / Marion Road Intersection, and pedestrian and cycling access improvements.
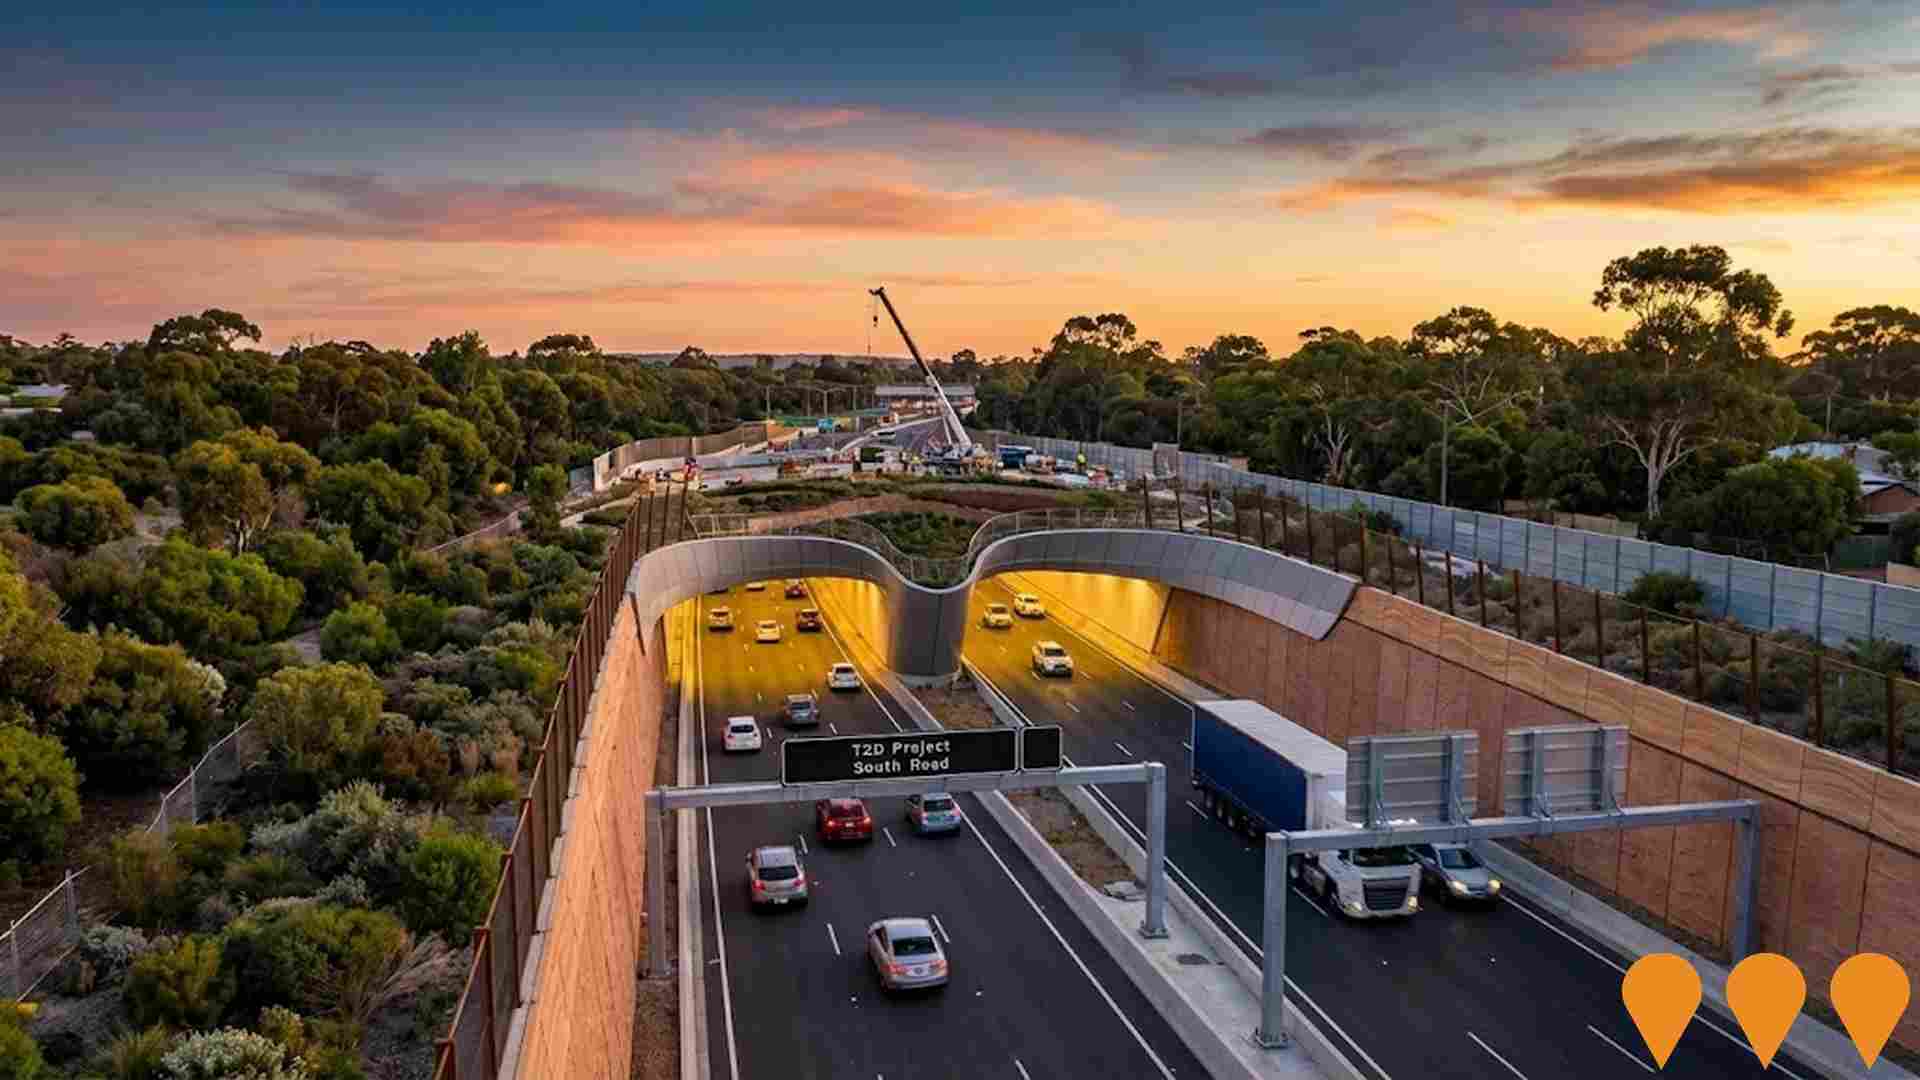
River Torrens to Darlington (T2D) Project
The River Torrens to Darlington (T2D) Project delivers the final 10.5 km section of Adelaide's North South Corridor, creating a 78 km non stop, traffic light free motorway between Gawler and Old Noarlunga. The project combines southern and northern twin three lane tunnels (around 4 km and 2.2 km) with lowered and surface motorway, new connections at key intersections such as Anzac Highway and Darlington, and upgraded walking and cycling paths and green spaces along South Road. Early and surface works are underway, tunnel boring machines are arriving from late 2025, tunnelling is expected to start in the second half of 2026, and the project is planned for completion by 2031.
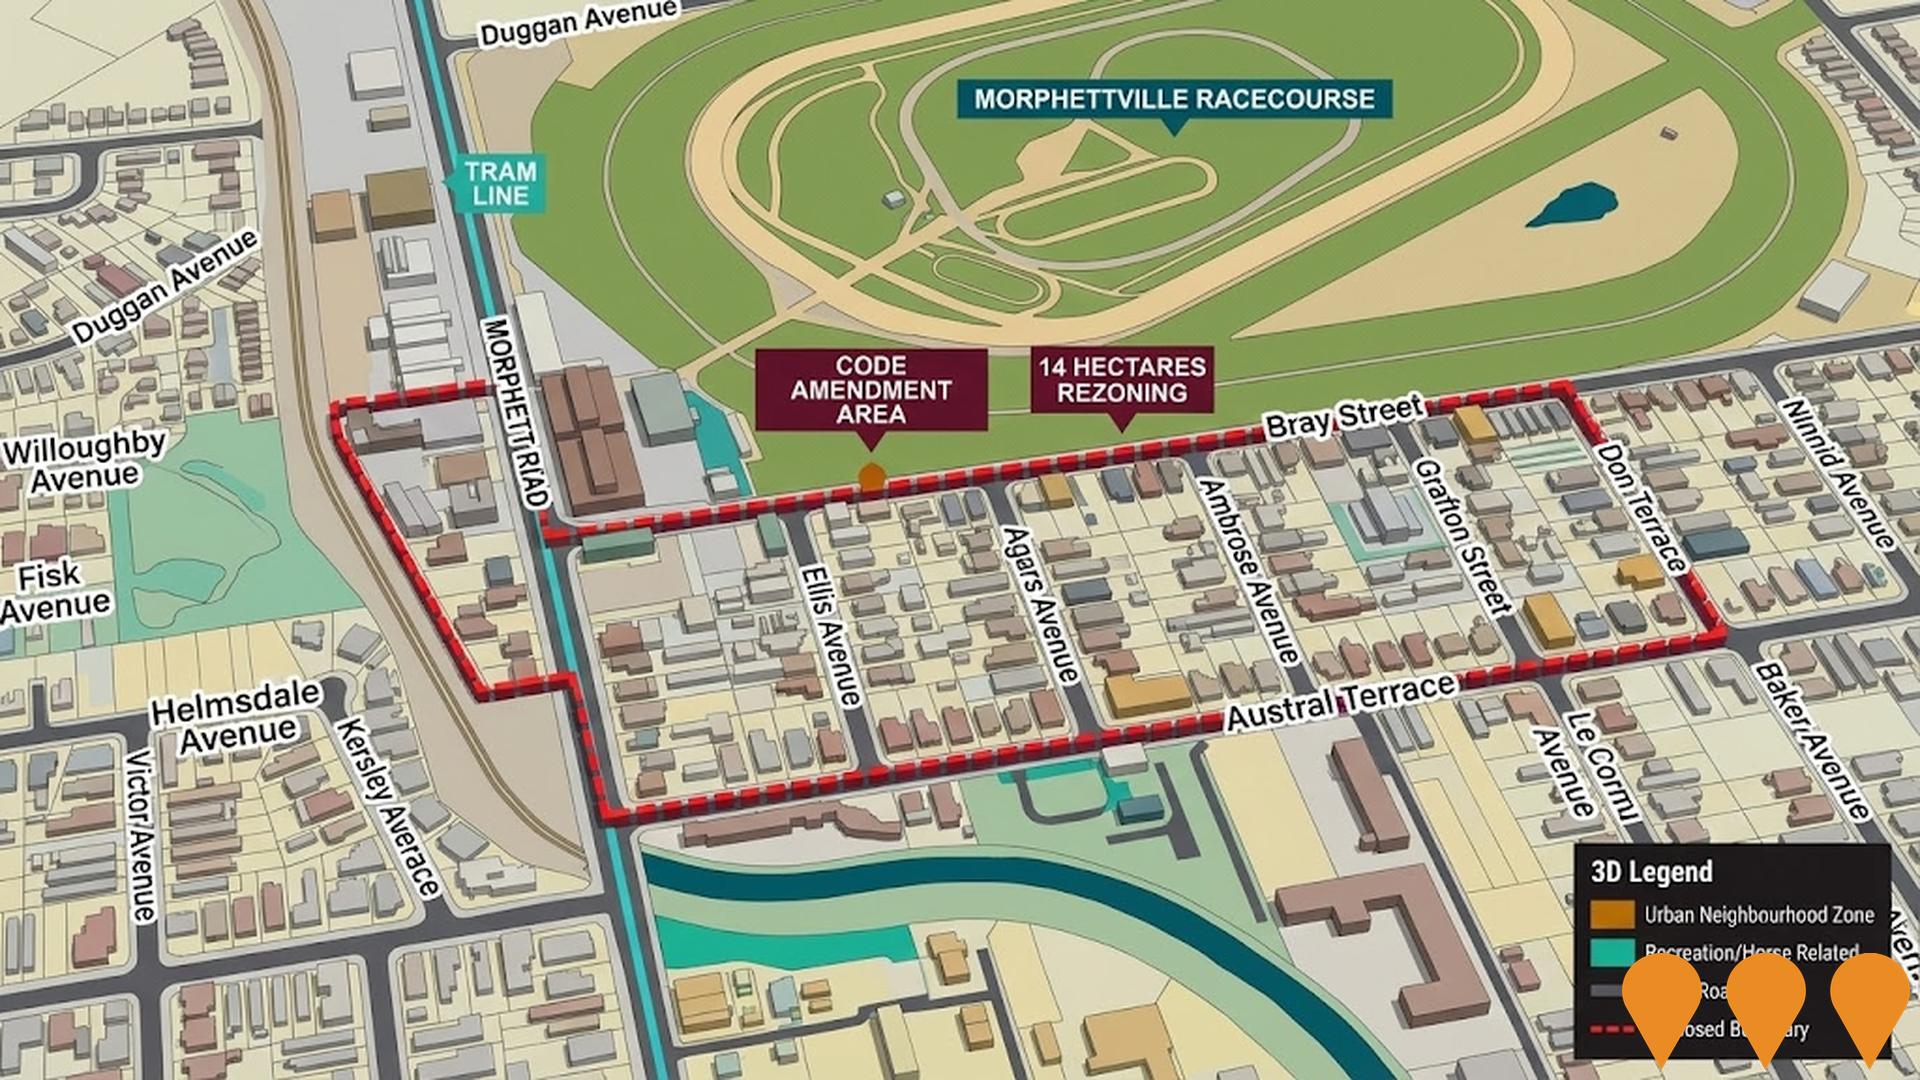
Morphettville/Glengowrie Horse Related Activities Code Amendment
Two code amendments rezoning nearly 14 hectares from recreation and horse-related uses to urban neighbourhood zones. First amendment: 1.5 hectares at 86-88 Morphett Road for up to 136 homes with developments up to 8 levels. Supports medium to high-density housing close to CBD and public transport.
Adelaide Airport Industrial Development
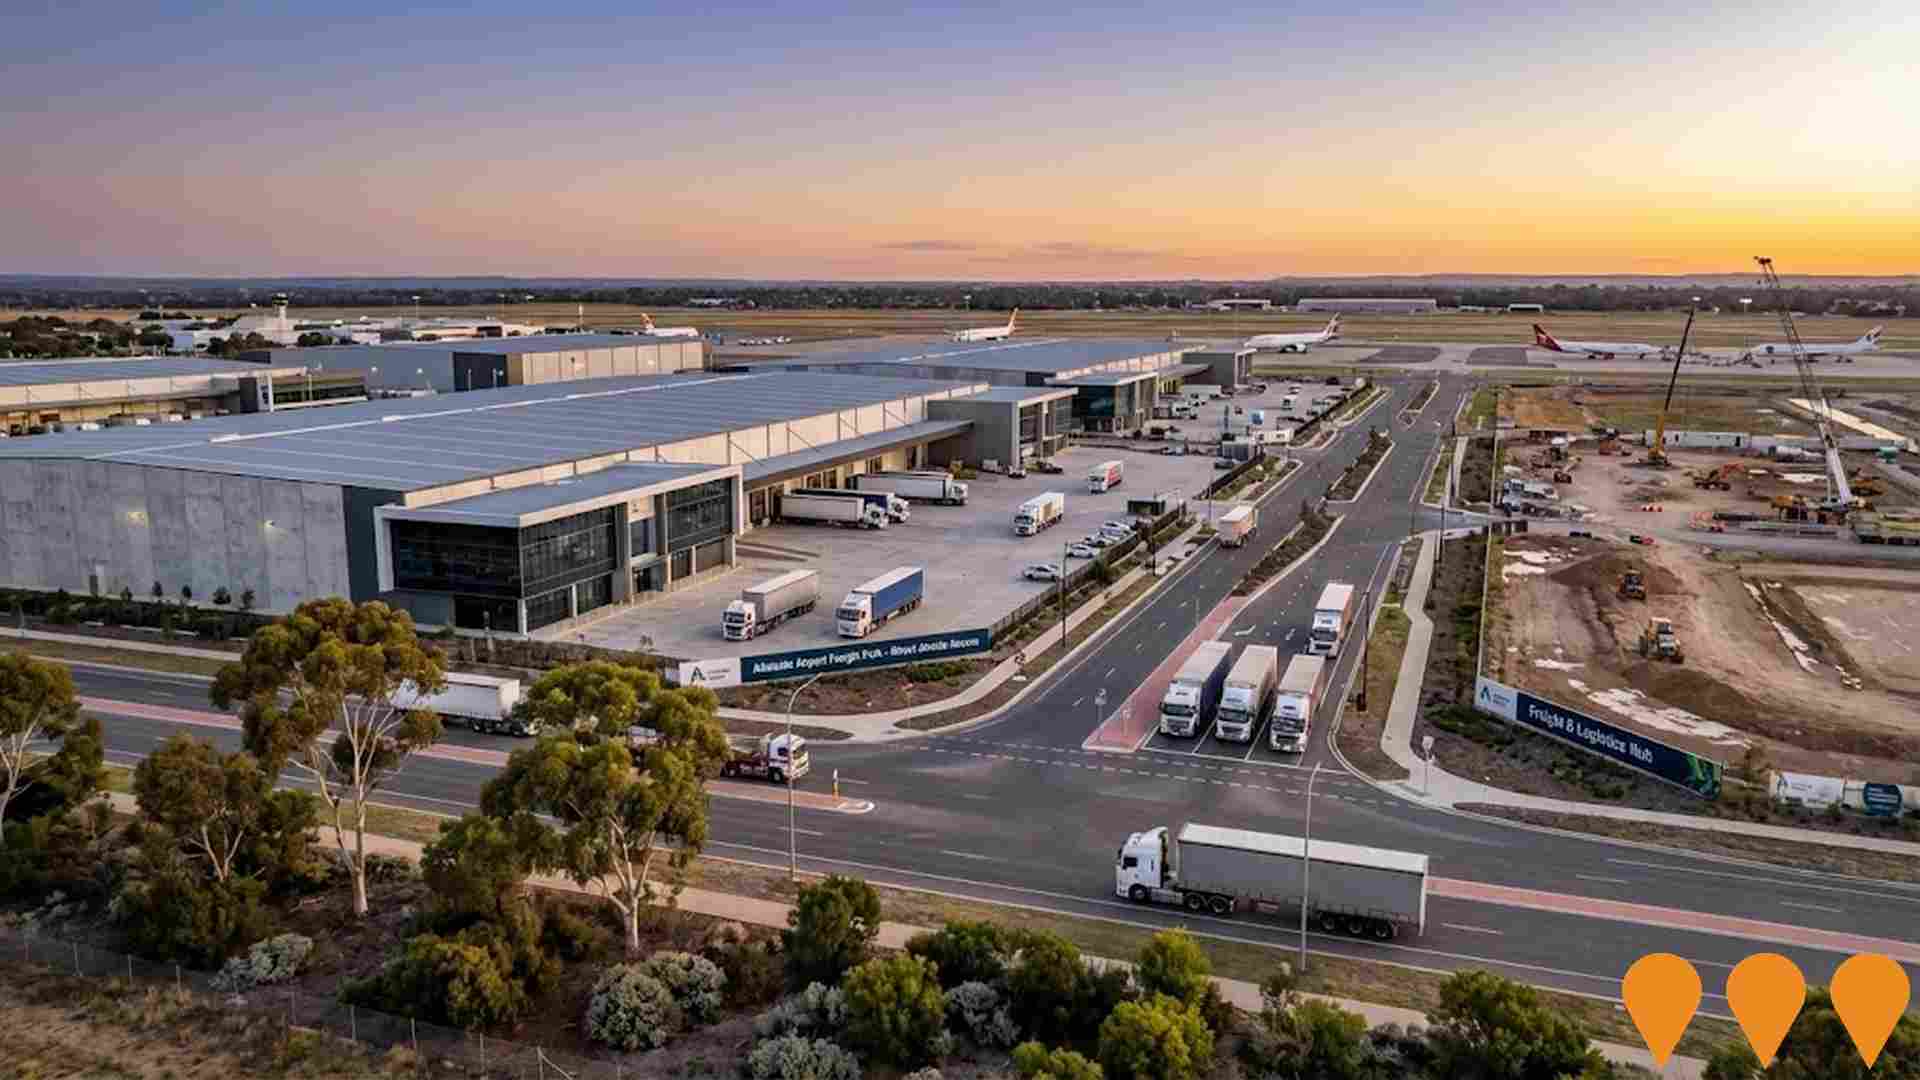
27 hectares of developable land release - largest since 2002. Total project value $250 million for freight and logistics companies with direct airside road access to terminals. Multiple sites 1-10 hectares available for industrial development.
Employment
Employment performance in Plympton ranks among the strongest 15% of areas evaluated nationally
Plympton has an educated workforce with significant representation in essential services sectors. Its unemployment rate is 2.4%, lower than Greater Adelaide's 3.9%.
Over the past year, employment growth was estimated at 4.4%. As of September 2025, 16,998 residents are employed, with an unemployment rate of 1.5% below Greater Adelaide's rate. Workforce participation is similar to Greater Adelaide's (66.2% vs 61.7%).
Dominant employment sectors include health care & social assistance, accommodation & food, and retail trade. Manufacturing, however, is under-represented at 5.2%, compared to Greater Adelaide's 7.0%. Over the year to September 2025, employment increased by 4.4% while labour force grew by 4.3%, reducing unemployment by 0.2 percentage points. By comparison, Greater Adelaide saw employment growth of 3.0% and a 0.1 percentage point decrease in unemployment. State-level data to 25-Nov-25 shows SA employment grew by 1.19% year-on-year, with an unemployment rate of 4.0%, outpacing the national average of 0.14%. Jobs and Skills Australia's forecasts from May-25 suggest national employment will expand by 6.6% over five years and 13.7% over ten years. Applying these projections to Plympton's employment mix, local employment is expected to increase by 6.9% over five years and 14.3% over ten years.
Frequently Asked Questions - Employment
Income
The area's income profile falls below national averages based on AreaSearch analysis
The latest postcode level ATO data for financial year 2022 shows that median income in Plympton SA2 was $52,693 and average income was $62,845. This is below the national averages of $52,592 (median) and $64,886 (average) for Greater Adelaide. Based on Wage Price Index growth of 12.83% since financial year 2022, estimated median income in Plympton as of September 2025 is approximately $59,454, and average income is $70,908. According to the 2021 Census, incomes in Plympton rank modestly, between the 38th and 48th percentiles for household, family, and personal incomes. The largest segment of residents earns between $1,500 and $2,999 weekly (9,479 residents), which is similar to the broader area where this cohort represents 31.8%. Housing affordability pressures are severe in Plympton, with only 84.0% of income remaining after housing costs, ranking at the 39th percentile. The area's SEIFA income ranking places it in the 6th decile.
Frequently Asked Questions - Income
Housing
Plympton displays a diverse mix of dwelling types, with a higher proportion of rental properties than the broader region
Plympton's dwelling structure, as per the latest Census, consisted of 58.3% houses and 41.7% other dwellings (semi-detached, apartments, 'other' dwellings). In comparison, Adelaide metro had 63.9% houses and 36.2% other dwellings. Home ownership in Plympton was at 27.8%, with mortgaged dwellings at 32.1% and rented ones at 40.1%. The median monthly mortgage repayment was $1,733, below Adelaide metro's average of $1,745. The median weekly rent in Plympton was $300, compared to Adelaide metro's $310. Nationally, Plympton's mortgage repayments were lower than the Australian average of $1,863, and rents were substantially below the national figure of $375.
Frequently Asked Questions - Housing
Household Composition
Plympton features high concentrations of group households and lone person households, with a fairly typical median household size
Family households constitute 61.7% of all households, including 25.4% couples with children, 26.0% couples without children, and 8.5% single parent families. Non-family households account for the remaining 38.3%, with lone person households at 31.8% and group households comprising 6.5% of the total. The median household size is 2.3 people, which aligns with the Greater Adelaide average.
Frequently Asked Questions - Households
Local Schools & Education
The educational profile of Plympton exceeds national averages, with above-average qualification levels and academic performance metrics
Educational attainment in Plympton is notably higher than broader benchmarks. Specifically, 35.9% of residents aged 15 years and above hold university qualifications, compared to 25.7% in South Australia (SA) and 28.9% in the Greater Adelaide area. This substantial educational advantage positions Plympton strongly for knowledge-based opportunities. Bachelor degrees are the most prevalent at 23.9%, followed by postgraduate qualifications at 9.2% and graduate diplomas at 2.8%.
Trade and technical skills also feature prominently, with 28.7% of residents aged 15 years and above holding vocational credentials – advanced diplomas at 10.7% and certificates at 18.0%. Educational participation is notably high in Plympton, with 28.9% of residents currently enrolled in formal education. This includes 9.2% in tertiary education, 7.7% in primary education, and 5.7% pursuing secondary education.
Frequently Asked Questions - Education
Schools Detail
Nearby Services & Amenities
Transport
Transport servicing is good compared to other areas nationally based on assessment of service frequency, route connectivity and accessibility
Plympton has 151 active public transport stops, all of which are bus stops. These stops are served by 39 different routes that together facilitate 3,973 weekly passenger trips. The average distance residents live from the nearest transport stop is 161 meters.
On average, there are 567 daily trips across all routes, resulting in approximately 26 weekly trips per individual stop.
Frequently Asked Questions - Transport
Transport Stops Detail
Health
Plympton's residents are healthier than average in comparison to broader Australia with prevalence of common health conditions quite low among the general population though higher than the nation's average across older, at risk cohorts
Health data shows relatively positive outcomes for Plympton residents, with a low prevalence of common health conditions among the general population, albeit higher than the national average in older, at-risk cohorts.
Private health cover is present in approximately 51% of the total population (~14,546 people), slightly lower than the average SA2 area. The most prevalent medical conditions are mental health issues (7.9%) and arthritis (7.3%), with 71.1% of residents reporting no medical ailments, compared to 70.9% in Greater Adelaide. Plympton has 16.2% of residents aged 65 and over (4,622 people), lower than the 17.6% in Greater Adelaide. Health outcomes among seniors require more attention than those of the broader population.
Frequently Asked Questions - Health
Cultural Diversity
Plympton was found to be more culturally diverse than the vast majority of local markets in Australia, upon assessment of a range of language and cultural background related metrics
Plympton has a high level of cultural diversity, with 35.1% of its population born overseas and 33.2% speaking a language other than English at home. Christianity is the main religion in Plympton, comprising 42.0% of the population. The most notable overrepresentation is in the 'Other' category, which makes up 3.7% of the population compared to 3.1% across Greater Adelaide.
In terms of ancestry, the top three represented groups are English (22.5%), Australian (20.6%), and Other (14.3%). There are also notable differences in the representation of certain ethnic groups: Greek is overrepresented at 4.3% compared to 6.1% regionally, Indian is at 4.4% compared to 3.7%, and German is at 4.6% compared to 4.6%.
Frequently Asked Questions - Diversity
Age
Plympton's population is slightly younger than the national pattern
Plympton has a median age of 35, which is younger than Greater Adelaide's figure of 39 and slightly below Australia's national average of 38 years. The 25-34 age group constitutes 21.2% of Plympton's population, higher than Greater Adelaide but significantly above the national average of 14.5%. Meanwhile, the 65-74 cohort makes up 7.4%, which is less prevalent compared to Greater Adelaide. Between 2021 and present, the 25-34 age group has increased from 19.7% to 21.2% of Plympton's population. Conversely, the 85+ cohort has declined from 3.9% to 3.2%. By 2041, demographic projections indicate that the 25-34 age group will grow by 21%, adding 1,254 people and reaching a total of 7,298 from the current figure of 6,043.
