Chart Color Schemes
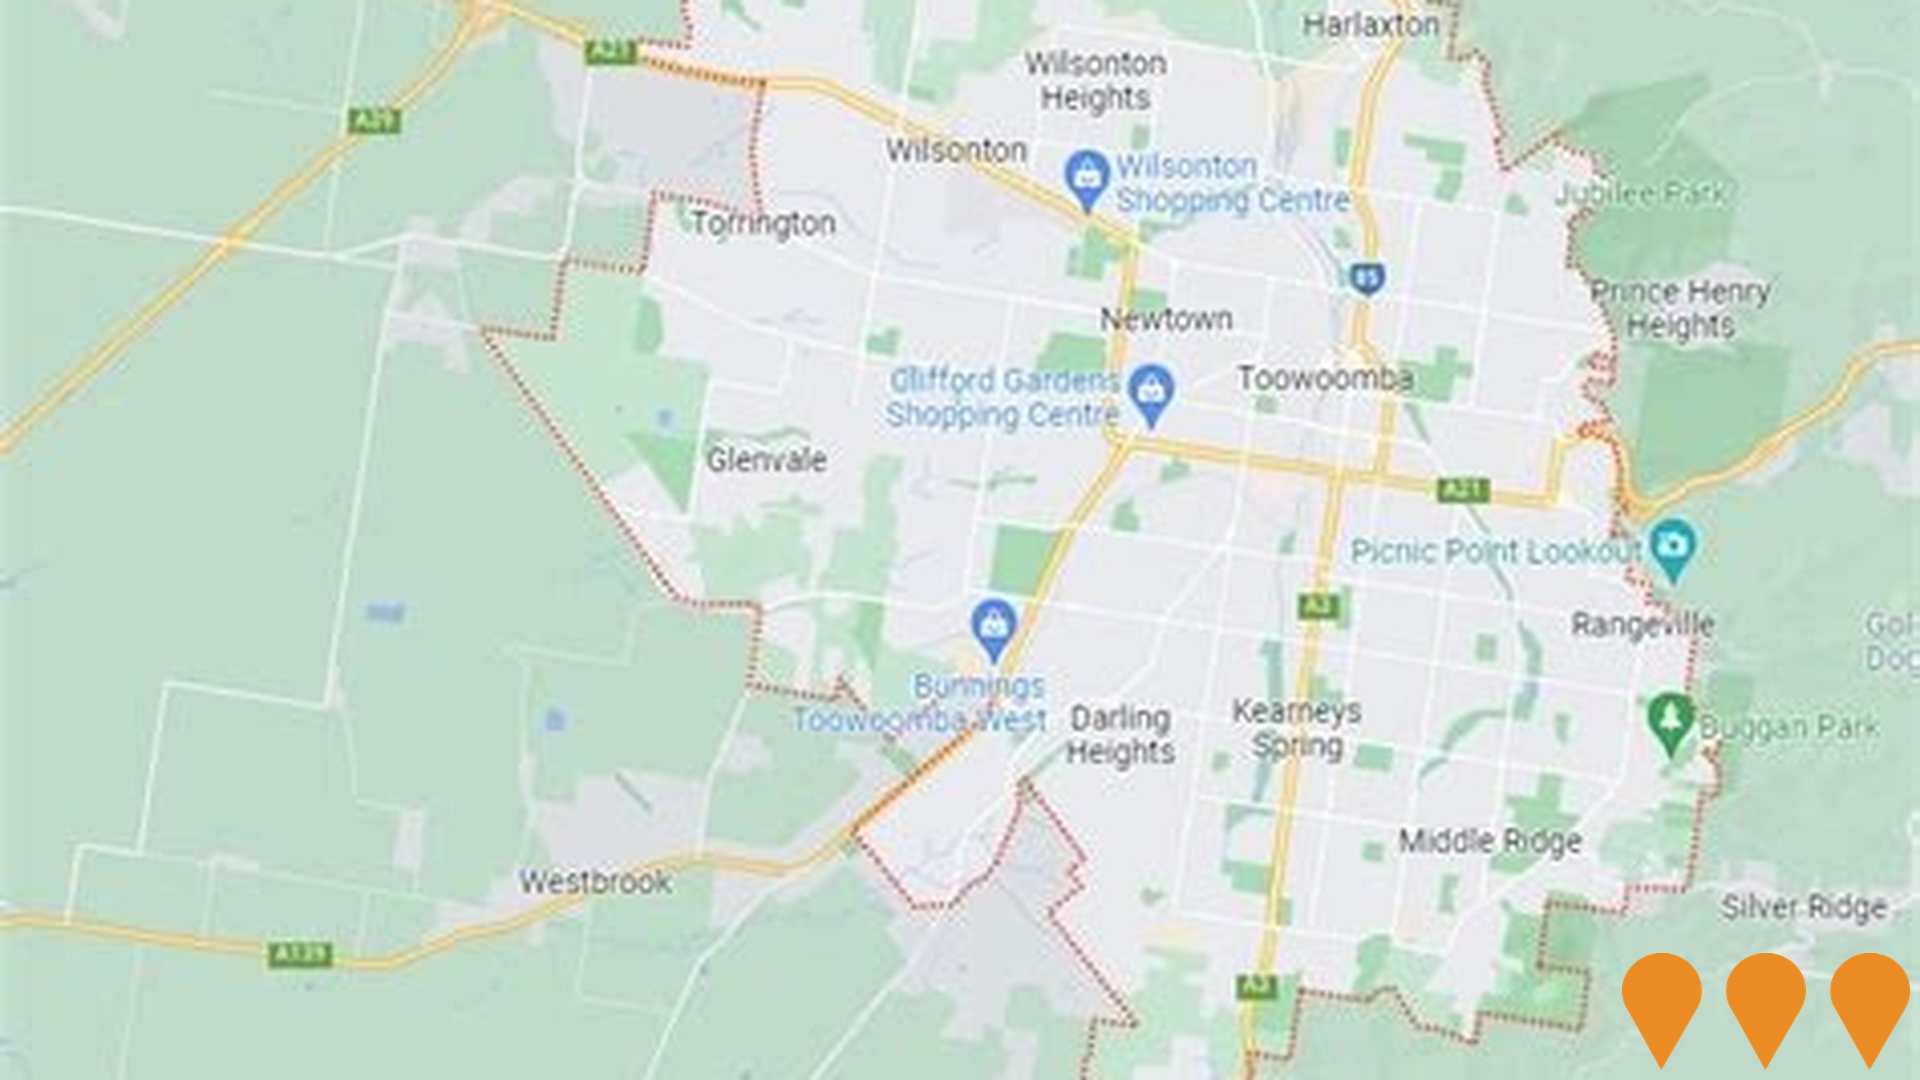
This analysis uses ABS Statistical Areas Level 2 (SA2) boundaries, which can materially differ from Suburbs and Localities (SAL) even when sharing similar names.
SA2 boundaries are defined by the Australian Bureau of Statistics and are designed to represent communities for statistical reporting (e.g., census and ERP).
Suburbs and Localities (SAL) represent commonly-used suburb/locality names (postal-style areas) and may use different geographic boundaries. For comprehensive analysis, consider reviewing both boundary types if available.
est. as @ -- *
ABS ERP | -- people | --
2021 Census | -- people
Sales Activity
Curious about local property values? Filter the chart to assess the volume and appreciation (including resales) trends and regional comparisons, or scroll to the map below view this information at an individual property level.
Find a Recent Sale
Sales Detail
Population
An assessment of population growth drivers in Rangeville reveals an overall ranking slightly below national averages considering recent, and medium term trends
Rangeville's population, as of November 2025, is approximately 8,892 people. This figure represents an increase of 224 individuals since the 2021 Census, which recorded a population of 8,668 people. The estimated resident population from June 2024 was 8,849, with an additional 45 validated new addresses contributing to this growth. This results in a density ratio of 1,077 persons per square kilometer, comparable to averages seen across other locations assessed by AreaSearch. Overseas migration primarily drove population growth in the area during recent periods.
For projections, AreaSearch uses ABS/Geoscience Australia data released in 2024 with a base year of 2022 for each SA2 area. For areas not covered and years post-2032, Queensland State Government's SA2 area projections from 2023 based on 2021 data are adopted, applying proportional growth weightings in line with ABS Greater Capital Region projections released in 2023 using 2022 data. Future population trends suggest an increase just below the median of regional areas nationwide by 2041, with the area expected to expand by 600 persons reflecting a total increase of 6.3% over the 17-year period based on the latest annual ERP population numbers.
Frequently Asked Questions - Population
Development
Residential development activity is lower than average in Rangeville according to AreaSearch's national comparison of local real estate markets
Rangeville has received approximately 15 dwelling approvals annually. Between FY-21 and FY-25, 78 homes were approved, with a further 9 approved in FY-26. Each dwelling built over these years attracted an average of 2.6 new residents per year, indicating strong demand that supports property values.
The average construction cost value of new homes is $424,000. In FY-26, there have been $483,000 in commercial approvals, reflecting the area's residential nature. Compared to the rest of Queensland, Rangeville has significantly lower building activity, at 68.0% below the regional average per person. This limited new construction typically reinforces demand and pricing for existing properties. Nationally, this rate is also below average, suggesting maturity and possible planning constraints. New developments consist of 55.0% detached houses and 45.0% townhouses or apartments, offering a wider range of housing options compared to the area's current composition of 84.0% houses.
This shift may indicate decreasing availability of developable sites and changing lifestyles preferences for more diverse, affordable housing choices. The population density is approximately 716 people per dwelling approval, indicating an established market. Projections estimate Rangeville will grow by 557 residents by 2041. Construction pace is maintaining reasonable growth despite increasing competition among buyers as the population expands.
Frequently Asked Questions - Development
Infrastructure
Rangeville has very high levels of nearby infrastructure activity, ranking in the top 10% nationally
Changes to local infrastructure significantly influence an area's performance. AreaSearch has identified ten projects likely to impact the area. Key projects include Mater Dei Primary School Early Years Precinct, Parque Toowoomba, Emmerson Park District Park Upgrade, and Centenary Heights State High School Duane Music Excellence Centre. The following list details those most relevant.
Professional plan users can use the search below to filter and access additional projects.
INFRASTRUCTURE SEARCH
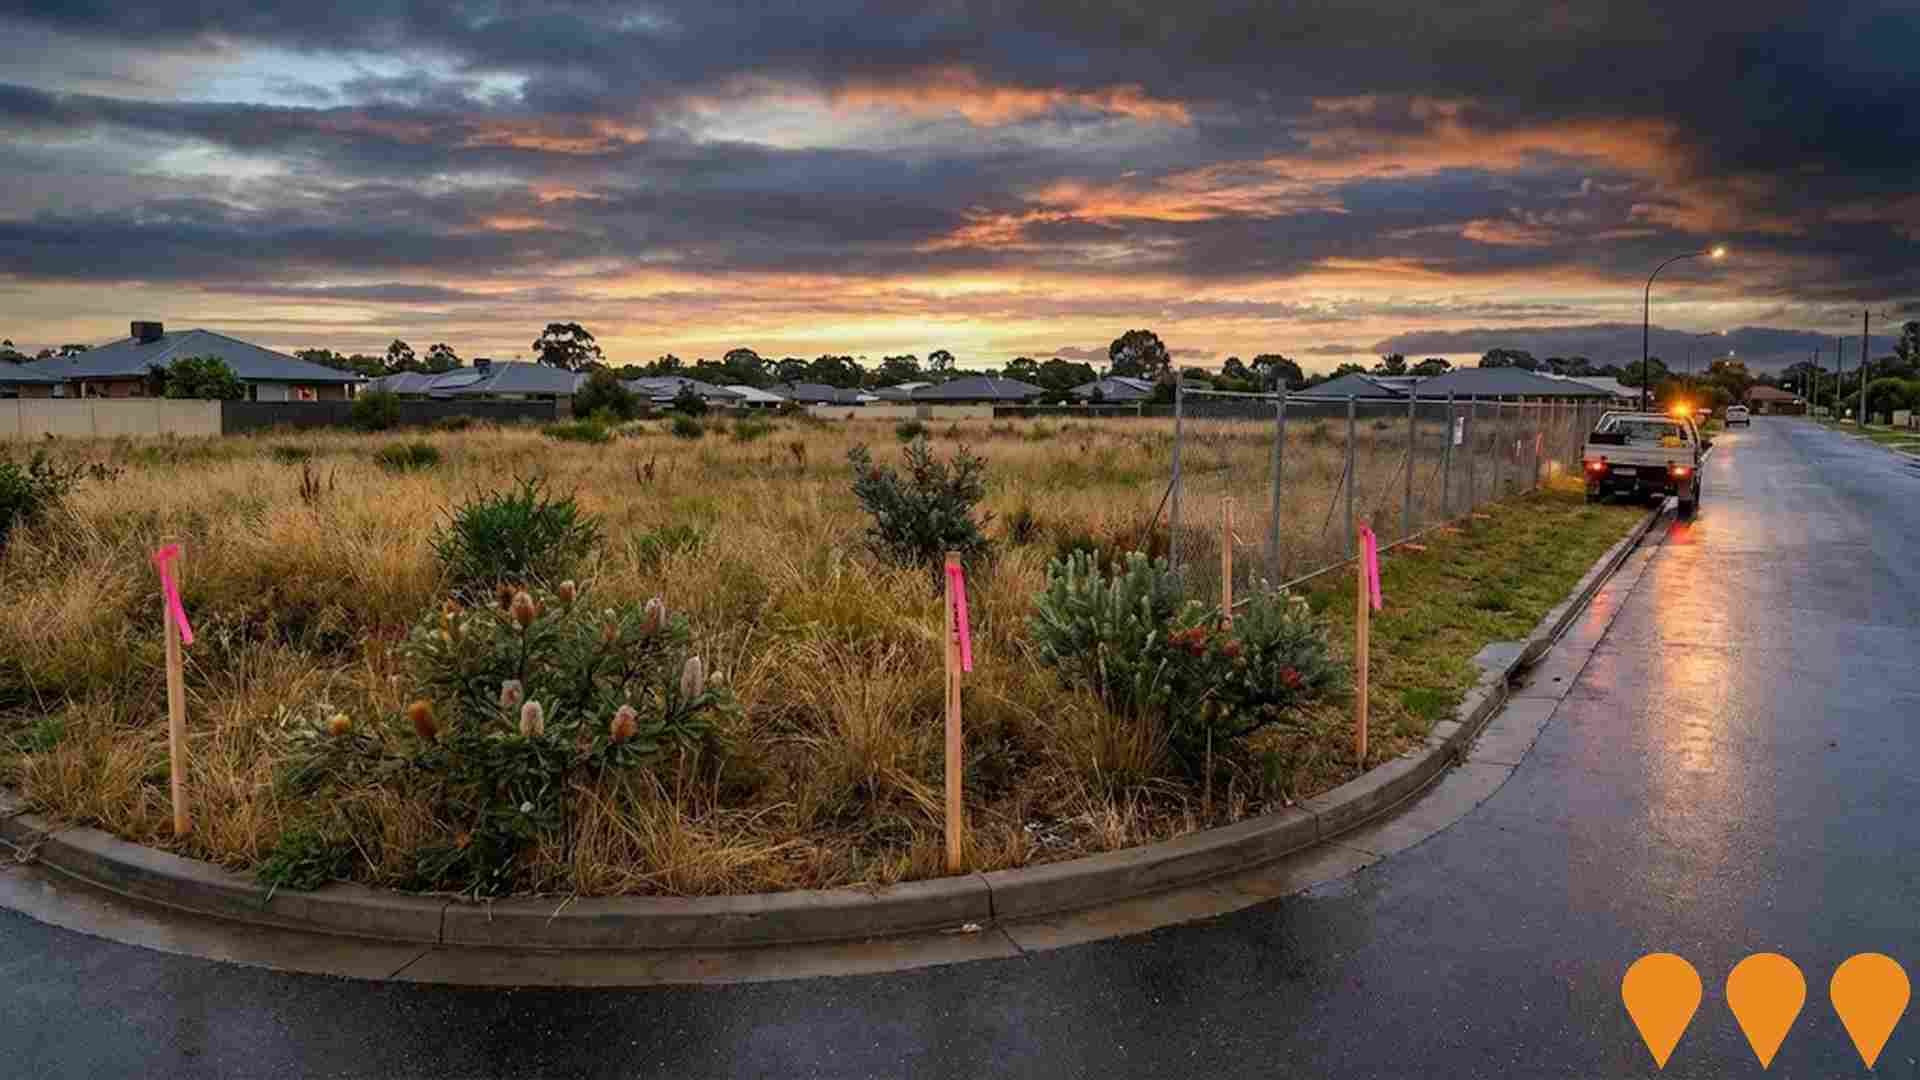
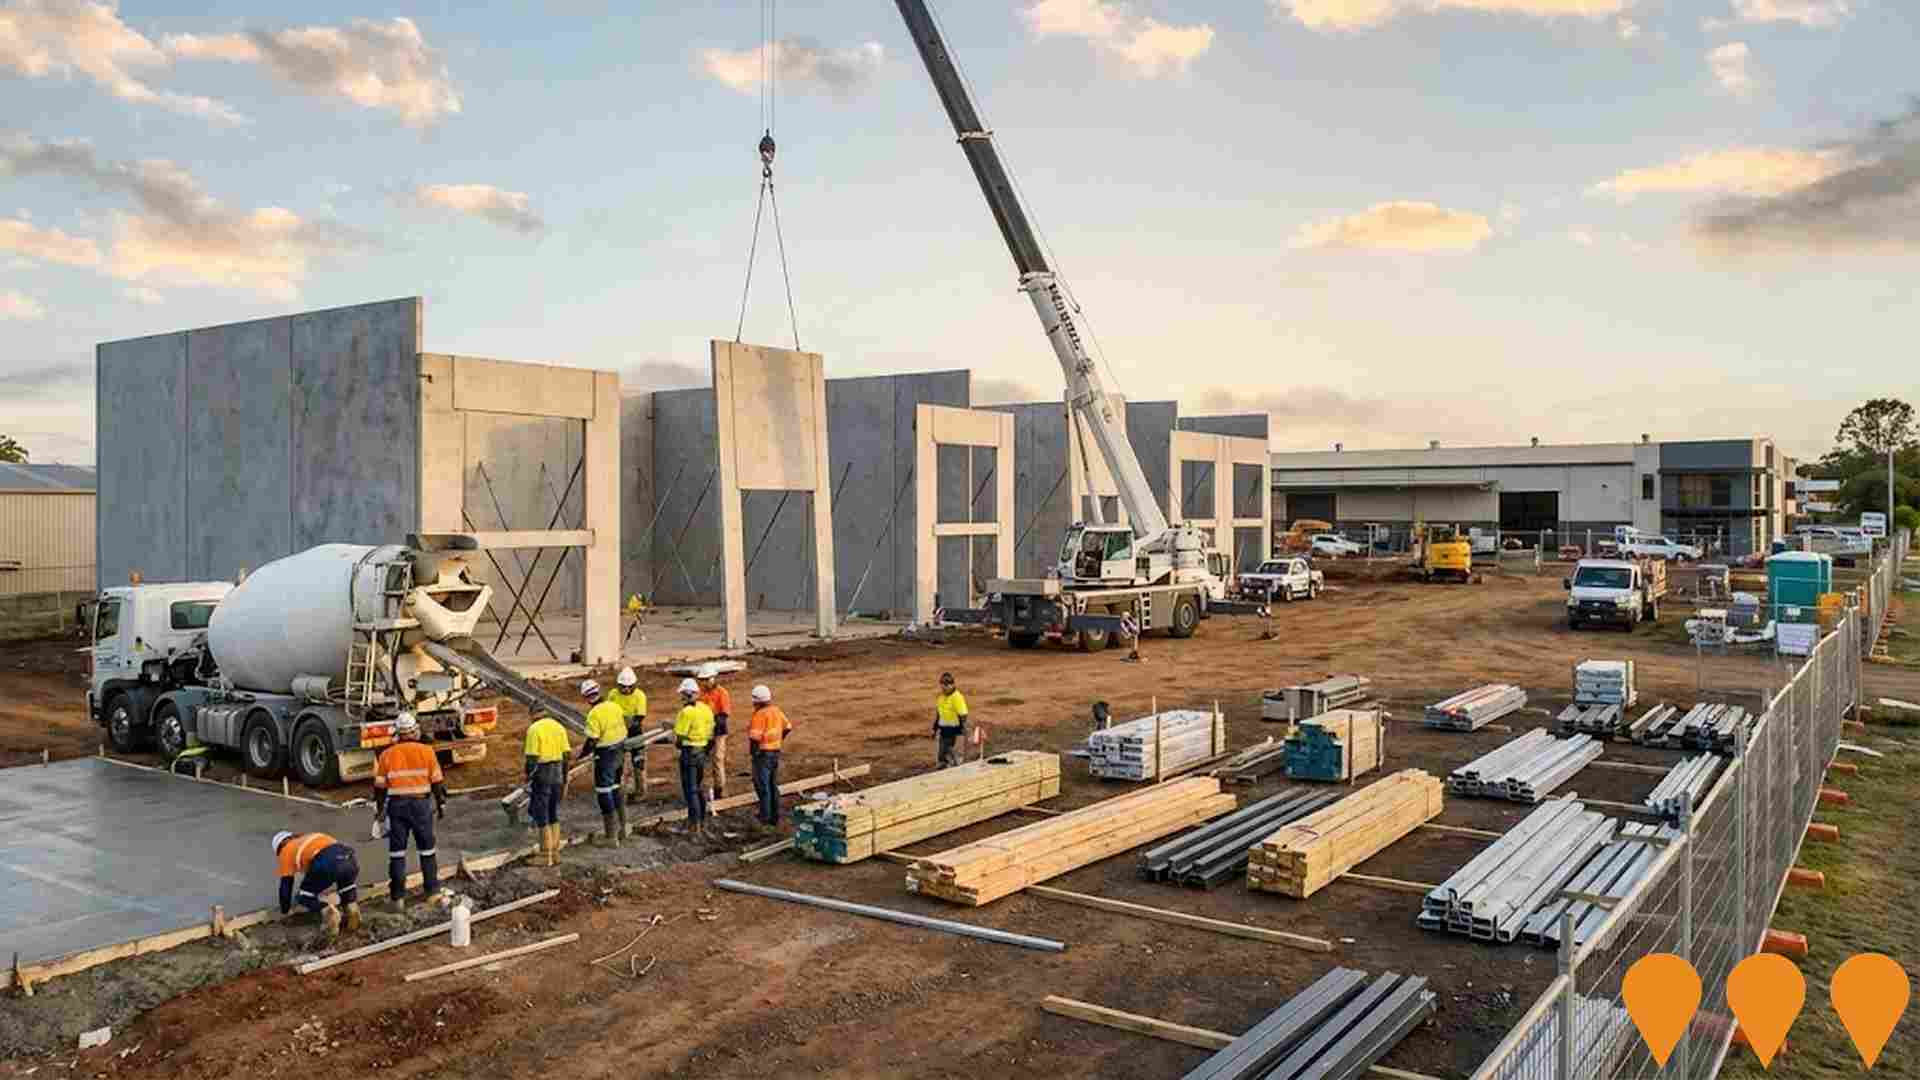
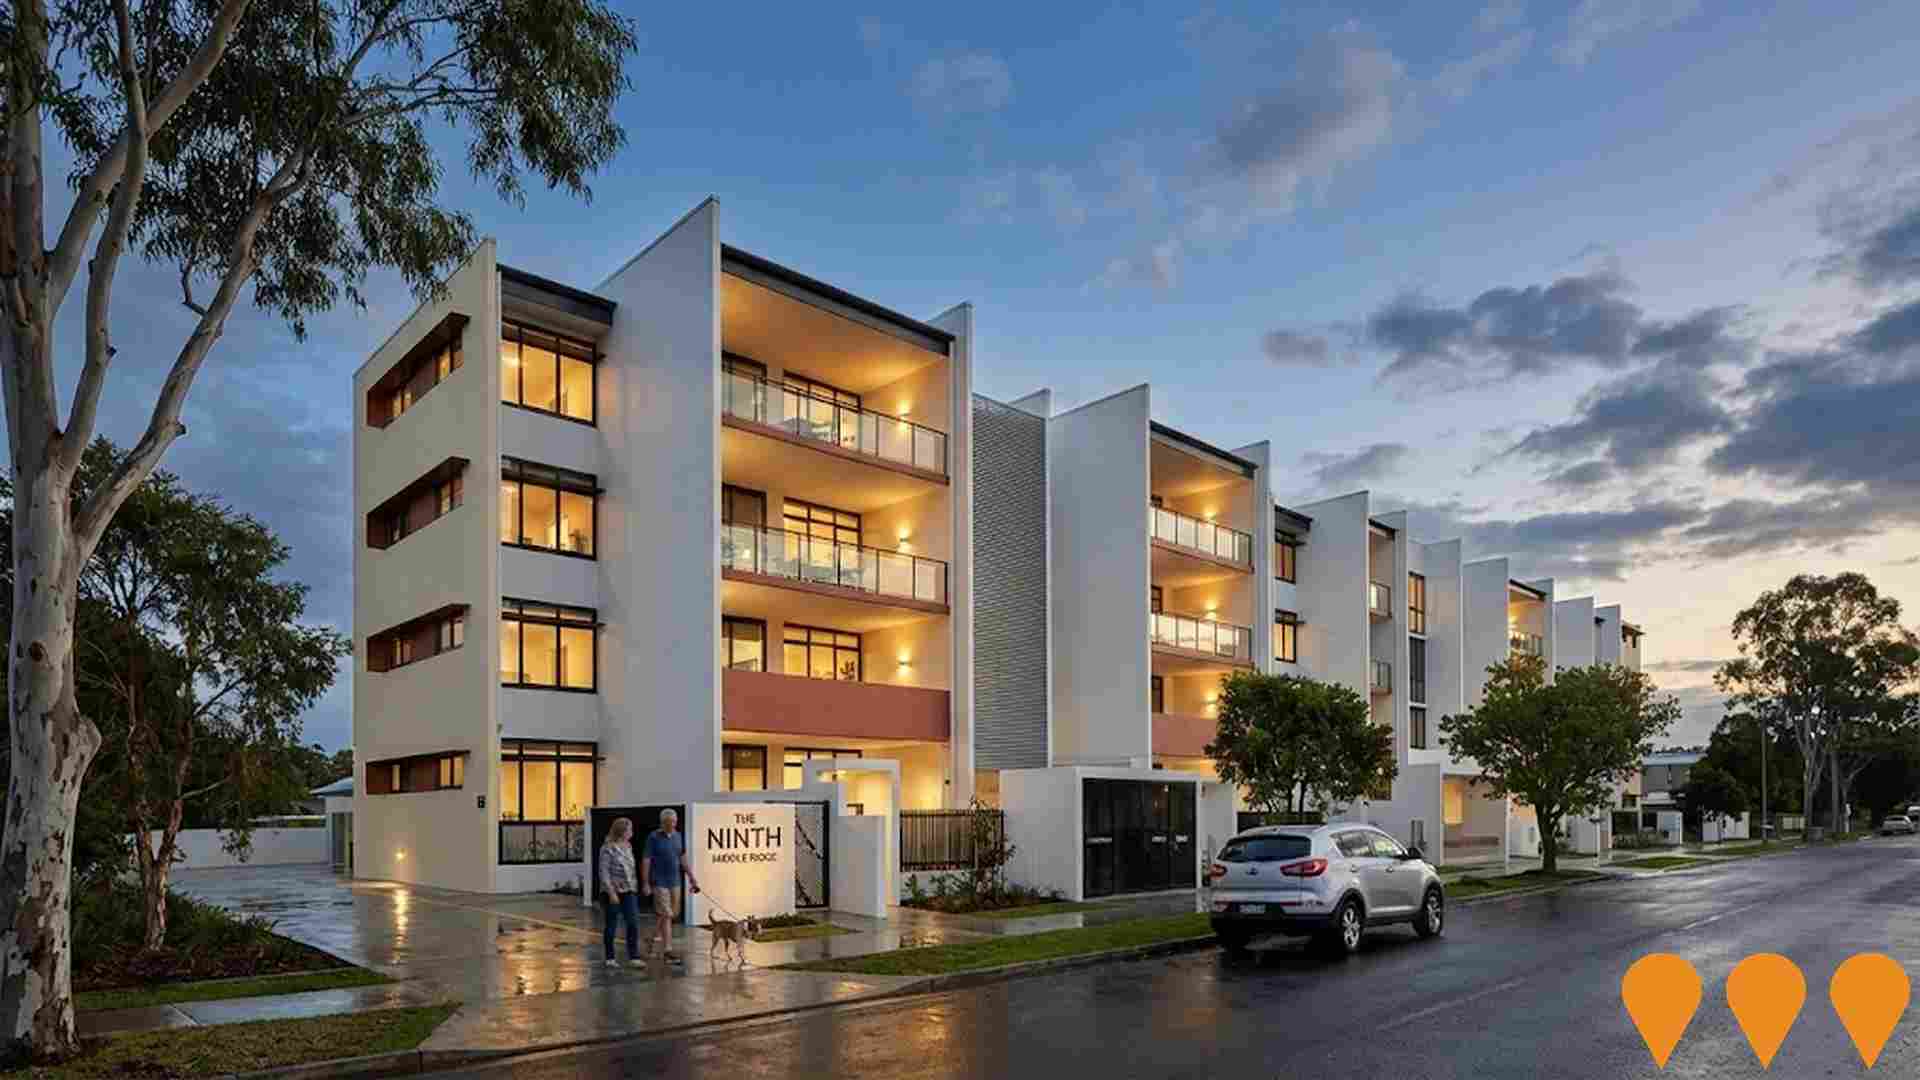
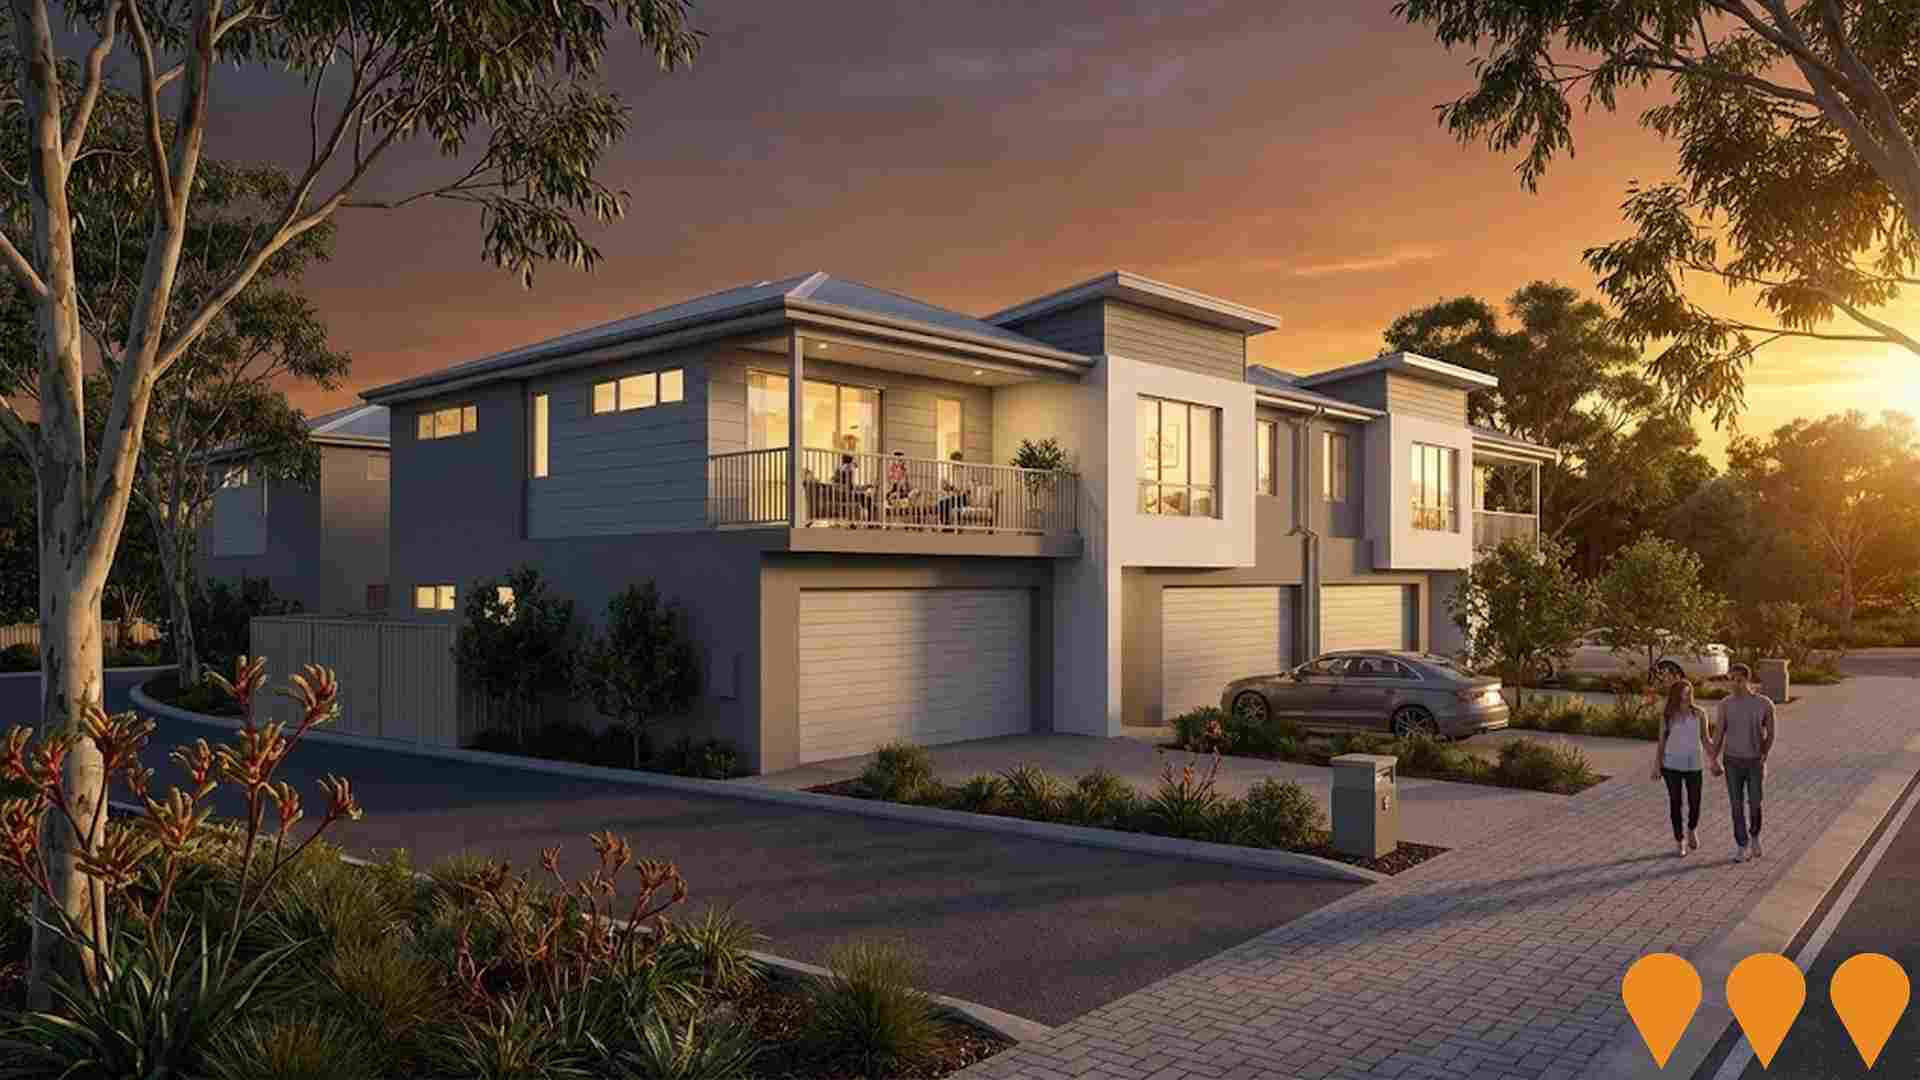
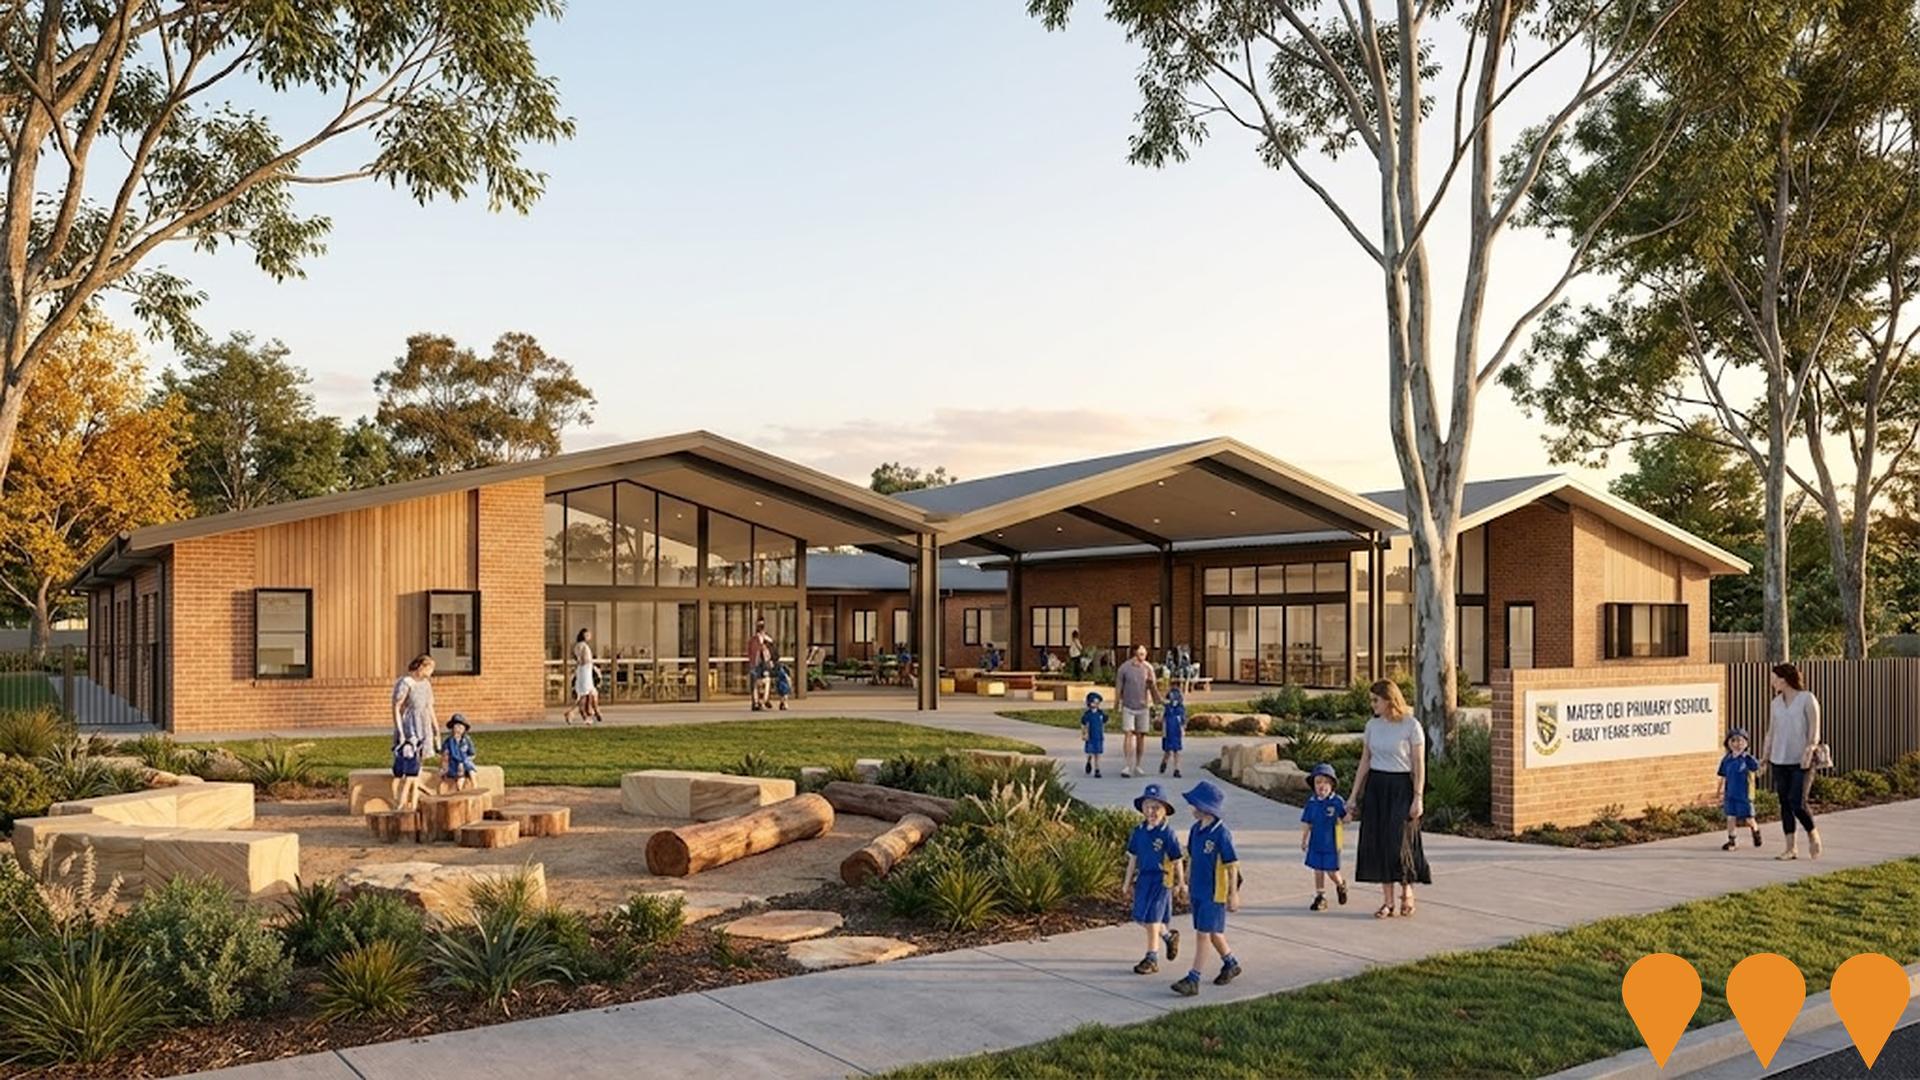
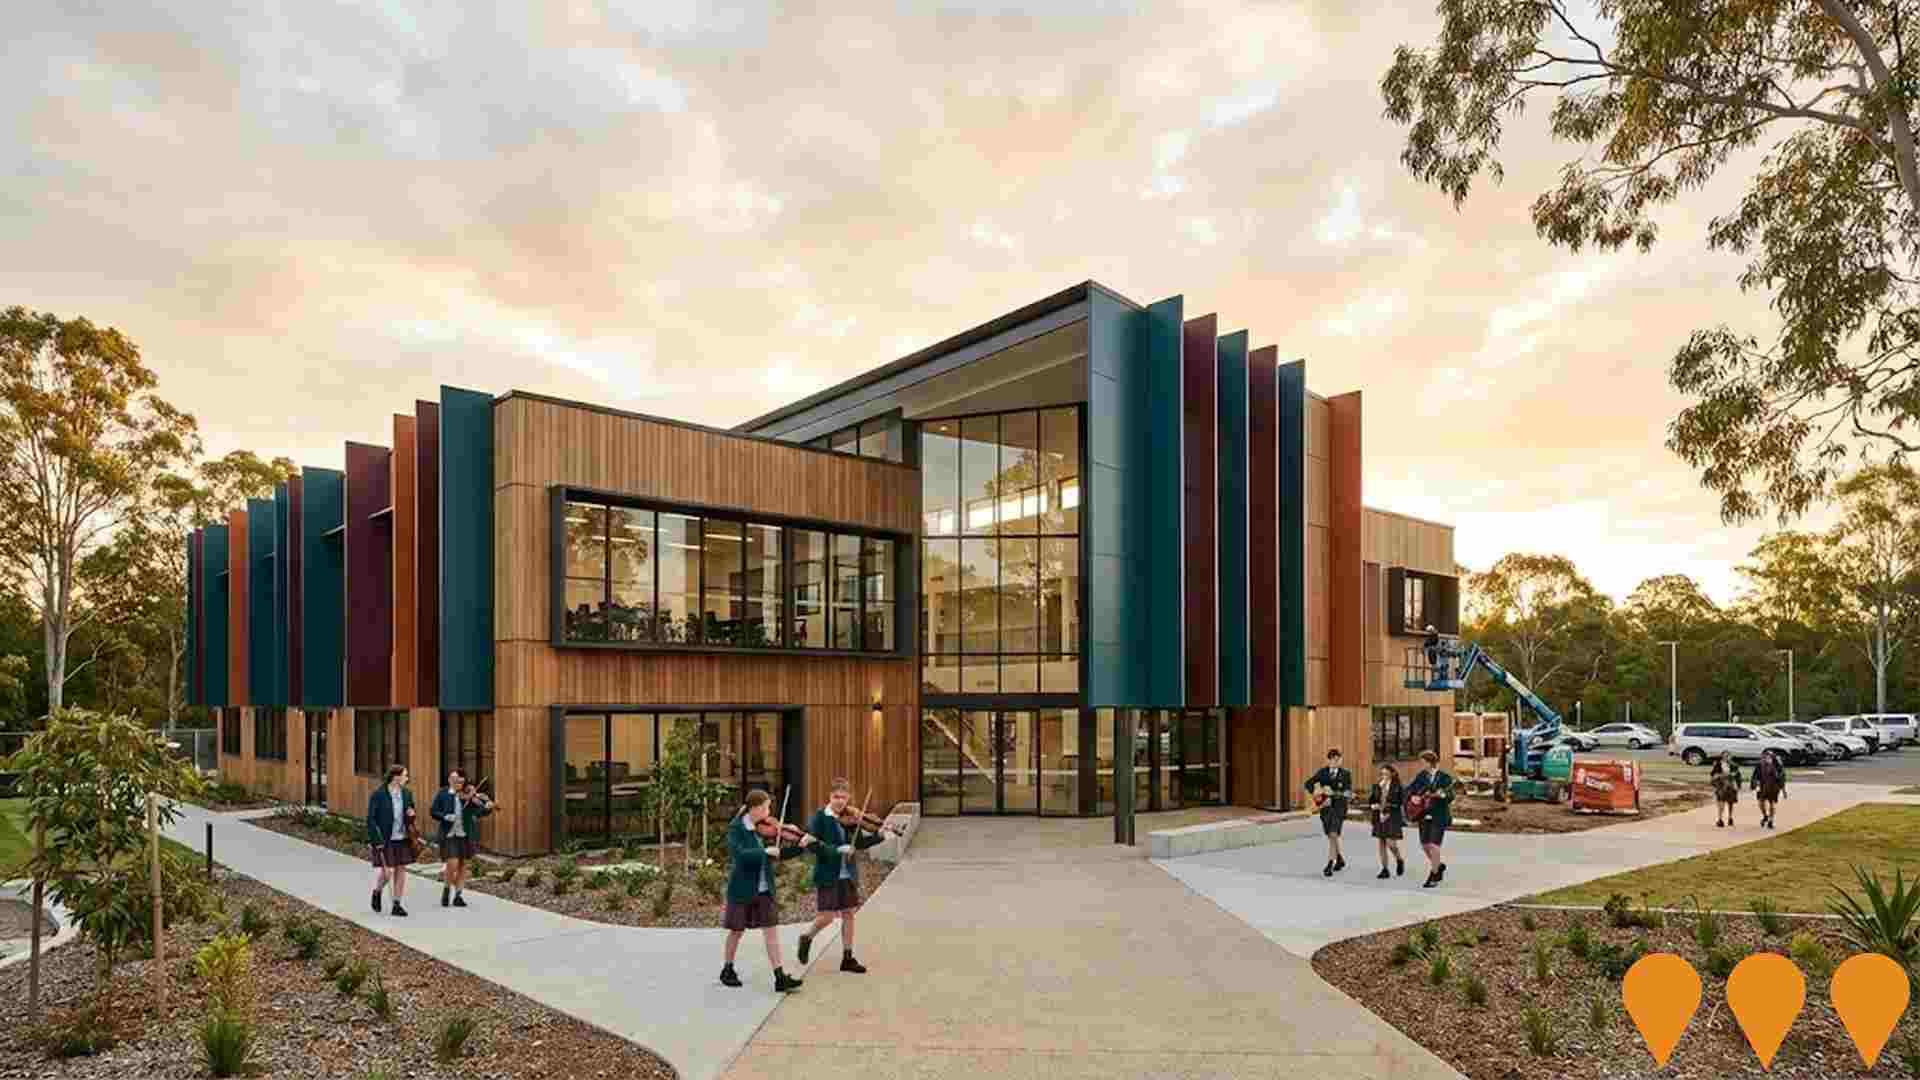
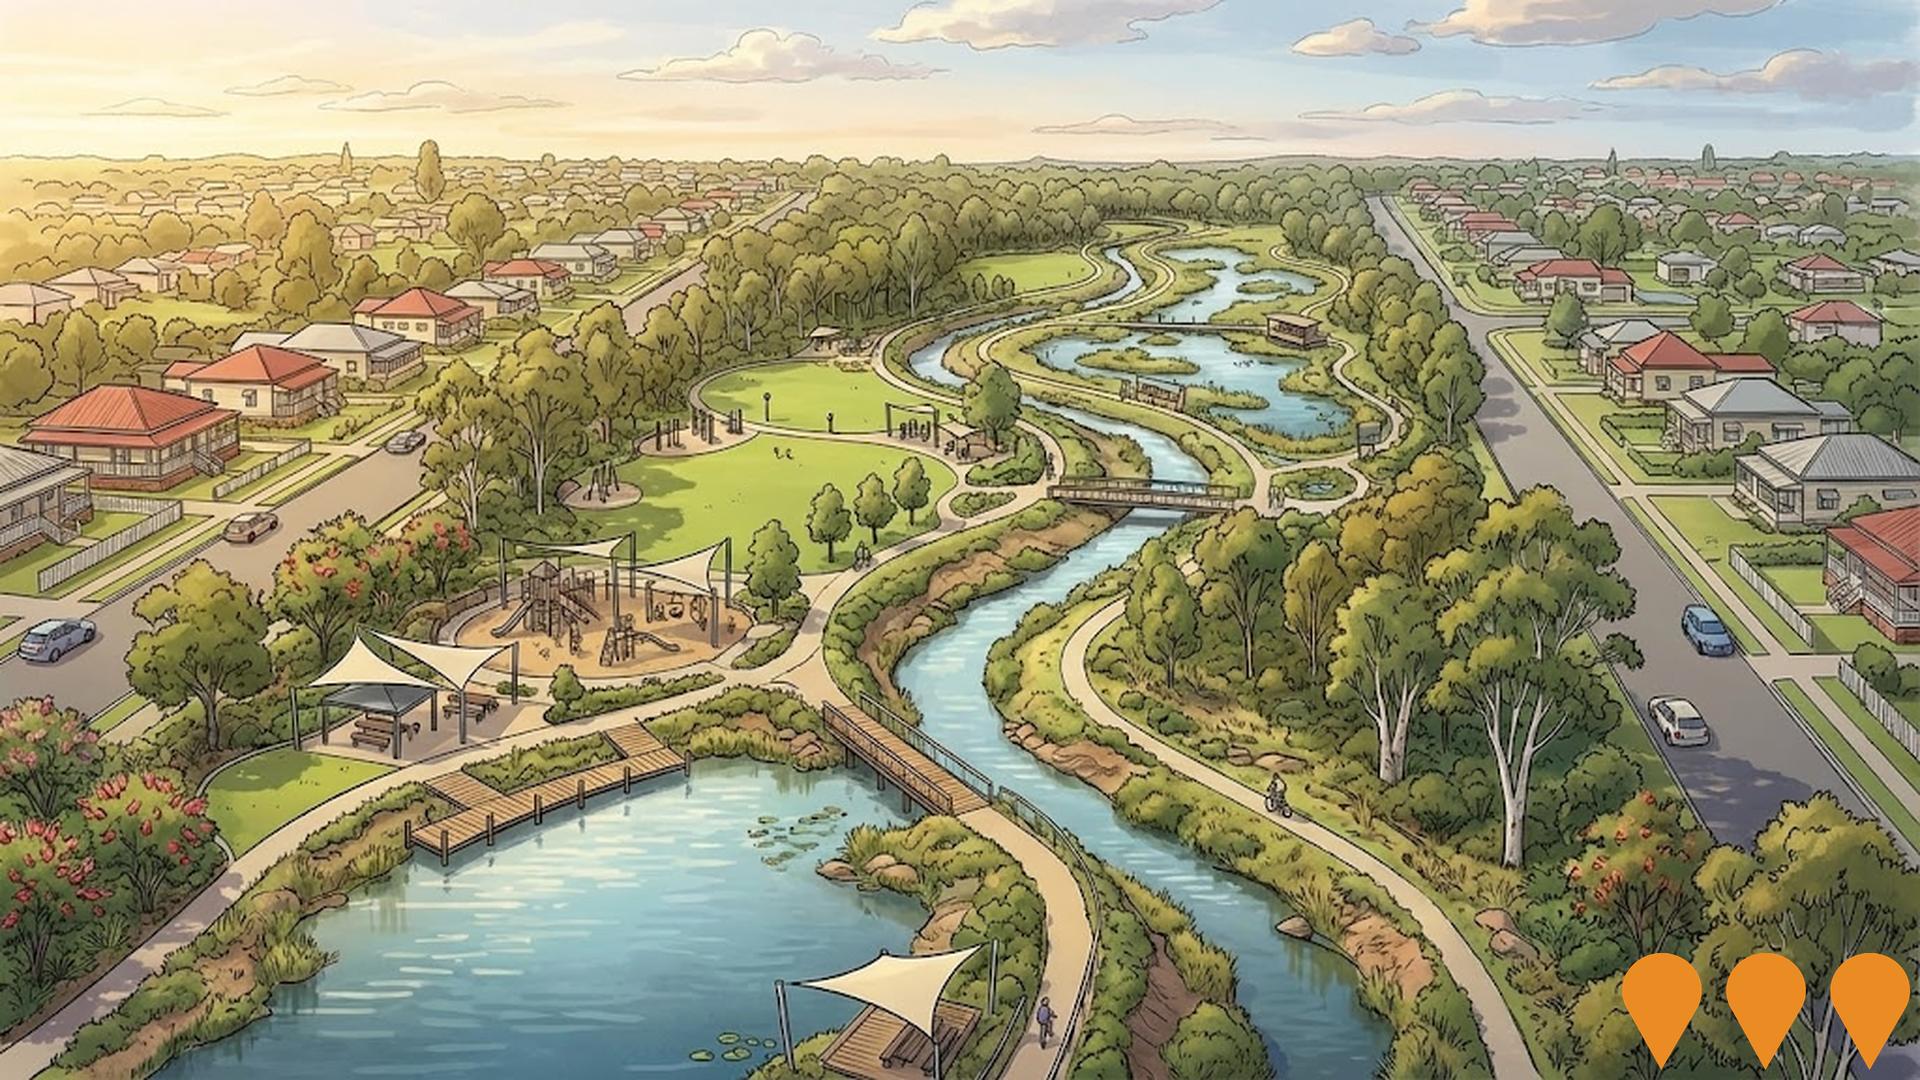
 Denotes AI-based impression for illustrative purposes only, not to be taken as definitive under any circumstances. Please follow links and conduct other investigations from the project's source for actual imagery. Developers and project owners wishing us to use original imagery please Contact Us and we will do so.
Frequently Asked Questions - Infrastructure
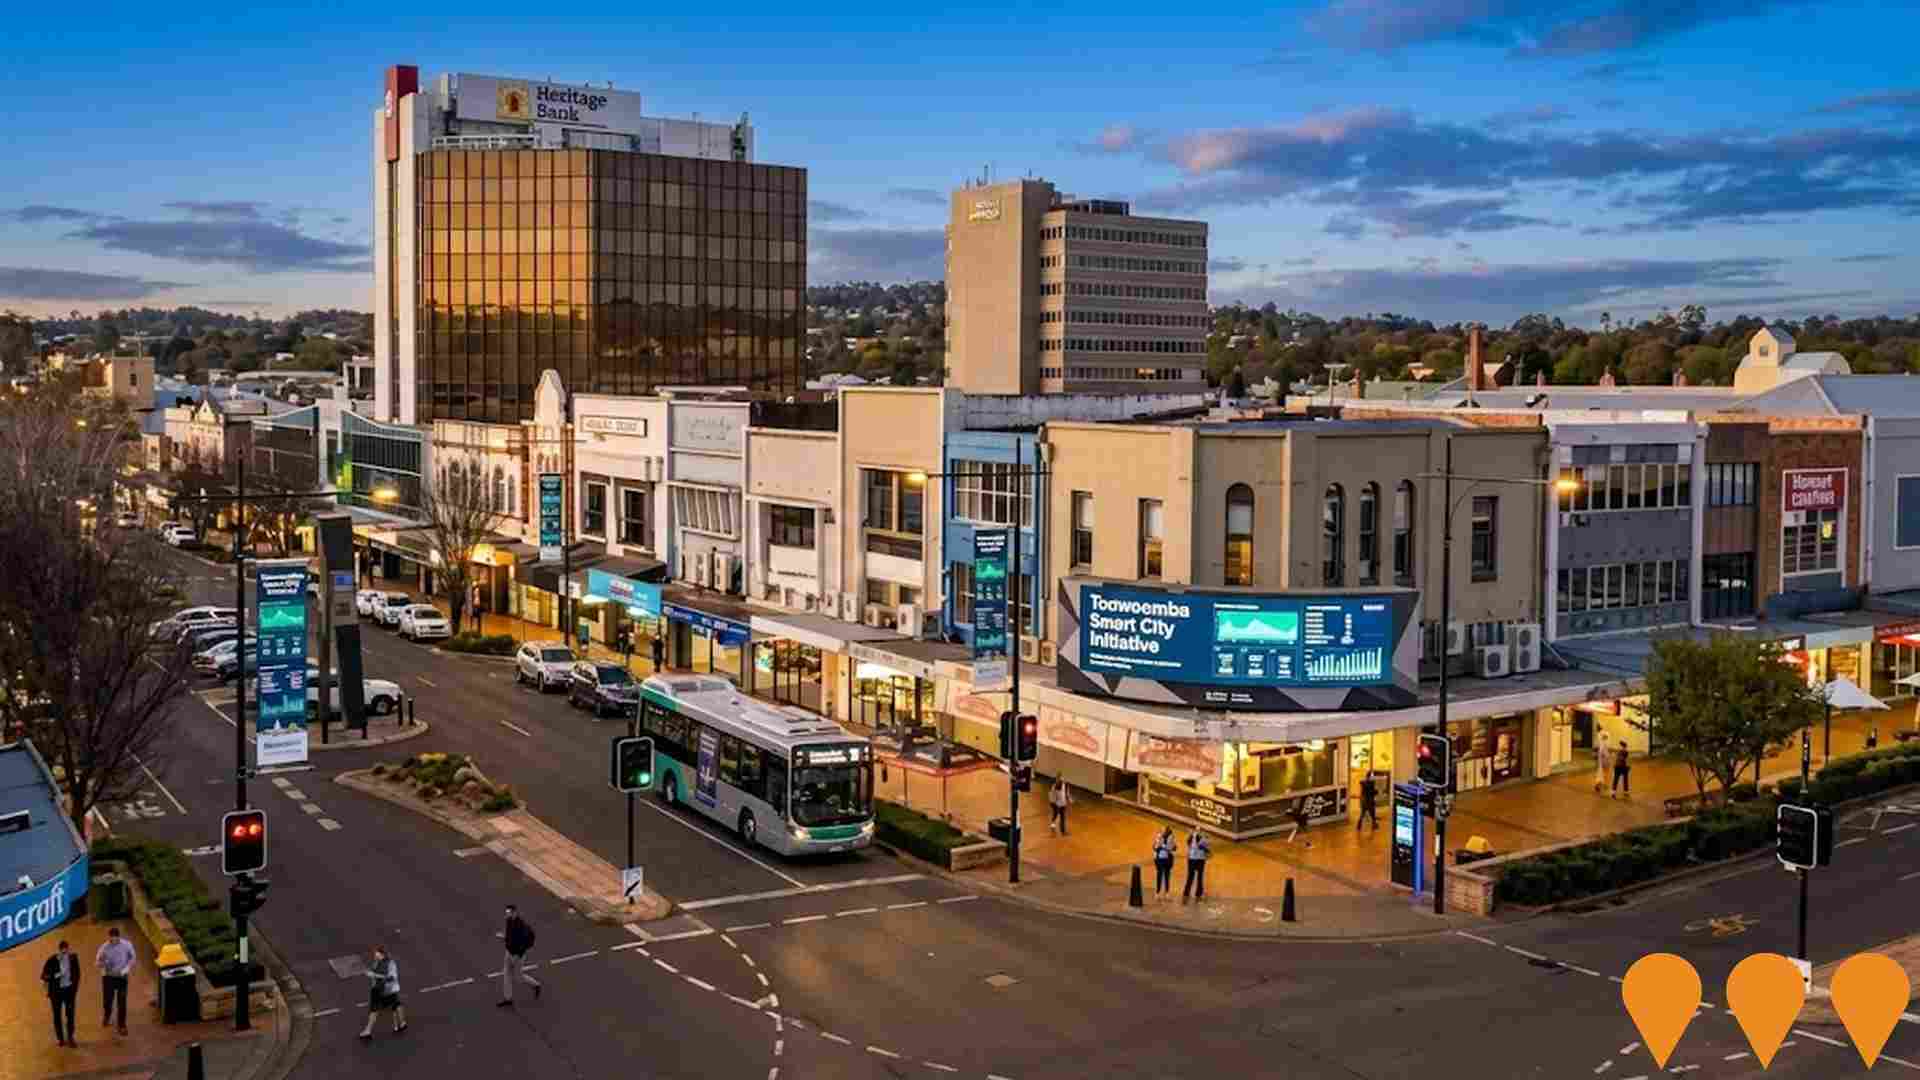
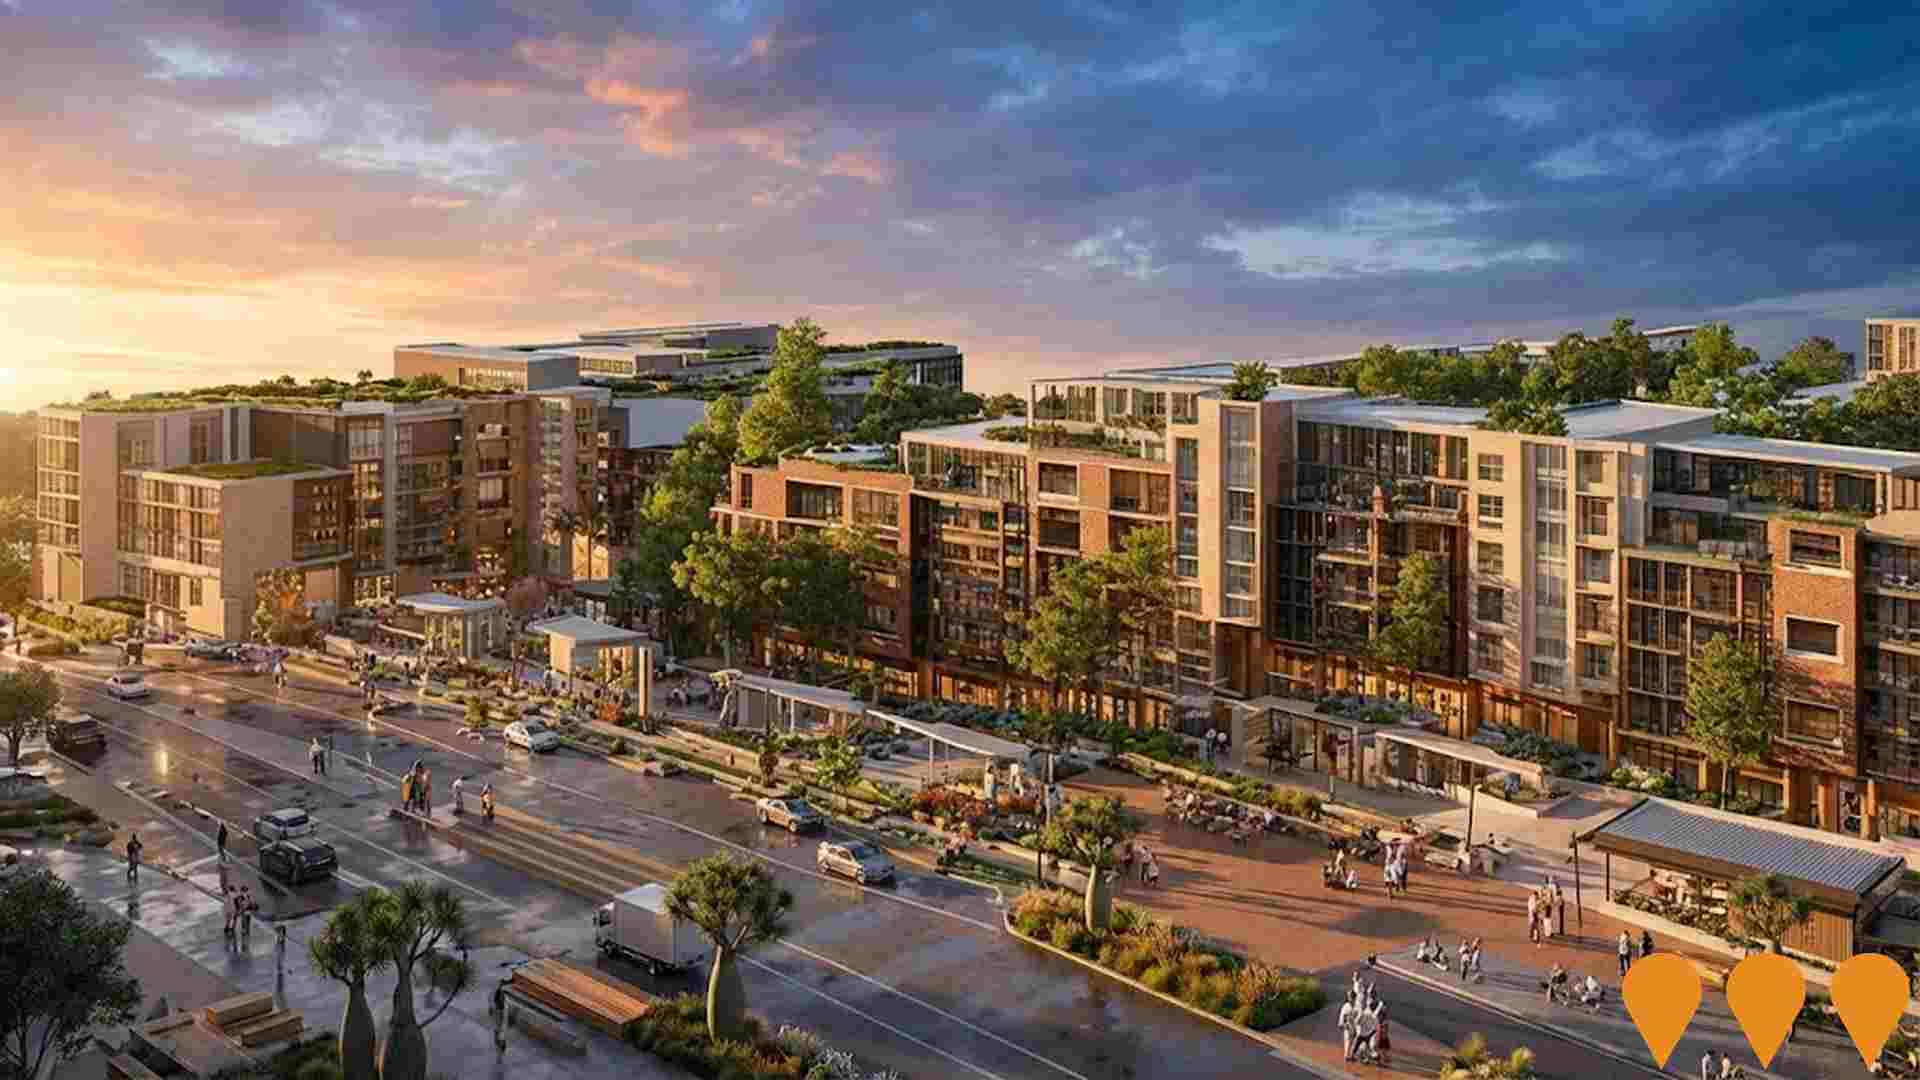
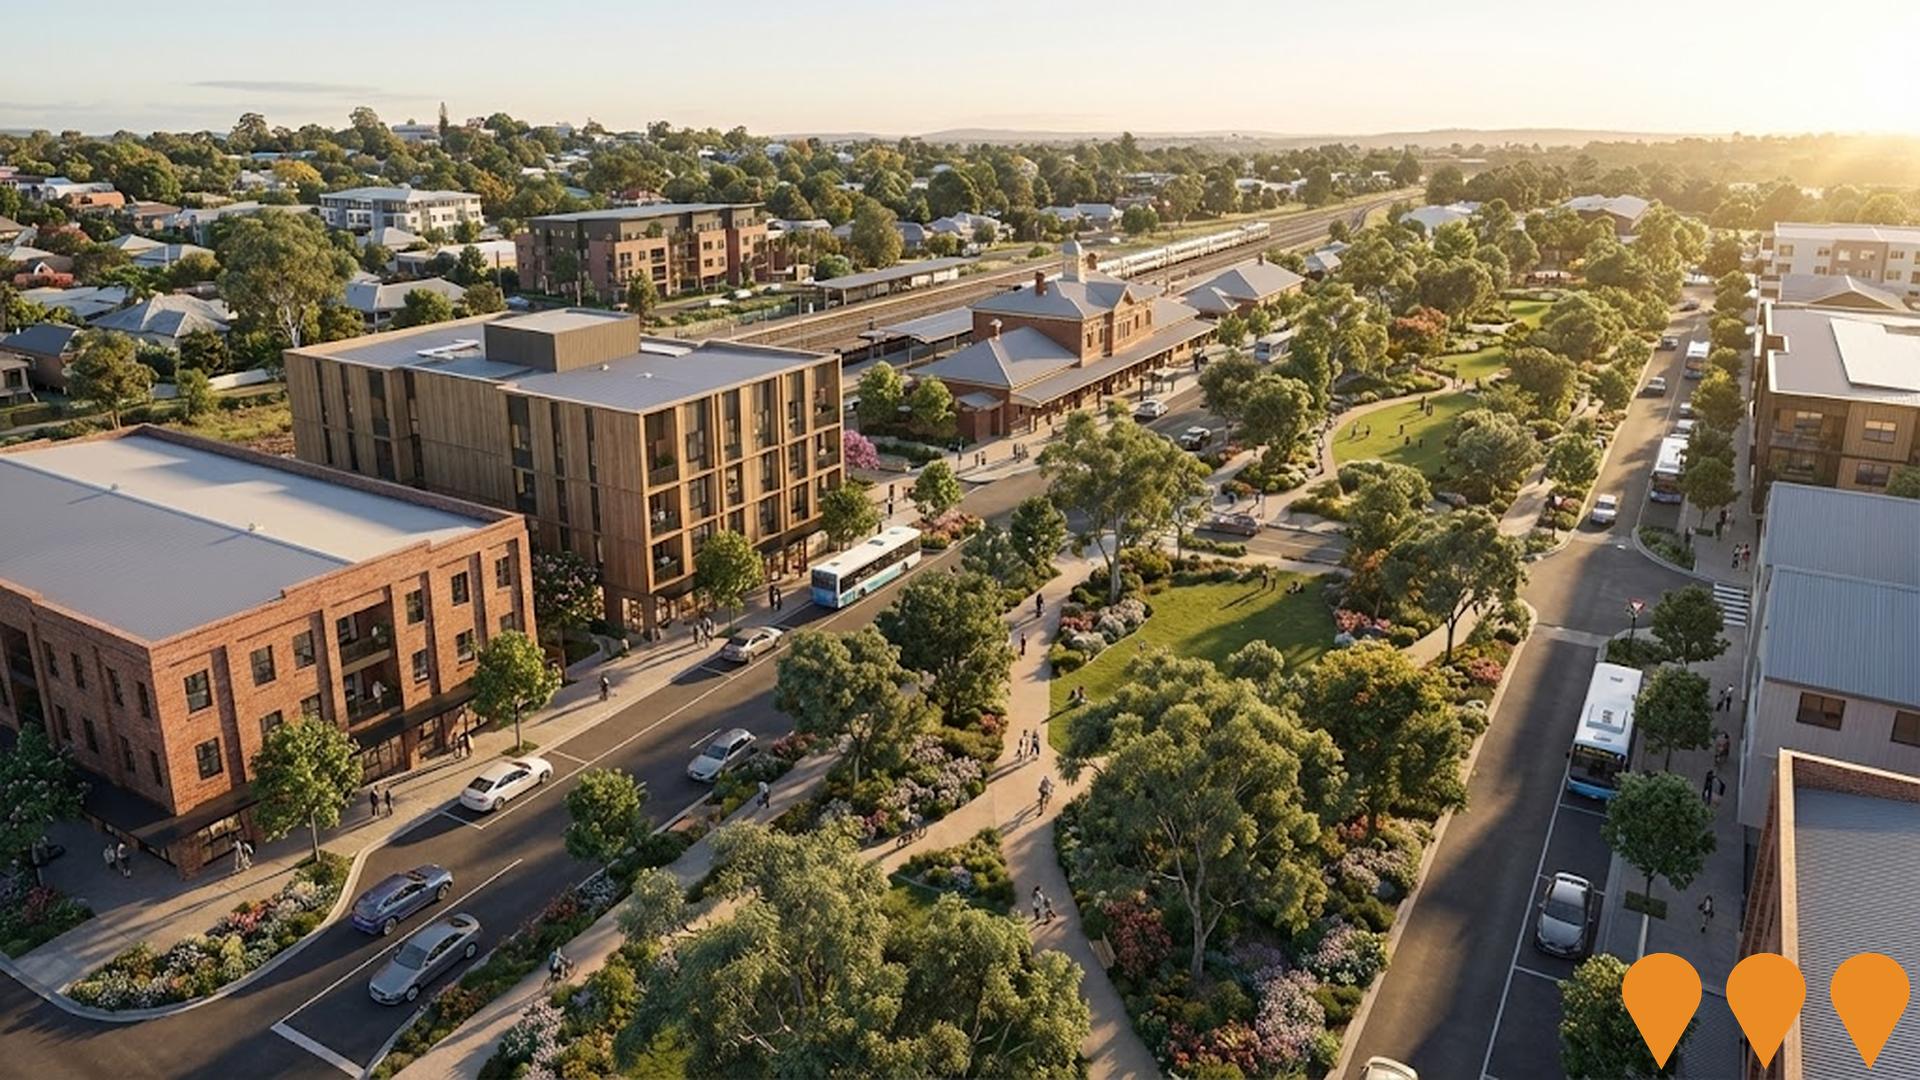
Toowoomba Railway Parklands Priority Development Area
The 51-hectare Toowoomba Railway Parklands Priority Development Area (PDA) is a declared PDA transforming former railway land north of Toowoomba CBD into a vibrant mixed-use urban village. It comprises six precincts delivering up to 2,270 dwellings, 43,500 m2 of commercial and retail floor space, significant new public parklands, community facilities and improved connectivity. The project is expected to generate approximately $680 million in economic benefit and support around 3,000 jobs over its 20+ year life. Development is regulated by the Toowoomba Railway Parklands PDA Development Scheme (July 2020). Development assessment is delegated to Toowoomba Regional Council.
Grants for Growth Infrastructure Plan
Comprehensive infrastructure investment program supporting community facilities, roads, and public amenities across the Toowoomba region.
Mater Dei Primary School Early Years Precinct
A $50 million Early Years Precinct development by the Roman Catholic Diocese of Toowoomba for Mater Dei Primary School. This major educational infrastructure project will provide state-of-the-art facilities for early childhood education in East Toowoomba.
Centenary Heights State High School Duane Music Excellence Centre
The project includes a new two-level Music Excellence Centre with acoustic music rooms, recording studio, practice rooms, atrium, two general learning areas, and a laboratory at Centenary Heights State High School.
East Creek Linear Corridor Masterplan
Upgrade of three parks along the East Creek linear corridor including Lake Annand Park, Emmerson Park, and Toowoomba Waterbird Habitat to improve recreational spaces and community facilities.
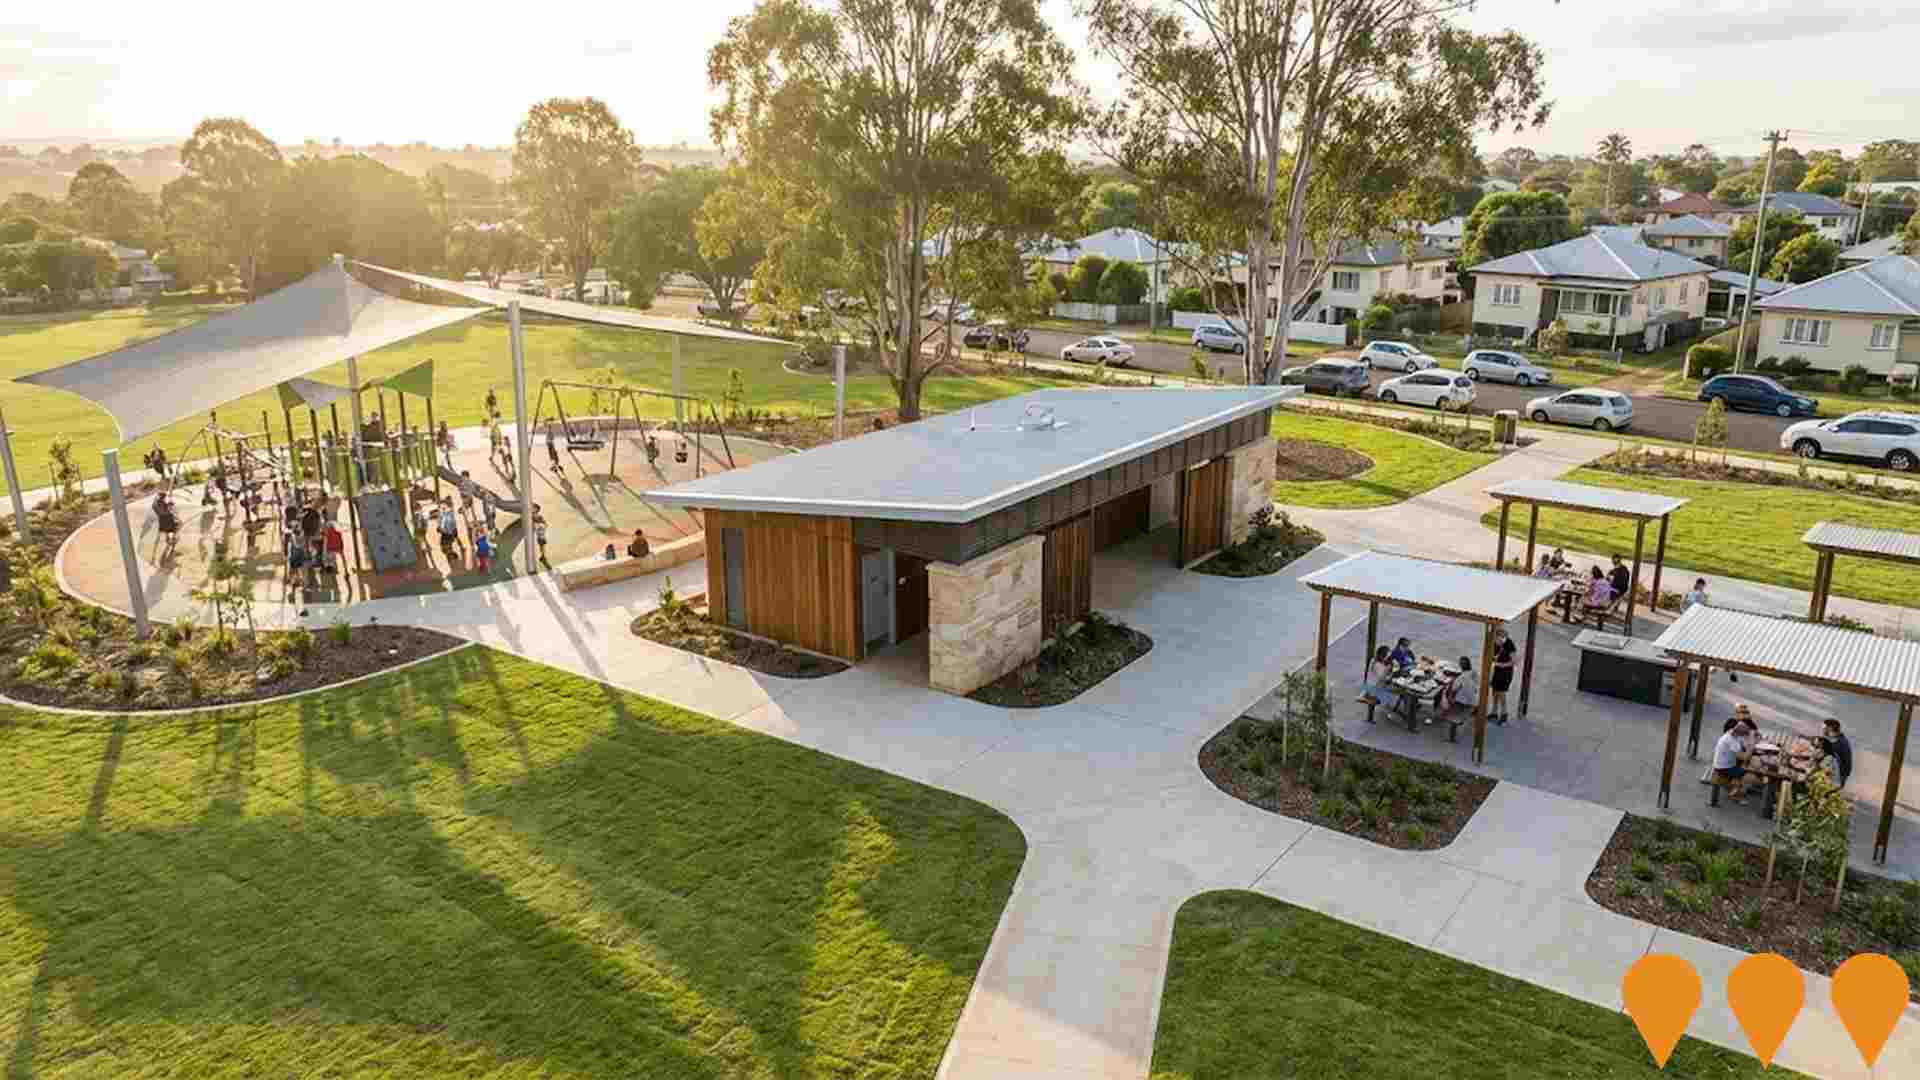
Emmerson Park District Park Upgrade
Upgrade of Emmerson Park from a local to a district level recreation park, including installation of toilet amenities building, pathways, playground, BBQ area with shelters and seating, and landscaping.
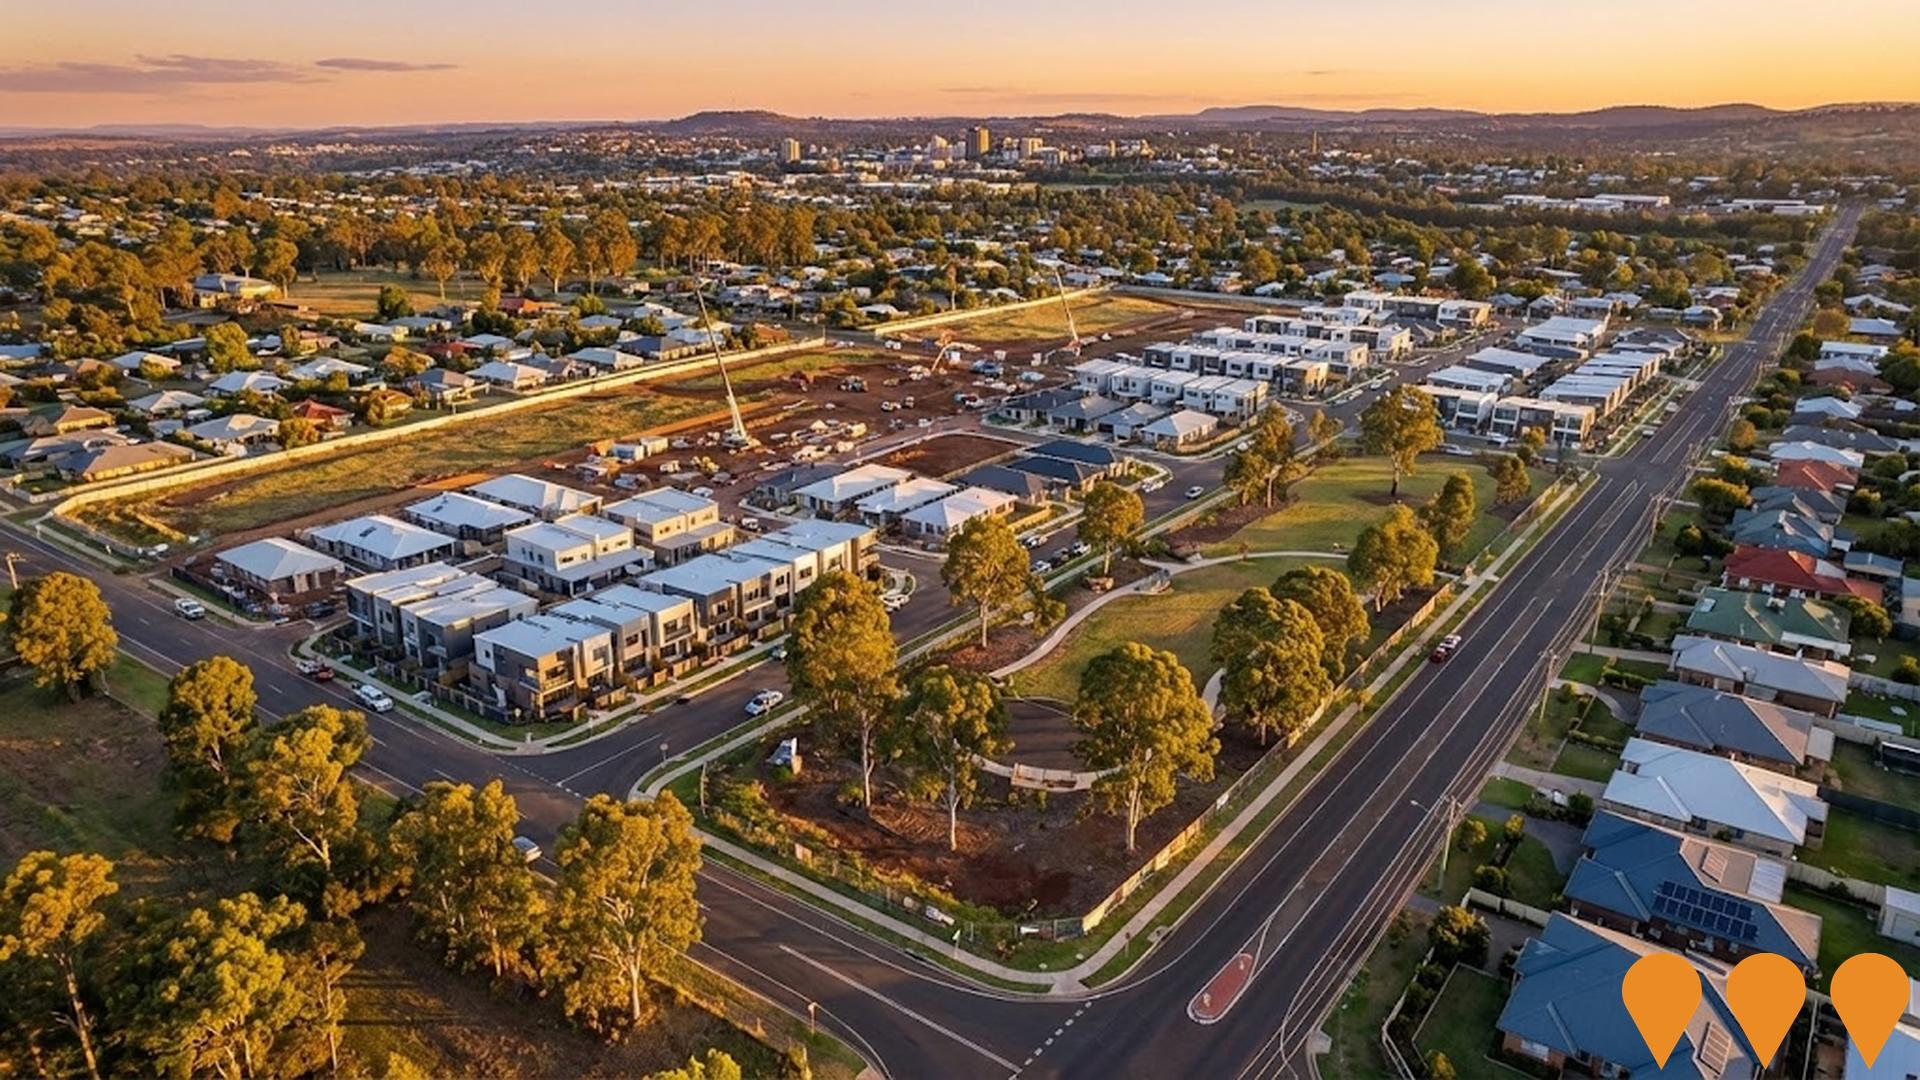
542-558 Hume Street Residential Development
8.55ha landholding with dual street frontage to Hume Street and Pillar Street, zoned for residential development allowing up to 342 dwellings across various typologies including house and land, townhouses, and land lease communities. The site offers a plug and play development opportunity in Toowoomba's premier suburb with flexible zoning and no restrictive overlays. The land was sold on 13 June 2025.
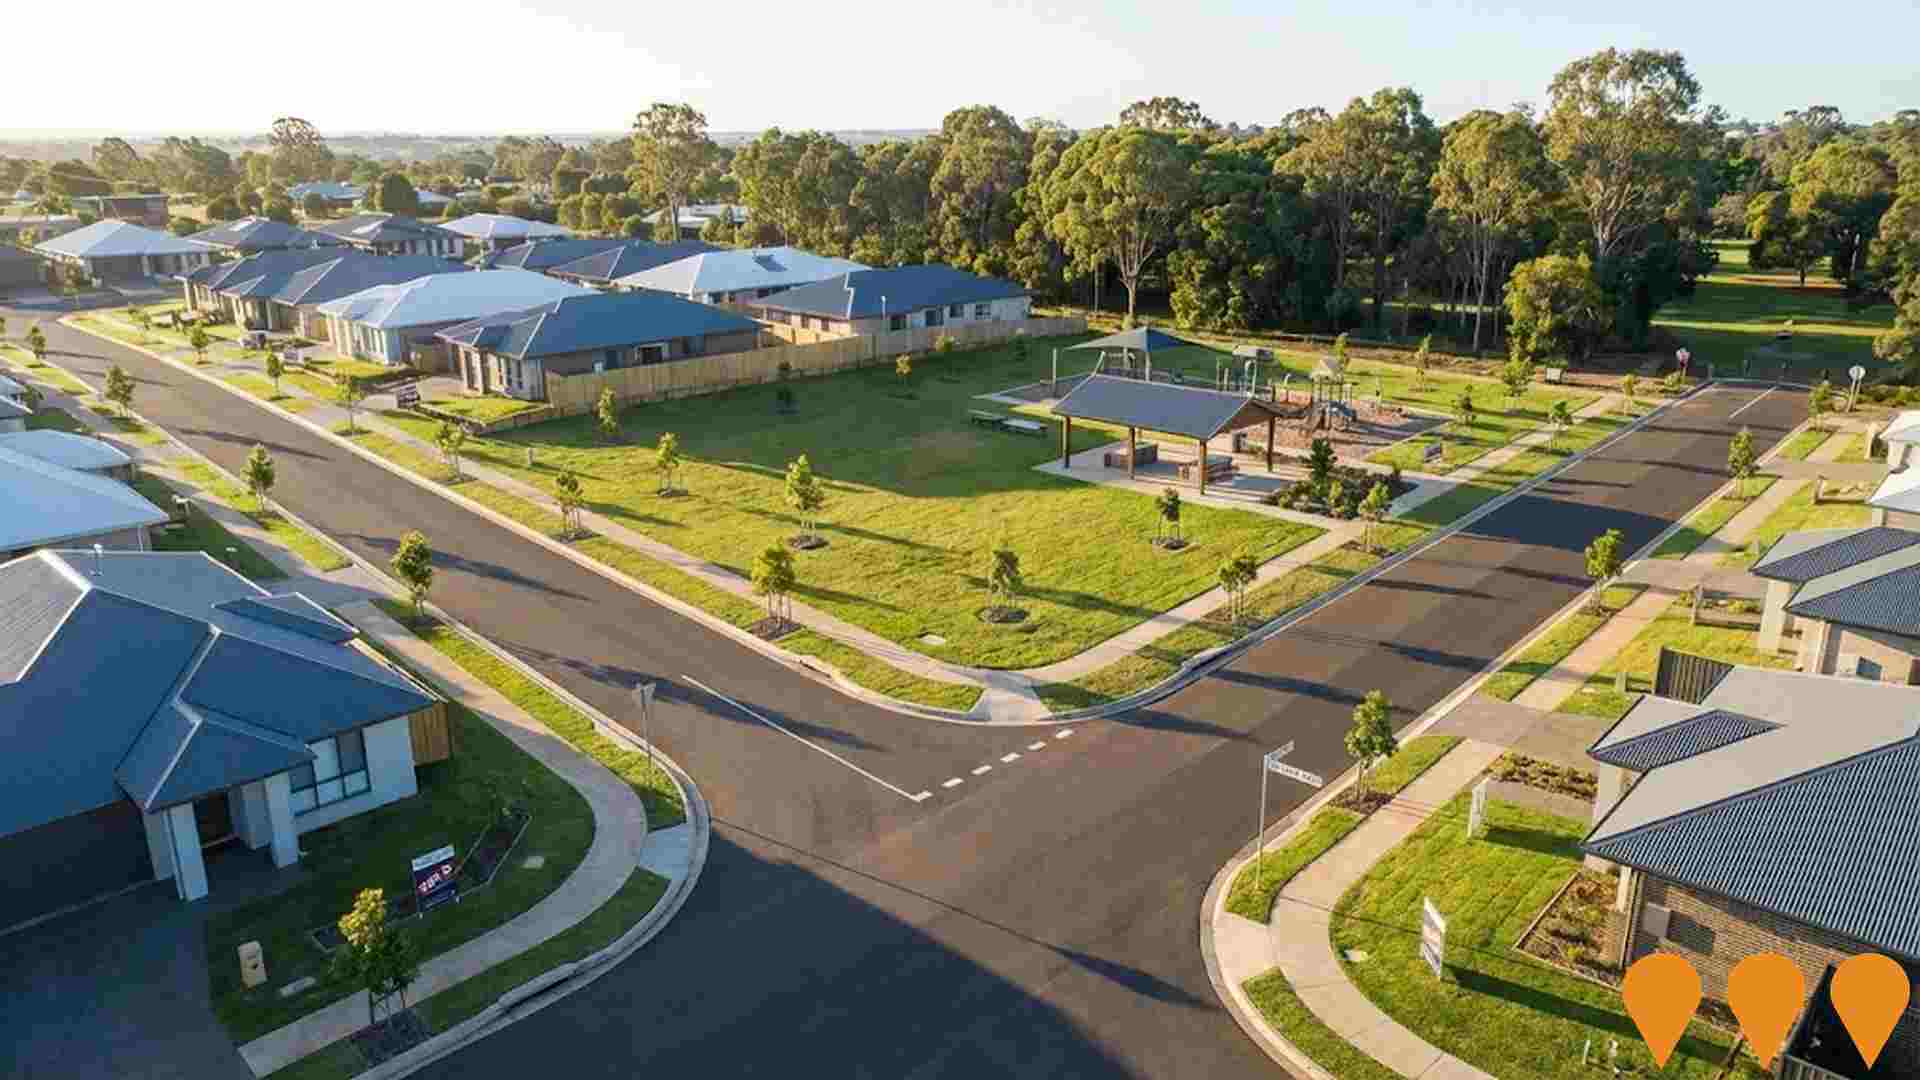
Dallang Road Residential Subdivision
42-lot residential subdivision delivered on a former 10 acre greenfield site bordering Menzies Street parkland in Middle Ridge, Toowoomba. Works included road upgrades and park embellishments. Project commenced March 2022 and reached completion January 2023, with lots sold out prior to completion.
Employment
The exceptional employment performance in Rangeville places it among Australia's strongest labour markets
Rangeville has a well-educated workforce with prominent representation in essential services sectors. Its unemployment rate was 1.7% as of September 2025, with an estimated employment growth of 4.6% over the past year.
As of that date, 4,544 residents were employed, and the unemployment rate was 2.4% lower than Rest of Qld's rate of 4.1%. Workforce participation in Rangeville is on par with Rest of Qld's 59.1%. The dominant employment sectors among residents include health care & social assistance, education & training, and retail trade. Health care & social assistance has a particularly high representation, at 1.4 times the regional level, while accommodation & food shows lower representation at 5.5% versus the regional average of 8.3%.
Over the 12 months to September 2025, employment in Rangeville increased by 4.6%, and labour force increased by 4.1%, causing the unemployment rate to fall by 0.5 percentage points. In contrast, Rest of Qld experienced employment growth of 1.7% and labour force growth of 2.1%, with a 0.3 percentage point rise in unemployment rate. State-level data from 25-Nov shows Queensland's employment contracted by 0.01% (losing 1,210 jobs), with the state unemployment rate at 4.2%, broadly in line with the national rate of 4.3%. Jobs and Skills Australia's national employment forecasts from May-25 suggest that national employment should expand by 6.6% over five years and 14.9% over ten years, based on a simple weighting extrapolation for illustrative purposes. Applying these projections to Rangeville's employment mix suggests local employment should increase by 7.2% over five years and 14.9% over ten years.
Frequently Asked Questions - Employment
Income
Income analysis reveals strong economic positioning, with the area outperforming 60% of locations assessed nationally by AreaSearch
The Rangeville SA2 had a median taxpayer income of $58,081 and an average of $71,365 in the financial year 2022, according to postcode level ATO data aggregated by AreaSearch. This was higher than the national averages of $50,780 (median) and $64,844 (average), as reported for Rest of Qld. By September 2025, estimated median income would be approximately $66,207, and average income around $81,349, based on Wage Price Index growth of 13.99% since financial year 2022. In Rangeville, household, family, and personal incomes clustered at the 51st percentile nationally in 2021 Census figures. The largest income segment comprised 31.7% earning $1,500 - $2,999 weekly, with 2,818 residents falling into this category, aligning with regional trends where this cohort also represented 31.7%. After housing costs, residents retained 87.5% of their income, indicating strong purchasing power. The area's SEIFA income ranking placed it in the 6th decile.
Frequently Asked Questions - Income
Housing
Rangeville is characterized by a predominantly suburban housing profile, with above-average rates of outright home ownership
Rangeville's dwelling structures, as per its latest Census data, consisted of 84.0% houses and 16.0% other dwellings (semi-detached, apartments, 'other' dwellings). This compares to Non-Metro Qld's figures of 81.4% houses and 18.6% other dwellings. Home ownership in Rangeville stood at 40.2%, with mortgaged dwellings at 31.9% and rented ones at 27.9%. The median monthly mortgage repayment in the area was $1,586, while the median weekly rent figure was recorded as $340. Nationally, Rangeville's mortgage repayments were lower than the Australian average of $1,863, with rents being less than the national figure of $375.
Frequently Asked Questions - Housing
Household Composition
Rangeville has a typical household mix, with a lower-than-average median household size
Family households constitute 70.0% of all households, including 27.0% couples with children, 31.6% couples without children, and 10.7% single parent families. Non-family households comprise the remaining 30.0%, with lone person households at 27.2% and group households at 2.6%. The median household size is 2.4 people, which is smaller than the Rest of Qld average of 2.5.
Frequently Asked Questions - Households
Local Schools & Education
The educational profile of Rangeville exceeds national averages, with above-average qualification levels and academic performance metrics
Rangeville's educational attainment is notably higher than broader benchmarks. Among residents aged 15 and over, 34.3% have university qualifications, compared to 20.6% in the rest of Queensland and 23.1% in the SA3 area. Bachelor degrees are the most common at 22.5%, followed by postgraduate qualifications (8.0%) and graduate diplomas (3.8%). Vocational credentials are also prevalent, with 31.7% of residents holding such qualifications.
This includes advanced diplomas (10.7%) and certificates (21.0%). Educational participation is high in Rangeville, with 28.3% of residents currently enrolled in formal education. This includes secondary education (9.4%), primary education (9.3%), and tertiary education (4.5%).
Frequently Asked Questions - Education
Schools Detail
Nearby Services & Amenities
Transport
Transport servicing is very low compared to other areas nationally based on assessment of service frequency, route connectivity and accessibility
Public transport analysis reveals three active transport stops operating within Rangeville. These stops serve a mix of bus routes, collectively providing 64 weekly passenger trips. Transport accessibility is rated as limited, with residents typically located 906 meters from the nearest transport stop.
Service frequency averages nine trips per day across all routes, equating to approximately 21 weekly trips per individual stop.
Frequently Asked Questions - Transport
Transport Stops Detail
Health
Health performance in Rangeville is lower than average with common health conditions somewhat prevalent across both younger and older age cohorts
Rangeville faces significant health challenges with common health conditions prevalent across both younger and older age cohorts. The rate of private health cover is high at approximately 55% of the total population (~4,890 people), compared to 51.0% across Rest of Qld.
The most common medical conditions are arthritis and mental health issues, impacting 9.2 and 8.3% of residents respectively, while 65.3% declare themselves completely clear of medical ailments, similar to the 65.3% across Rest of Qld. As of 2016, 23.8% of residents are aged 65 and over (2,119 people), higher than the 18.8% in Rest of Qld. Health outcomes among seniors are above average, performing better than the general population in health metrics.
Frequently Asked Questions - Health
Cultural Diversity
Rangeville ranks below the Australian average when compared to other local markets across a number of language and cultural background related metrics
Rangeville was found to have below average cultural diversity, with 84.7% of its population born in Australia, 90.9% being citizens, and 91.3% speaking English only at home. The predominant religion in Rangeville is Christianity, comprising 62.7% of the population, compared to 58.8% across the rest of Queensland. The top three ancestry groups in Rangeville are English (28.9%), Australian (25.7%), and Irish (11.6%).
Notably, German ancestry is overrepresented at 7.6%, compared to 8.0% regionally, while Scottish ancestry stands at 9.0%, versus 7.9%. Sri Lankan ancestry, however, is underrepresented at 0.4%, compared to the regional average of 0.1%.
Frequently Asked Questions - Diversity
Age
Rangeville hosts a notably older demographic compared to the national average
Rangeville's median age is 43 years, higher than Rest of Qld's average of 41 and exceeding the national average of 38. The percentage of residents aged 85+ is 4.2%, higher than Rest of Qld. The 55-64 cohort stands at 10.6%. Post-Census data shows the 15 to 24 age group grew from 11.0% to 12.4%, while the 35 to 44 cohort increased from 12.2% to 13.5%. Conversely, the 5 to 14 cohort declined from 13.4% to 11.7%, and the 45 to 54 group dropped from 12.9% to 11.7%. By 2041, demographic modeling projects significant changes in Rangeville's age profile. The 25 to 34 cohort is projected to grow by 25%, adding 242 residents to reach 1,203. Meanwhile, population declines are projected for the 55 to 64 and 65 to 74 cohorts.
