Chart Color Schemes
This analysis uses ABS Statistical Areas Level 2 (SA2) boundaries, which can materially differ from Suburbs and Localities (SAL) even when sharing similar names.
SA2 boundaries are defined by the Australian Bureau of Statistics and are designed to represent communities for statistical reporting (e.g., census and ERP).
Suburbs and Localities (SAL) represent commonly-used suburb/locality names (postal-style areas) and may use different geographic boundaries. For comprehensive analysis, consider reviewing both boundary types if available.
est. as @ -- *
ABS ERP | -- people | --
2021 Census | -- people







Curious about local property values? Filter the chart to assess the volume and appreciation (including resales) trends and regional comparisons, or scroll to the map below view this information at an individual property level.
Find a Recent Sale

Sales Detail
Middle Park - Jamboree Heights has an estimated 7,411 residents, up from 7,086 at the 2021 Census — a change of 325 people, or 4.6%. Growth has averaged 0.5% a year over five years. That puts 2,776 residents on each square kilometre. Population is estimated from ABS Estimated Resident Population releases and GNAF address data, re-based from the 2021 Census and updated annually.
Detail
According to analysis conducted by AreaSearch, the resident population of Middle Park - Jamboree Heights stands at approximately 7,411 as of Aug 2026. This represents an addition of 325 people (4.6%) compared to the 2021 Census tally of 7,086 people. This adjustment is derived from the ABS estimated resident population figure of 7,411 recorded as of June 2025 alongside post-Census address validation. With a population density of 2,775 persons per square kilometer, the locality ranks in the upper quartile among all areas nationwide evaluated by AreaSearch. Furthermore, the 4.6% expansion achieved by Middle Park - Jamboree Heights since the 2021 census surpassed the broader SA3 area (3.0%), establishing the community as a regional growth leader.
Inbound overseas migration served as the primary driver of this demographic growth, accounting for roughly 73.0% of total recent net gains. SA2 geographic modeling by AreaSearch incorporates ABS/Geoscience Australia demographic projections published in 2024 utilizing 2022 as a base year. Where SA2 coverage is absent or for periods extending post-2032, Queensland State Government SA2 projections released in 2023 (utilizing 2021 data) are integrated. Because those state-level datasets lack detailed age breakdowns, AreaSearch applies proportional distribution weights derived from the 2023 ABS Greater Capital Region projections (based on 2022 data) across individual cohorts. Under this combined forecast structure, the overall population is projected to contract by 644 persons by 2041. In contrast to this aggregate decline, certain senior segments are set to expand, most notably the 75 to 84 age group with an anticipated increase of 182 people.
Frequently Asked Questions - Population
23 new dwellings have been approved in Middle Park - Jamboree Heights over the past five years, an average of 4 a year. That is 0.6 approvals per 1,000 residents. Figures come from ABS building approvals aggregated to this SA2 boundary and are updated monthly as the ABS releases them.
Detail
Residential building approvals across Middle Park - Jamboree Heights have averaged roughly 4 new homes per year, totaling 23 homes approved over the past 5 financial years (between FY-22 and FY-26). Over this identical timeframe (between FY-22 and FY-26), approximately 8.5 new residents per year were added for each newly built dwelling, creating a substantial supply-demand imbalance that typically fuels buyer competition and elevates property values. Newly approved dwellings carry an average construction value of $530,000, which sits higher than regional benchmarks and highlights an emphasis on premium residential building.
Furthermore, commercial building approvals have totaled $1.1 million this financial year, underscoring the predominantly residential focus of the neighborhood. When compared against Greater Brisbane, construction volumes in Middle Park - Jamboree Heights are notably subdued, tracking 62.0% below regional average per person. Such tight supply limits tend to bolster valuations and demand across the established housing stock. This subdued building rate also tracks below national levels, highlighting the mature footprint of the area and potential land supply constraints. Additionally, recent residential approvals have consisted exclusively of detached houses, preserving the traditional, family-oriented suburban landscape valued for spacious living. An approval density of approximately 1845 people per approval underscores the established character of the suburb. With demographic forecasts pointing toward a flat or shrinking resident base, Middle Park - Jamboree Heights could see reduced pressure across local housing, potentially fostering advantageous conditions for prospective purchasers.
Frequently Asked Questions - Development
Development applications around Middle Park - Jamboree Heights
Loading development applications…
| Lodged | Address | Description | Type | Distance | Status |
|---|
SOURCE: Planning portals and council registers, compiled by AreaSearch. Distance & bearing measured from the suburb midpoint.
AreaSearch tracks 2 current infrastructure and development projects inside Middle Park - Jamboree Heights. A further 63 sit in the immediately surrounding suburbs, taking the tracked pipeline within reach of the area to $23.3 billion. 11 are already under construction and 18 are due for completion within three years. The pipeline spans residential development, transport & logistics and retail. Records are compiled from Infrastructure Australia, state agencies, council planning portals and public announcements, reviewed and updated daily, then ranked by proximity, construction stage, completion horizon and project scale.
Detail
Local capital expenditure and planning developments play a pivotal role in shaping community growth and property outcomes. In total, 6 key projects have been catalogued by AreaSearch as having significant relevance for the local area. Notable initiatives include the Middle Park Intersection Upgrade (Eumong Street/Riverhills Road), the Metro Middle Park Mixed-Use Redevelopment, the McLeod Country Golf Club Retirement Village, and Centenary Motorway Upgrade Planning.
Professional plan users can use the search below to filter and access additional projects.
INFRASTRUCTURE SEARCH
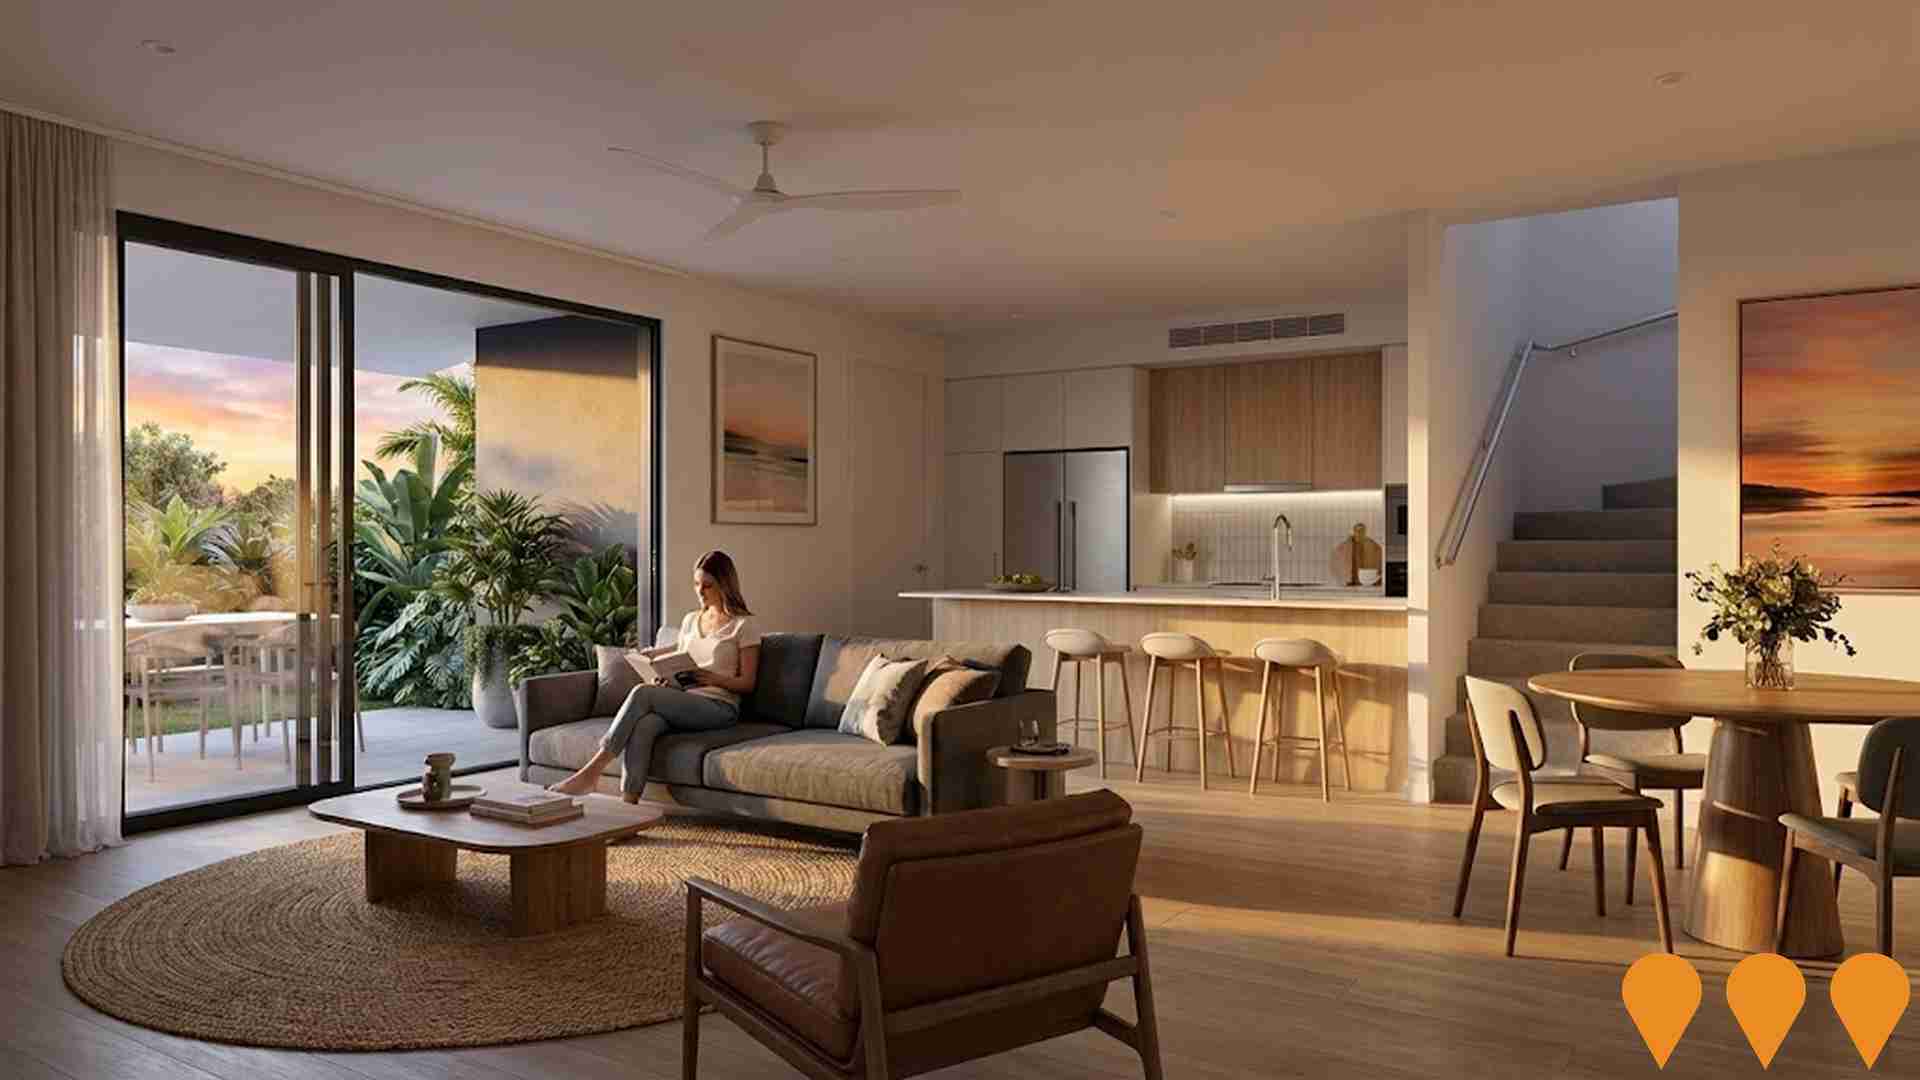
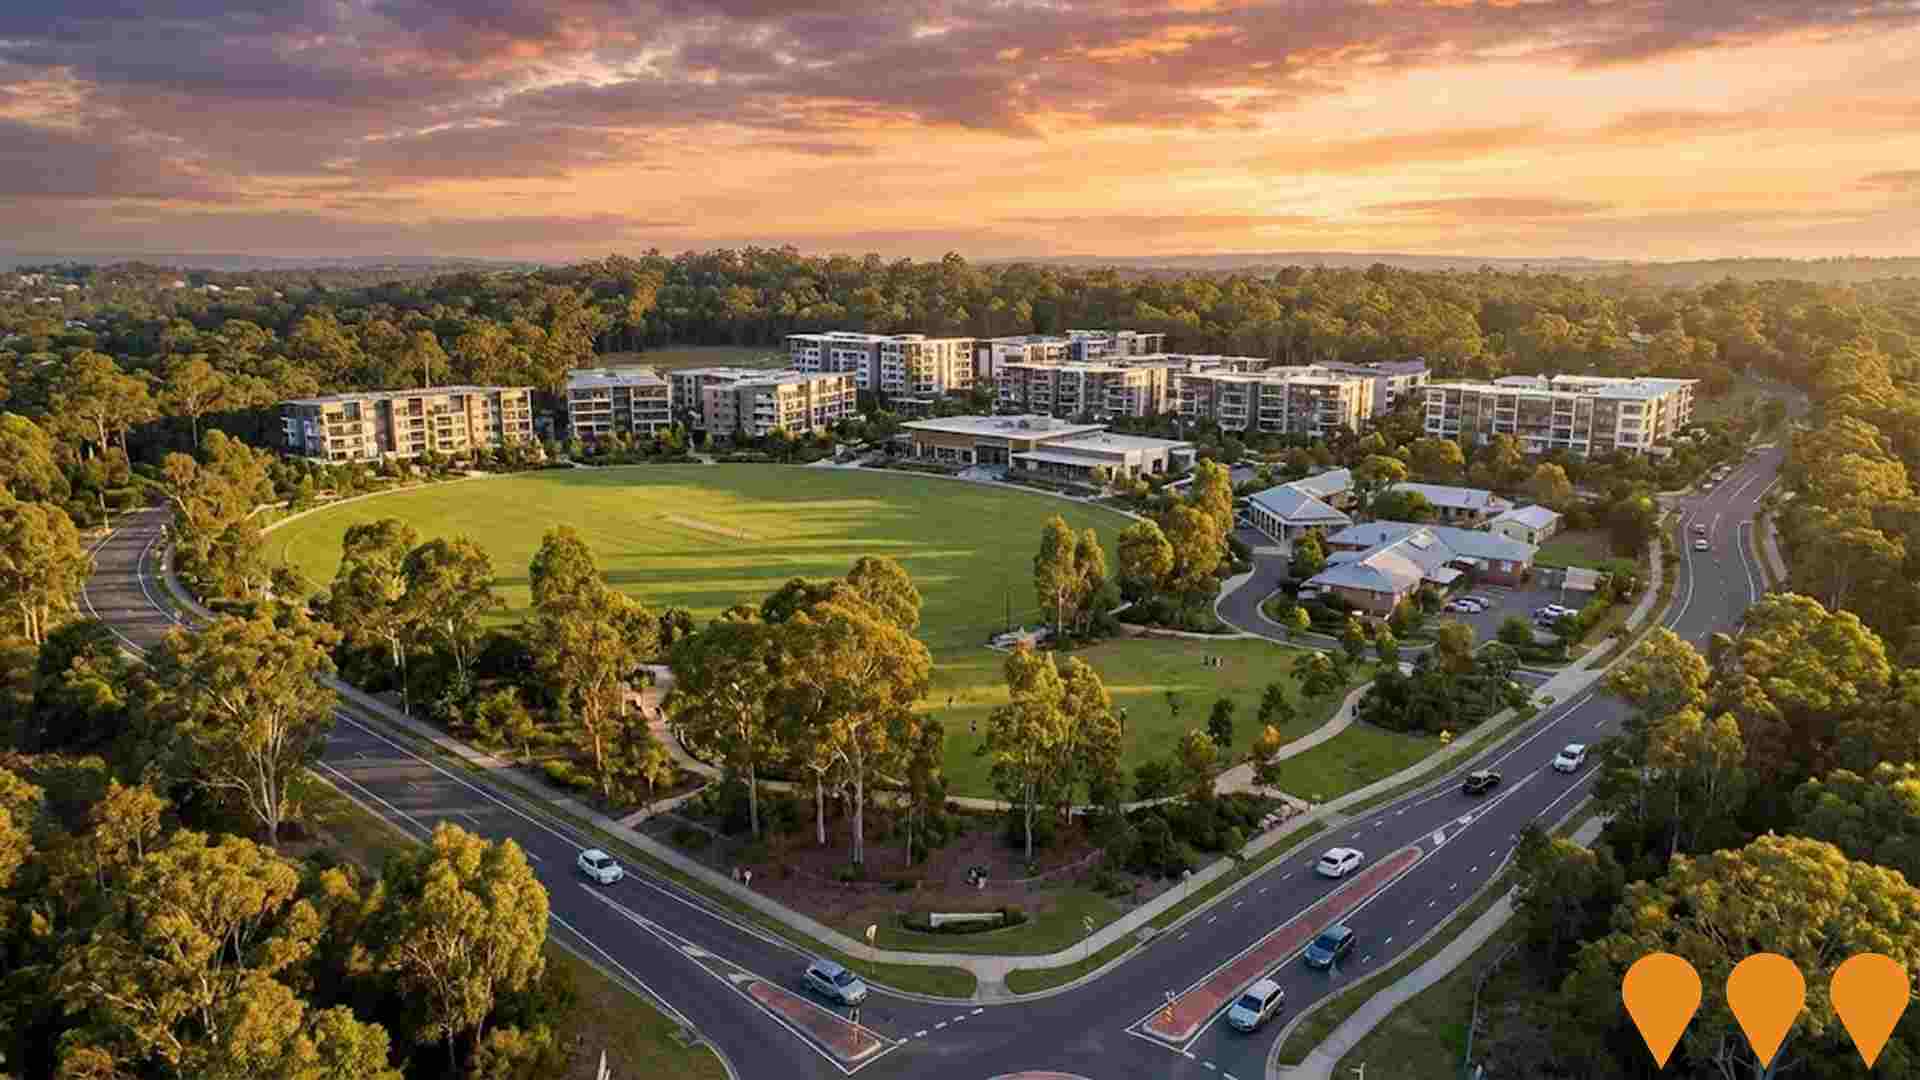
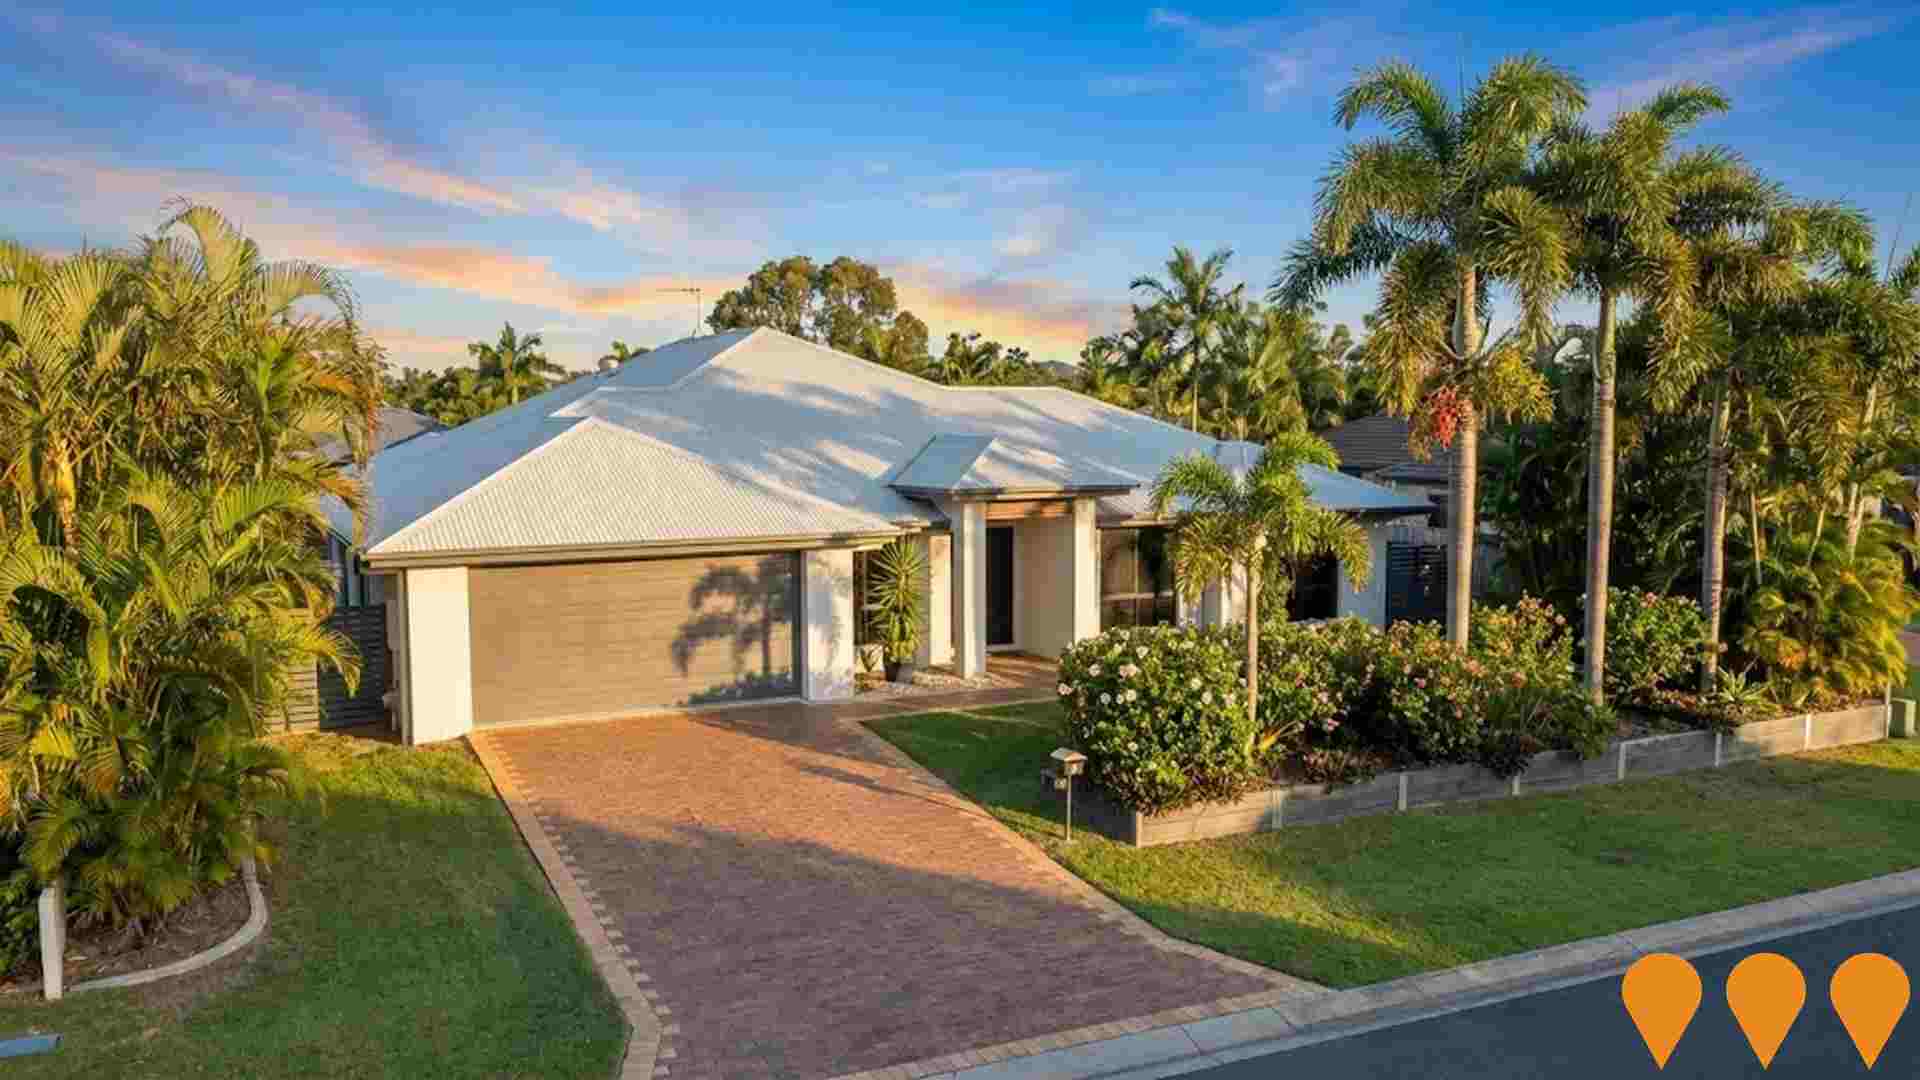
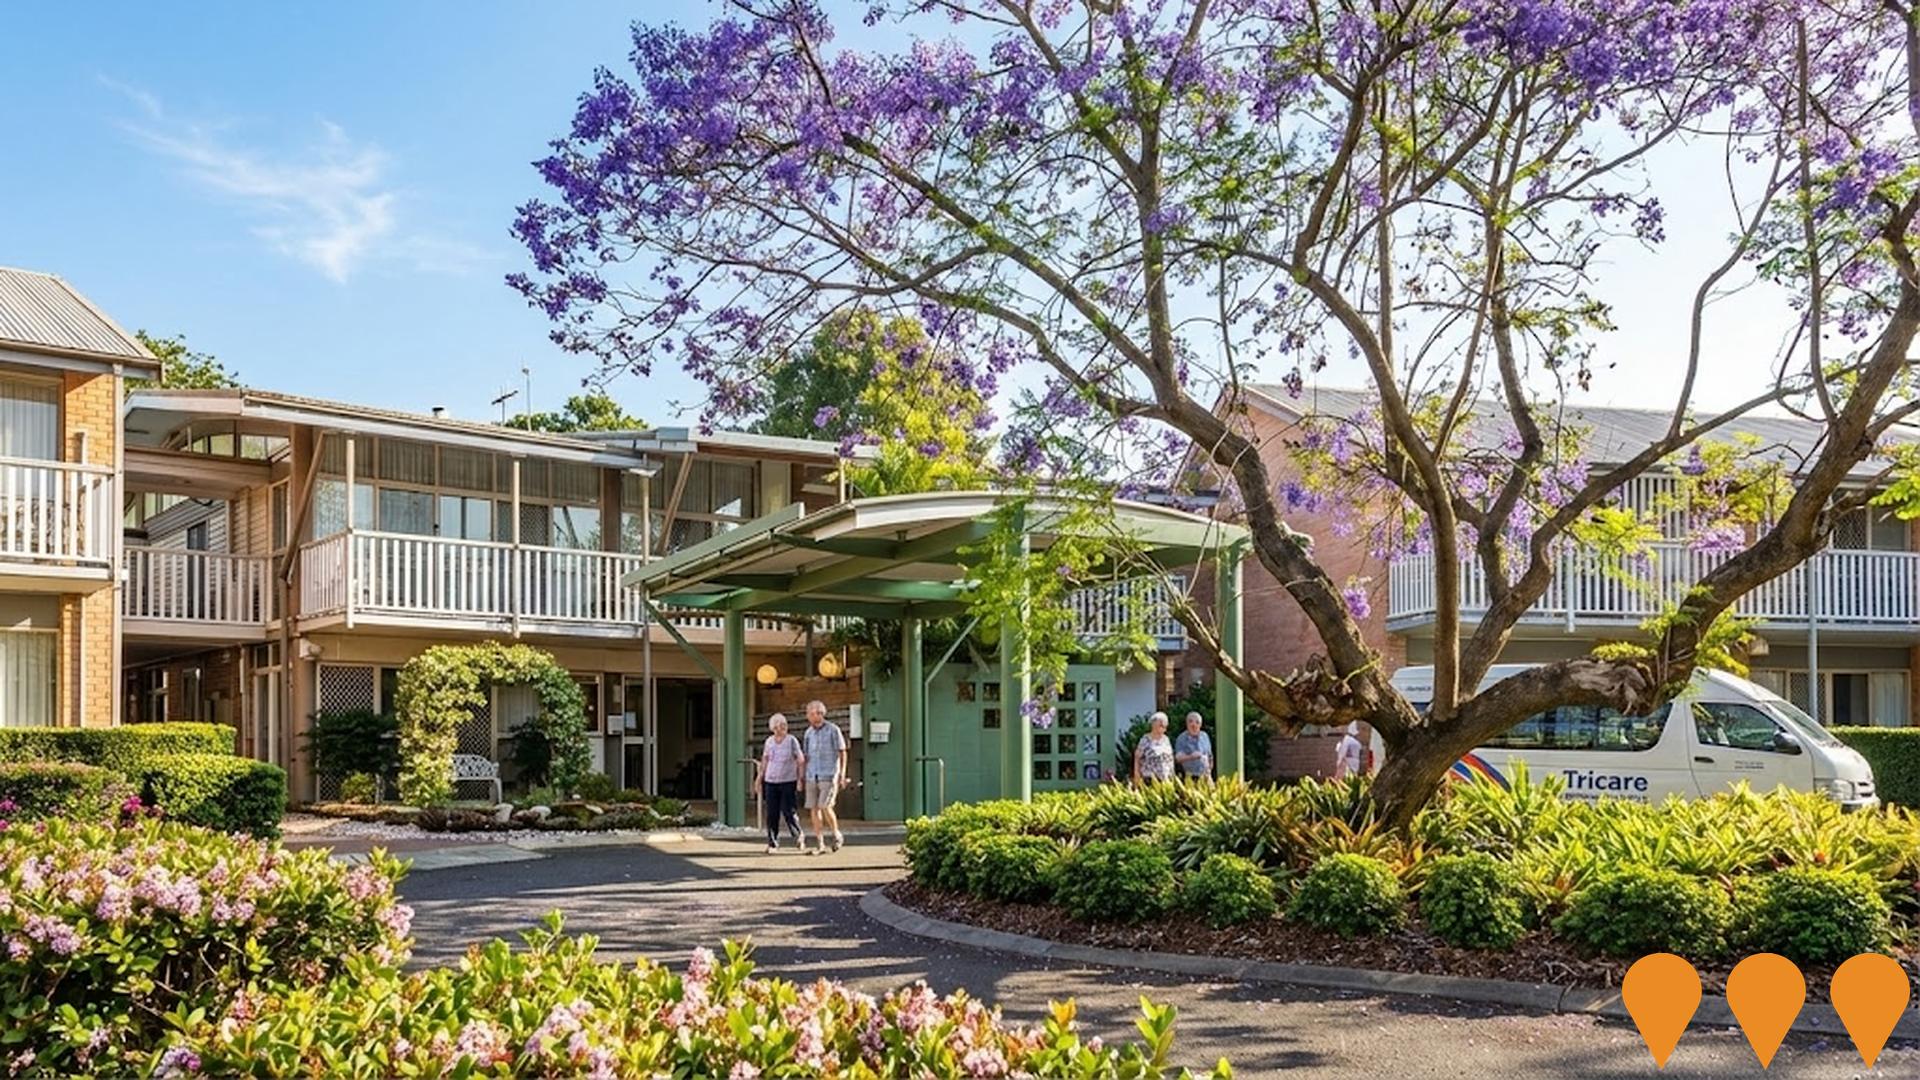
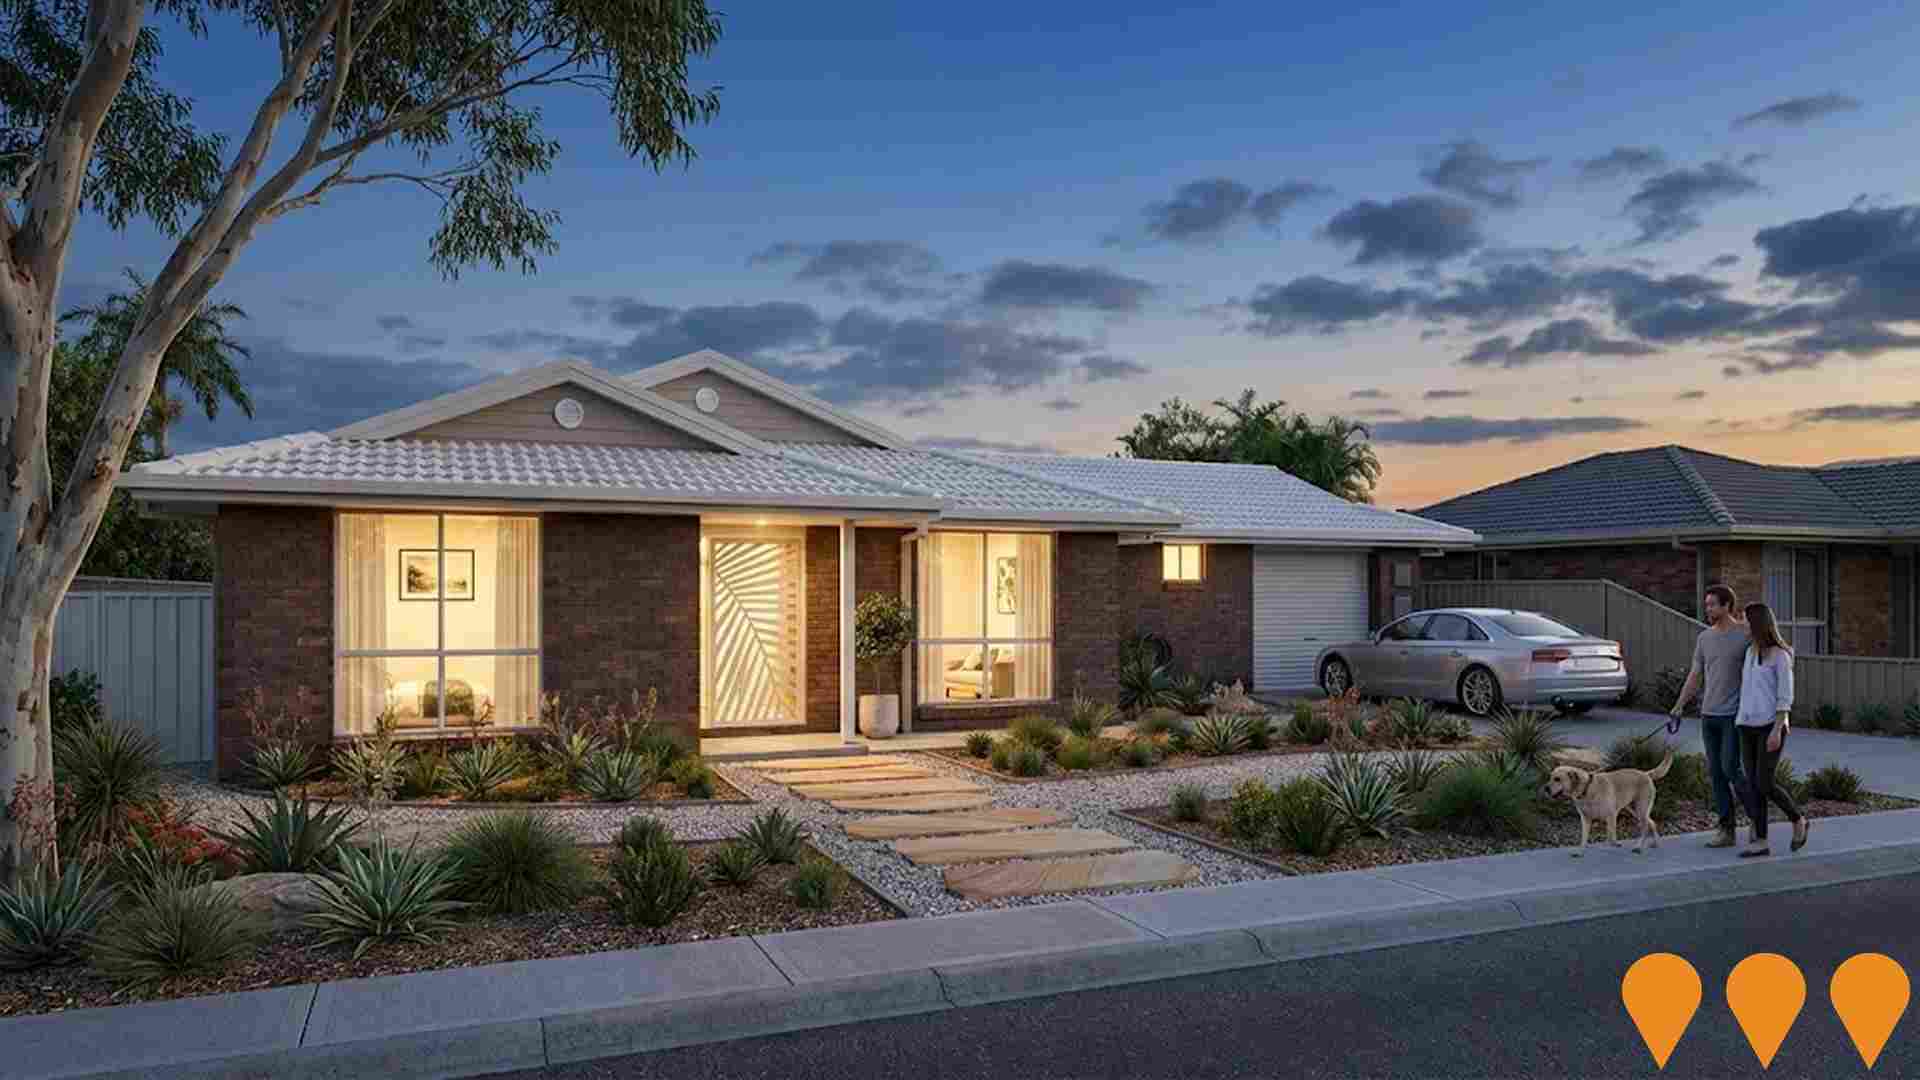
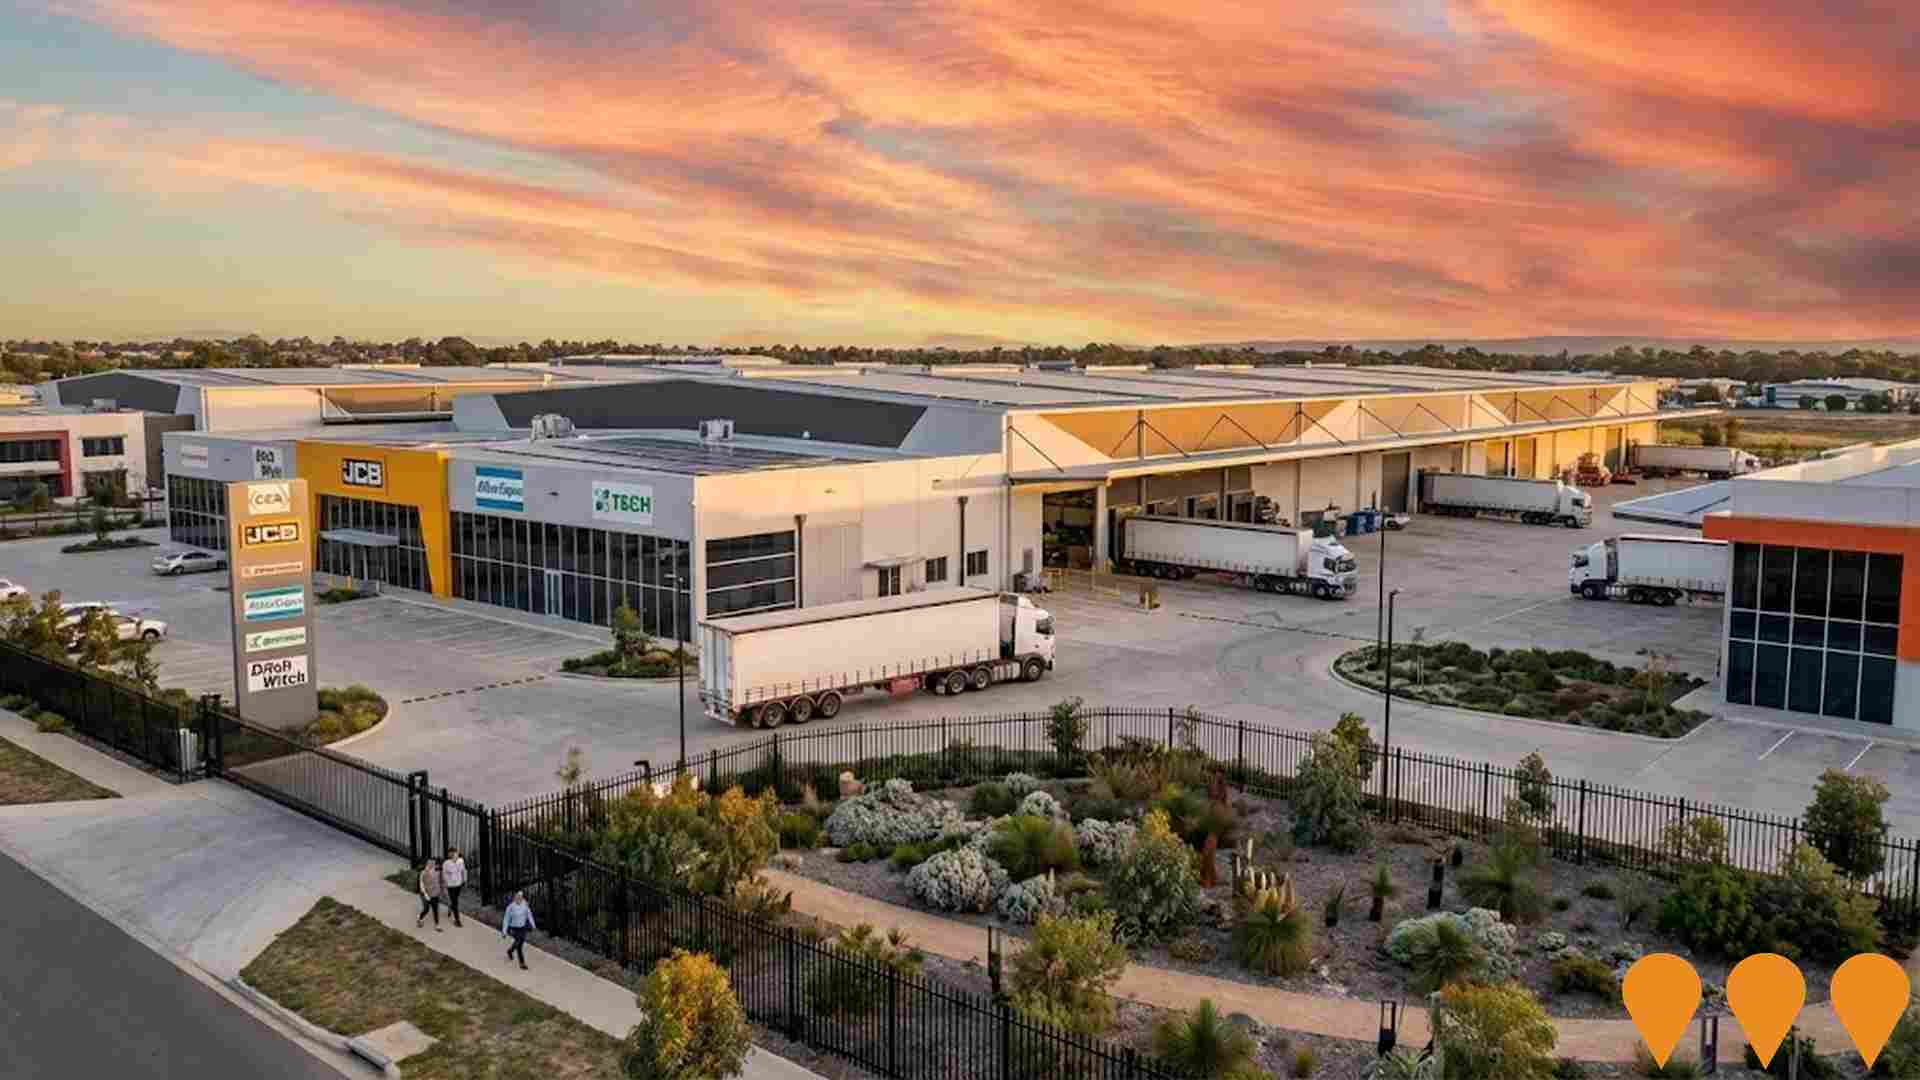
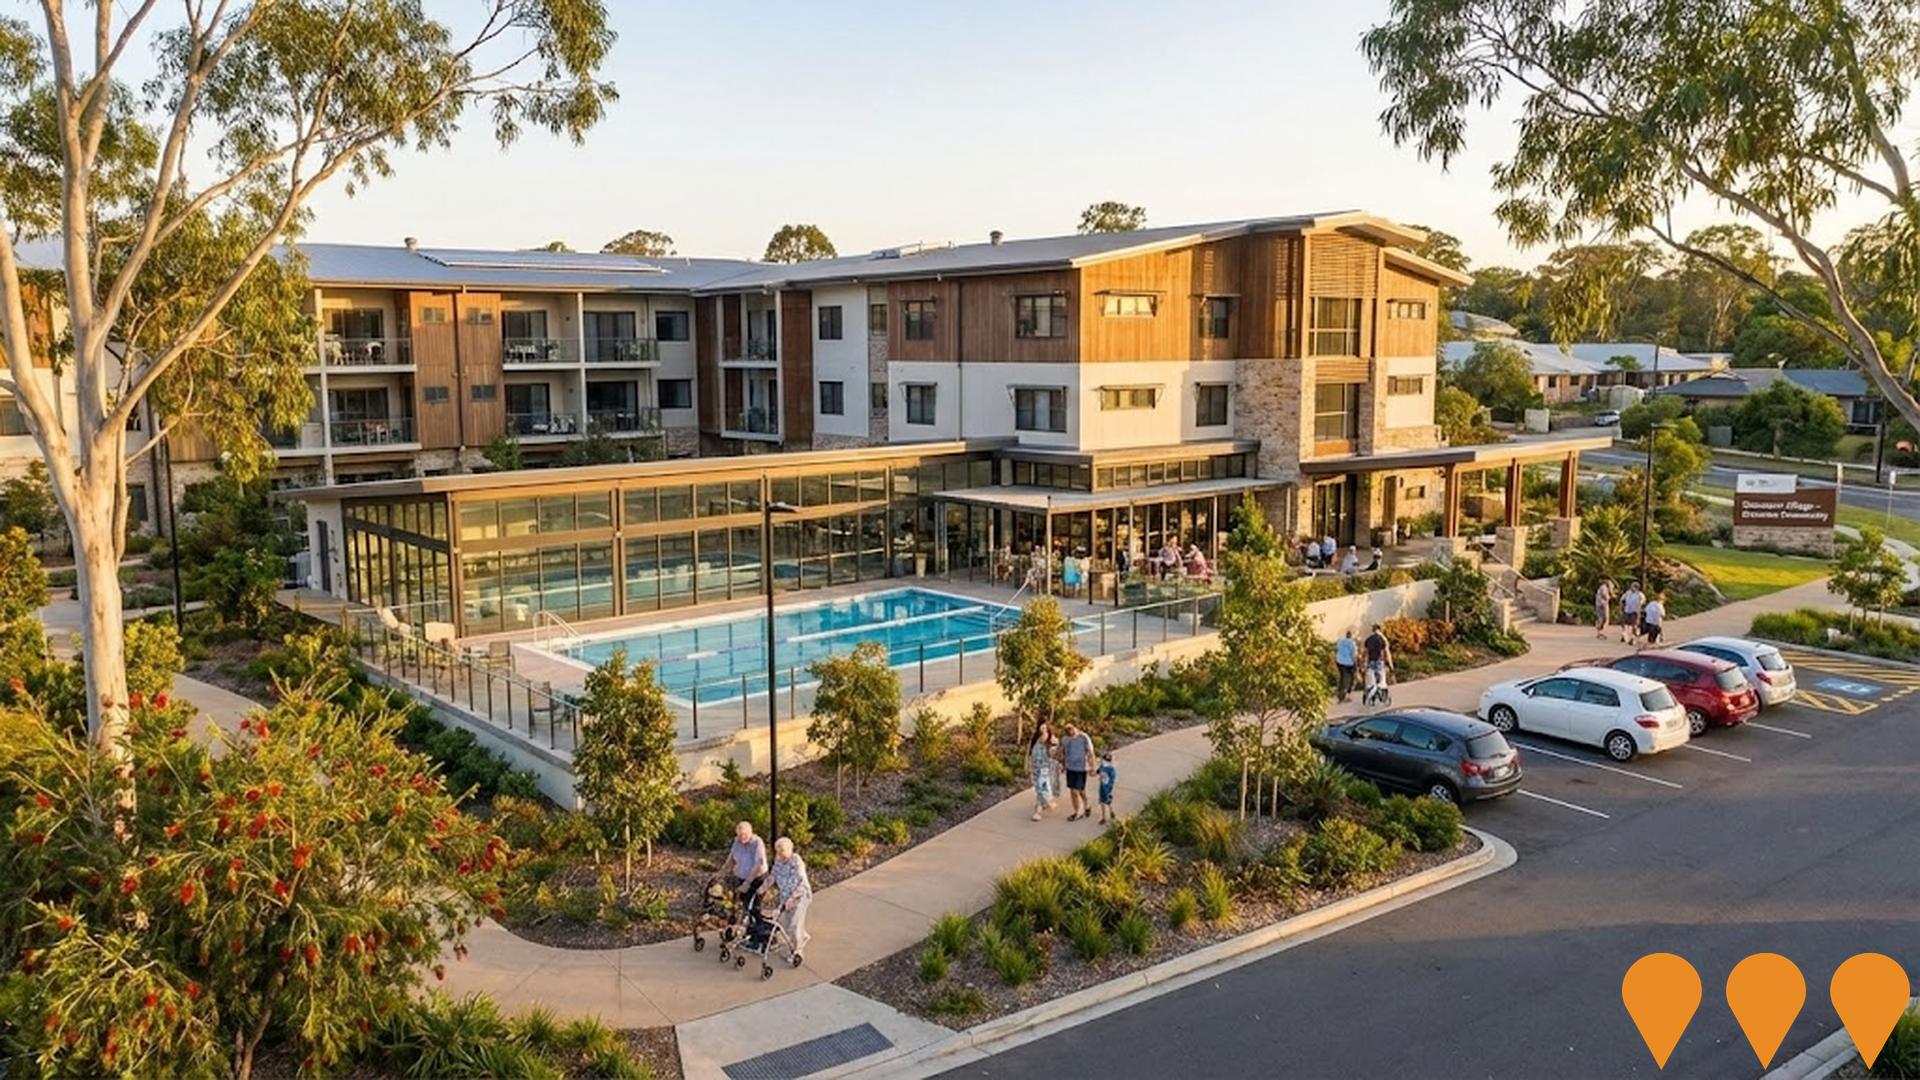
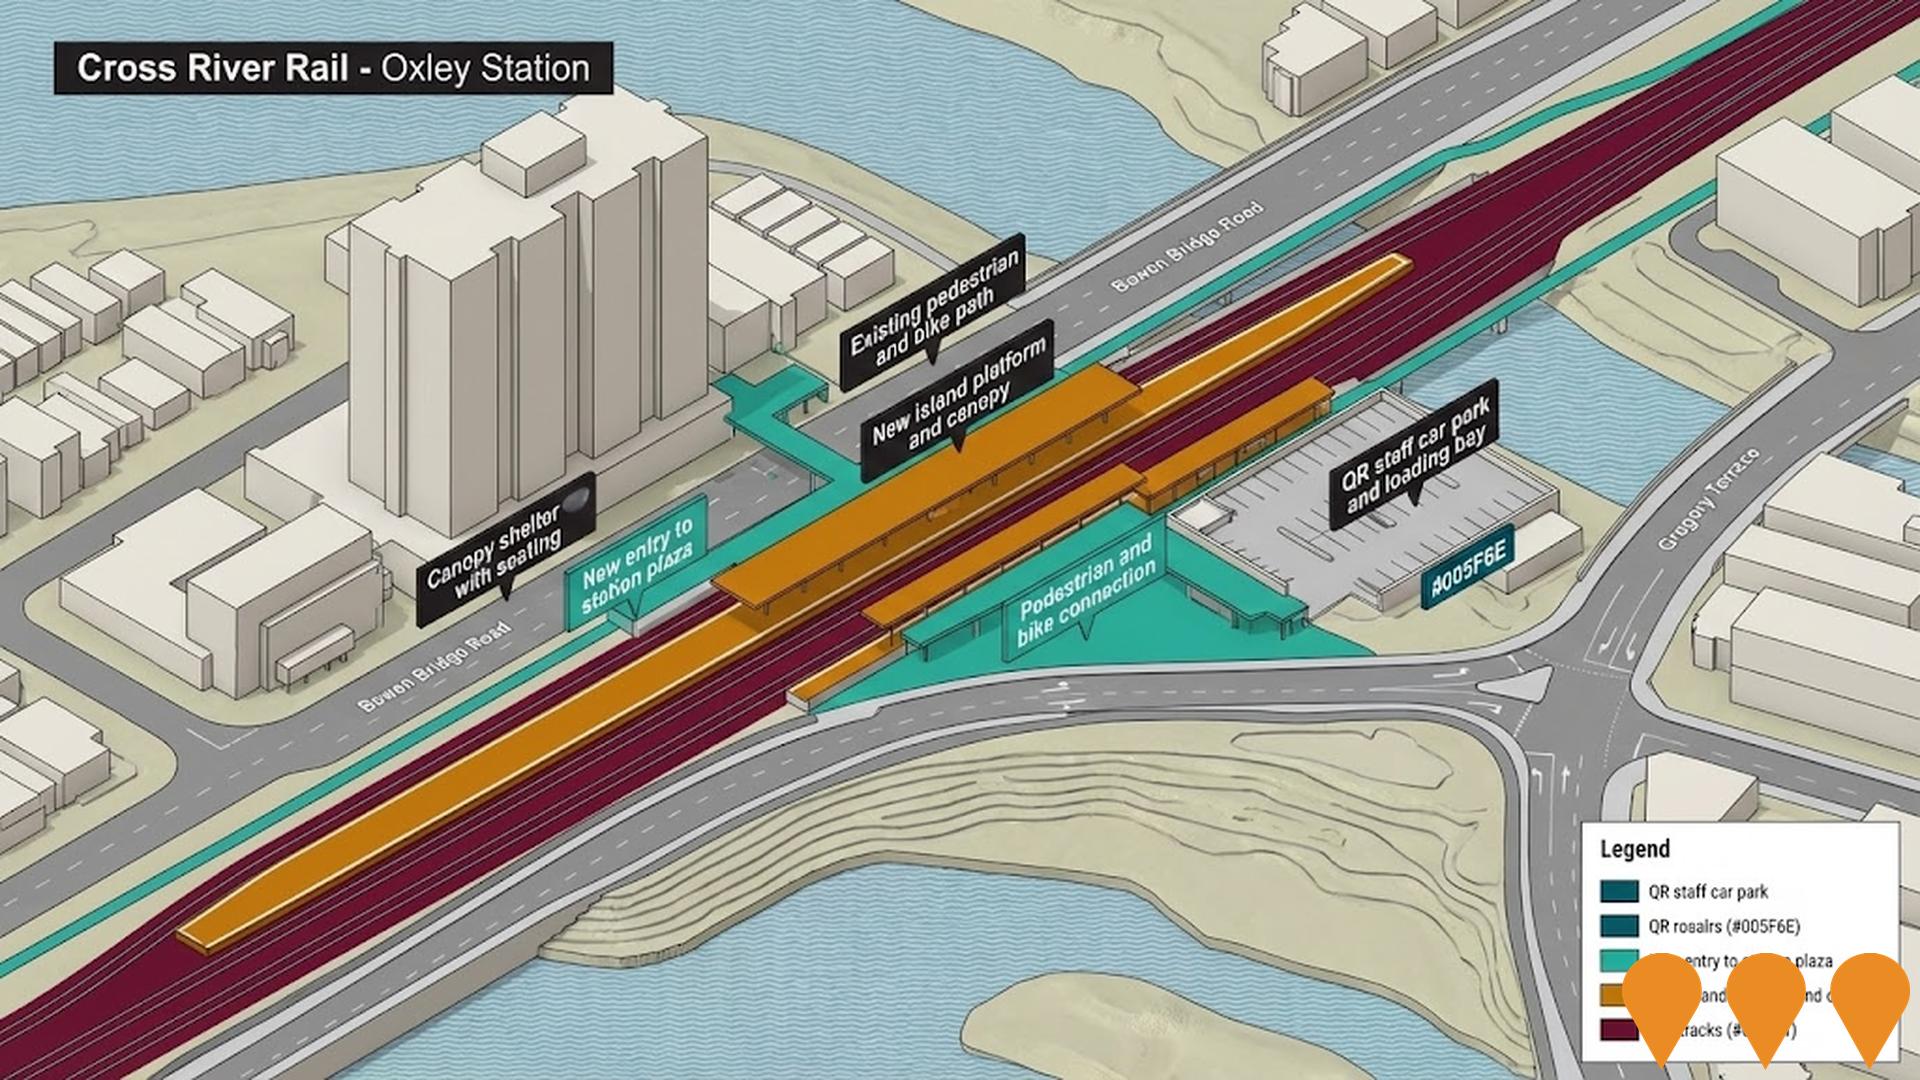
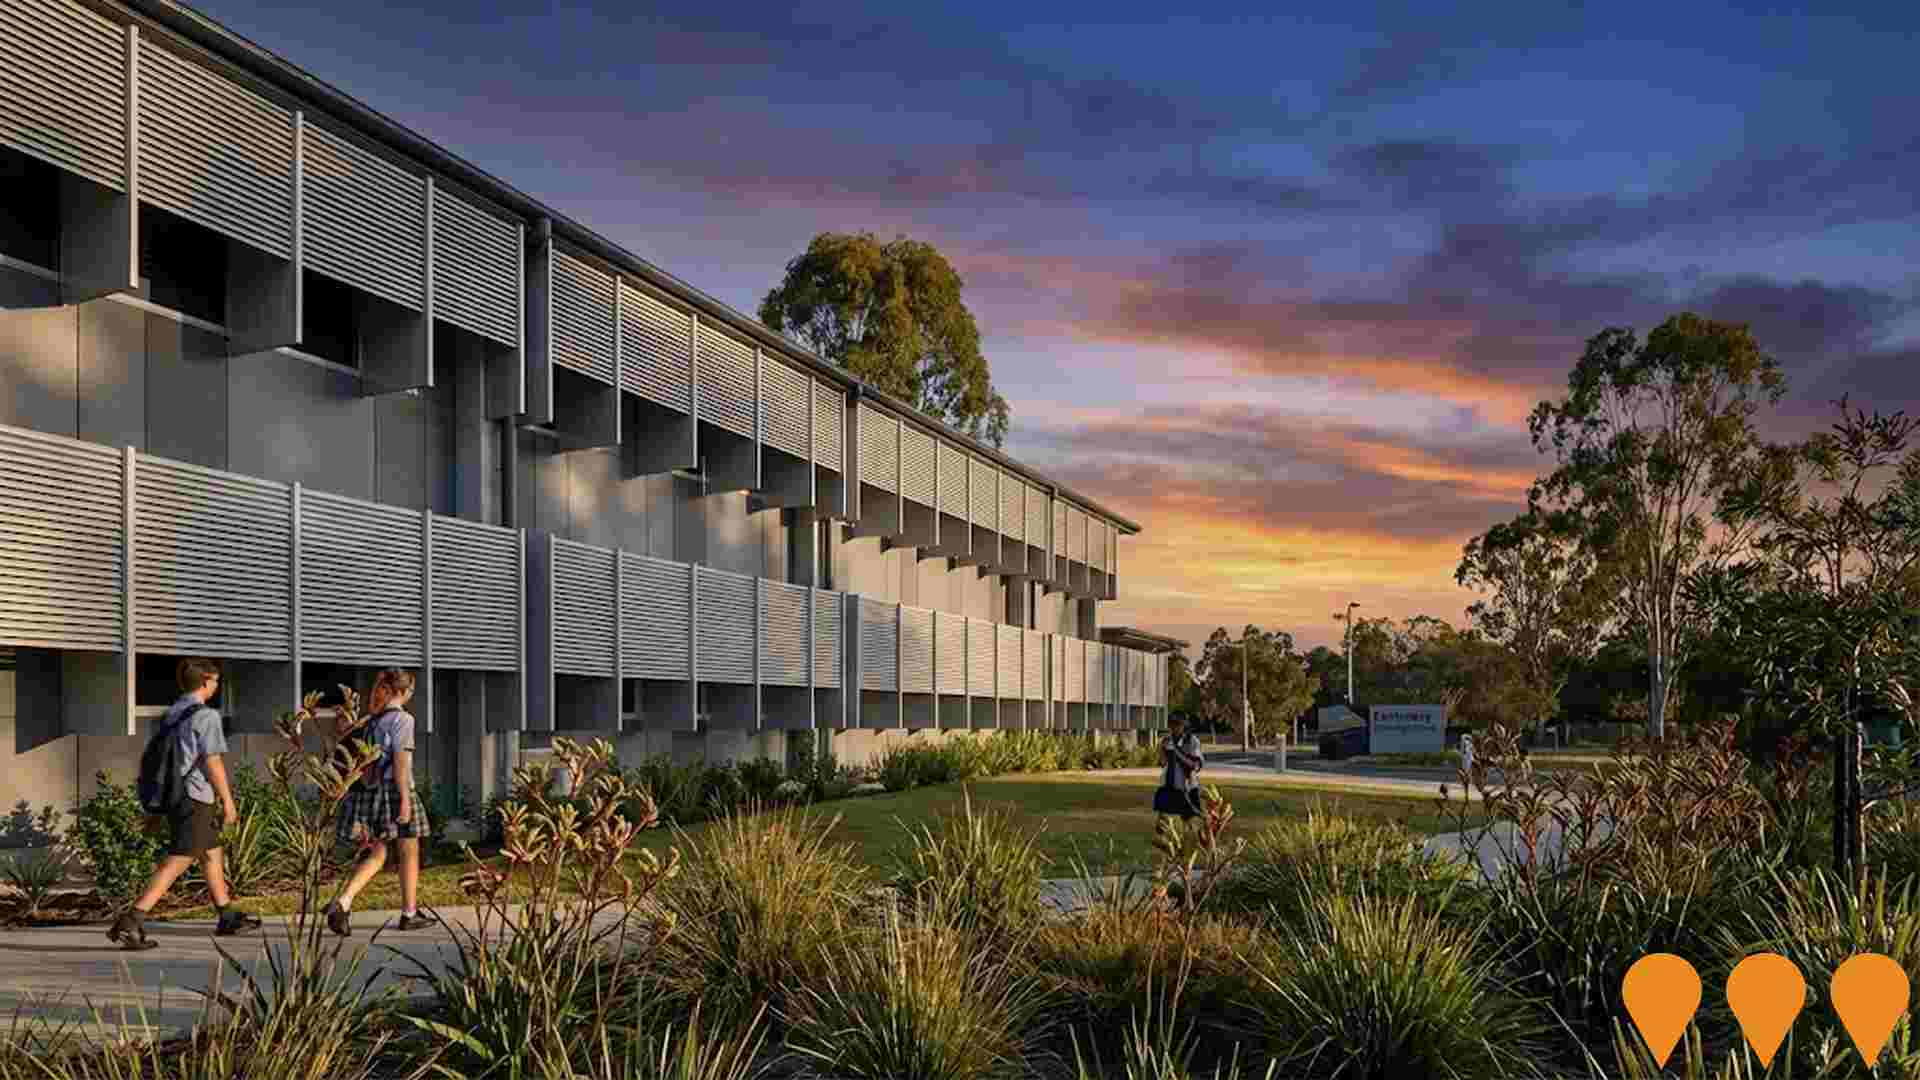
 Denotes AI-based impression for illustrative purposes only, not to be taken as definitive under any circumstances. Please follow links and conduct other investigations from the project's source for actual imagery. Developers and project owners wishing us to use original imagery please Contact Us and we will do so.
Frequently Asked Questions - Infrastructure
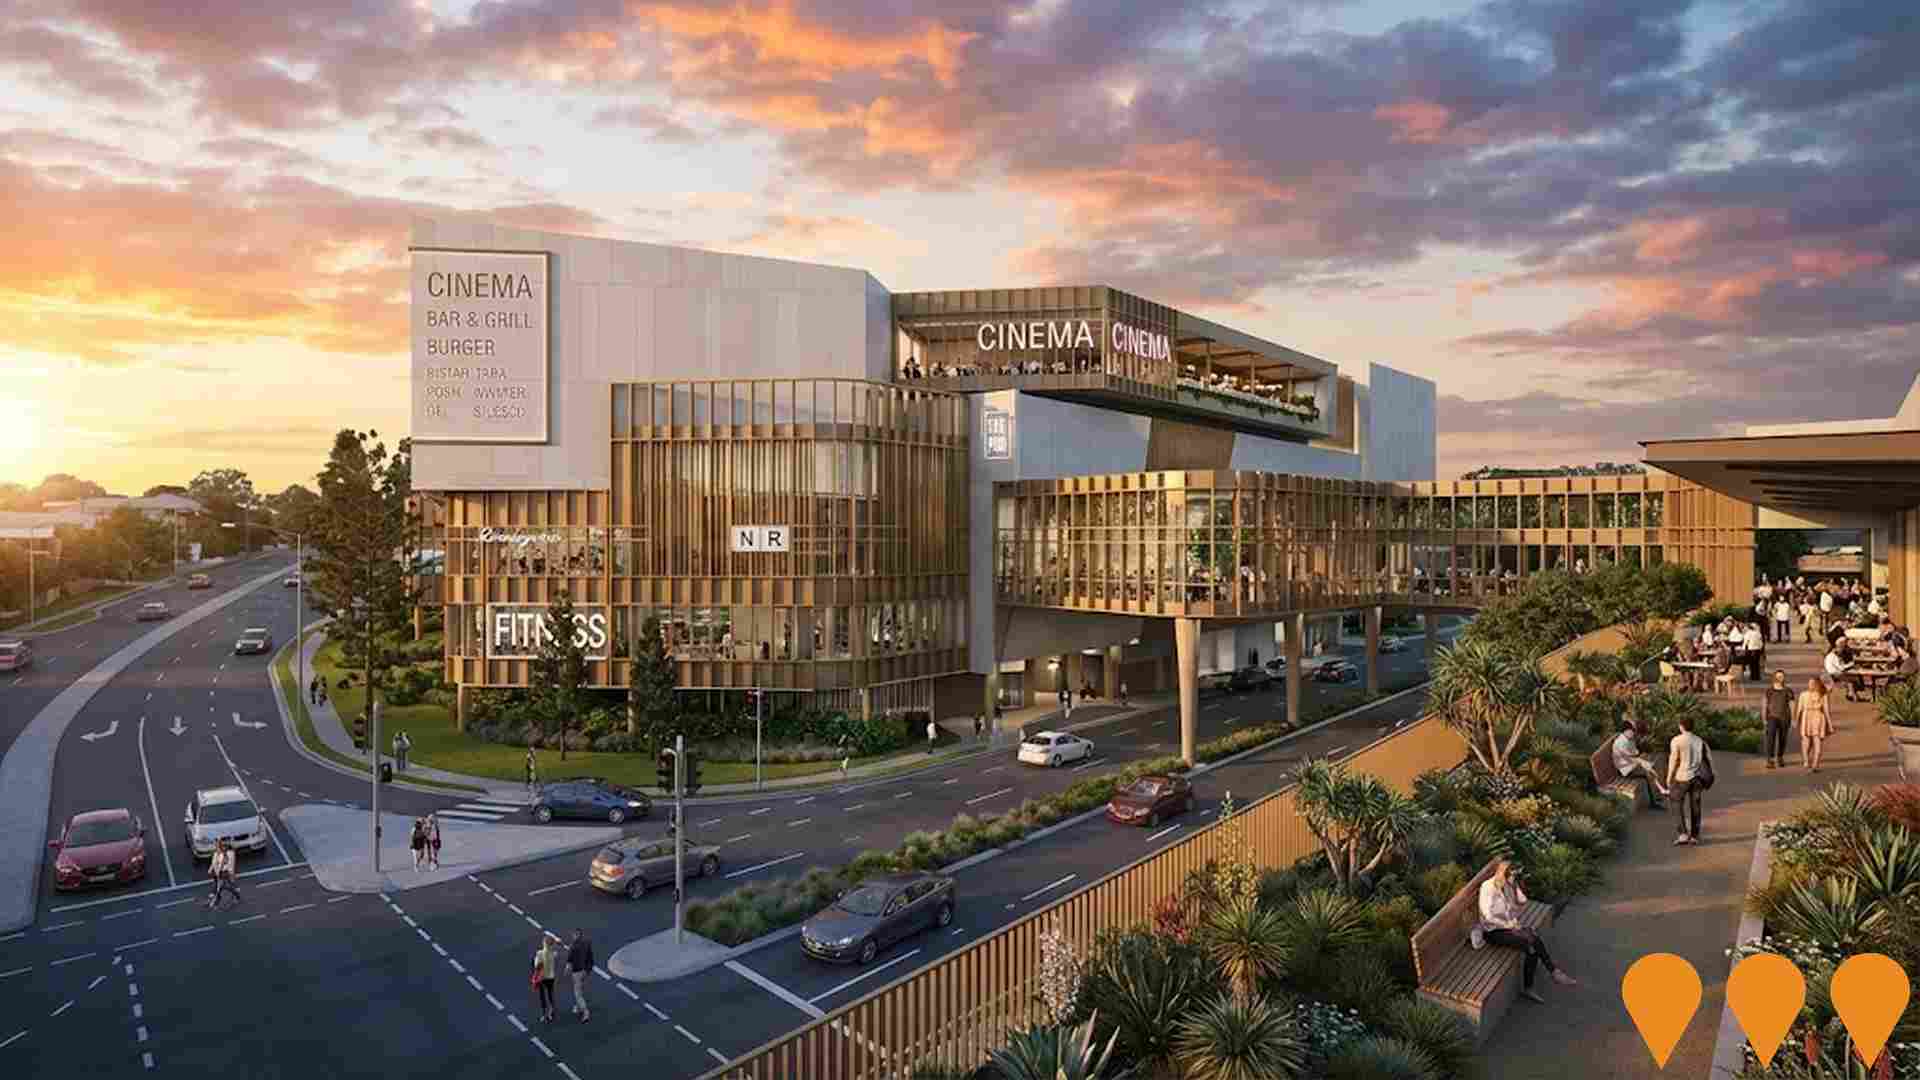
Mt Ommaney Shopping Centre Entertainment Precinct
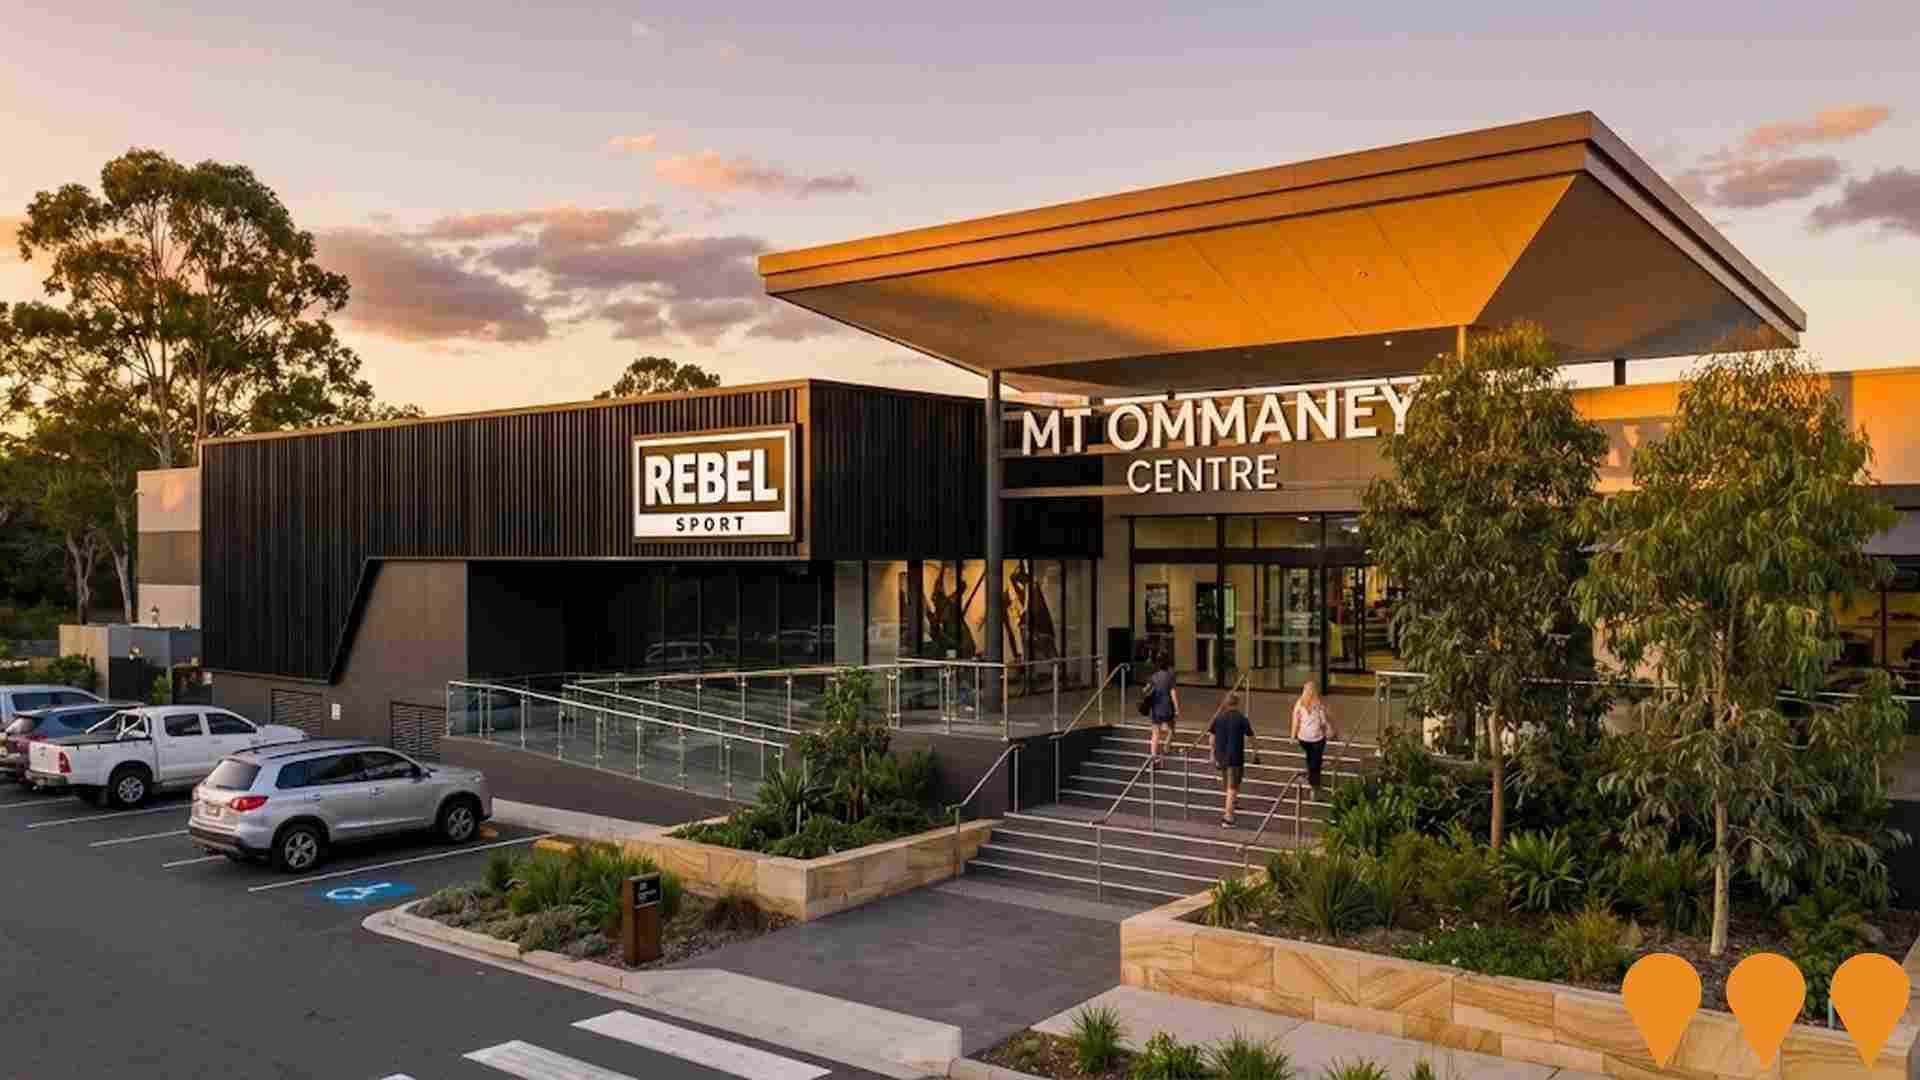
Cinema, dining and entertainment precinct extension to Mt Ommaney Shopping Centre including 6-storey building with cinema, community use and retail tenancies. Features additional gross floor area including multi-screen cinema, gym, dining and entertainment precinct, and rebuilt community centre. Designed by Blight Raynor.
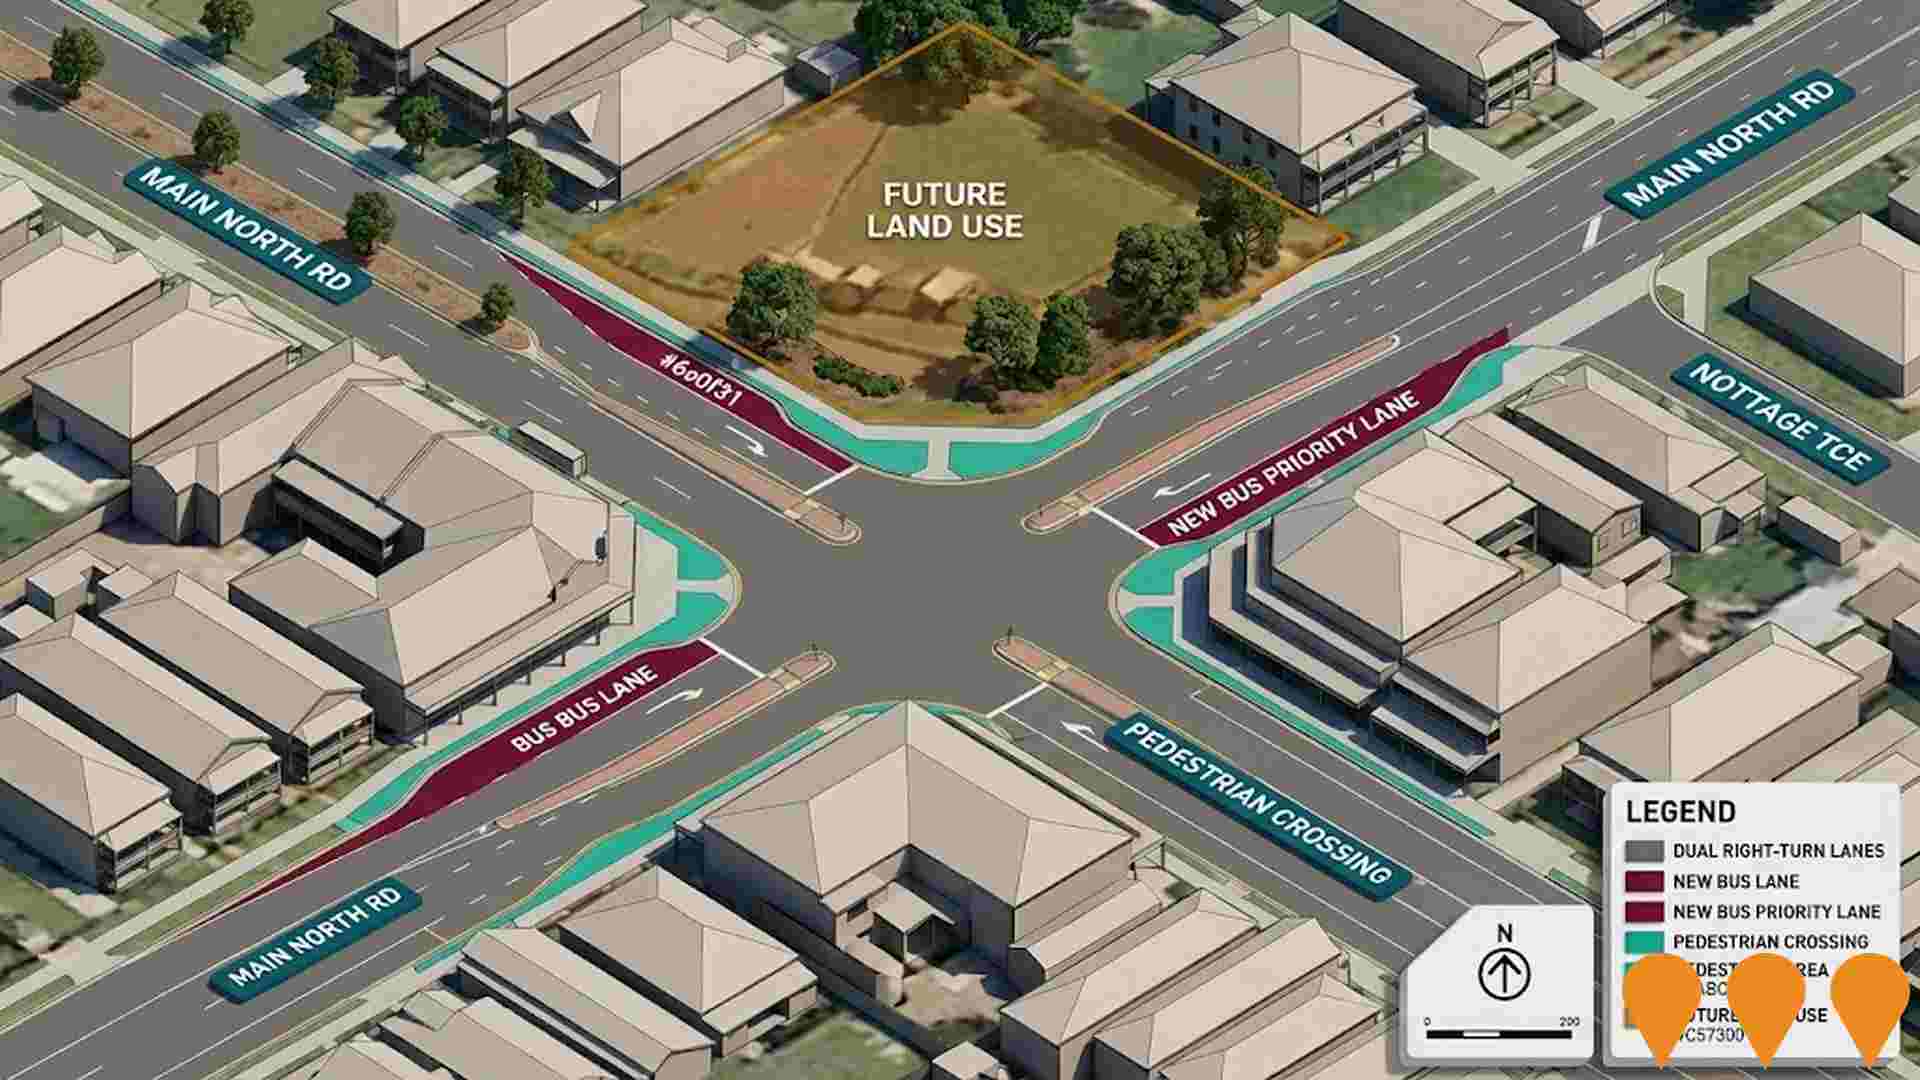
Middle Park Intersection Upgrade (Eumong Street/Riverhills Road)
A $1.7 million project by Brisbane City Council to upgrade the intersection of Eumong Street and Riverhills Road to combat congestion and reduce travel times.
Verandah Estate
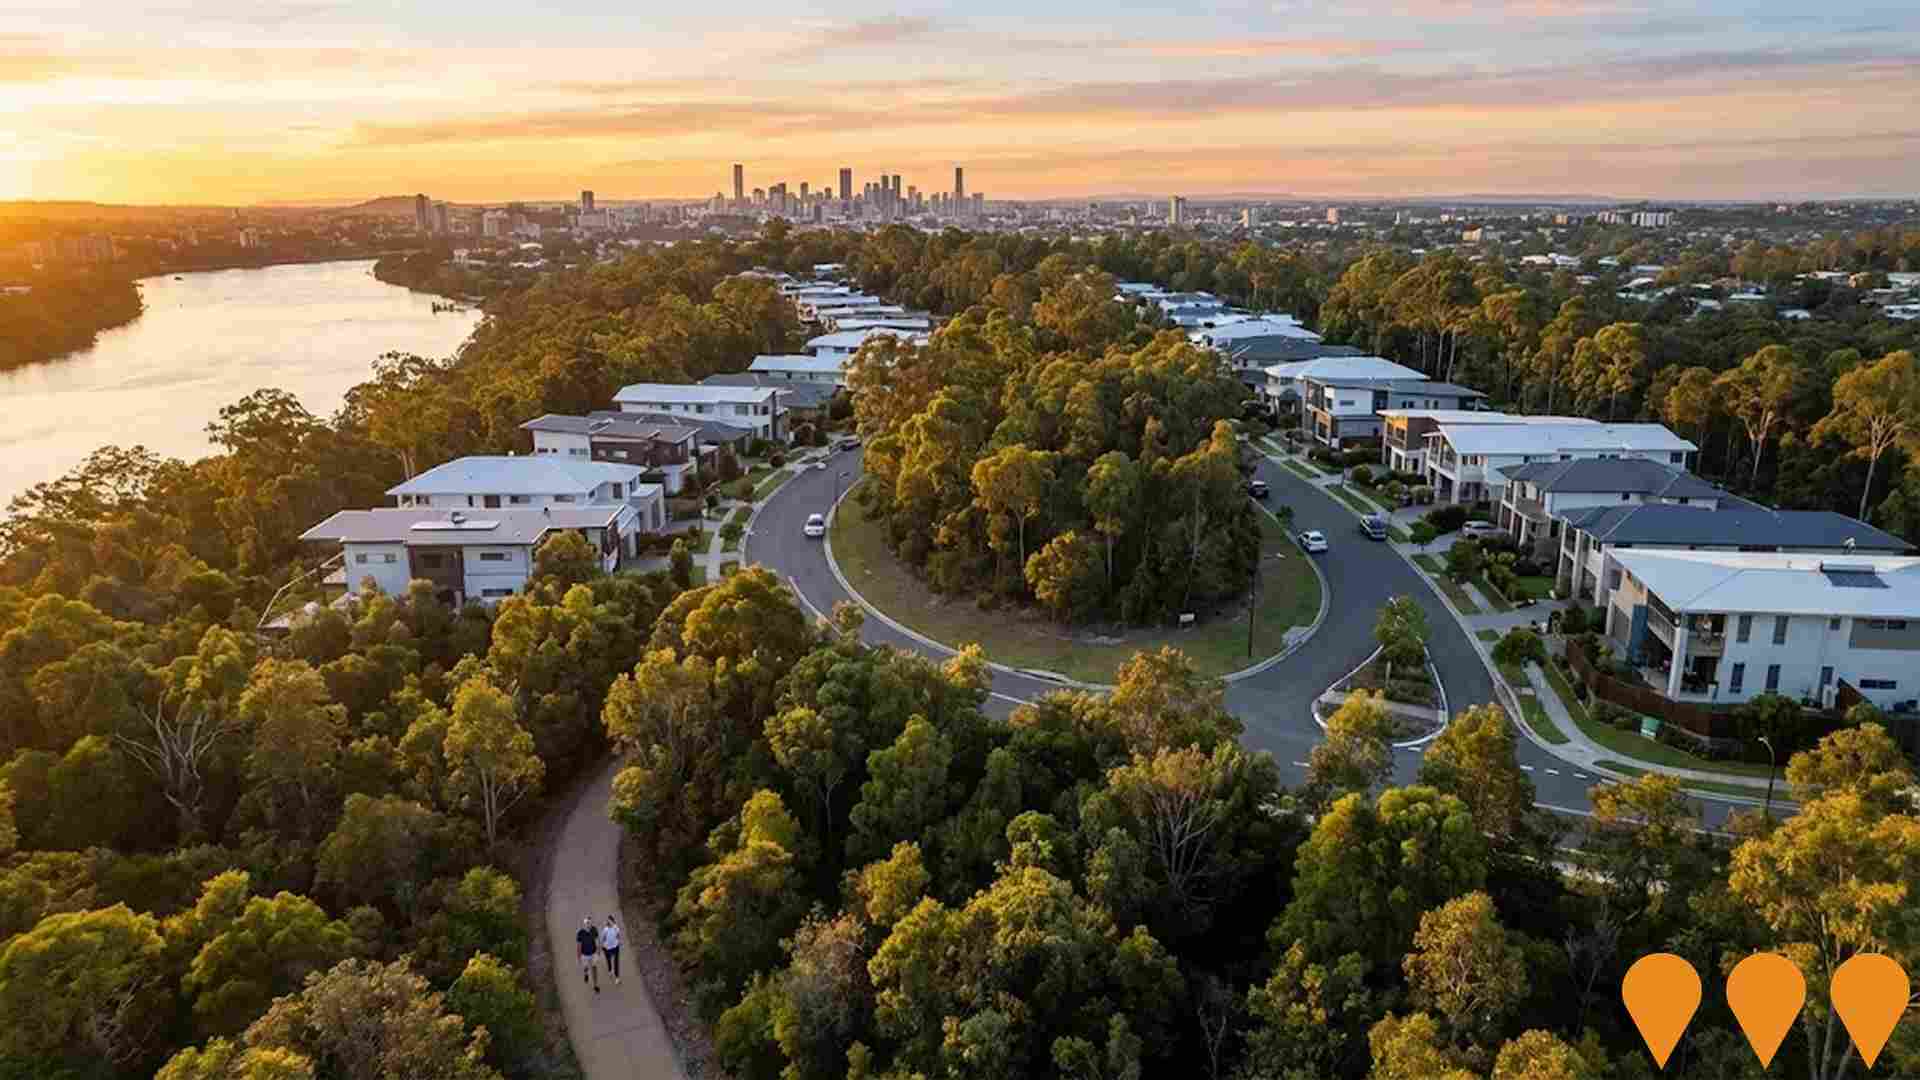
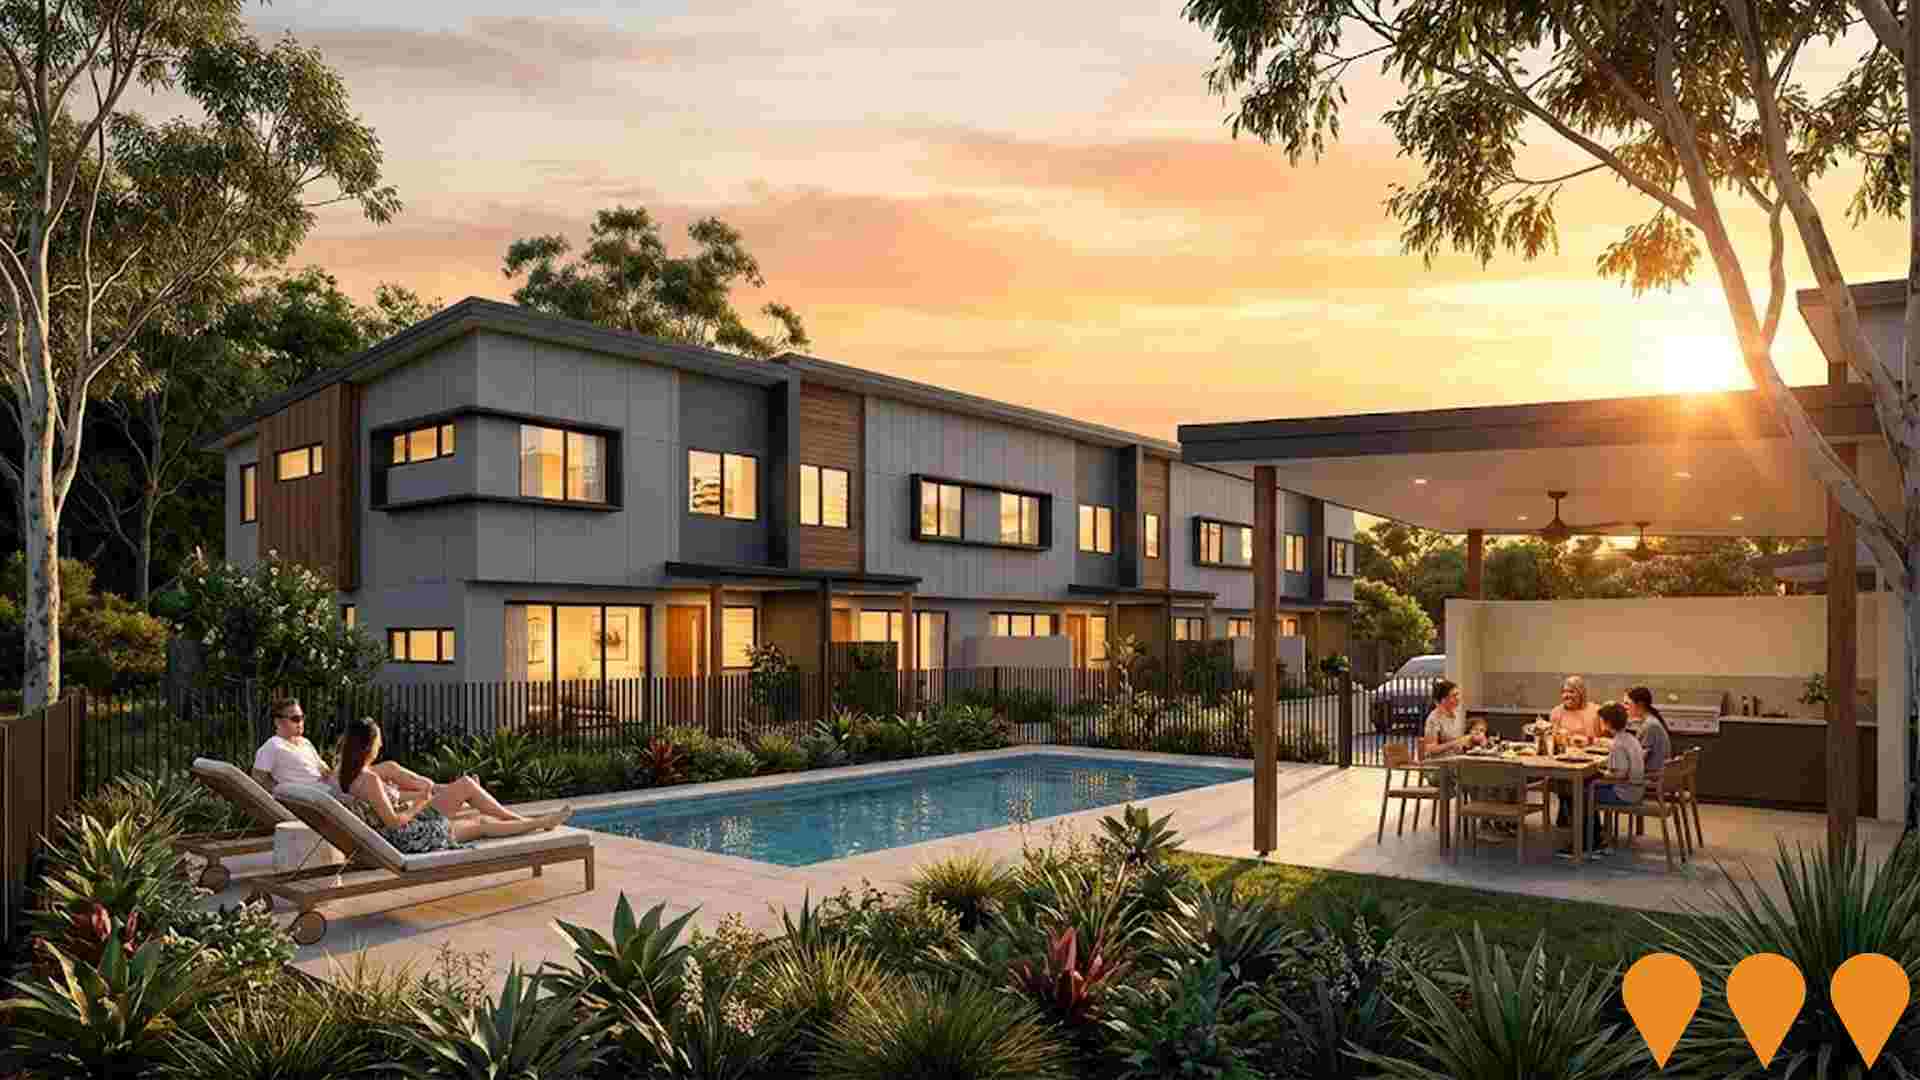
Newest residential estate in Seventeen Mile Rocks featuring contemporary homes on large blocks (875sqm+) surrounded by trees and nature. Estate includes building covenants ensuring homes are designed in harmony with natural environment. Features permanent ridge top reserve and bushwalking tracks to Rocks Riverside Park.
Darra Mixed-Use Commercial
Darra Mixed-Use Commercial is a 56-unit strata industrial and business precinct spread across nine buildings. Delivered by Prekaro Projects, the development provides versatile warehouse, showroom, commercial office, and storage tenancies configured for light industrial and trade services. Construction is actively underway with practical completion anticipated in 2026.

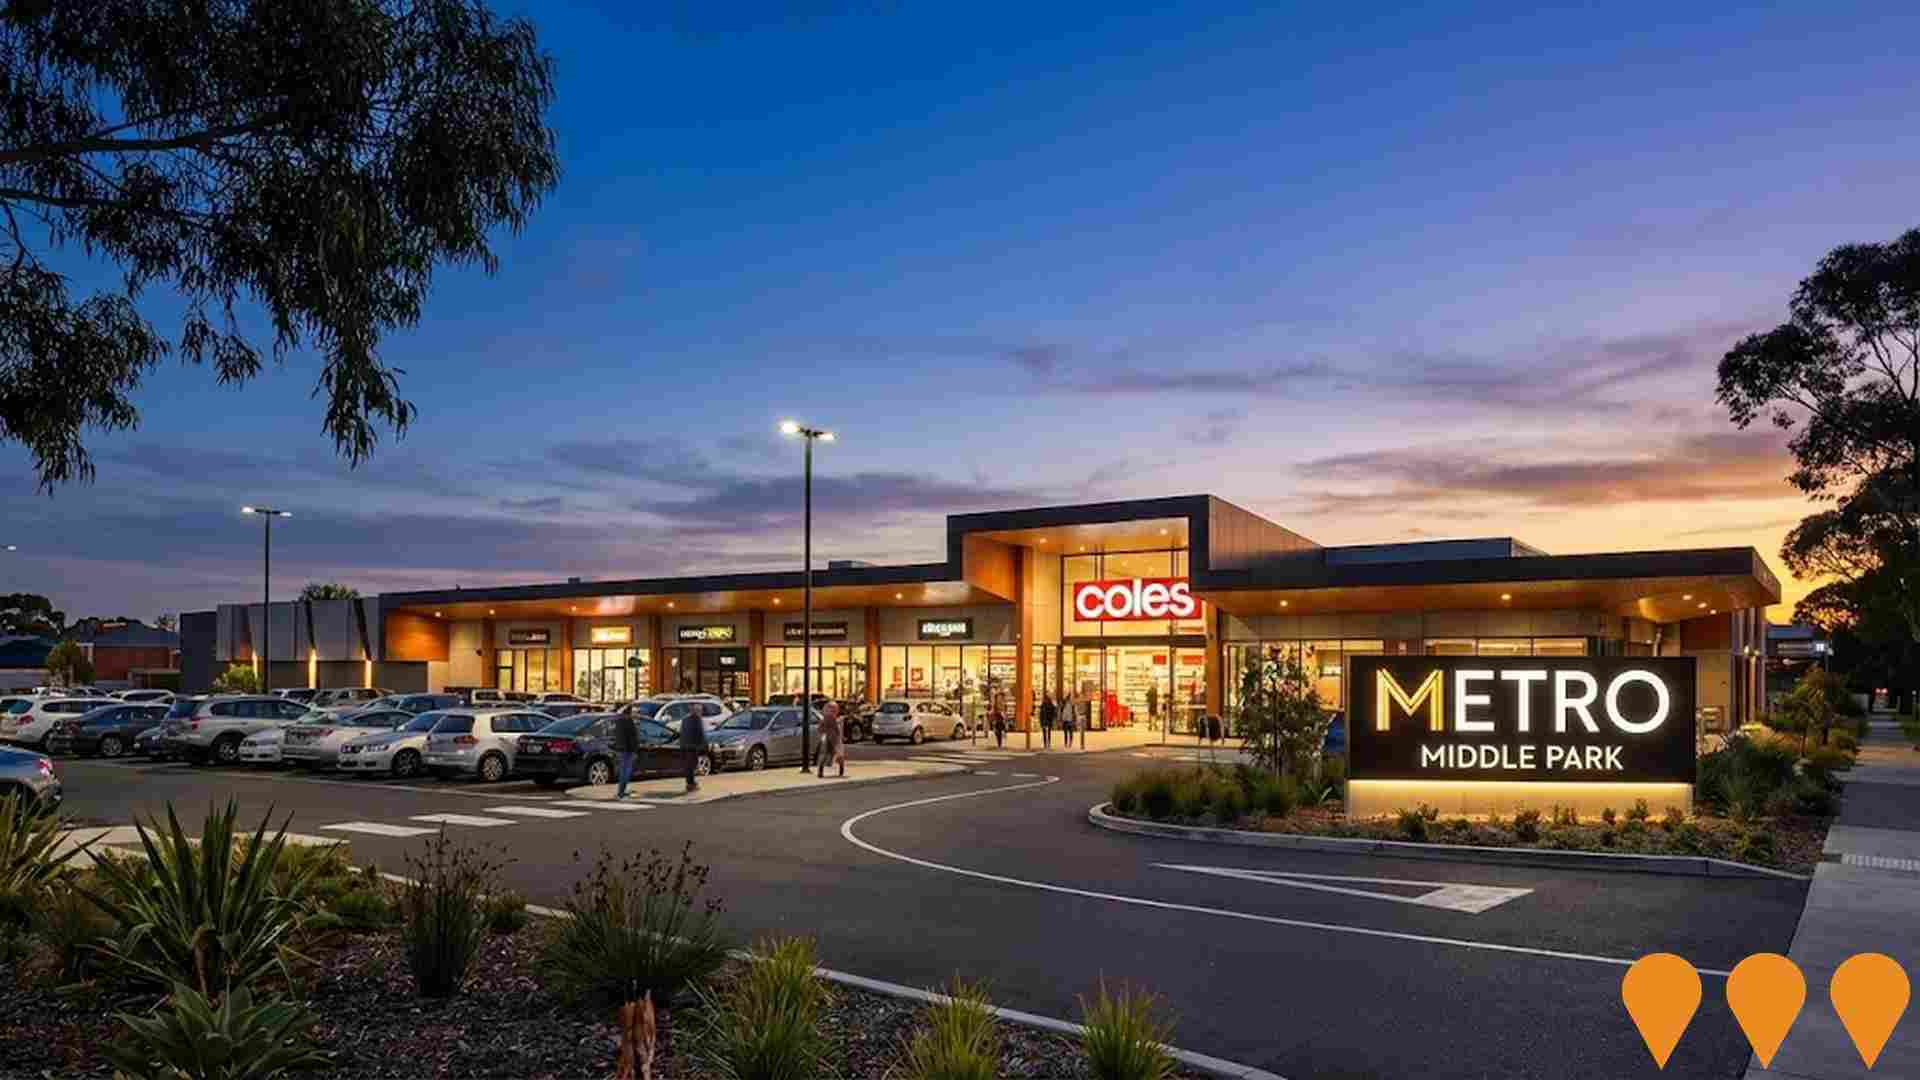
Metro Middle Park Mixed-Use Redevelopment
Acquisition of a 2.1-hectare neighbourhood shopping centre anchored by Coles, with longer-term mixed-use development potential of up to four storeys and future uplift via retail repositioning. The current centre comprises 6,411sqm of gross lettable area with 38 specialty tenancies and 301 parking spaces.
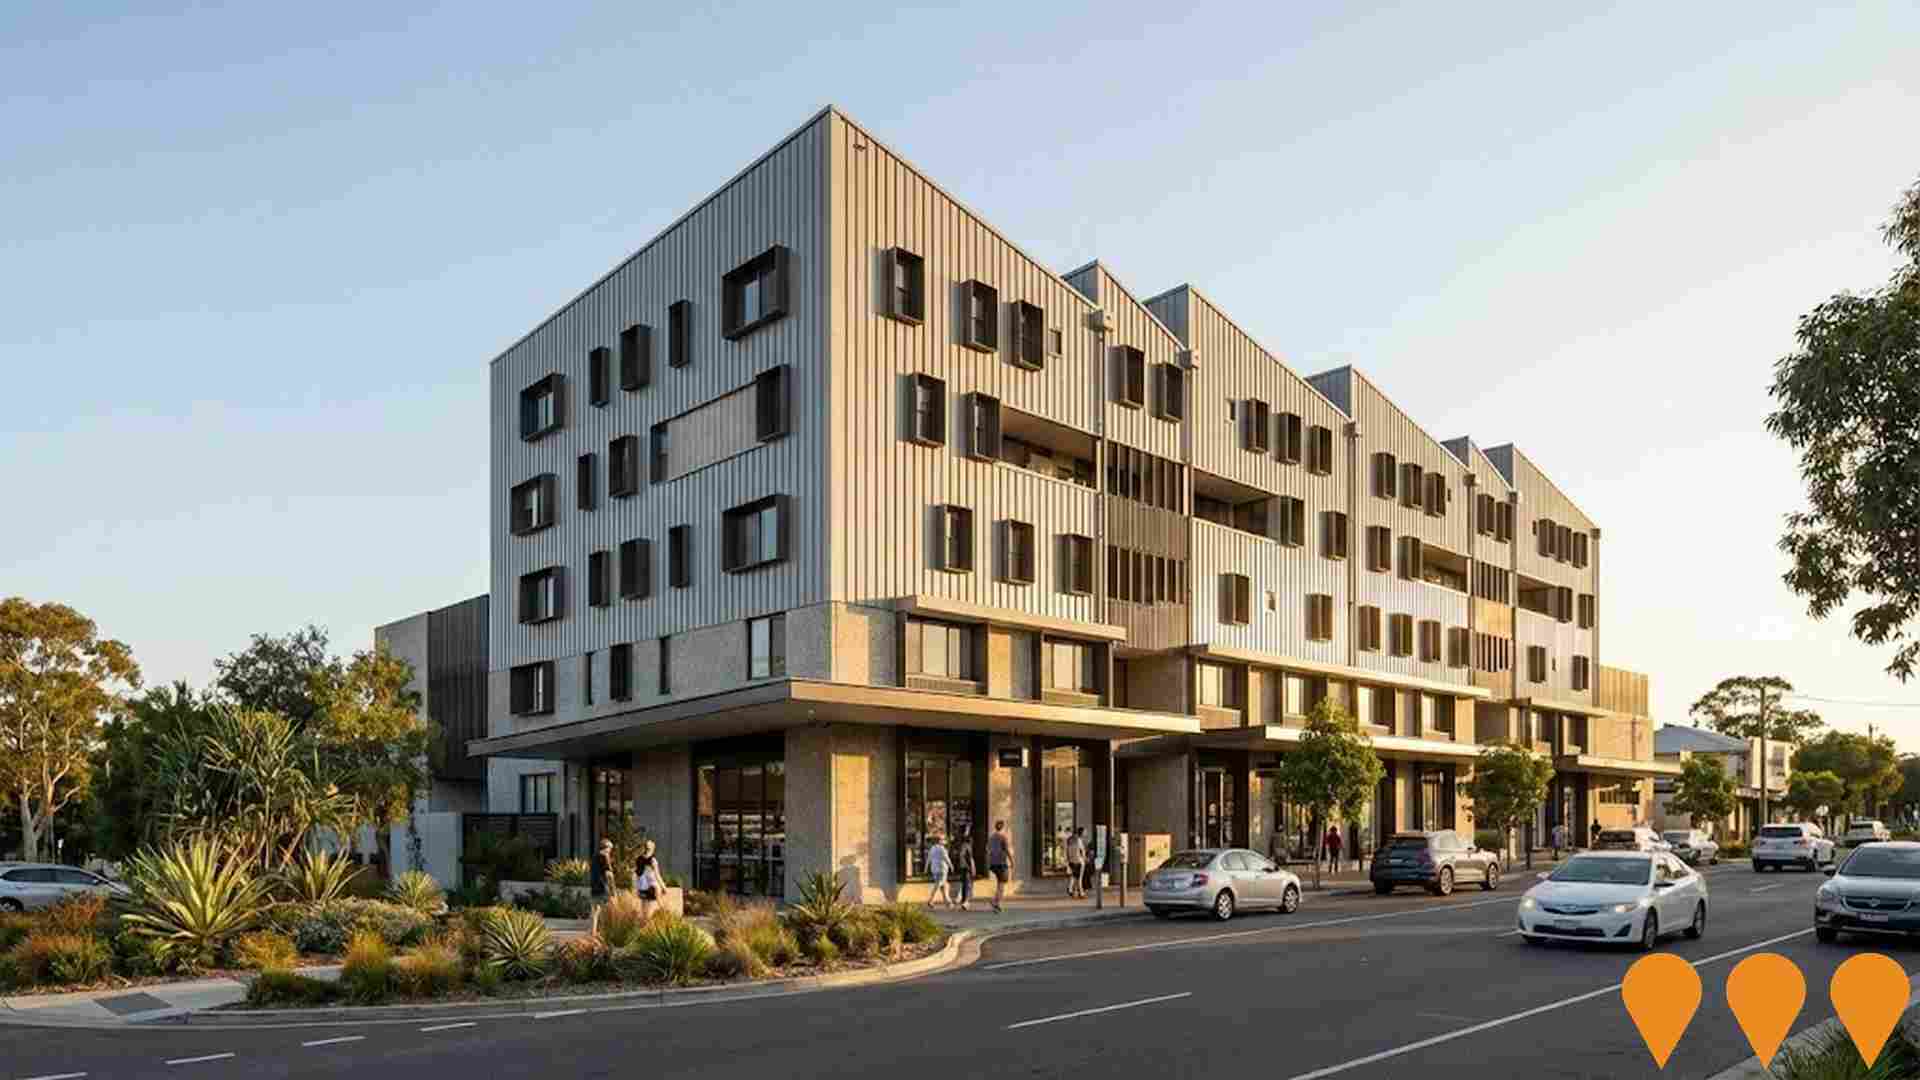
Darra Mixed-Use Development
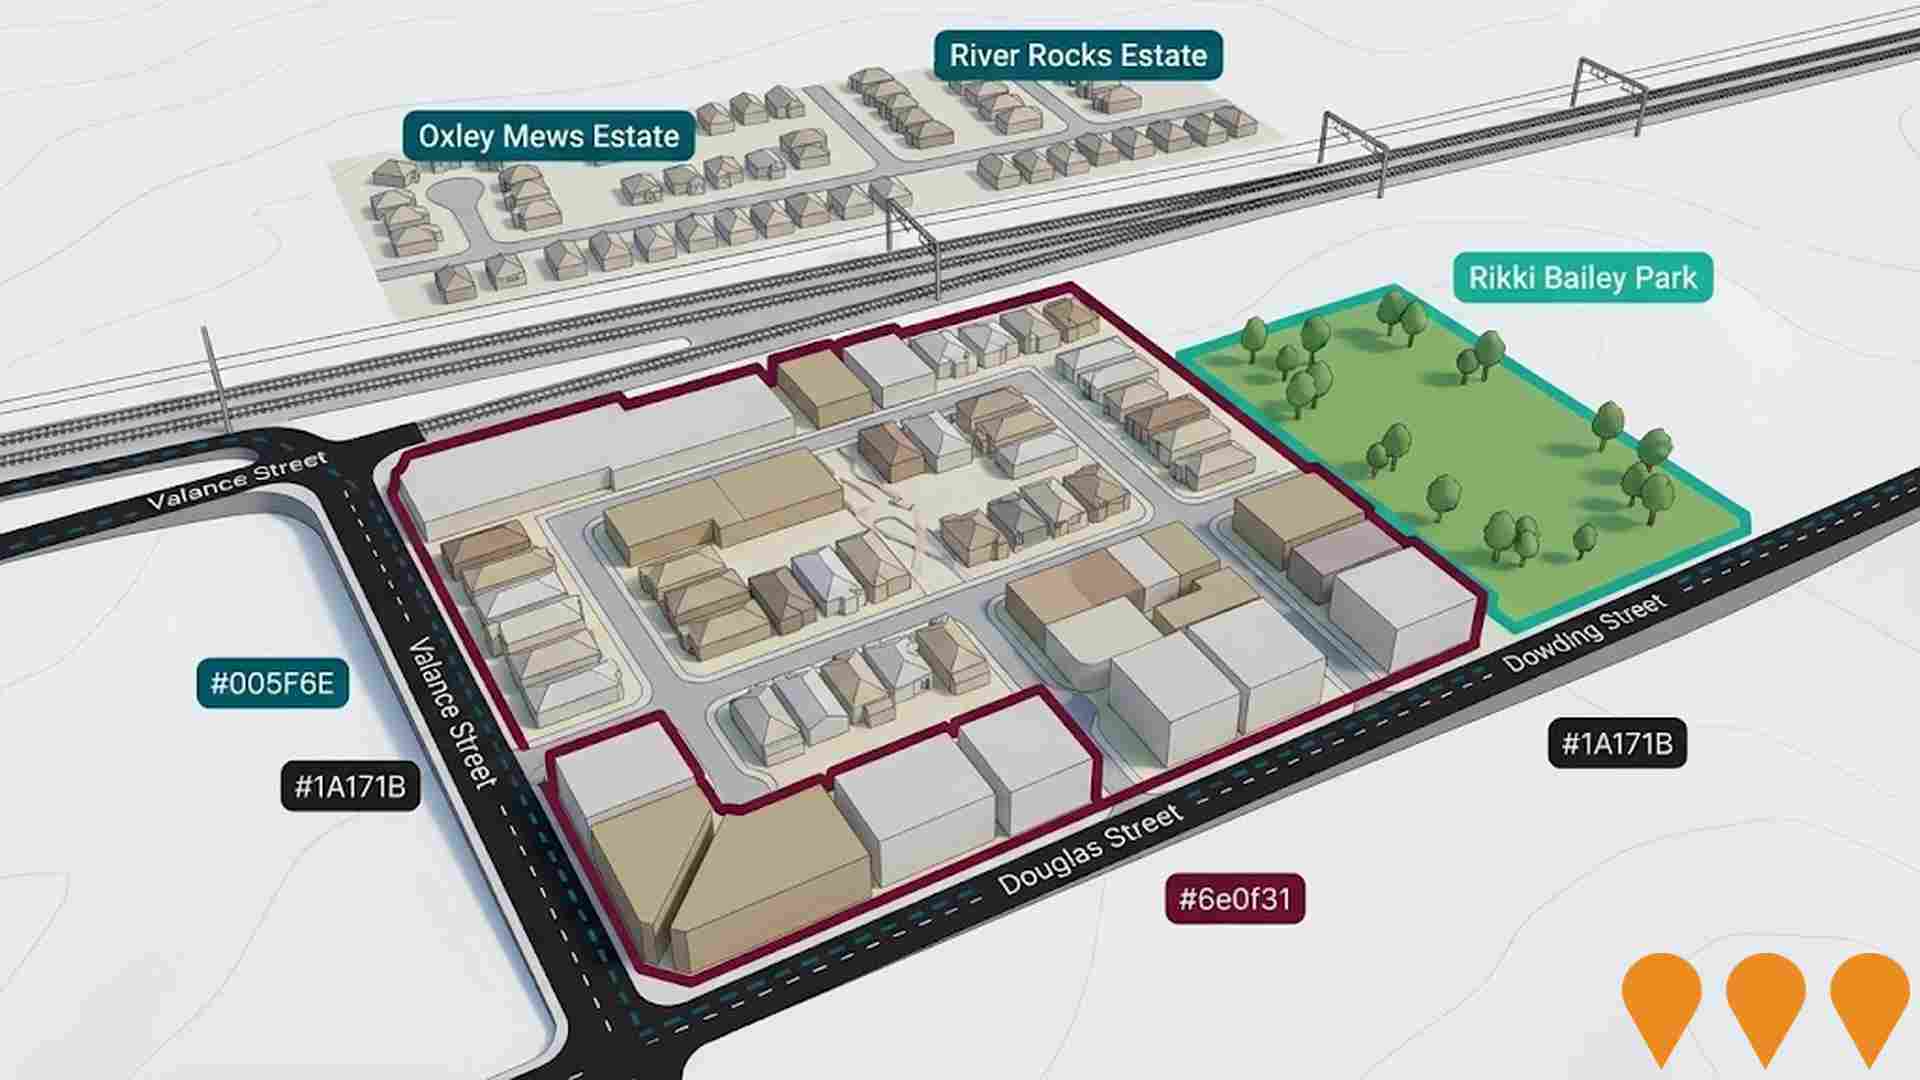
Five-storey mixed-use proposal across two buildings on a 1,707sqm triangular site. Ground floor for eight retail shops, two offices and a food and drink outlet, with caretaker accommodation above select shops. Upper levels include rooming accommodation and 12 residential units with a basement providing about 31 car spaces. Application is in progress with Brisbane City Council (Code assessable, Stage/Decision: Referral).
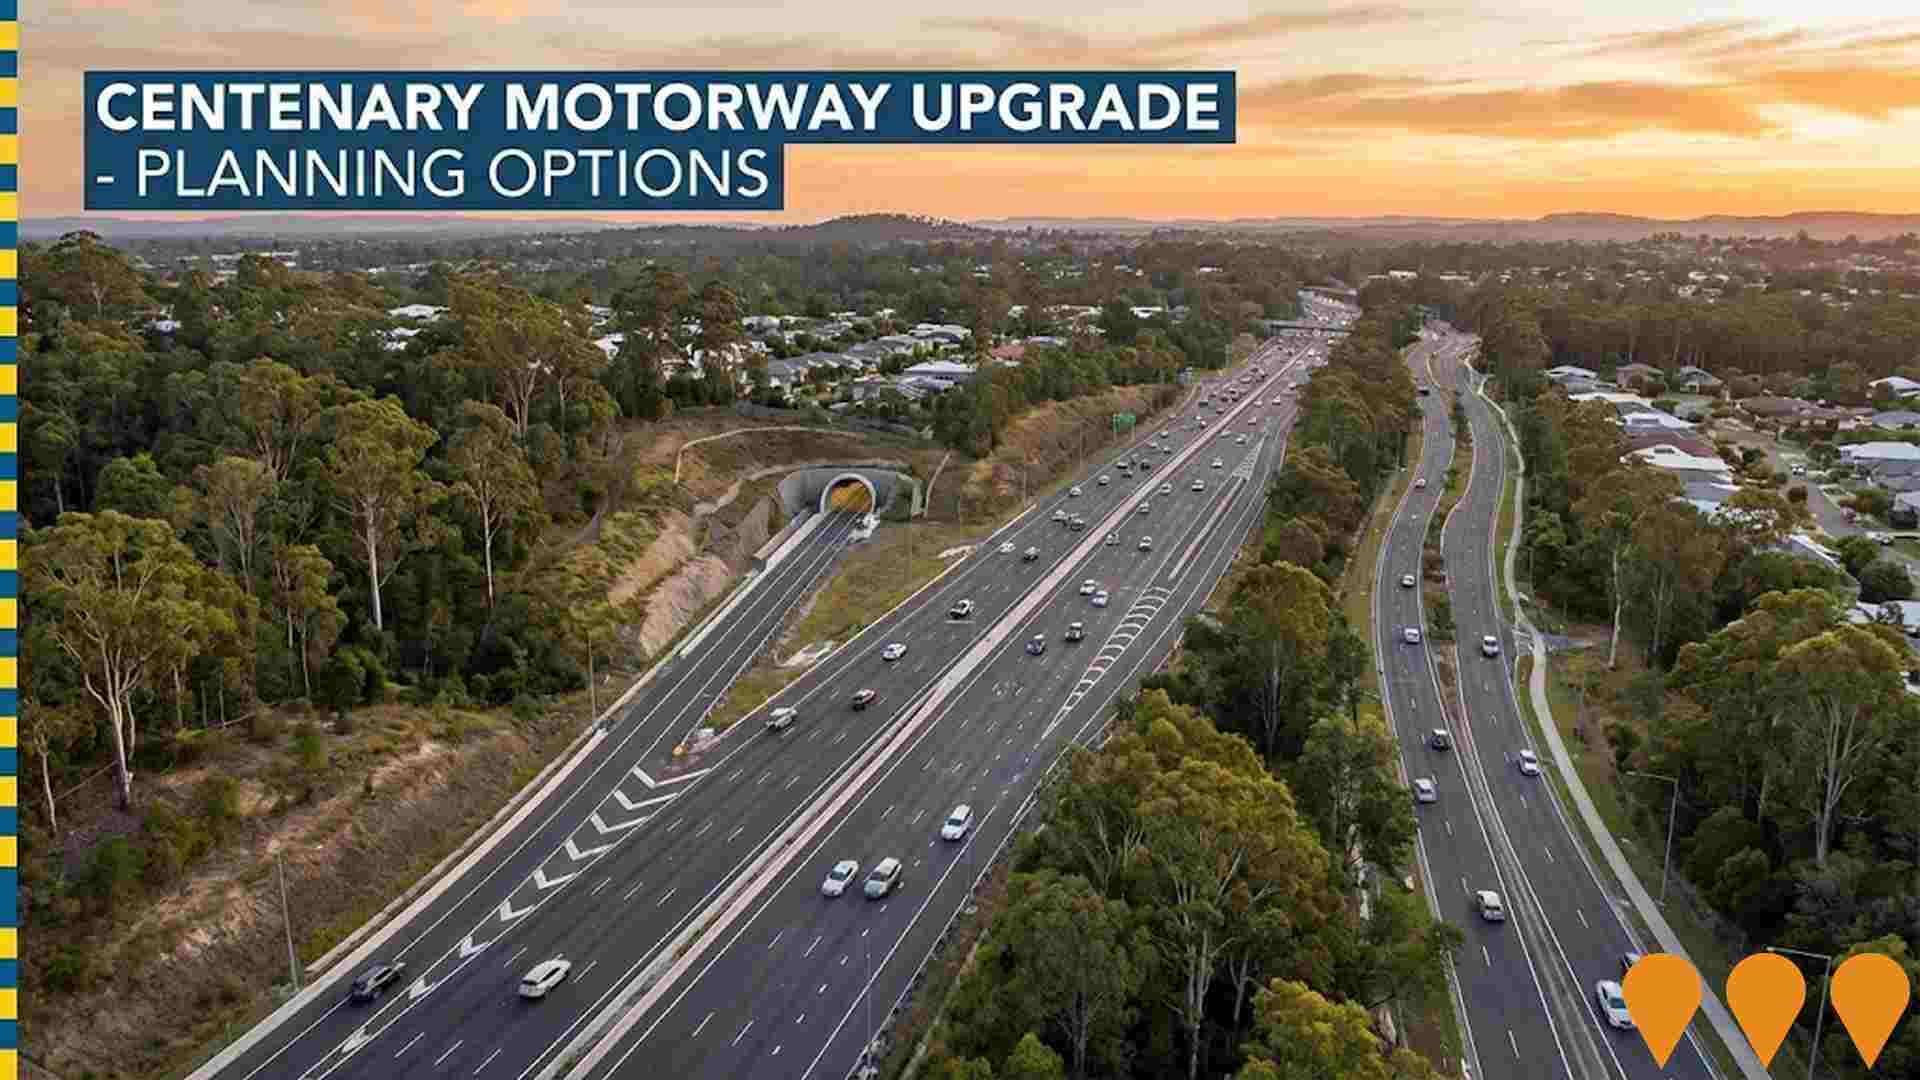
Centenary Motorway Upgrade Planning
The Queensland Department of Transport and Main Roads (TMR) is developing a masterplan for the Centenary Motorway between Darra and Toowong to address heavy congestion. The shortlisted options include a tunnel with surface upgrades or widening the existing motorway and constructing a new arterial road. Community consultation on these options is scheduled for early to mid-2025, with finalisation of the masterplan expected in 2025.
McLeod Country Golf Club Retirement Village
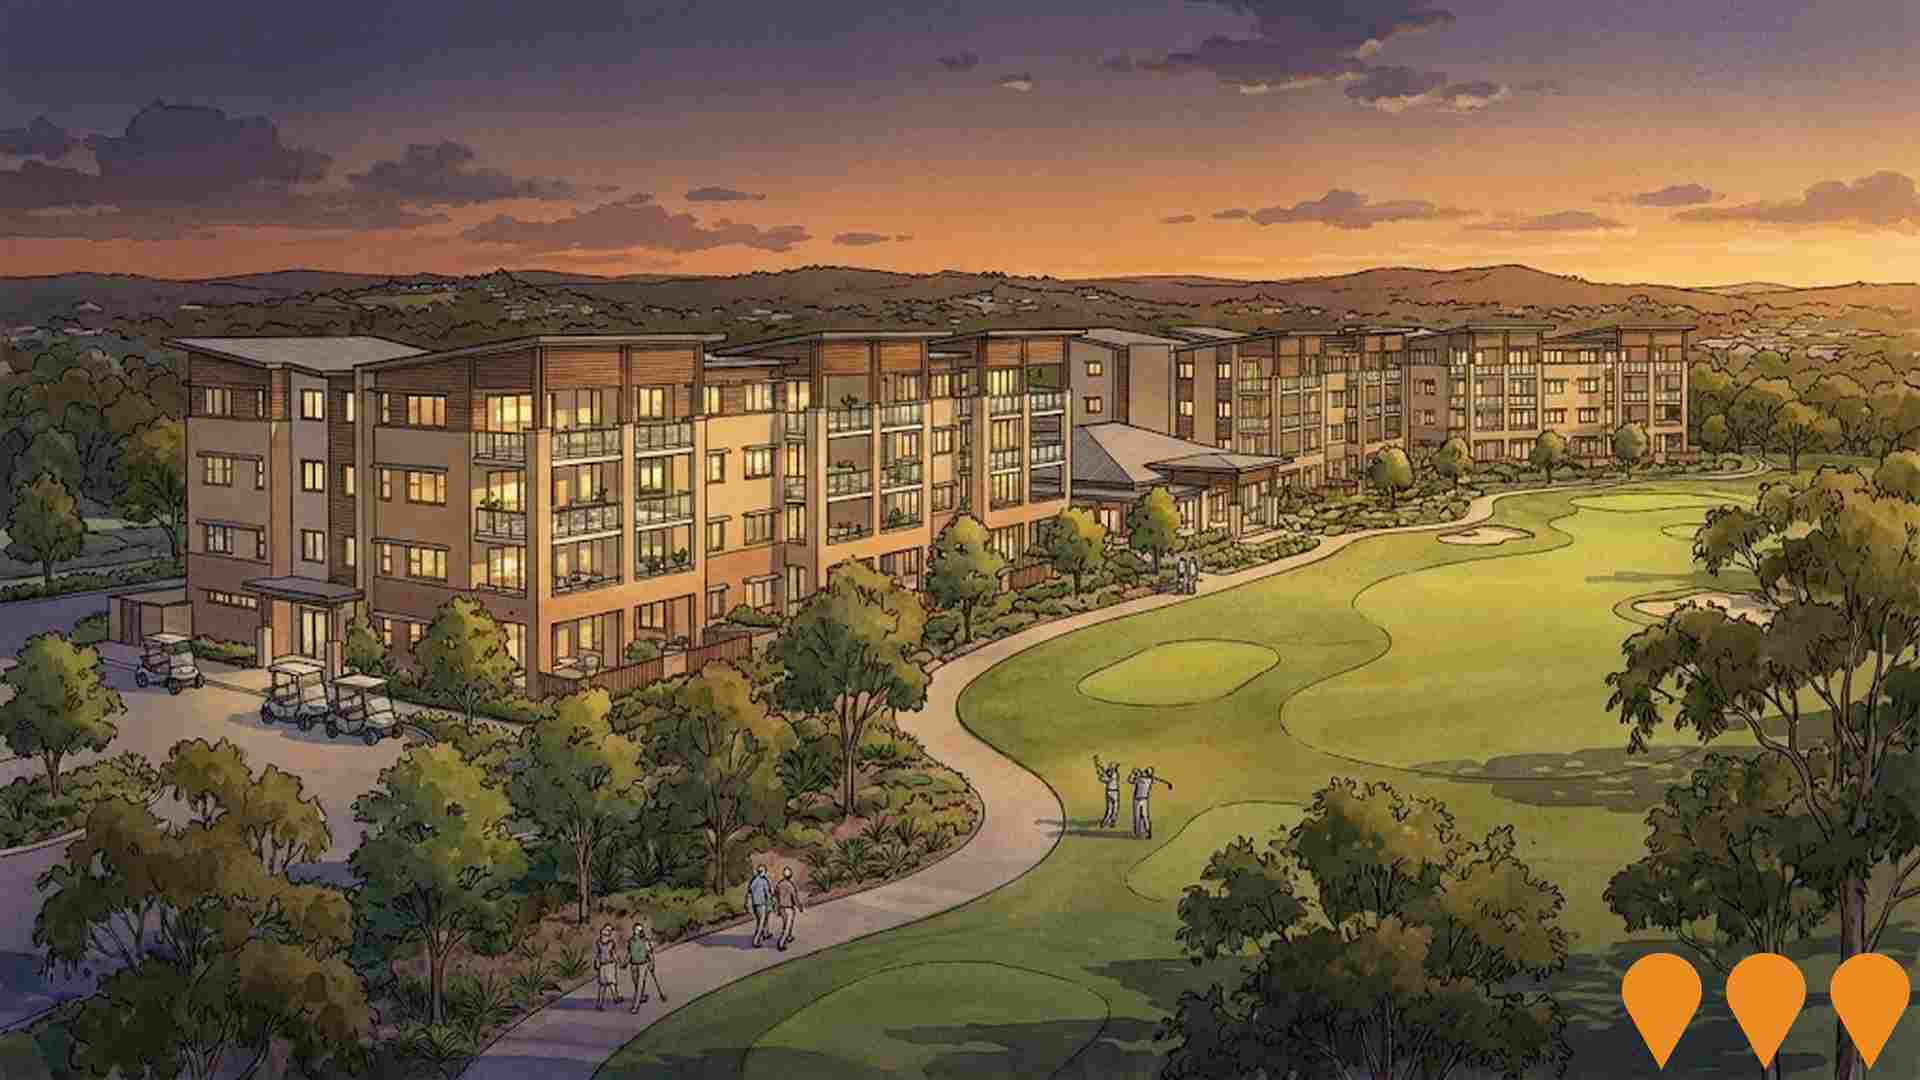
Aura Holdings to develop retirement living project at McLeod Country Golf Club with 126 apartments across four buildings over two stages. Designed to integrate with community, minimizing disruption to club operations.
3,736 residents of Middle Park - Jamboree Heights are employed, from a labour force of 3,934. Unemployment sits at 5.0%, with participation at 65.1%. Weighted for its industry mix, the area's sectors are forecast to grow about 6.7% nationally over five years. That reflects industry composition only and makes no allowance for local population growth. The working-day population is estimated at 6,077, about 82% of the resident population, so more people leave the area for work than travel in. Unemployment and labour force come from ABS Small Area Labour Markets, updated quarterly; the industry and occupation profile is from the 2021 Census.
Detail
The local labour market in Middle Park - Jamboree Heights is characterized by an educated workforce and strong engagement in professional services, alongside a 5.0% unemployment rate. As of March 2026, employed residents total 3,736, while the jobless rate sits 0.7% above Greater Brisbane's rate of 4.3%. Labour force participation is somewhat subdued at 65.1% compared to Greater Brisbane's 70.1%. According to Census records, 23.2% of workers carried out their duties from home, though this figure reflects prevailing Covid-19 lockdown circumstances. Resident employment is primarily clustered within health care & social assistance, education & training, and professional & technical fields.
The community exhibits a notable concentration in education & training, where local employment share reaches 1.3 times the regional level. Conversely, construction engages only 7.4% of the resident workforce, trailing Greater Brisbane's 9.0%. Comparing local Census workplace numbers against total resident workers highlights that local employment generation within this primarily residential enclave remains relatively limited. An examination of SALM and ABS statistics by AreaSearch shows that over the 12-month period, the local labour force shrank by 2.4% while total employment dropped by 2.7%, pushing the unemployment rate up by 0.3 percentage points. Over the same timeframe, Greater Brisbane recorded a 3.2% increase in employment and a 3.4% rise in labour force, with unemployment ticking up 0.1 percentage points. Looking ahead, national forecasts published in Mar-26 by Jobs and Skills Australia provide perspective on future employment demand across Middle Park - Jamboree Heights over five and ten-year periods. Nationally, employment is anticipated to grow by 6.6% over five years and 13.7% over ten years, though trajectories diverge by sector. Applying these industry projections against the employment composition of Middle Park - Jamboree Heights projects local job growth of 6.7% over five years and 13.8% over ten years, calculated via proportional industry weighting without factoring in local population adjustments.
Frequently Asked Questions - Employment
Median household income in Middle Park - Jamboree Heights is $2,141 a week (about $111,000 a year), with median personal income at $872 a week. ATO records put median taxable income at $58,095 a year against an average of $71,148. Household income is from the 2021 Census; taxable income is from ATO Taxation Statistics for the latest financial year available, indexed forward using the ABS Wage Price Index.
Detail
Data from the ATO for financial year 2023 compiled by AreaSearch indicates that earnings across the Middle Park - Jamboree Heights SA2 exceed national benchmarks, with a median taxable income of $58,095 and an average of $71,148, compared to Greater Brisbane's median of $58,236 and average of $72,799. Factoring in an 11.36% increase in the Wage Price Index since financial year 2023 elevates estimated figures to $64,695 (median) and $79,230 (average) as of March 2026. In the 2021 Census, individual, family, and household earnings placed near the 68th percentile across Australia.
The weekly income band of $1,500 - 2,999 is the most prevalent locally, encompassing 34.3% of residents (2,541 people), mirroring the 33.3% recorded regionally. High earners taking in more than $3,000 weekly make up 30.7% of the community, reflecting substantial spending capacity. Furthermore, local households retain 87.3% of income once housing expenses are met, placing the area in the 7th decile of the SEIFA economic index.
Frequently Asked Questions - Income
Middle Park - Jamboree Heights had 2,508 occupied dwellings at the 2021 Census, 97% detached houses and 0% apartments. 43% are owned with a mortgage, 20% rented and 37% owned outright. At that Census the median rent was $430 a week and the median mortgage repayment $1,886 a month. Rent absorbs 20.1% of household income here and mortgage repayments 20.3%. Dwelling stock, tenure and housing costs are 2021 Census measures — the only source that counts dwellings at this boundary size.
Detail
According to the most recent Census, the local housing landscape in Middle Park - Jamboree Heights is dominated by detached homes, which account for 97.2% of dwellings, while apartments, semi-detached properties, and other formats represent 2.8%, contrasting with Brisbane metro where houses comprise 73.5% and alternative formats make up 26.5%. Outright home ownership stands at 37.3%, significantly higher than across Brisbane metro, while 43.0% of properties are mortgaged and 19.6% are rented. The median monthly mortgage payment is $1,886, exceeding the Brisbane metro benchmark of $1,863 and the national figure of $1,863.
Median weekly rent is $430, higher than Brisbane metro's $380 and the national benchmark of $375.
Frequently Asked Questions - Housing
Middle Park - Jamboree Heights counted 2,508 households at the 2021 Census, averaging 2.8 people each. 39% are couples with children, more than in 76% of areas nationally, against 29% couples without children. 17% of households are people living alone, and families average 1.6 children. Household and family composition is measured only by the Census, so these are 2021 figures.
Detail
Family households constitute the overwhelming majority of homes at 80.3%, comprising couples with children (38.9%), couples without children (29.3%), and single parent families (11.2%). The remaining 19.7% consists of non-family arrangements, with lone person households representing 16.8% and group households making up 2.6%. The typical household size sits at 2.8 people, which is larger than the Greater Brisbane median of 2.6.
Frequently Asked Questions - Households
37.4% of adults in Middle Park - Jamboree Heights hold a university qualification, including 24.8% with a bachelor degree and 8.9% with postgraduate qualifications, higher than 90% of areas nationally. A further 19.0% hold a vocational qualification. 3 schools serve the area, with 1,892 enrolment places and an average ICSEA of 1,117 against a national benchmark of 1,000. Qualifications come from the 2021 Census; school enrolments, ICSEA and results come from ACARA's current release.
Detail
Educational attainment levels across Middle Park - Jamboree Heights comfortably exceed wider benchmarks, with 37.4% of residents aged 15+ holding higher education qualifications compared to 25.7% in QLD, positioning the local workforce favorably for knowledge-intensive industries. Bachelor degrees are held by 24.8% of this demographic, while 8.9% hold postgraduate qualifications and 3.7% have graduate diplomas. Vocational and technical education is also prevalent, with 30.9% of residents aged 15+ possessing vocational credentials, including 11.9% with advanced diplomas and 19.0% with certificates. Engagement in formal learning is substantial throughout the community, with 29.1% of residents enrolled as students.
This cohort includes 10.1% attending primary school, 7.9% in secondary school, and 6.1% engaged in tertiary studies.
Frequently Asked Questions - Education
Schools Detail
Getting around Middle Park - Jamboree Heights means driving: households keep an average of 1.5 vehicles, and no scheduled public transport appears in the current timetable feeds. Service data is built from operators' published GTFS timetables; vehicle ownership is from the 2021 Census.
Frequently Asked Questions - Transport
Transport Stops Detail
71.7% of residents in Middle Park - Jamboree Heights report no long-term health condition, a healthier profile than 89% of areas nationally. 4.9% need daily assistance with core activities, and 54.1% hold private health cover. The standardised death rate runs at 3.5 per 1,000 residents. Health conditions, assistance needs and insurance are 2021 Census measures; the death rate comes from current ABS releases.
Detail
Health indicators compiled by AreaSearch for Middle Park - Jamboree Heights highlight exceptional wellbeing, reflected in low rates of mortality and minimal incidence of chronic illness across all demographics, while private health insurance uptake is strong at approximately 54% of the total population (~4,009 people). Asthma and mental health concerns represent the most frequently identified chronic conditions, affecting 7.5 and 7.4% of the local population respectively, whereas 71.7% of residents reported having no diagnosed long-term medical issues, compared to 69.2% across Greater Brisbane. Health outcomes among residents aged under 65 are particularly favorable.
Residents aged 65 and over make up 19.3% of the community (1,429 people), exceeding the Greater Brisbane proportion of 15.0%, with health outcomes for this senior cohort tracking firmly in line with national standards.
Frequently Asked Questions - Health
35.8% of Middle Park - Jamboree Heights residents were born overseas and 26.5% speak a language other than English at home, more culturally diverse than 75% of areas nationally. The largest reported ancestries are English (23.8%) and Australian (20.6%). Ancestry, language and country of birth are counted only by the Census, so these are 2021 figures.
Detail
Middle Park - Jamboree Heights demonstrates a notable degree of cultural diversity, with 35.8% of residents born abroad and 26.5% using a primary language other than English in their households. Christianity is the predominant faith, practiced by 48.5% of residents. In addition, Buddhism shows a distinct local presence, accounting for 4.3% of the community compared to 2.0% across Greater Brisbane. Evaluating parental country of birth, the primary ancestries across Middle Park - Jamboree Heights are English at 23.8%, Australian at 20.6%, and Other at 10.4%. Several cultural communities show above-average representation, including Vietnamese residents who account for 2.9% of the local population (compared to 0.8% across the broader region), New Zealand ancestry at 1.1% (vs 1.0%), and South Australian background at 1.0% (vs 0.6%).
Frequently Asked Questions - Diversity
The median resident of Middle Park - Jamboree Heights is 39. 23.1% of residents are aged 15 to 34. Age cohorts are not raw Census counts: the Census split is re-based to the latest ABS population estimates and state projections.
Detail
The age distribution of Middle Park - Jamboree Heights skews toward older demographics, with seniors and retirees (65+) making up 19.3% of the population as at August 2026 compared to 15.0% across Greater Brisbane, while younger to mid-career adults (25 - 44) comprise 25.8% compared to the regional share of 30.6%. The median age is estimated at 39 as at August 2026, matching the 2021 Census figure and tracking 3 years above the Greater Brisbane Census median of 36. Since the 2021 Census, the proportion of residents aged 65+ has increased from 17.1% to an estimated 19.3%.
Projections suggest this retiree cohort will experience the largest expansion by 2041, increasing by 276 (19%) to 1,706 people, while the numbers of young to middle-aged adults, children, and youth are anticipated to contract.
Frequently Asked Questions - Age
Data & MethodBoundaries, Sources & Method for Middle Park - Jamboree Heights
8 of 14 data sections on this page were updated within the last 12 months — the newest current to Oct 2026.
Everything is aggregated to the SA2 boundary shown above, on a 2021 Census baseline. Only 3 sections — housing, households and cultural diversity — still wait on the 2026 Census.
The ledger — source, cycle and currency by section
| Section | Source & update cycle | Currency |
|---|---|---|
| Updated within the last 12 months 8 sections | ||
| Population | ABS, GNAF, Geoscience Australia Annual (ABS ERP) | Aug 2026 2 months ago headline measures · 2021 Census baseline |
| Re-based to the ABS Estimated Resident Population (June 2025 release) and updated with new dwellings from GNAF address data. Current to Aug 2026, with the 2021 Census supplying the small-area baseline. | ||
| Age profile | ABS, Geoscience Australia, State governments Annual | Aug 2026 2 months ago headline measures · 2021 Census baseline |
| Age cohorts are re-based to the latest ABS population estimates and state projections, current to Aug 2026. Each cohort is held as a Census baseline and a current estimate. | ||
| Development & approvals | ABS, GNAF Monthly (ABS approvals) | Aug 2026 2 months ago headline measures · Jul 2026 baseline |
| Property sales & rents | Valuer General, Rental Board, ABS Weekly sales, quarterly rents | Oct 2026 this month headline measures · Sep 2026 baseline |
| Sales from the state Valuer General register, refreshed weekly, and rents from quarterly rental bond lodgements. Both are read live each time this page loads, current to Oct 2026. | ||
| Employment | ABS, DEWR, JSA Quarterly (ABS SALM) | Mar 2026 7 months ago headline measures · 2021 Census baseline |
| Unemployment and labour force from ABS Small Area Labour Markets, current to Mar 2026. The growth outlook applies Department of Employment (now Jobs and Skills Australia) forecasts for all 19 industry divisions to the local industry mix, so it measures sector composition rather than local expansion and makes no allowance for population growth. Job demand comes from the same agency via its Internet Vacancy Index; industry and occupation structure from the 2021 Census. | ||
| Education | ABS, ACARA Annual (ACARA) | Sep 2026 last month headline measures · 2021 Census baseline |
| Transport | ABS, State Transport Departments Each timetable release | Jul 2026 3 months ago headline measures · 2021 Census baseline |
| Services & amenities | Provider directories, ACECQA Continuous | Sep 2026 last month all 14 measures |
| Annual and financial-year sources 3 sections | ||
| Infrastructure projects | Infrastructure Australia, State agencies, Local governments Daily | Jul 2025 about a year ago all 2 projects tracked here |
| Project pipeline maintained continuously from Infrastructure Australia, state agencies, local government and public announcements. Records are added and revised daily; this area was last updated Jul 2025. | ||
| Income | ABS, ATO Annual (ATO) | FY 2023 3 years ago headline measures · 2021 Census baseline |
| ATO taxable income statistics for FY 2023, indexed forward using the Wage Price Index. Census household income provides the distribution detail. | ||
| Health | ABS, ATO Annual | 2024 2 years ago headline measures · 2021 Census baseline |
| Census-measured — next update: 2026 Census 3 sections No more current small-area source exists for these, so they are labelled as Census-measured rather than implied to be current. | ||
| Housing | ABS 5-yearly (Census) | 2021 Census next update 2026 all 30 measures |
| Households | ABS 5-yearly (Census) | 2021 Census next update 2026 all 18 measures |
| Cultural diversity | ABS, Geoscience Australia 5-yearly (Census) | 2021 Census next update 2026 all 44 measures |
"Currency" is the most recent release feeding that section. Where the Census supplies the structural baseline underneath a current headline figure, the row says so.
How the numbers are built
Population
The Census provides the small-area baseline, aggregated from mesh blocks to this boundary. It is then re-based to the ABS Estimated Resident Population (June 2025 release), and new dwellings built since Census night are counted from address data. The headline figure is therefore a current estimate for Aug 2026, not a 2021 count (7,086 at the 2021 Census → 7,411 now). Annual growth rates are compound (CAGR), not simple averages.
Age profile
Cohort shares are not raw Census counts. Every cohort is held as a pair — the Census baseline and a current estimate — and the split is re-based using ERP and state population projections, current to Aug 2026. Median age is the Census median plus modelled change since. Charts that show both are labelled "2021 Census vs Current Estimate".
Property sales
Sourced from the state valuation authority's sales register — current, not Census, and refreshed weekly. Medians are calculated from settled transactions in the period shown; periods with very low transaction counts are flagged or suppressed, because a handful of sales can move a median substantially.
Rents
Derived from state rental bond lodgement data, by dwelling type and bedroom count. Bonds are lodged at the start of a new tenancy, so this reflects new lettings, not the whole rented stock.
Development & infrastructure
Building approvals come from current ABS releases; development applications are collected from council and state planning portals; the infrastructure pipeline is compiled from Infrastructure Australia and local government sources. Applications are matched to this boundary by address or coordinates, so very recent lodgements may not yet appear.
Employment & income
Industry and occupation structure comes from the Census, but the headline labour-market indicators do not. Unemployment and labour force are derived from ABS Small Area Labour Markets (quarterly). The employment outlook applies Department of Employment forecasts for all 19 industry divisions to this area's own industry mix (the agency is now Jobs and Skills Australia), as does the Internet Vacancy Index used for job demand. Because it is weighted on industry composition alone, that outlook carries no allowance for local population growth — in fast-growing areas the real rise in local jobs will typically be higher. Income combines Census household income with ATO taxable-income statistics for FY 2023, indexed forward using the Wage Price Index.
Education, transport & amenities
School enrolments, ICSEA and performance come from ACARA's current release, not the Census. Public transport stops and service frequency are derived from GTFS timetable feeds published by state transport departments. Services and amenities are proximity and count scores built from provider directories, refreshed on their own cycle. The Census contributes only the travel-to-work and qualification measures.
Rankings and benchmarks. Where we rank this area, the comparison set is every area of the same boundary type — suburbs against suburbs, SA2s against SA2s. Benchmarks compare this area against its greater capital city region and the national figure for the same measure and period.
Limits worth knowing. Small areas carry larger error margins, and the ABS introduces small random adjustments to Census counts to protect confidentiality — so totals may not sum exactly. Estimates re-based from regional data describe the area's expected trajectory, not a direct count of it. Figures are indicative for research and are not financial, planning or valuation advice.
Cross-check us. The Census baseline for this boundary is at ABS 2021 Census QuickStats (304011082). QuickStats reports 2021 only — the figures on this page are more current wherever the ledger shows a later date.