Chart Color Schemes
This analysis uses ABS Statistical Areas Level 2 (SA2) boundaries, which can materially differ from Suburbs and Localities (SAL) even when sharing similar names.
SA2 boundaries are defined by the Australian Bureau of Statistics and are designed to represent communities for statistical reporting (e.g., census and ERP).
Suburbs and Localities (SAL) represent commonly-used suburb/locality names (postal-style areas) and may use different geographic boundaries. For comprehensive analysis, consider reviewing both boundary types if available.
est. as @ -- *
ABS ERP | -- people | --
2021 Census | -- people
Sales Activity
Curious about local property values? Filter the chart to assess the volume and appreciation (including resales) trends and regional comparisons, or scroll to the map below view this information at an individual property level.
Find a Recent Sale
Sales Detail
Population
Bellbowrie - Moggill has seen population growth performance typically on par with national averages when looking at short and medium term trends
Bellbowrie - Moggill's population is approximately 11,190 as of November 2025. This represents an increase of 662 people since the 2021 Census, which reported a population of 10,528. The growth was inferred from ABS estimates and new address validations between June 2024 and the Census date. The population density is around 642 persons per square kilometer. Bellbowrie - Moggill's growth rate of 6.3% since the 2021 Census exceeded its SA3 area's growth rate of 5.7%. Natural growth contributed approximately 50.3% to this increase.
AreaSearch uses ABS/Geoscience Australia projections for each SA2 area, released in 2024 with a base year of 2022. For areas not covered by these data and years post-2032, Queensland State Government's SA2 area projections are adopted, based on 2021 data and released in 2023. These state projections do not provide age category splits, so AreaSearch applies proportional growth weightings from ABS Greater Capital Region projections released in 2023, based on 2022 data. By 2041, Bellbowrie - Moggill is projected to grow by 532 persons, reflecting an overall gain of 3.7% over the 17-year period.
Frequently Asked Questions - Population
Development
AreaSearch analysis of residential development drivers sees Bellbowrie - Moggill recording a relatively average level of approval activity when compared to local markets analysed countrywide
Bellbowrie-Moggill has granted around 30 residential property approvals annually. Over the past five financial years, from FY21 to FY25152 homes were approved, with a further 13 approved in FY26 so far. On average, this area sees 1.9 new residents per year for each dwelling constructed over these five years. However, recent data shows an increase to 5.9 people per dwelling over the past two financial years, indicating growing popularity and potential supply constraints.
New homes are being built at an average expected construction cost of $358,000. This financial year has seen $37.2 million in commercial approvals, suggesting strong local business investment. Compared to Greater Brisbane, Bellbowrie-Moggill shows similar development activity per capita, maintaining market balance consistent with the broader area. However, this activity is below national average, reflecting the area's maturity and possible planning constraints.
All recent building activity consists of detached houses, preserving the area's low-density nature and attracting space-seeking buyers. The current population estimate per dwelling approval is 395 people. According to AreaSearch's latest quarterly estimate, Bellbowrie-Moggill is expected to grow by 415 residents by 2041. At current development rates, new housing supply should comfortably meet demand, providing favourable conditions for buyers and potentially supporting growth beyond current population projections.
Frequently Asked Questions - Development
Infrastructure
Bellbowrie - Moggill has very high levels of nearby infrastructure activity, ranking in the top 20% nationally
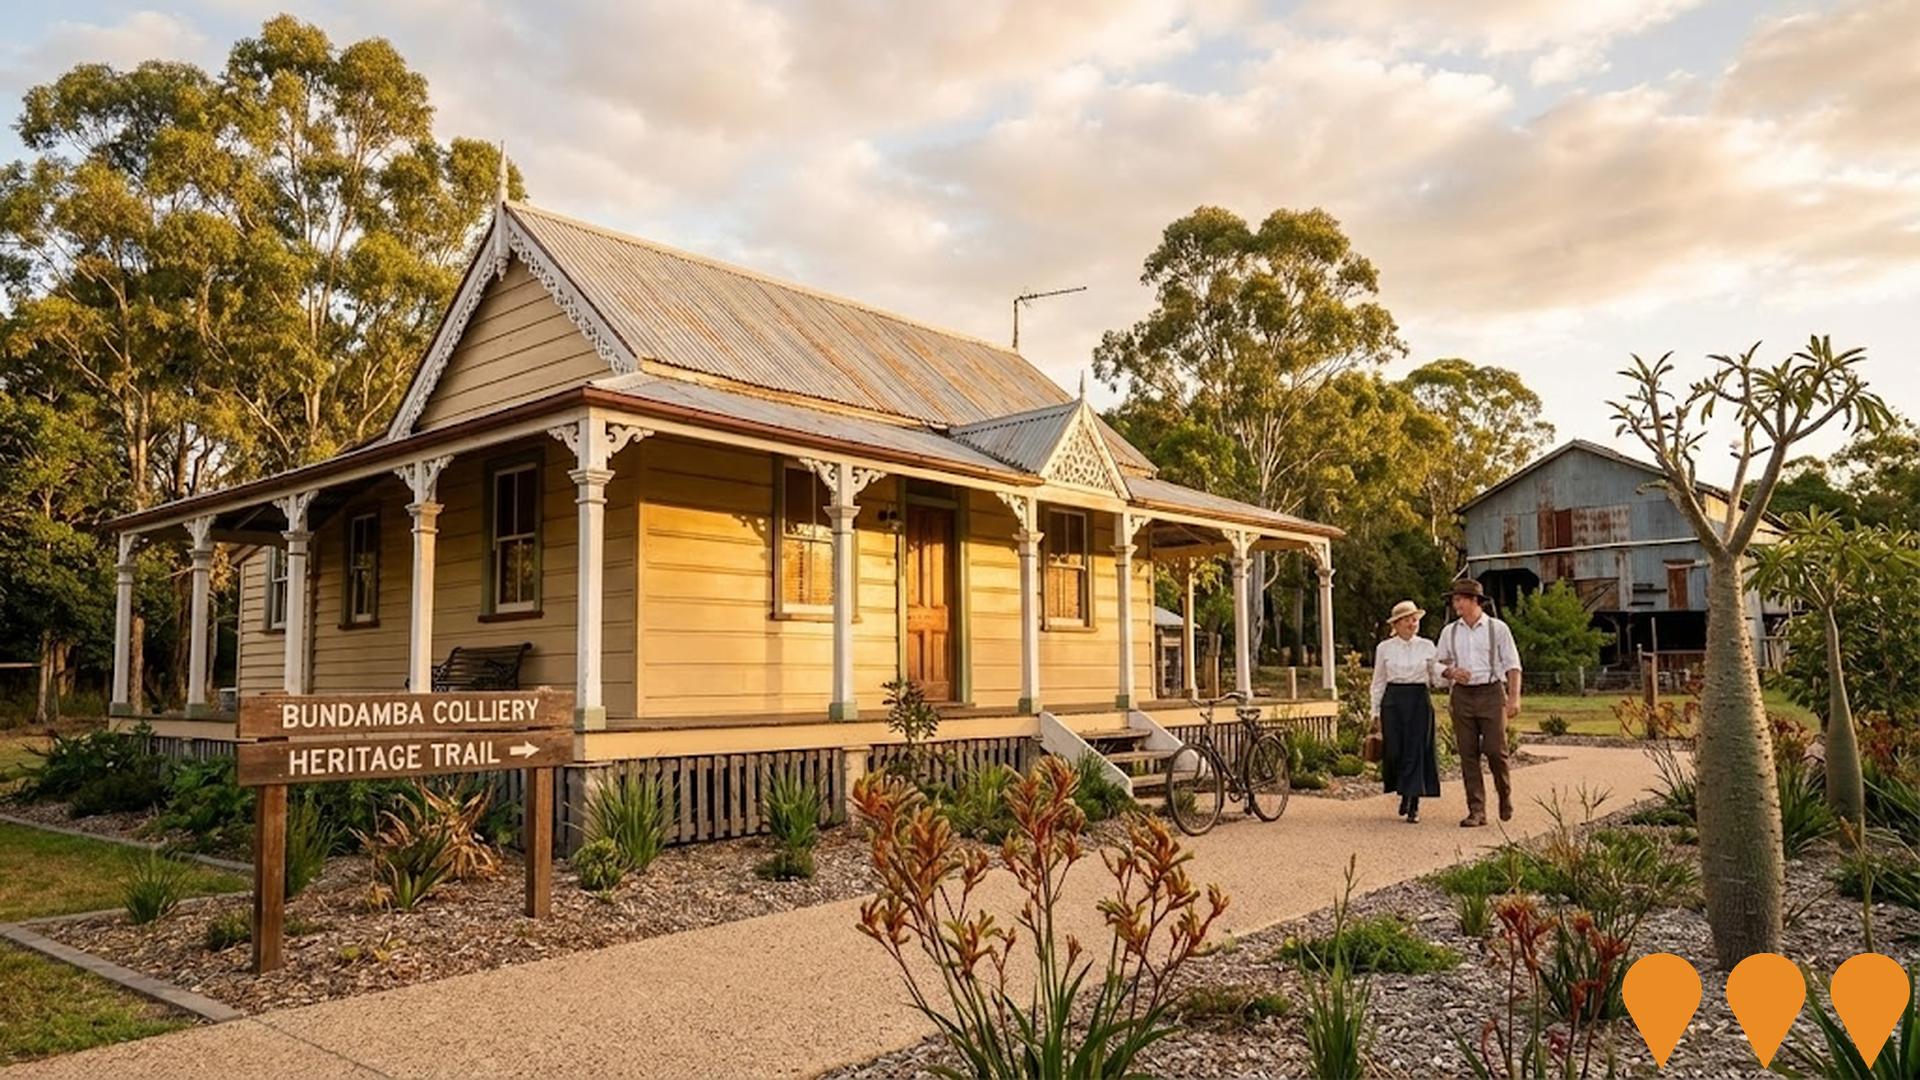
Twenty-six infrastructure projects were identified by AreaSearch as potentially impacting the region's performance. These include expansions like Citiswich Business Park, energy facilities such as Bundamba Energy Storage Facility, mixed-use developments like Goodna Central, and upgrades like Bundamba Industrial Precinct Upgrade. The following list details those expected to have the most relevance.
Professional plan users can use the search below to filter and access additional projects.
INFRASTRUCTURE SEARCH
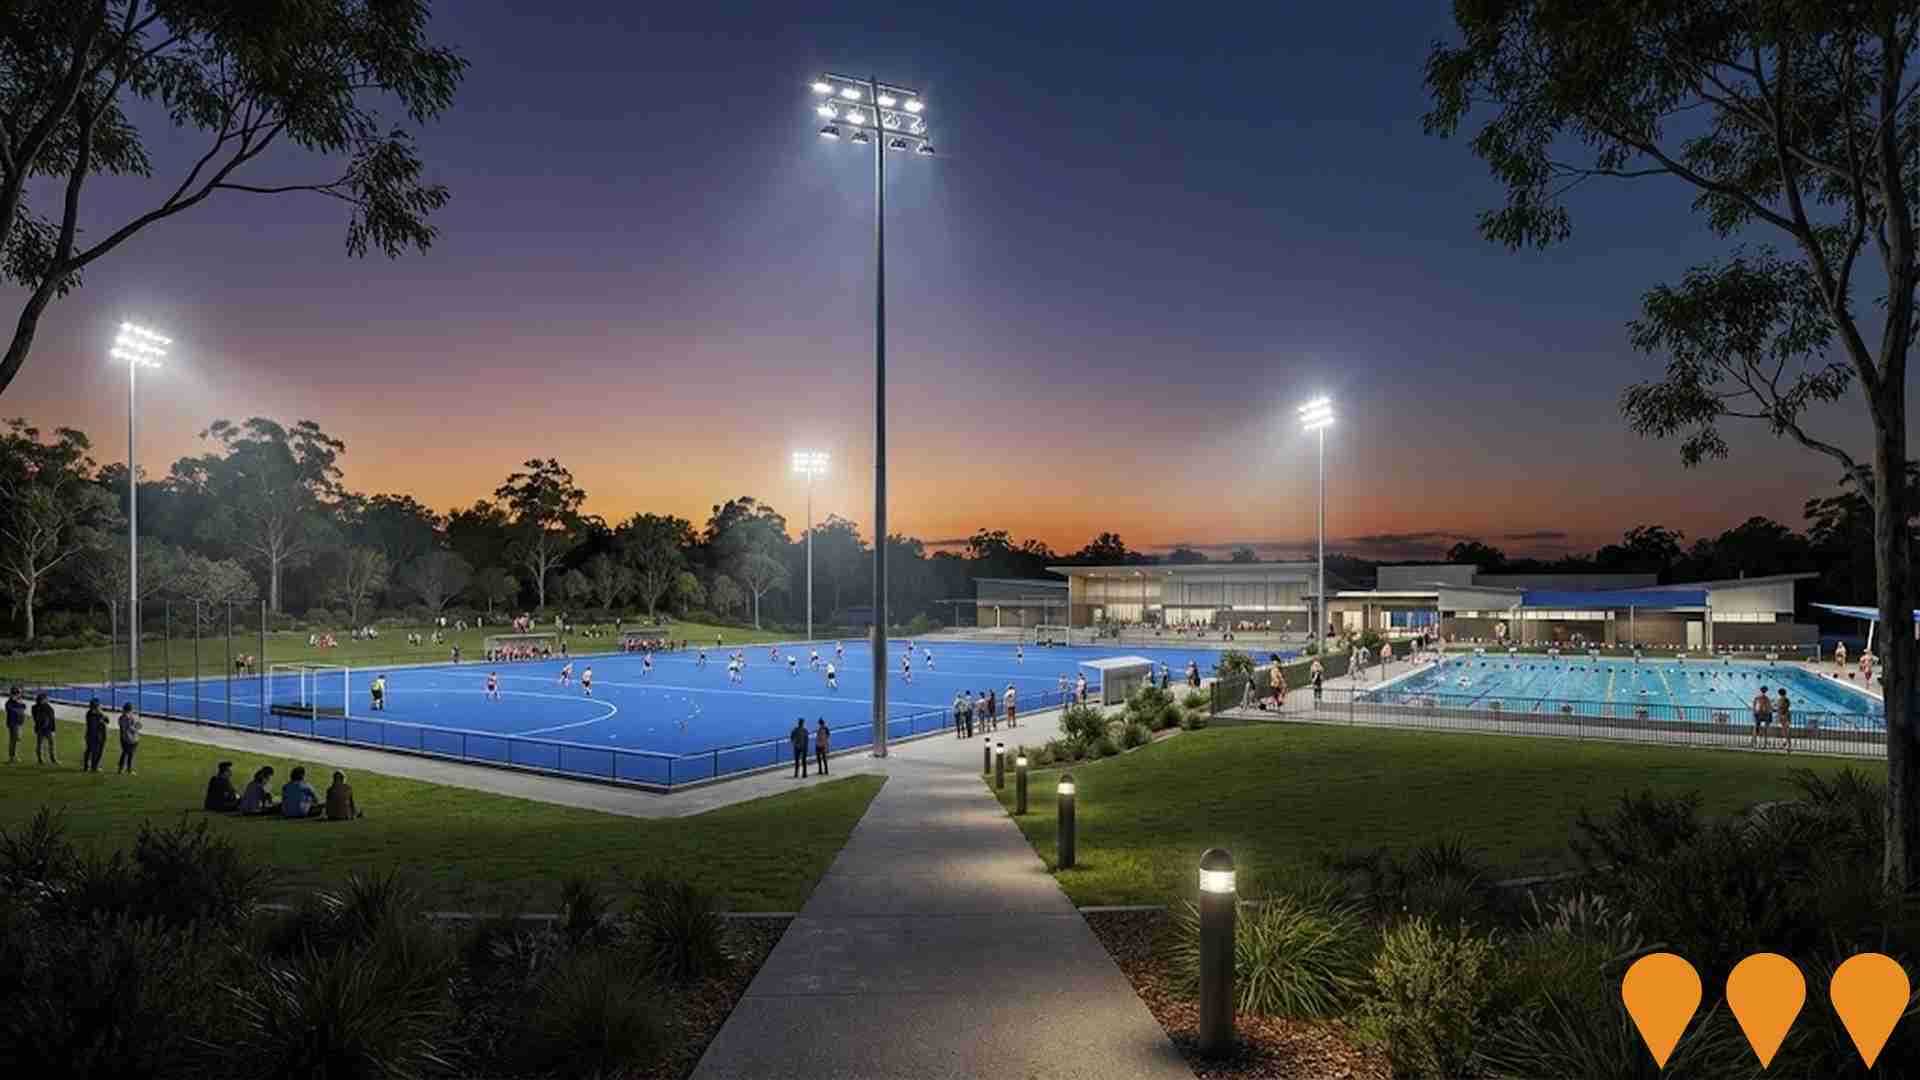
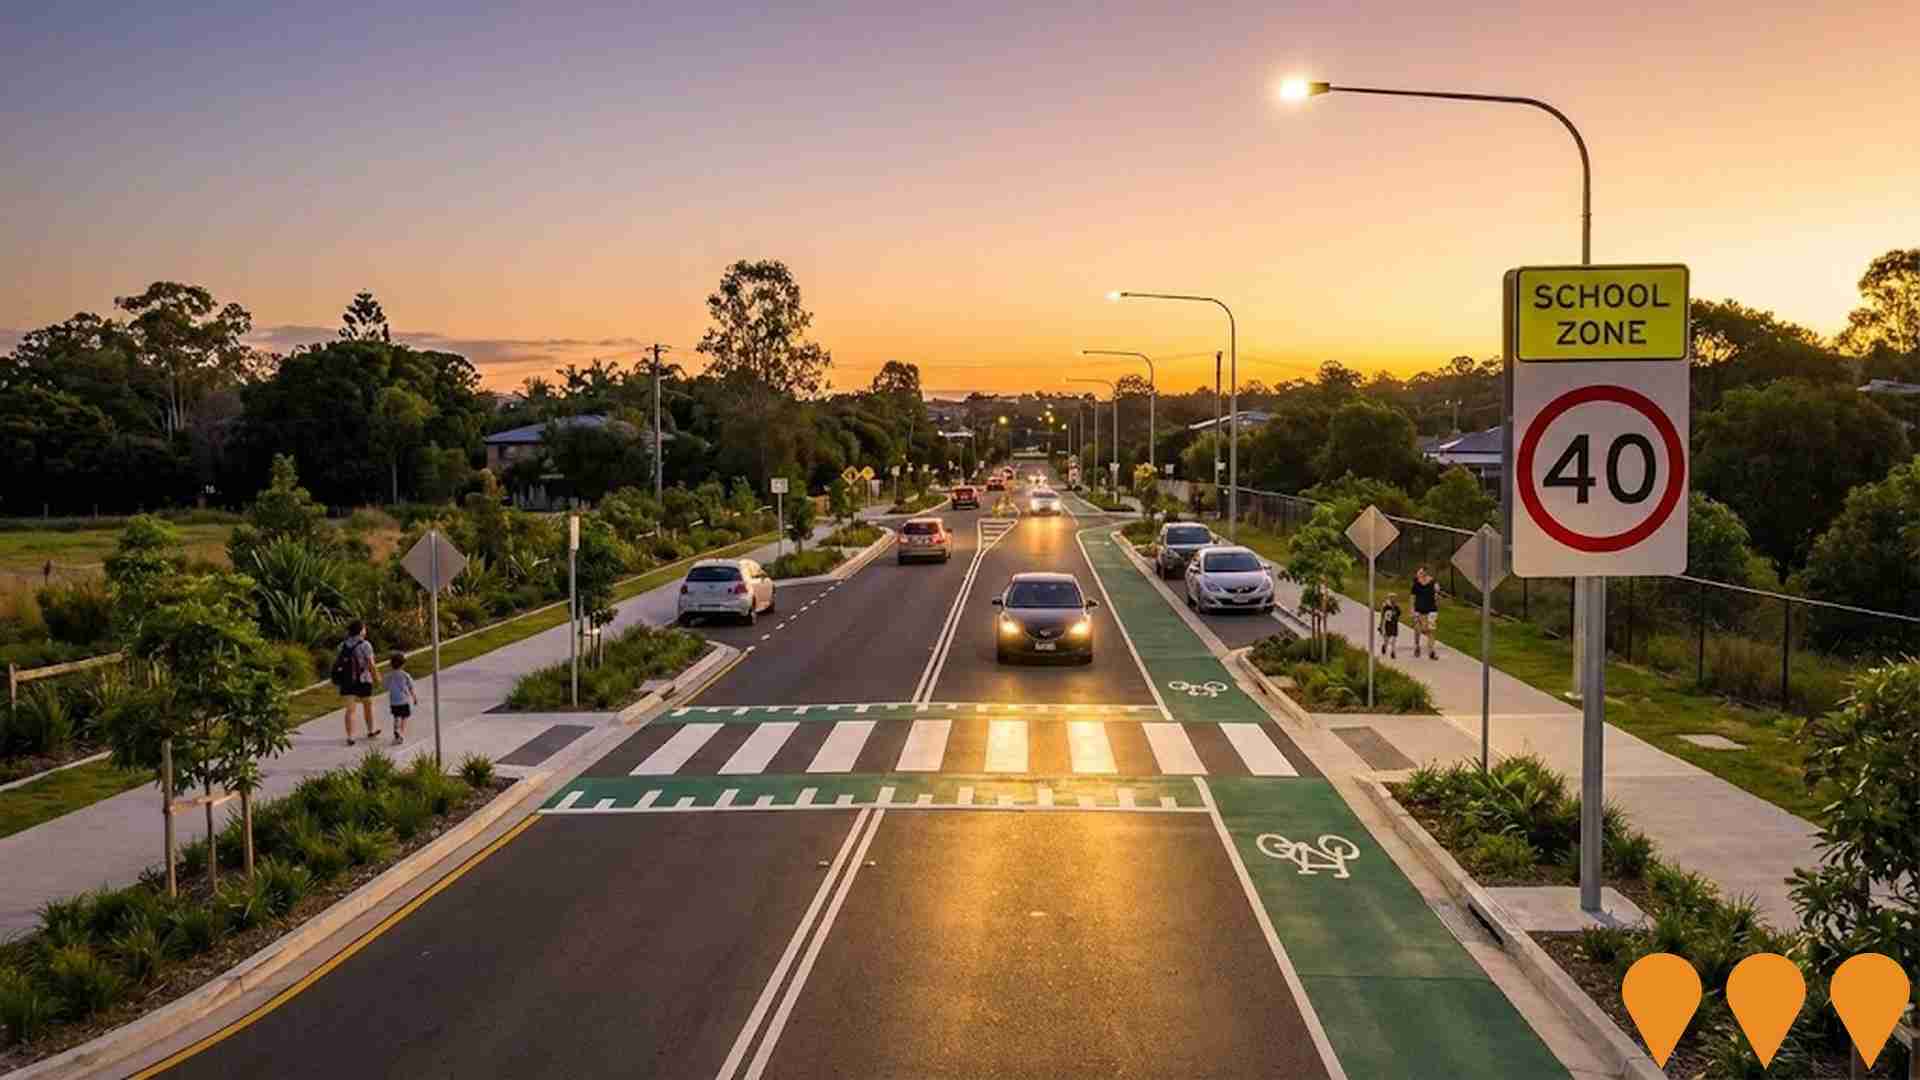
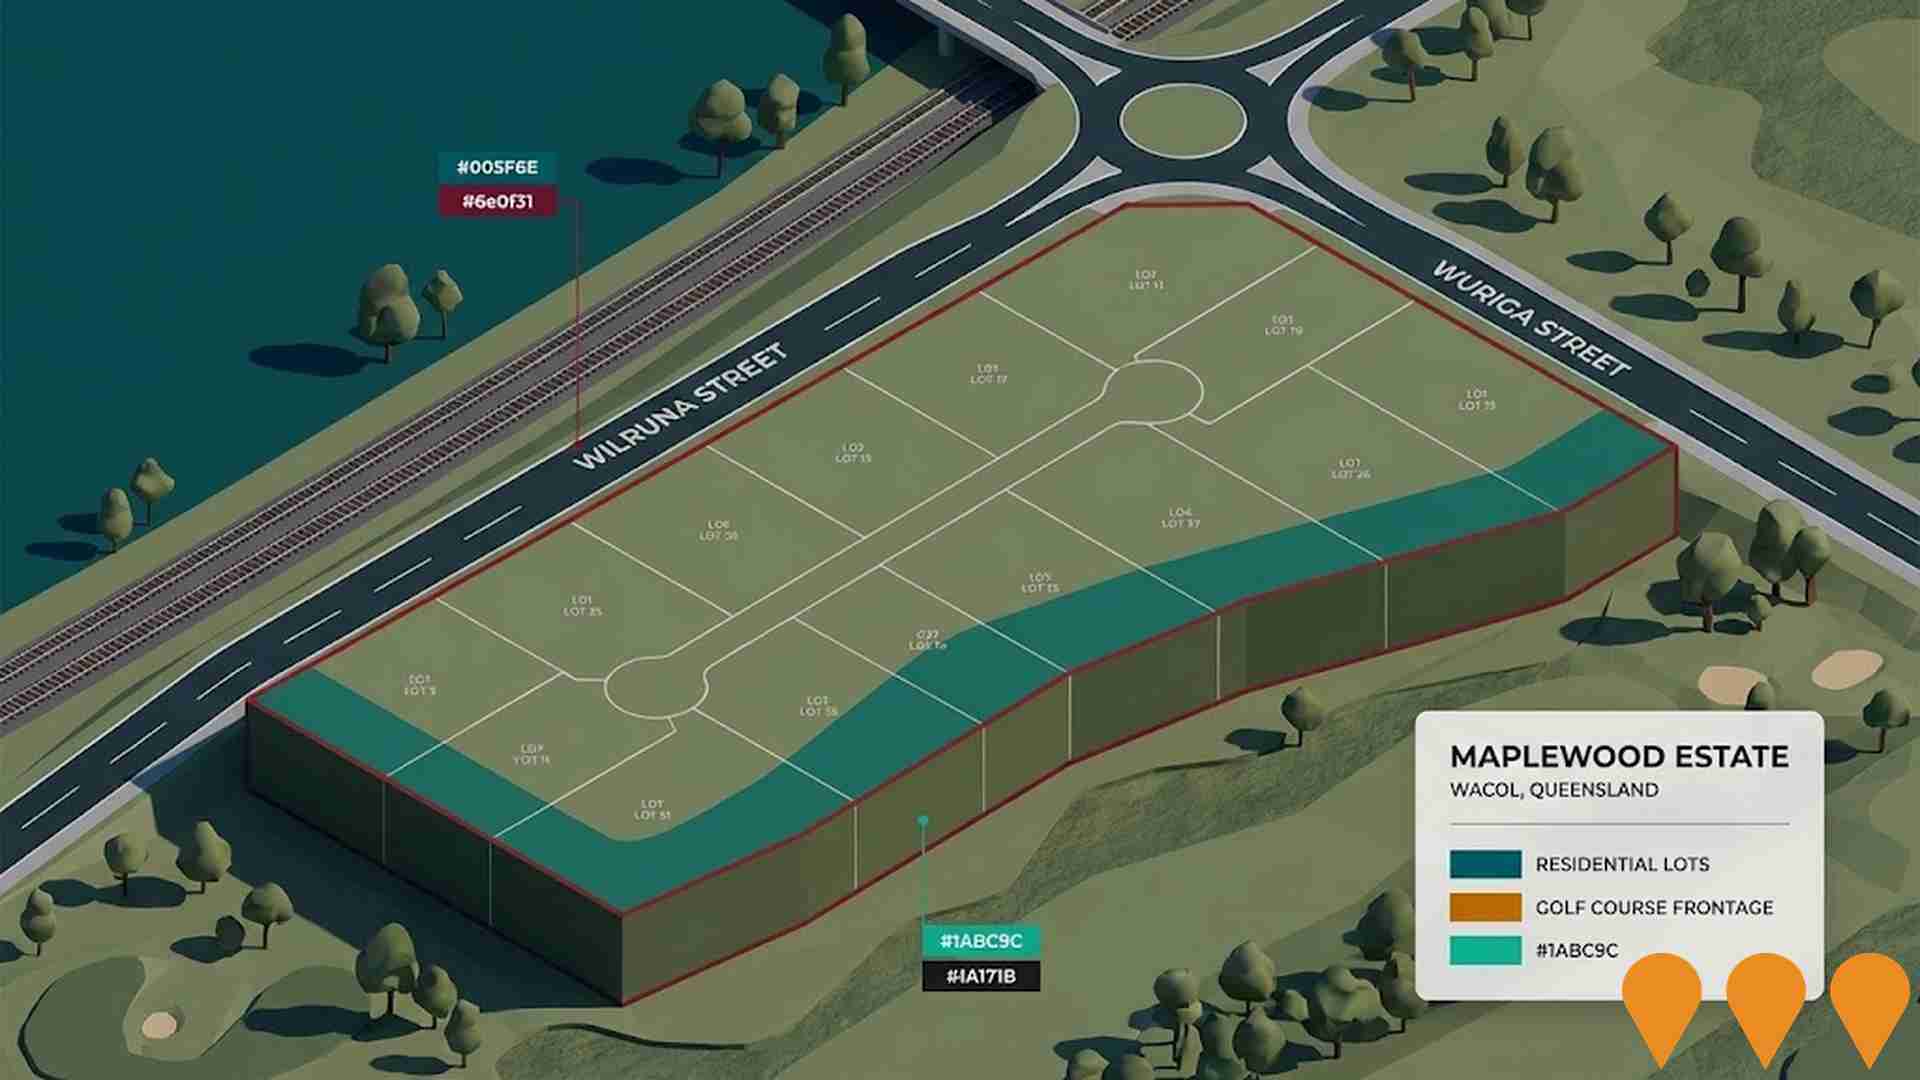
 Denotes AI-based impression for illustrative purposes only, not to be taken as definitive under any circumstances. Please follow links and conduct other investigations from the project's source for actual imagery. Developers and project owners wishing us to use original imagery please Contact Us and we will do so.
Frequently Asked Questions - Infrastructure
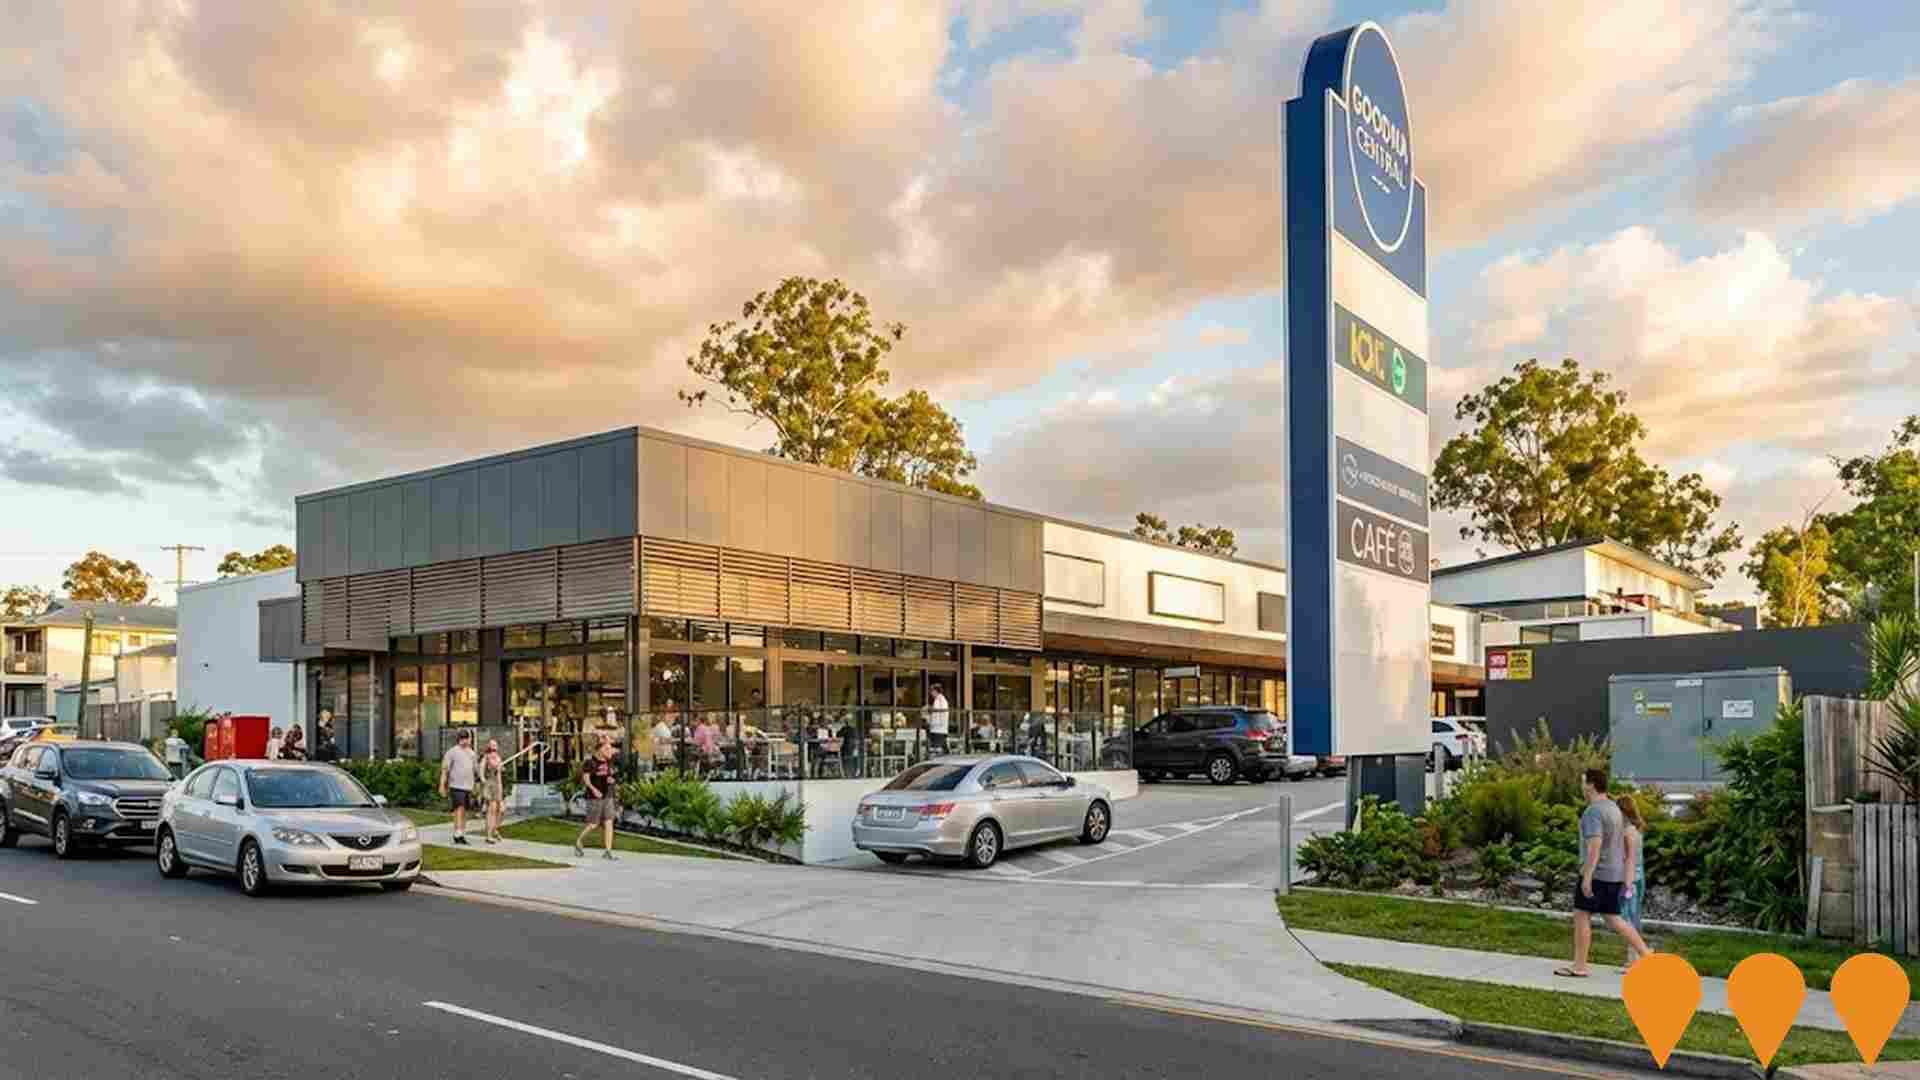
Goodna Central Mixed Use Development
Master planning of a $90 million mixed use development which will provide the New Town Centre for the CBD of Goodna. Over 2 Hectares of land in the centre of town will be converted to accommodate a vibrant Community Hub with Education and Training Facilities, Medical, Child Care, Child Care training, Retail and Affordable housing.
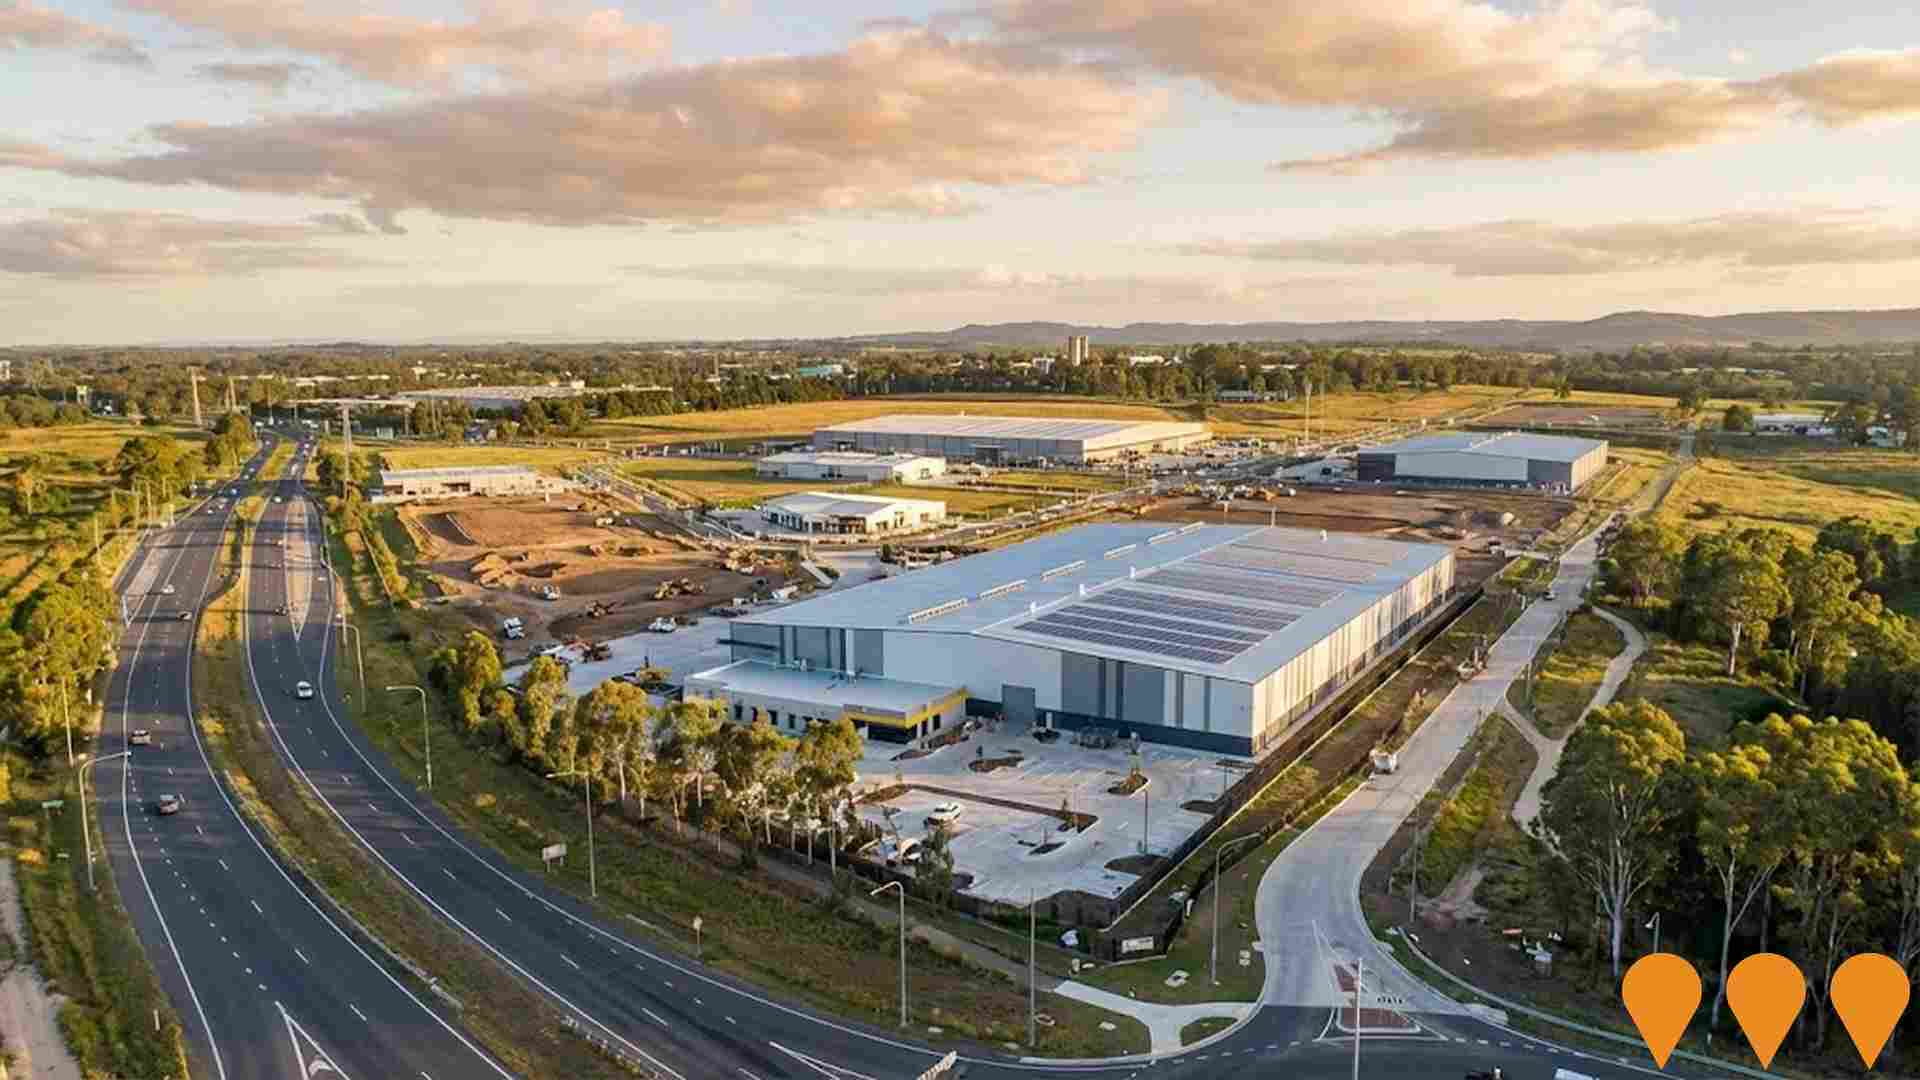
Citiswich Business Park Expansion
Expansion of Citiswich Business Park providing additional commercial and industrial space. Strategic employment hub supporting western Brisbane corridor economic development with modern facilities and transport connectivity.
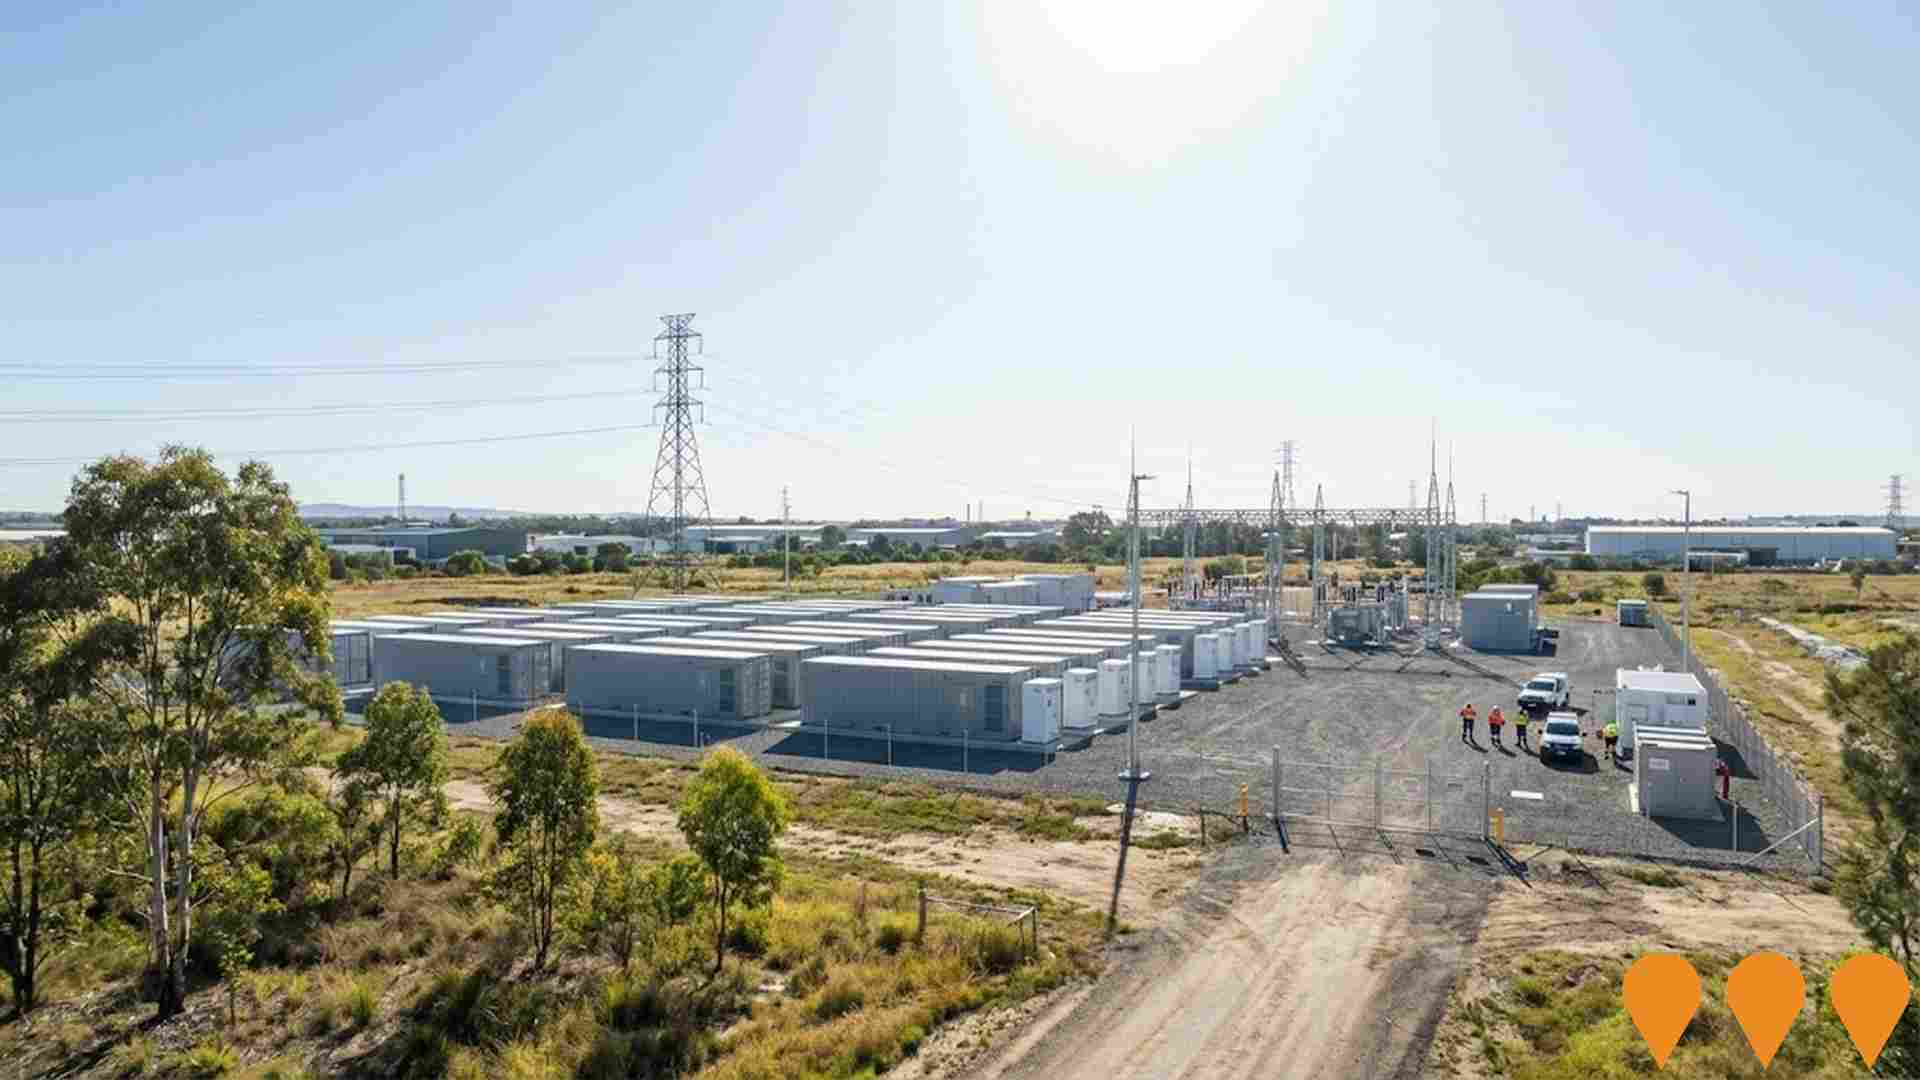
Bundamba Energy Storage Facility
Proposed large-scale battery energy storage facility to support grid stability and renewable energy integration. 50MW/200MWh capacity system planned for industrial area. $45 million renewable energy infrastructure project.
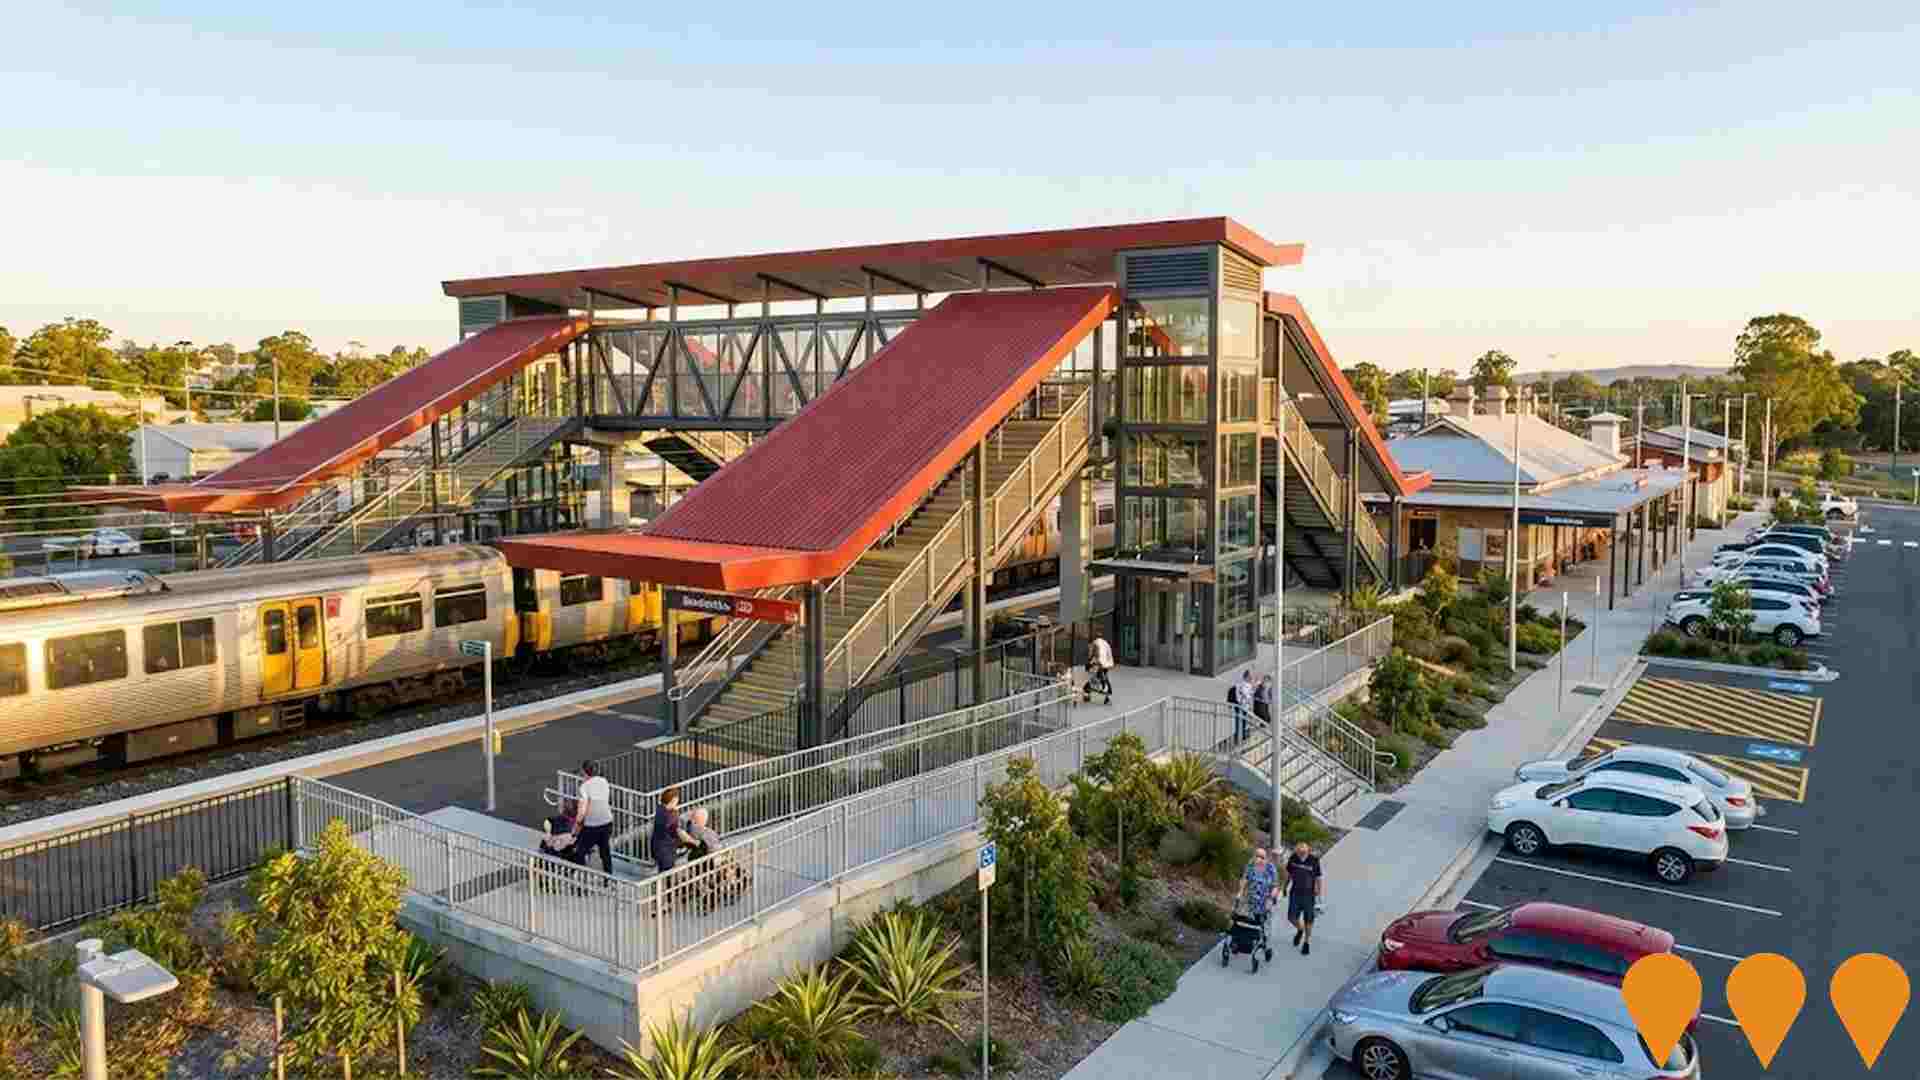
Bundamba Railway Station Accessibility Upgrade
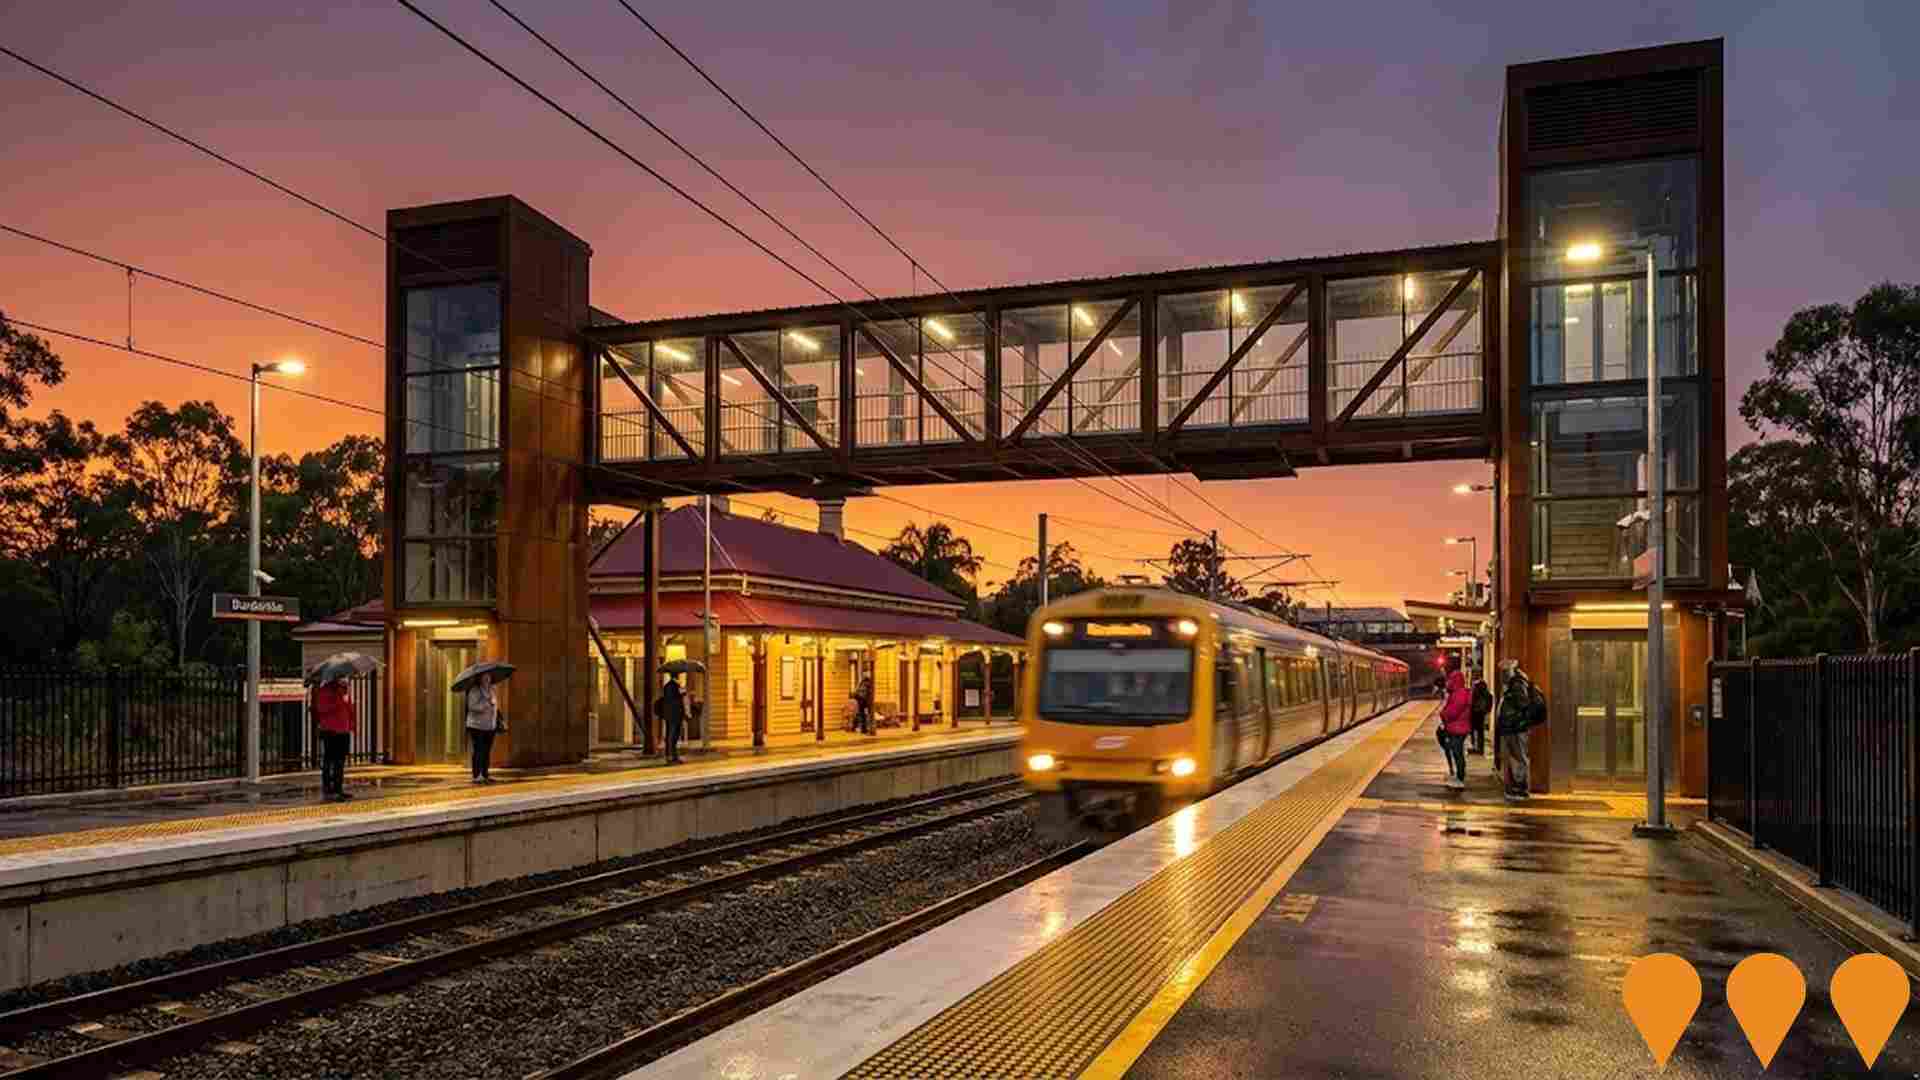
Major $59 million accessibility upgrade to Bundamba station including new footbridge with lift access, high-level platforms, accessible parking, improved security and lighting, and modern facilities. Completed October 2024.
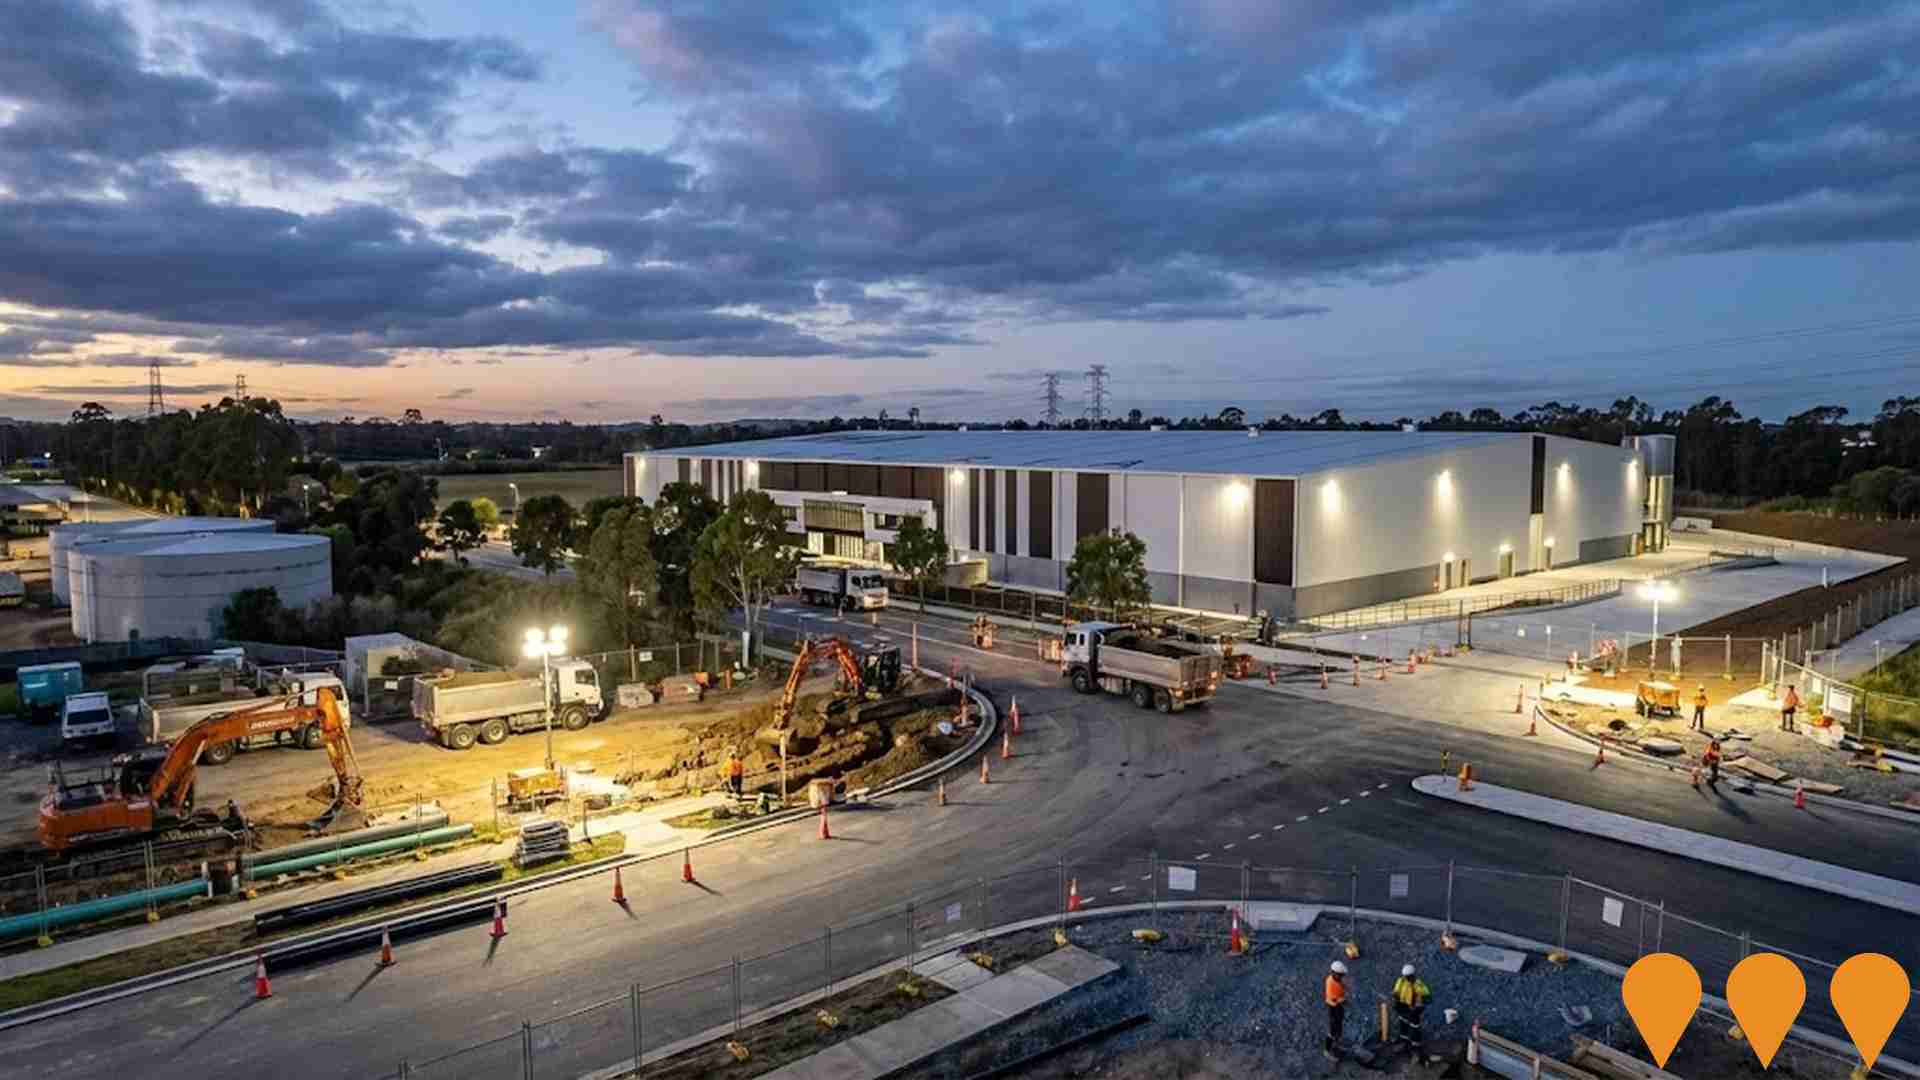
Bundamba Industrial Precinct Upgrade
Infrastructure upgrade to Bundamba industrial precinct including road improvements, new water and sewer connections, enhanced telecommunications, and stormwater management systems. $18 million project.
Bundamba State School Building Renewal
Comprehensive $12 million building renewal program for Bundamba State School including new classrooms, library upgrade, administration building renovation, and playground improvements.

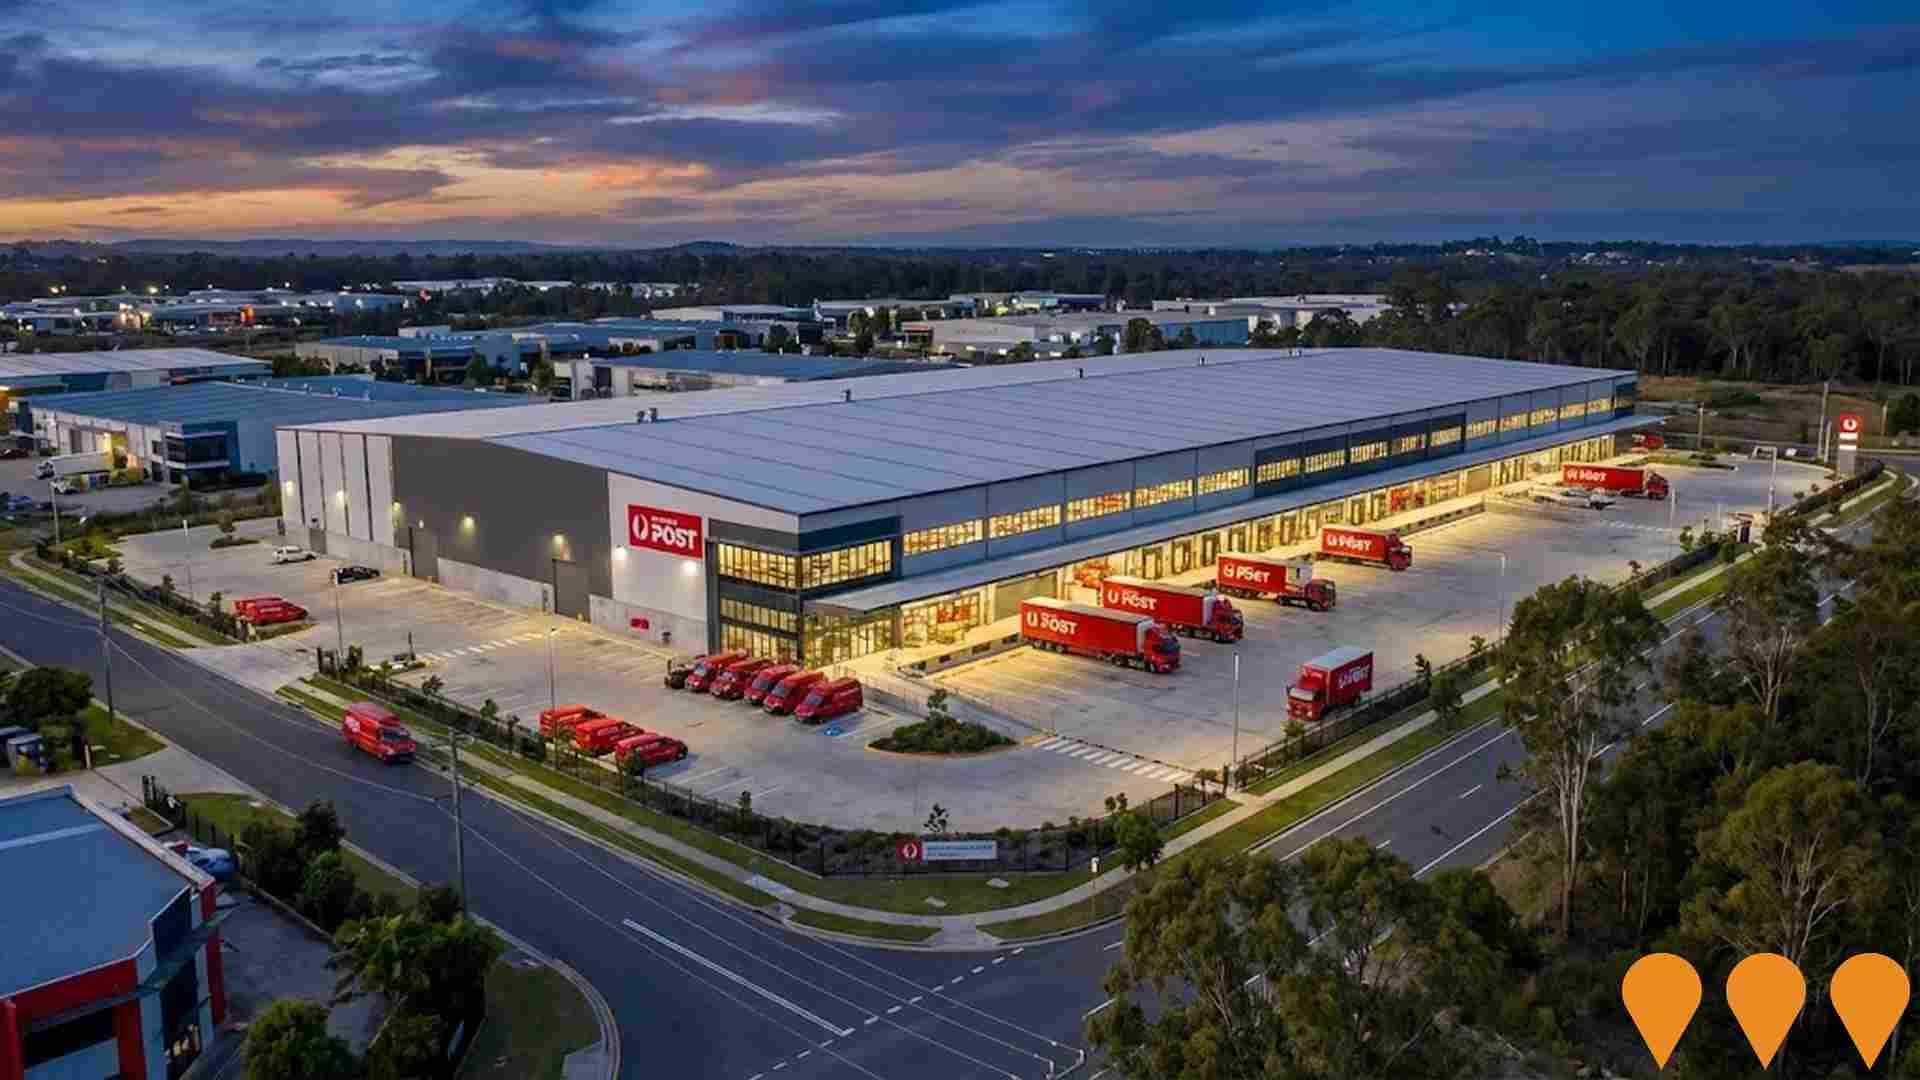
Australia Post Parcel Facility
Australia Post's Brisbane Parcel Facility in Redbank is the largest parcel processing and delivery centre in the southern hemisphere, featuring cutting-edge technology including robotic arms, automated guided vehicles, and an automated parcel picker. It covers 50,000 sq m, can process up to 700,000 parcels per day at peak, and employs 500 staff.
Bundamba Telecommunications Tower Upgrade
5G telecommunications infrastructure upgrade including new tower installation and enhanced network capacity to improve mobile and internet connectivity for Bundamba residents and businesses. $1.8 million investment.
Employment
Employment conditions in Bellbowrie - Moggill demonstrate strong performance, ranking among the top 35% of areas assessed nationally
Bellbowrie-Moggill has a highly educated workforce with strong representation in professional services. The unemployment rate is 2.8%.
As of September 2025, there are 5,860 residents employed, with an unemployment rate of 1.2% below Greater Brisbane's rate of 4.0%. Workforce participation is at 68.8%, compared to Greater Brisbane's 64.5%. Employment is concentrated in health care & social assistance, education & training, and professional & technical services. Notably, employment in education & training is at 1.5 times the regional average.
Conversely, transport, postal & warehousing shows lower representation at 3.7% compared to the regional average of 5.6%. Over the 12 months to September 2025, labour force levels decreased by 3.7%, with employment decreasing by 3.5%, causing unemployment to fall by 0.2 percentage points. This contrasts with Greater Brisbane where employment grew by 3.8% and unemployment fell by 0.5 percentage points. As of 25-Nov-25, Queensland's employment contracted by 0.01%, with the state unemployment rate at 4.2%. Jobs and Skills Australia forecasts national employment growth of 6.6% over five years and 13.7% over ten years. Applying these projections to Bellbowrie-Moggill's industry mix suggests local employment should increase by 6.9% over five years and 14.2% over ten years.
Frequently Asked Questions - Employment
Income
Income metrics indicate excellent economic conditions, with the area achieving higher performance than 75% of national locations assessed by AreaSearch
According to AreaSearch's aggregation of ATO data released for financial year 2022, Bellbowrie - Moggill SA2 had a median income among taxpayers of $62,448 and an average level of $78,678. These figures are among the highest in Australia, compared to levels of $55,645 and $70,520 across Greater Brisbane respectively. Based on Wage Price Index growth of 13.99% since financial year 2022, current estimates for median income would be approximately $71,184 and average income would be around $89,685 as of September 2025. According to the 2021 Census, household incomes rank exceptionally at the 87th percentile with a weekly income of $2,385. Income analysis shows that the $1,500 - $2,999 earnings band captures 32.7% of the community, with 3,659 individuals falling into this bracket. The district demonstrates considerable affluence with 37.1% earning over $3,000 per week, supporting premium retail and service offerings. Housing accounts for 13.9% of income while strong earnings rank residents within the 88th percentile for disposable income. The area's SEIFA income ranking places it in the 9th decile.
Frequently Asked Questions - Income
Housing
Bellbowrie - Moggill is characterized by a predominantly suburban housing profile, with a higher proportion of rental properties than the broader region
Bellbowrie-Moggill's dwelling structures, as per the latest Census, consisted of 95.7% houses and 4.3% other dwellings (semi-detached, apartments, 'other' dwellings). Brisbane metropolitan area had 95.2% houses and 4.7% other dwellings. Home ownership in Bellbowrie-Moggill was at 29.7%, with mortgaged dwellings at 55.7% and rented ones at 14.6%. The median monthly mortgage repayment here was $2,076, below Brisbane metro's $2,311. Median weekly rent was $450, compared to Brisbane metro's $500. Nationally, Bellbowrie-Moggill's mortgage repayments were higher at $2,076 than the Australian average of $1,863, while rents were substantially above the national figure of $375.
Frequently Asked Questions - Housing
Household Composition
Bellbowrie - Moggill features high concentrations of family households, with a fairly typical median household size
Family households account for 85.3% of all households, including 46.0% couples with children, 27.3% couples without children, and 11.4% single parent families. Non-family households constitute the remaining 14.7%, with lone person households at 13.6% and group households comprising 1.1%. The median household size is 3.0 people, aligning with the Greater Brisbane average.
Frequently Asked Questions - Households
Local Schools & Education
Bellbowrie - Moggill demonstrates exceptional educational outcomes, ranking among the top 5% of areas nationally based on AreaSearch's comprehensive analysis of qualification and performance metrics
Bellbowrie - Moggill has a notable educational advantage with 40.6% of residents aged 15+ holding university qualifications, compared to the Queensland average of 25.7%. Bachelor degrees are the most common at 24.7%, followed by postgraduate qualifications (11.5%) and graduate diplomas (4.4%). Vocational credentials are also prominent with 30.3% of residents aged 15+ holding such qualifications, including advanced diplomas (12.5%) and certificates (17.8%). Educational participation is high in the area, with 33.1% of residents currently enrolled in formal education.
This includes primary education (11.7%), secondary education (10.3%), and tertiary education (6.4%).
Frequently Asked Questions - Education
Schools Detail
Nearby Services & Amenities
Transport
Transport servicing is low compared to other areas nationally based on assessment of service frequency, route connectivity and accessibility
Analysis shows 14 active public transport stops operating in Bellbowrie - Moggill area. These comprise bus stops only. Two routes service these stops, together providing 1,105 weekly passenger trips.
Transport accessibility is moderate, with residents located on average 549 meters from the nearest stop. Service frequency averages 157 trips per day across all routes, translating to approximately 78 weekly trips per individual stop.
Frequently Asked Questions - Transport
Transport Stops Detail
Health
Bellbowrie - Moggill's residents are extremely healthy with both young and old age cohorts seeing low prevalence of common health conditions
Analysis of health metrics shows strong performance throughout Bellbowrie - Moggill. Both young and old age cohorts saw low prevalence of common health conditions.
The rate of private health cover was found to be exceptionally high at approximately 59% of the total population (6,646 people), compared to 72.0% across Greater Brisbane. The most common medical conditions in the area were mental health issues and asthma, impacting 7.3 and 7.1% of residents respectively. Seventy-two point six percent declared themselves completely clear of medical ailments, compared to 73.1% across Greater Brisbane. Sixteen point two percent of residents were aged 65 and over (1,807 people), which is lower than the 18.2% in Greater Brisbane. Health outcomes among seniors are particularly strong, broadly in line with the general population's health profile.
Frequently Asked Questions - Health
Cultural Diversity
The level of cultural diversity witnessed in Bellbowrie - Moggill was found to be above average when compared nationally for a number of language and cultural background related metrics
Bellbowrie-Moggill has a higher cultural diversity than most local areas, with 15.0% of residents speaking a language other than English at home and 34.4% born overseas. Christianity is the predominant religion in Bellbowrie-Moggill, making up 49.1% of its population. Hinduism is slightly overrepresented compared to Greater Brisbane, comprising 2.8% versus 2.6%.
The top three ancestry groups are English (29.5%), Australian (21.3%), and Irish (9.1%). Notably, South African (2.5%) and Russian (0.5%) ethnicities are overrepresented compared to regional averages of 2.0% and 0.4%, respectively.
Frequently Asked Questions - Diversity
Age
Bellbowrie - Moggill's population is slightly older than the national pattern
The median age in Bellbowrie - Moggill is 40 years, which is higher than Greater Brisbane's average of 36 years and modestly exceeds the national average of 38 years. The 45-54 cohort is notably over-represented at 15.9% locally compared to the Greater Brisbane average, while the 25-34 year-olds are under-represented at 6.5%. Post-2021 Census data shows the 15-24 age group grew from 12.3% to 13.9%, and the 75-84 cohort increased from 5.0% to 6.5%. Conversely, the 25-34 cohort declined from 8.5% to 6.5%, and the 5-14 group dropped from 16.5% to 15.4%. Population forecasts for 2041 indicate substantial demographic changes in Bellbowrie - Moggill, with the 85+ group expected to grow by 185% (from 247 to 706 people). Residents aged 65 and older are anticipated to represent 69% of this growth. Meanwhile, the 15-24 and 0-4 cohorts are expected to experience population declines.
