Chart Color Schemes
This analysis uses ABS Statistical Areas Level 2 (SA2) boundaries, which can materially differ from Suburbs and Localities (SAL) even when sharing similar names.
SA2 boundaries are defined by the Australian Bureau of Statistics and are designed to represent communities for statistical reporting (e.g., census and ERP).
Suburbs and Localities (SAL) represent commonly-used suburb/locality names (postal-style areas) and may use different geographic boundaries. For comprehensive analysis, consider reviewing both boundary types if available.
est. as @ -- *
ABS ERP | -- people | --
2021 Census | -- people
Sales Activity
Curious about local property values? Filter the chart to assess the volume and appreciation (including resales) trends and regional comparisons, or scroll to the map below view this information at an individual property level.
Find a Recent Sale
Sales Detail
Population
Westlake has shown very soft population growth performance across periods assessed by AreaSearch
Westlake's population was around 4,524 as of November 2025, reflecting an increase of 80 people since the 2021 Census. The 2021 Census reported a population of 4,444 people in Westlake. This increase is inferred from the estimated resident population of 4,524 from the ABS as of June 2024 and address validation since the Census date. This population level equates to a density ratio of 2,381 persons per square kilometer, placing it in the upper quartile relative to national locations assessed by AreaSearch. Westlake's growth rate of 1.8% since census positions it within 1.1 percentage points of the SA3 area (2.9%), indicating competitive growth fundamentals. Overseas migration contributed approximately 57.0% of overall population gains during recent periods, driving primary population growth in the area.
AreaSearch adopts ABS/Geoscience Australia projections for each SA2 area, released in 2024 with a base year of 2022. For areas not covered by this data and years post-2032, Queensland State Government's SA2 area projections are adopted, released in 2023 based on 2021 data. However, these state projections do not provide age category splits, so AreaSearch applies proportional growth weightings in line with the ABS Greater Capital Region projections for each age cohort. Considering projected demographic shifts, Westlake's population is expected to decline by 357 persons by 2041 according to this methodology. However, specific age cohorts are anticipated to grow, led by the 75 to 84 age group, which is projected to increase by 193 people over this period.
Frequently Asked Questions - Population
Development
The level of residential development activity in Westlake is very low in comparison to the average area assessed nationally by AreaSearch
Westlake has averaged approximately one new dwelling approval annually over the past five financial years, totalling six homes. As of FY26, zero approvals have been recorded. The area's population decline suggests that new supply has likely been meeting demand, providing good options for buyers. New properties are constructed at an average value of $391,000, slightly above the regional average, indicating a focus on quality developments.
This financial year, $390,000 in commercial development approvals have been recorded, suggesting minimal commercial development activity. Compared to Greater Brisbane, Westlake records significantly lower building activity, 70.0% below the regional average per person. This limited new supply generally supports stronger demand and values for established dwellings. However, building activity has accelerated in recent years.
Nationally, this is also below average, reflecting the area's maturity and possible planning constraints. Recent development has consisted entirely of detached dwellings, preserving Westlake's suburban nature and attracting space-seeking buyers. With stable or declining population forecasts, Westlake may experience less housing pressure, creating favourable conditions for buyers.
Frequently Asked Questions - Development
Infrastructure
Westlake has very high levels of nearby infrastructure activity, ranking in the top 20% nationally
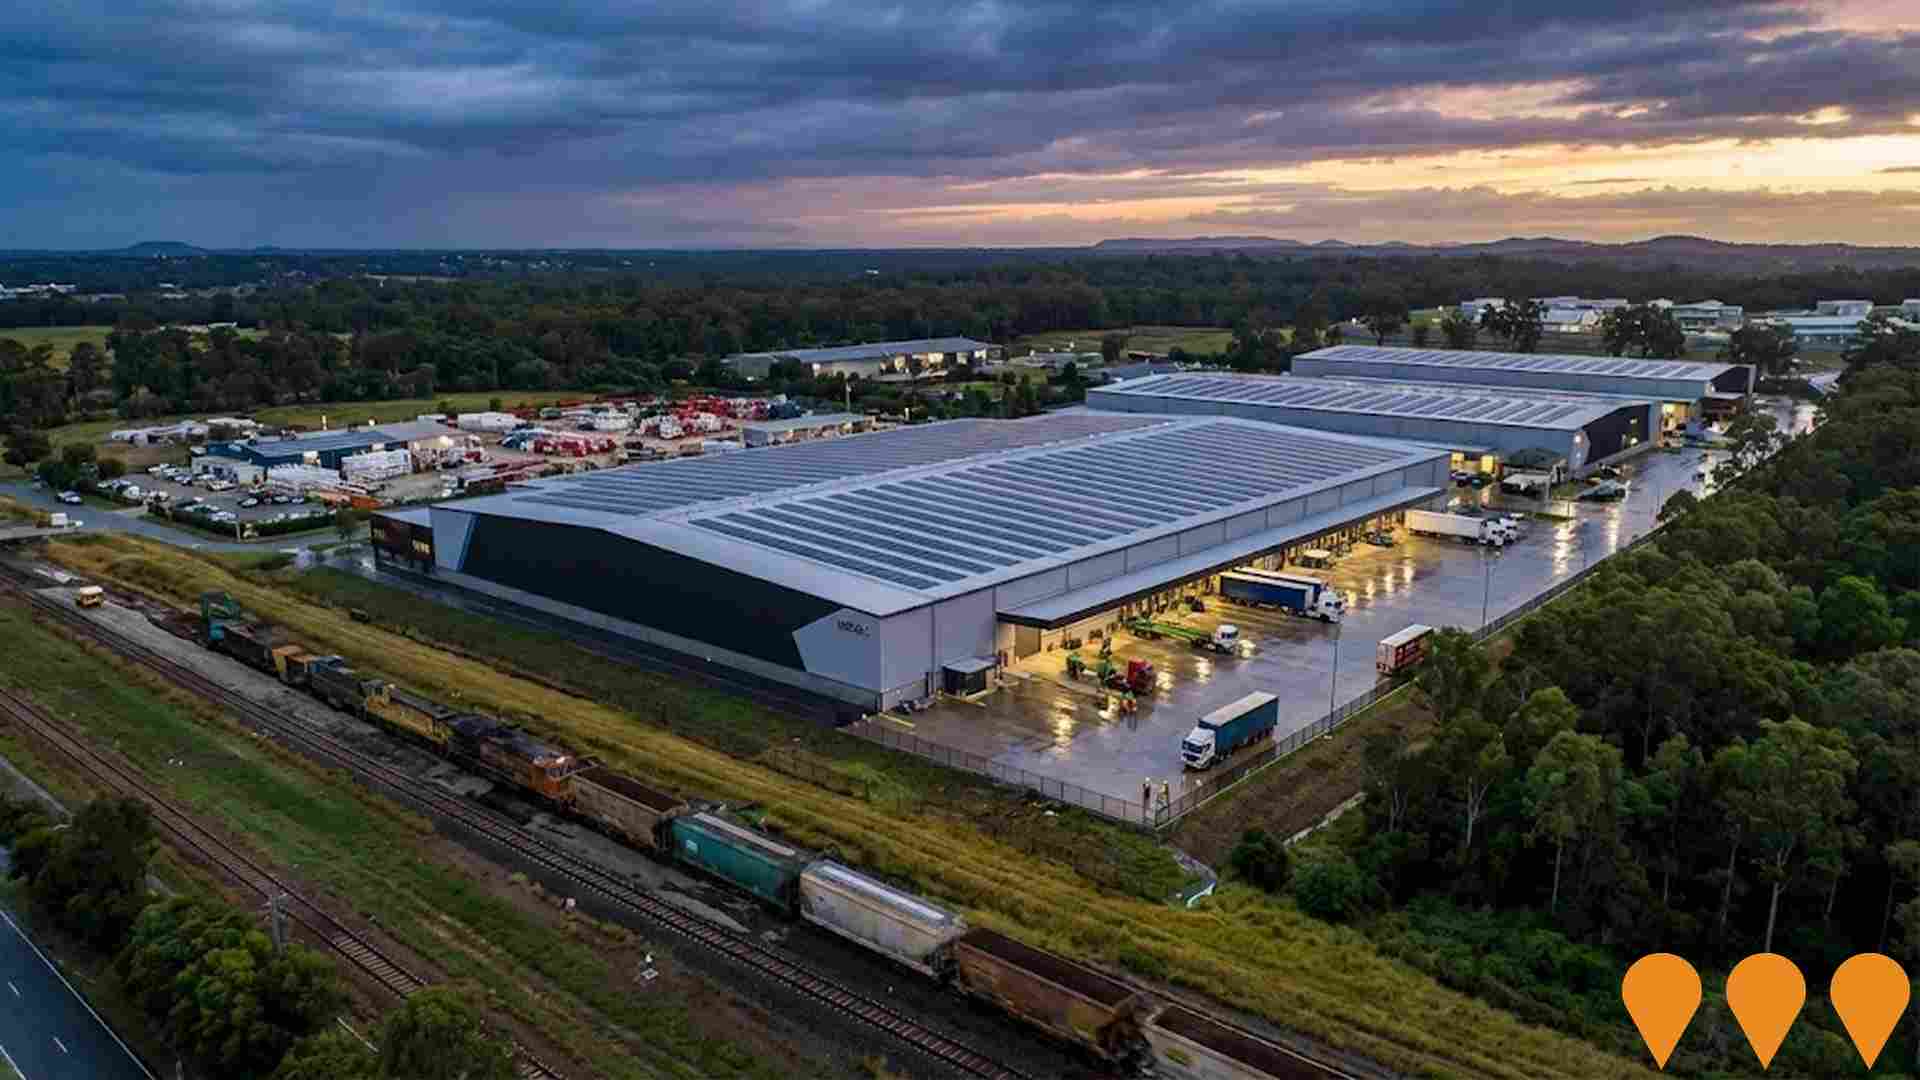
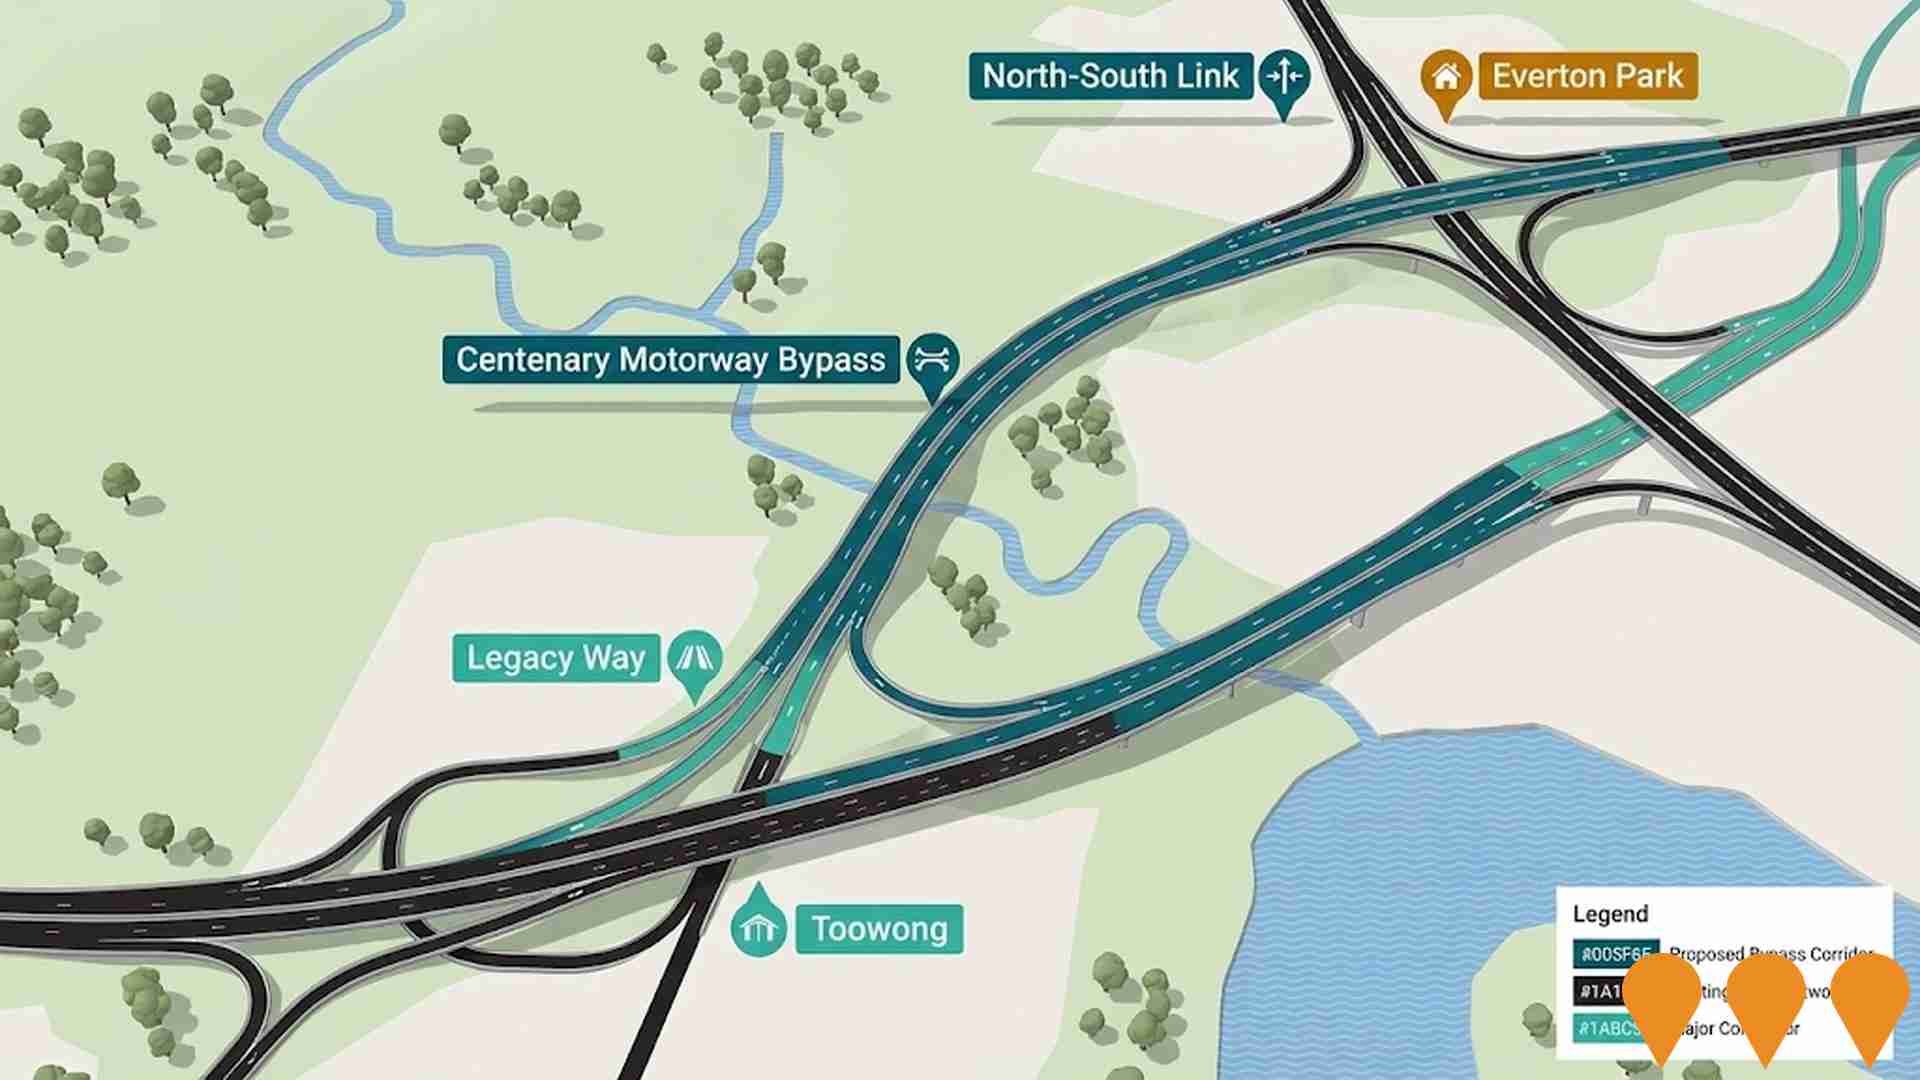
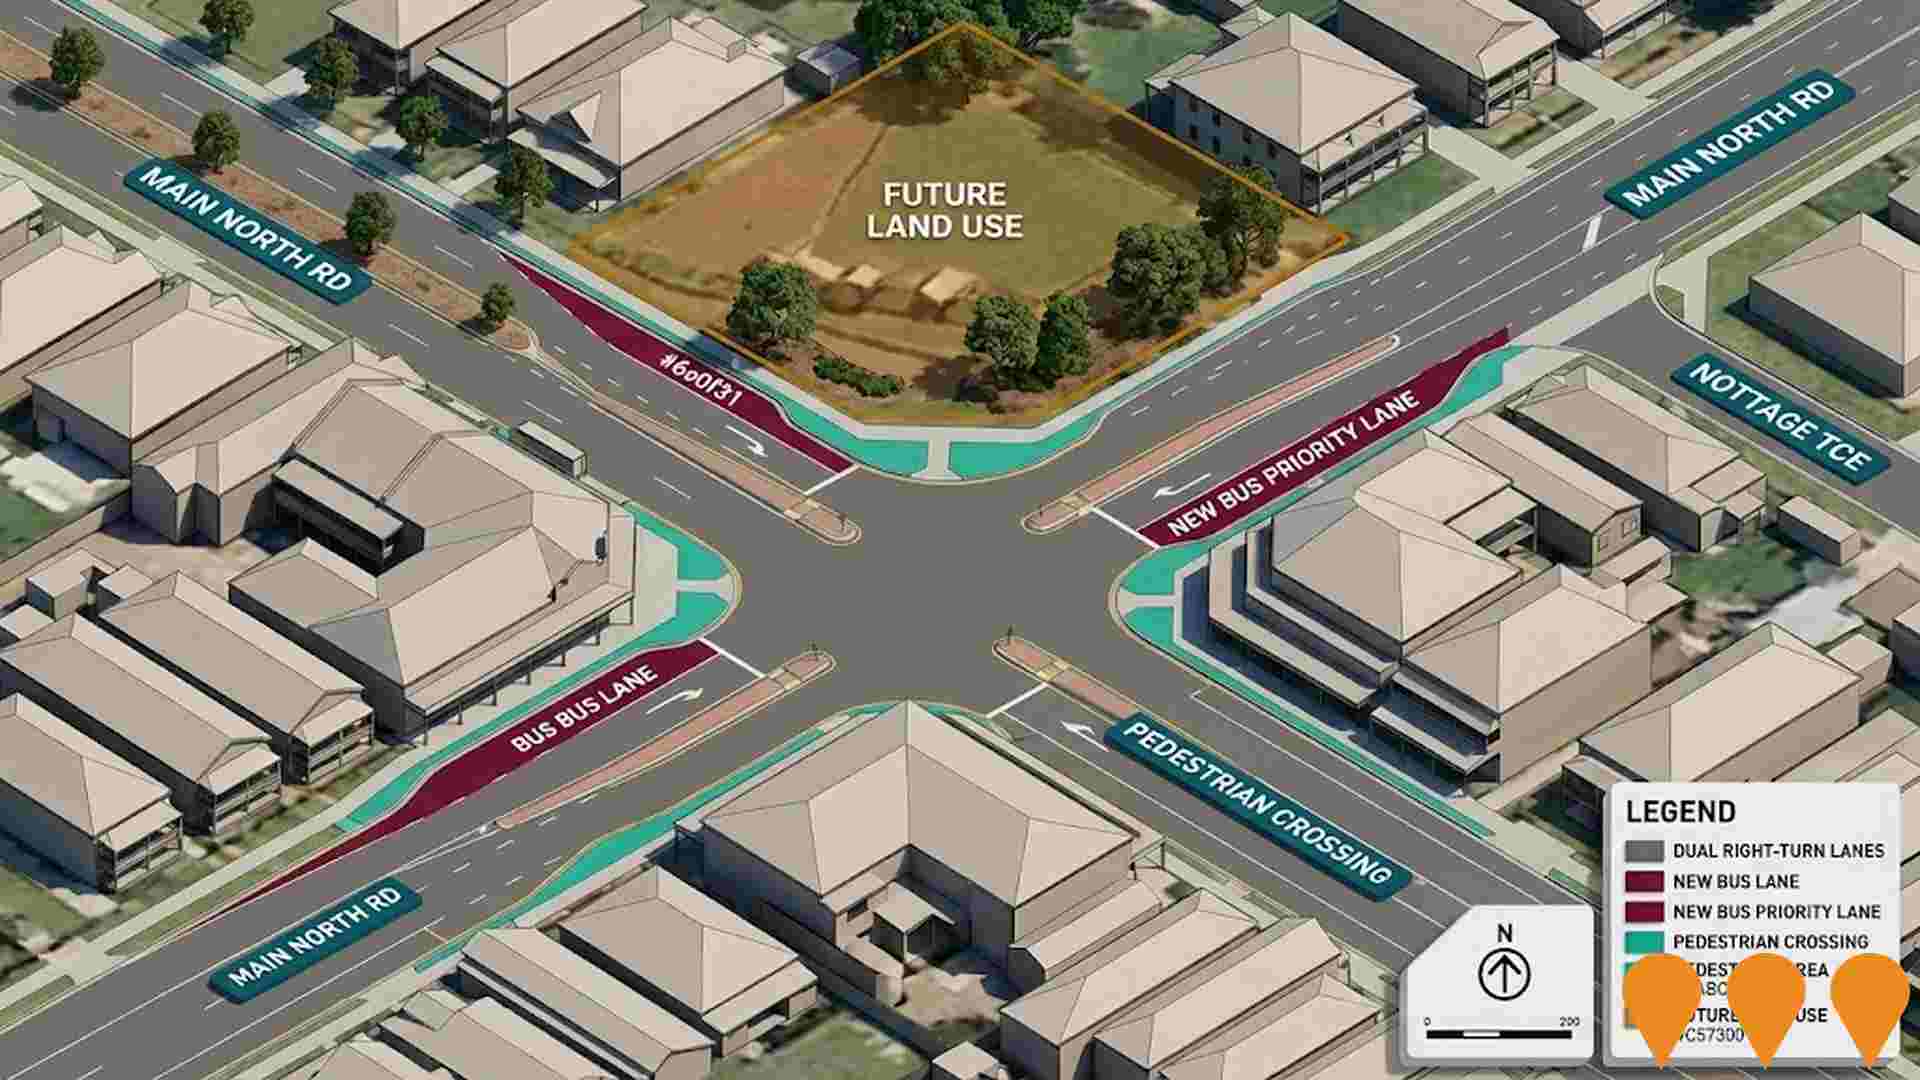
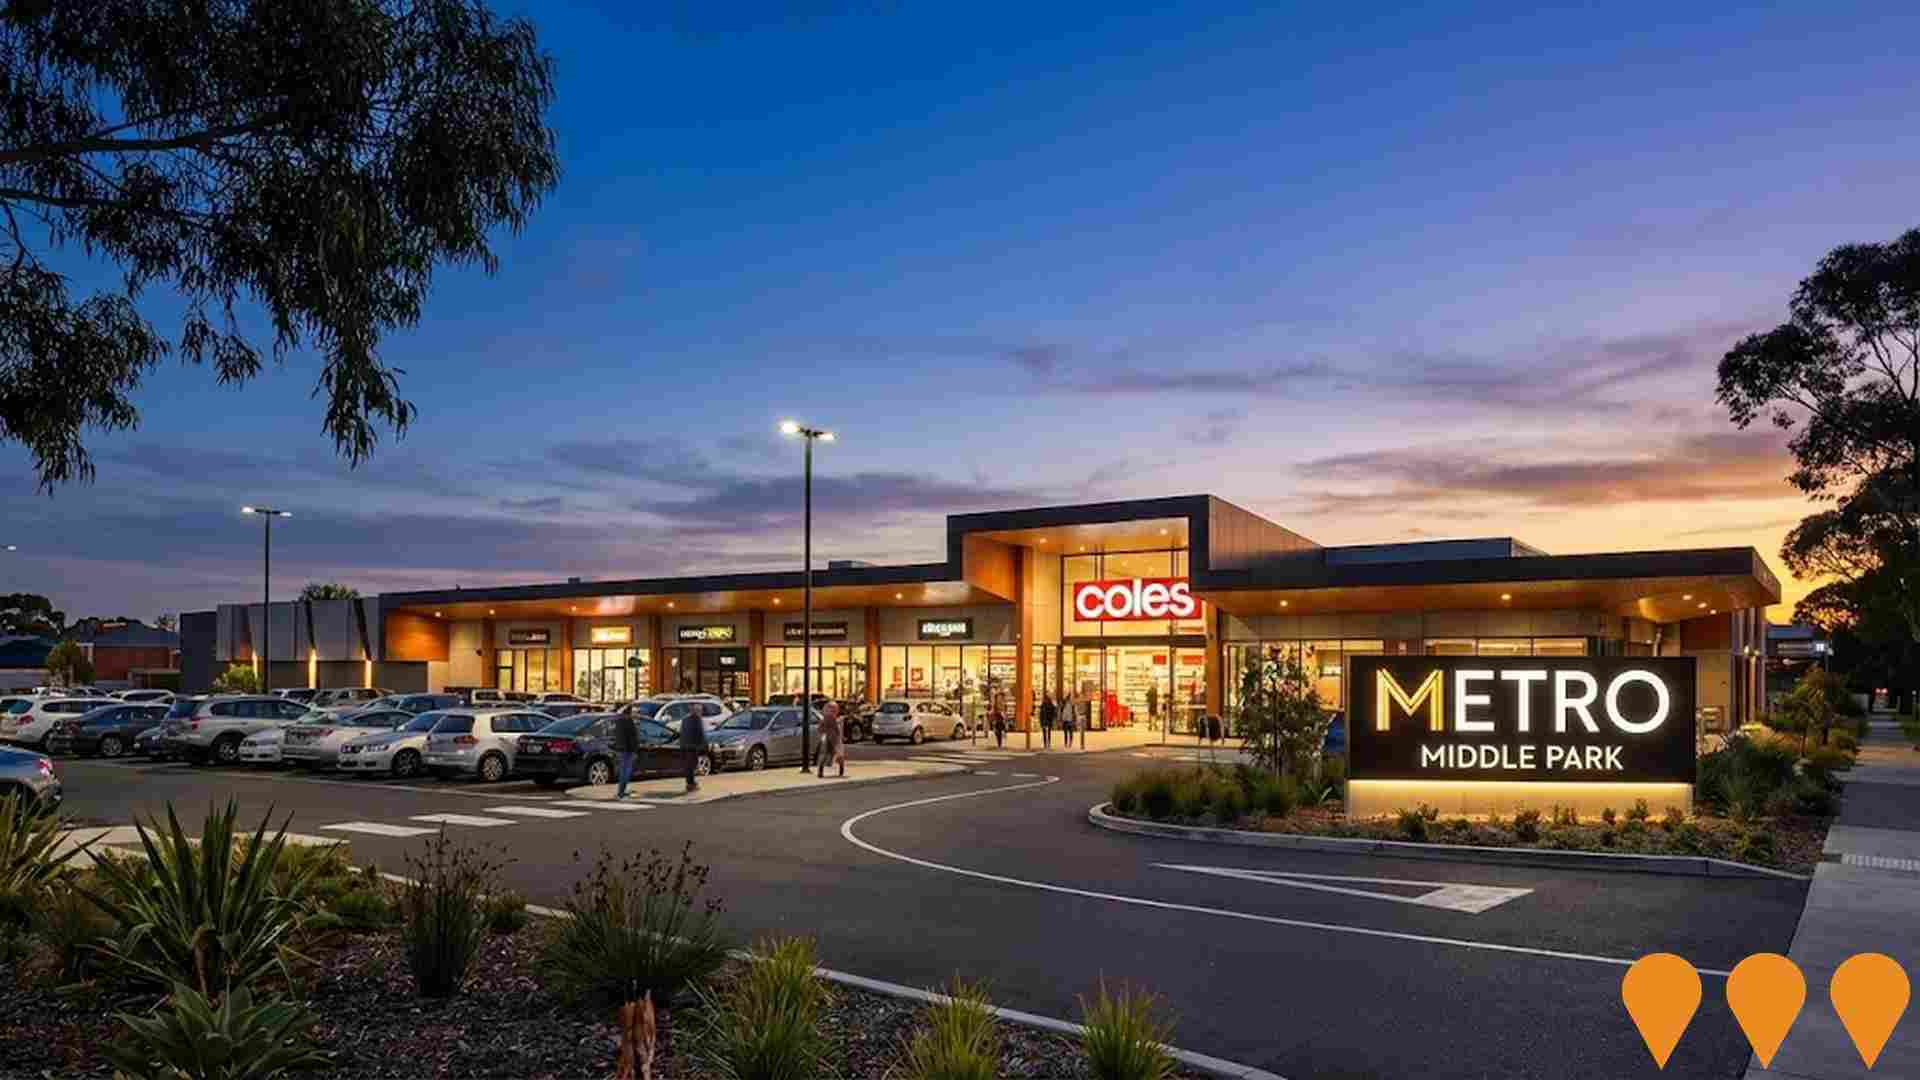
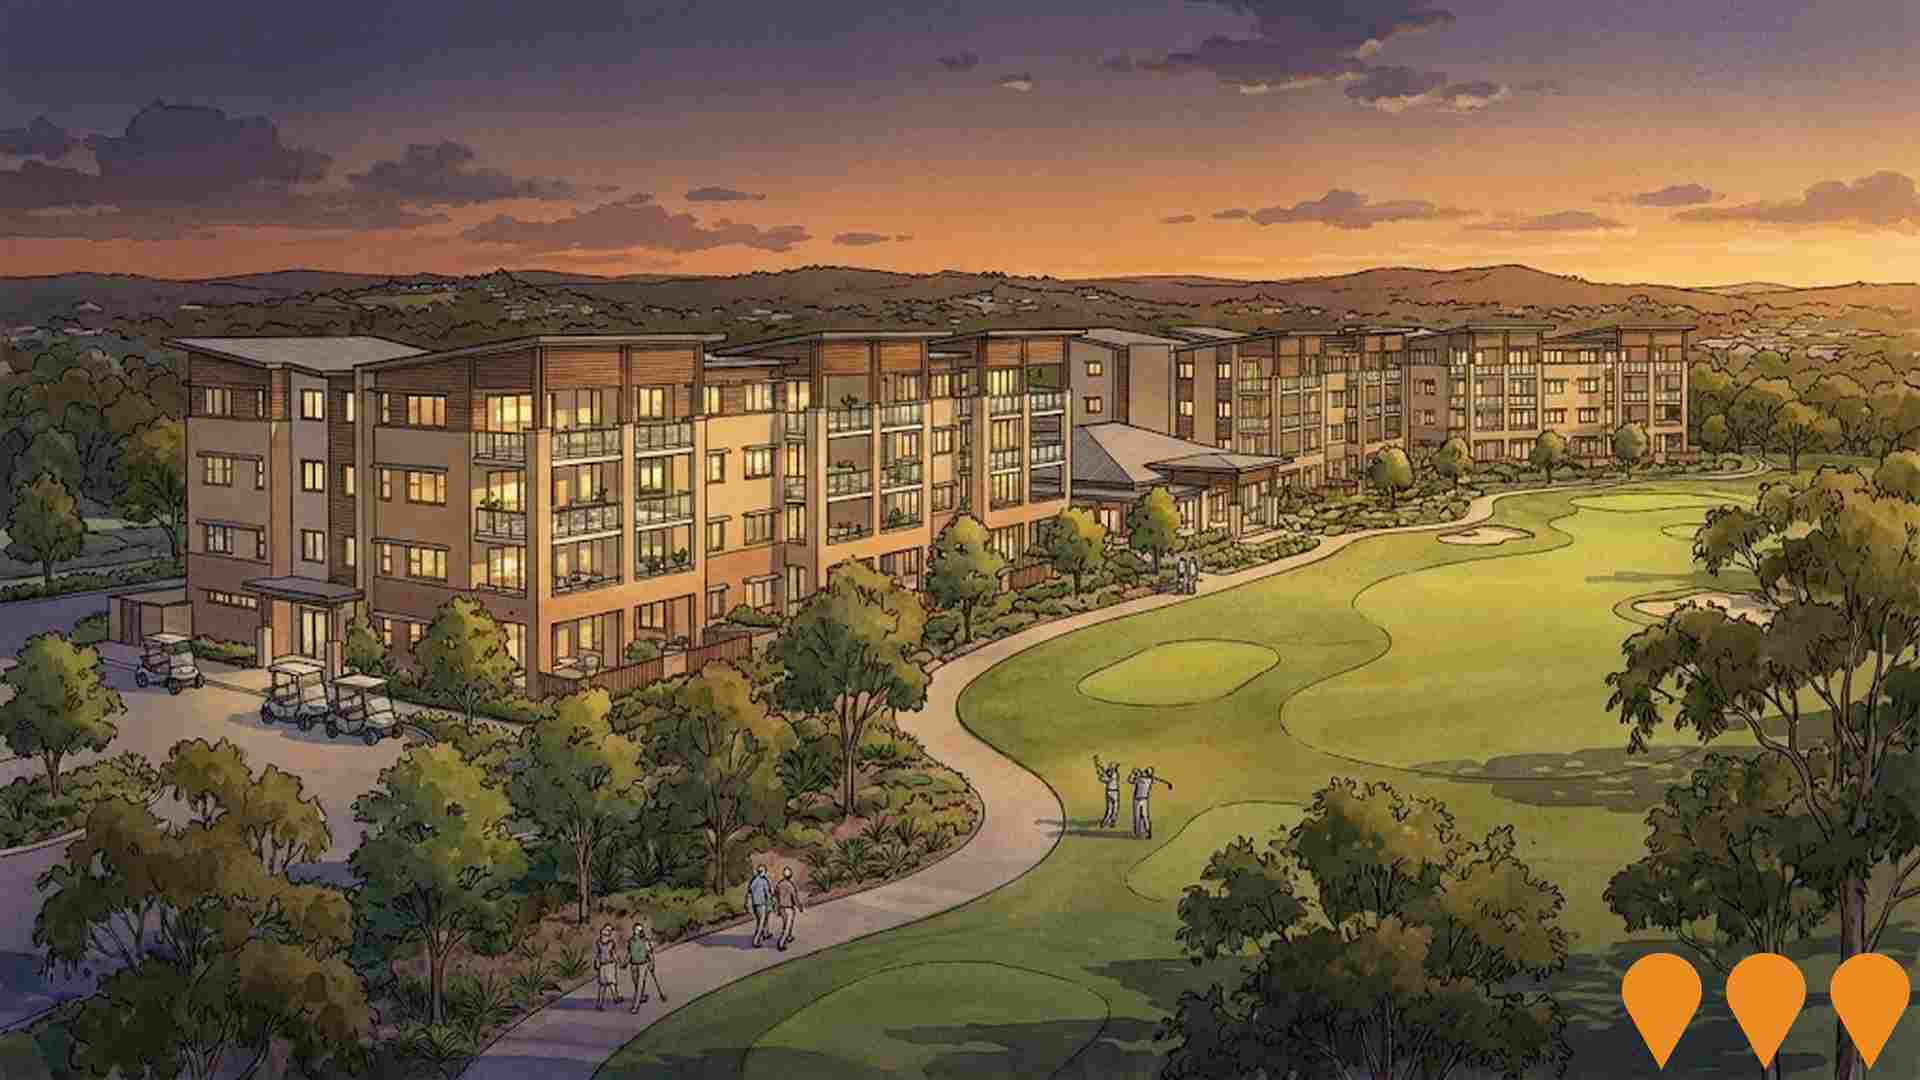
Changes to local infrastructure significantly impact an area's performance. AreaSearch has identified three projects that could affect this region. Key initiatives include Centenary Motorway Upgrade Planning, Middle Park Intersection Upgrade at Eumong Street/Riverhills Road, Metro Middle Park Mixed-Use Redevelopment, and McLeod Country Golf Club Retirement Village. The following list details those most relevant.
Professional plan users can use the search below to filter and access additional projects.
INFRASTRUCTURE SEARCH
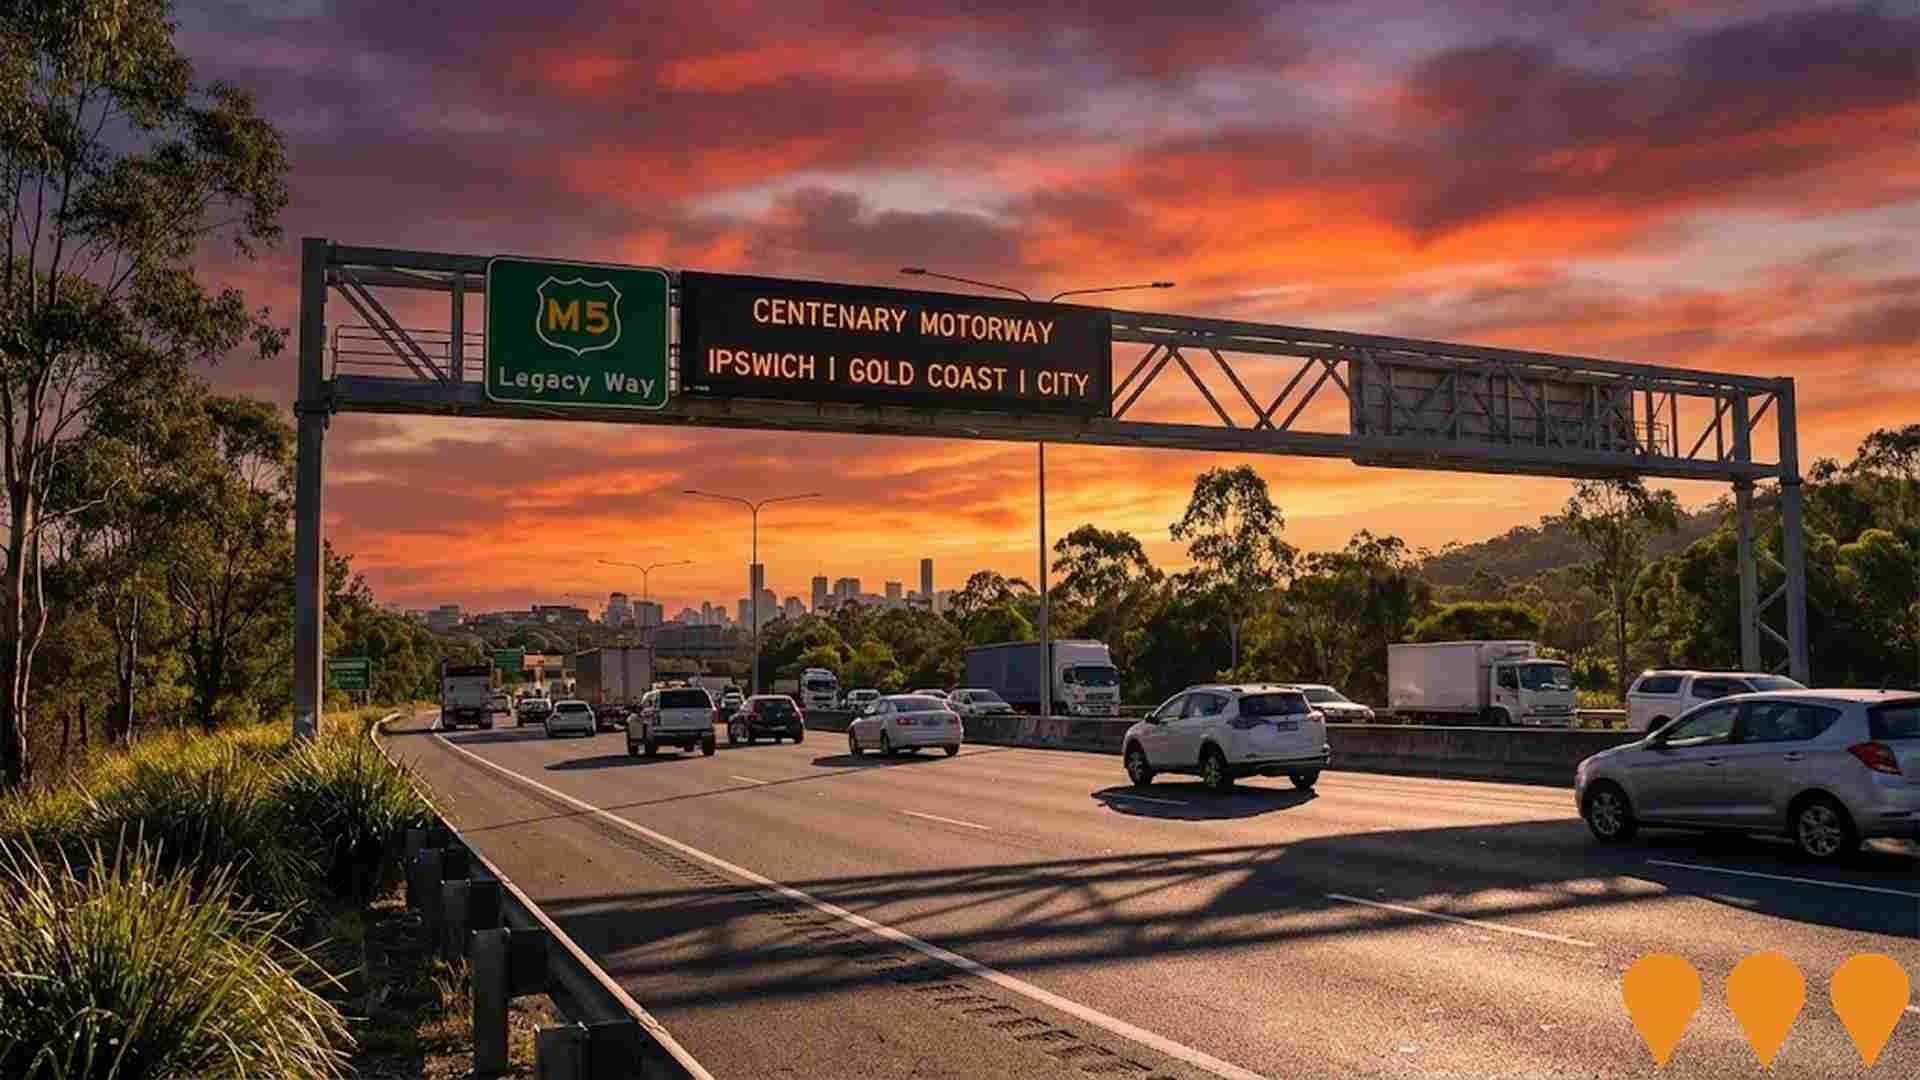
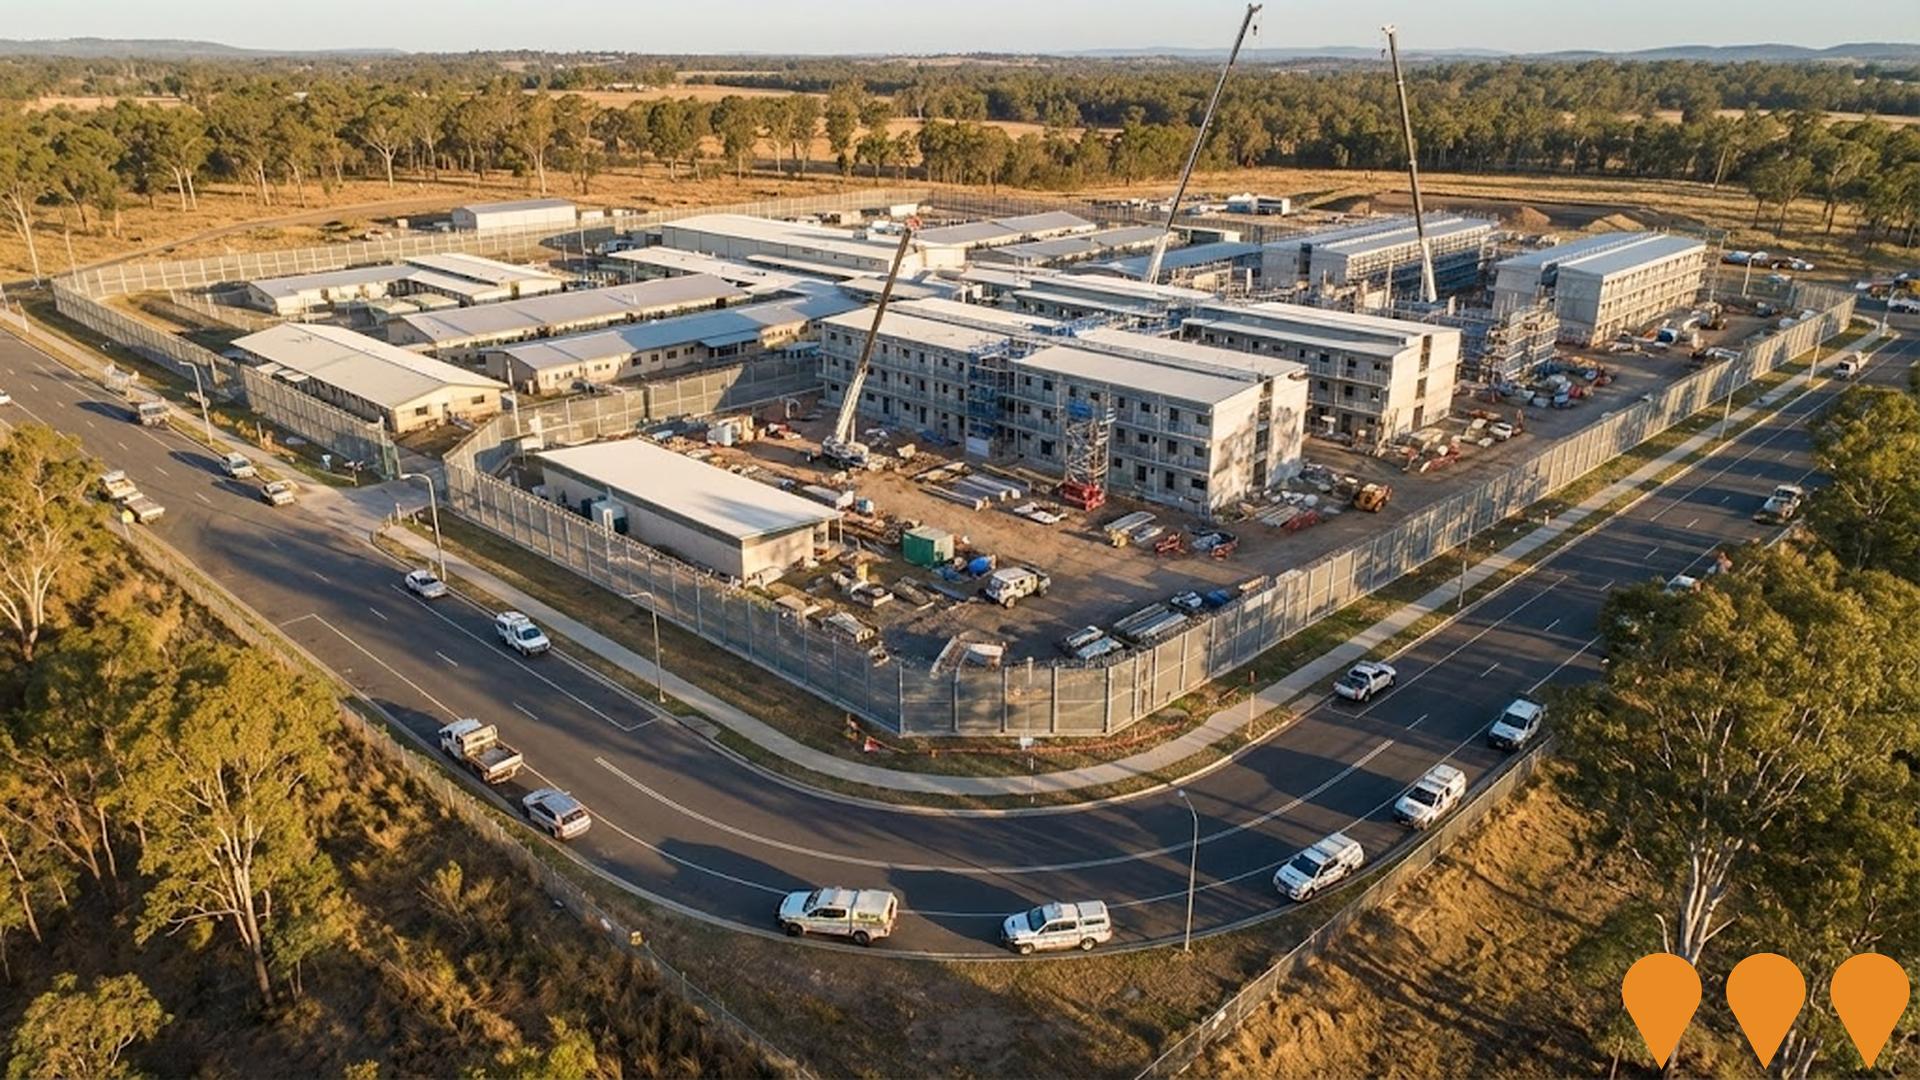
 Denotes AI-based impression for illustrative purposes only, not to be taken as definitive under any circumstances. Please follow links and conduct other investigations from the project's source for actual imagery. Developers and project owners wishing us to use original imagery please Contact Us and we will do so.
Frequently Asked Questions - Infrastructure
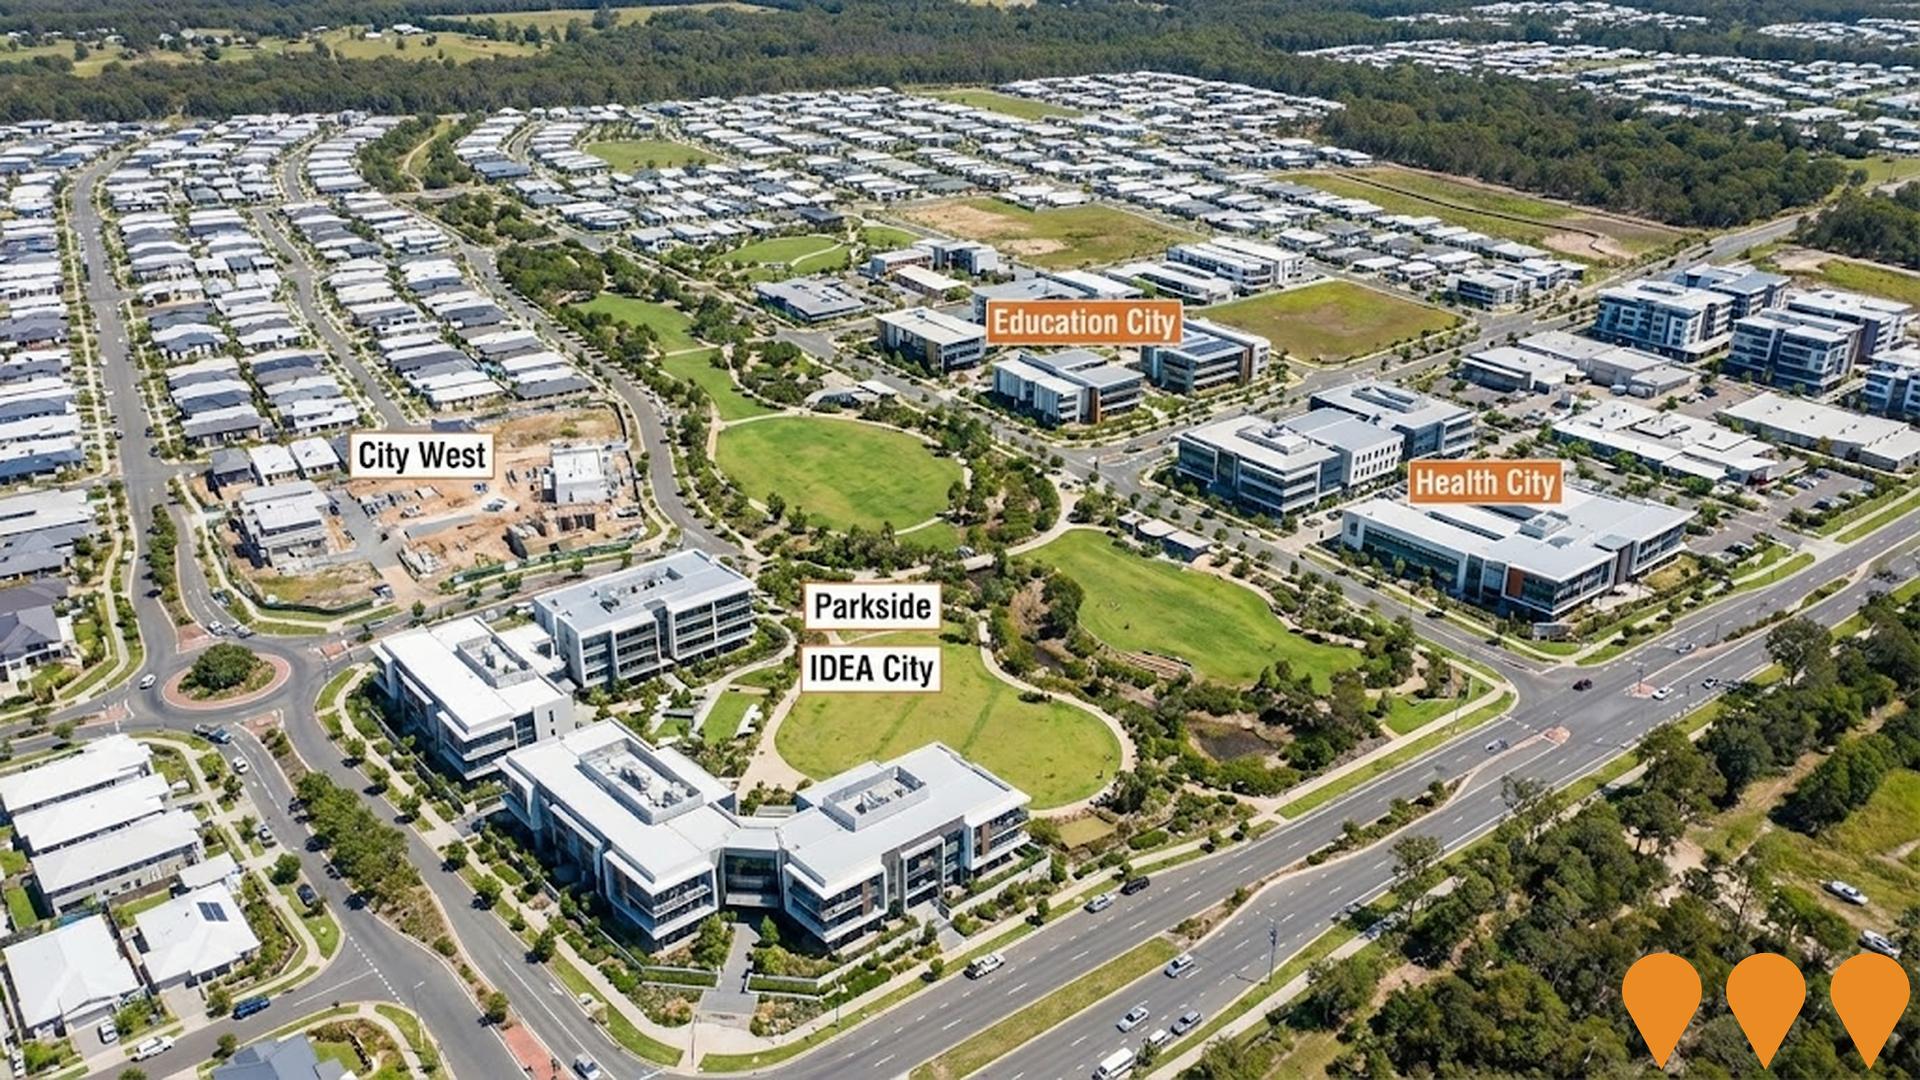
Greater Springfield Master Planned Community
Australia's largest master-planned community spanning 2,860 hectares in South-East Queensland. Currently home to over 55,000 residents (2025), the $88+ billion privately funded city is projected to reach 138,000 residents and 105,000 jobs by 2045. Key pillars include health, education, technology, and connectivity, with more than $20 billion invested to date. Ongoing construction across multiple residential, commercial, education, health and retail precincts.
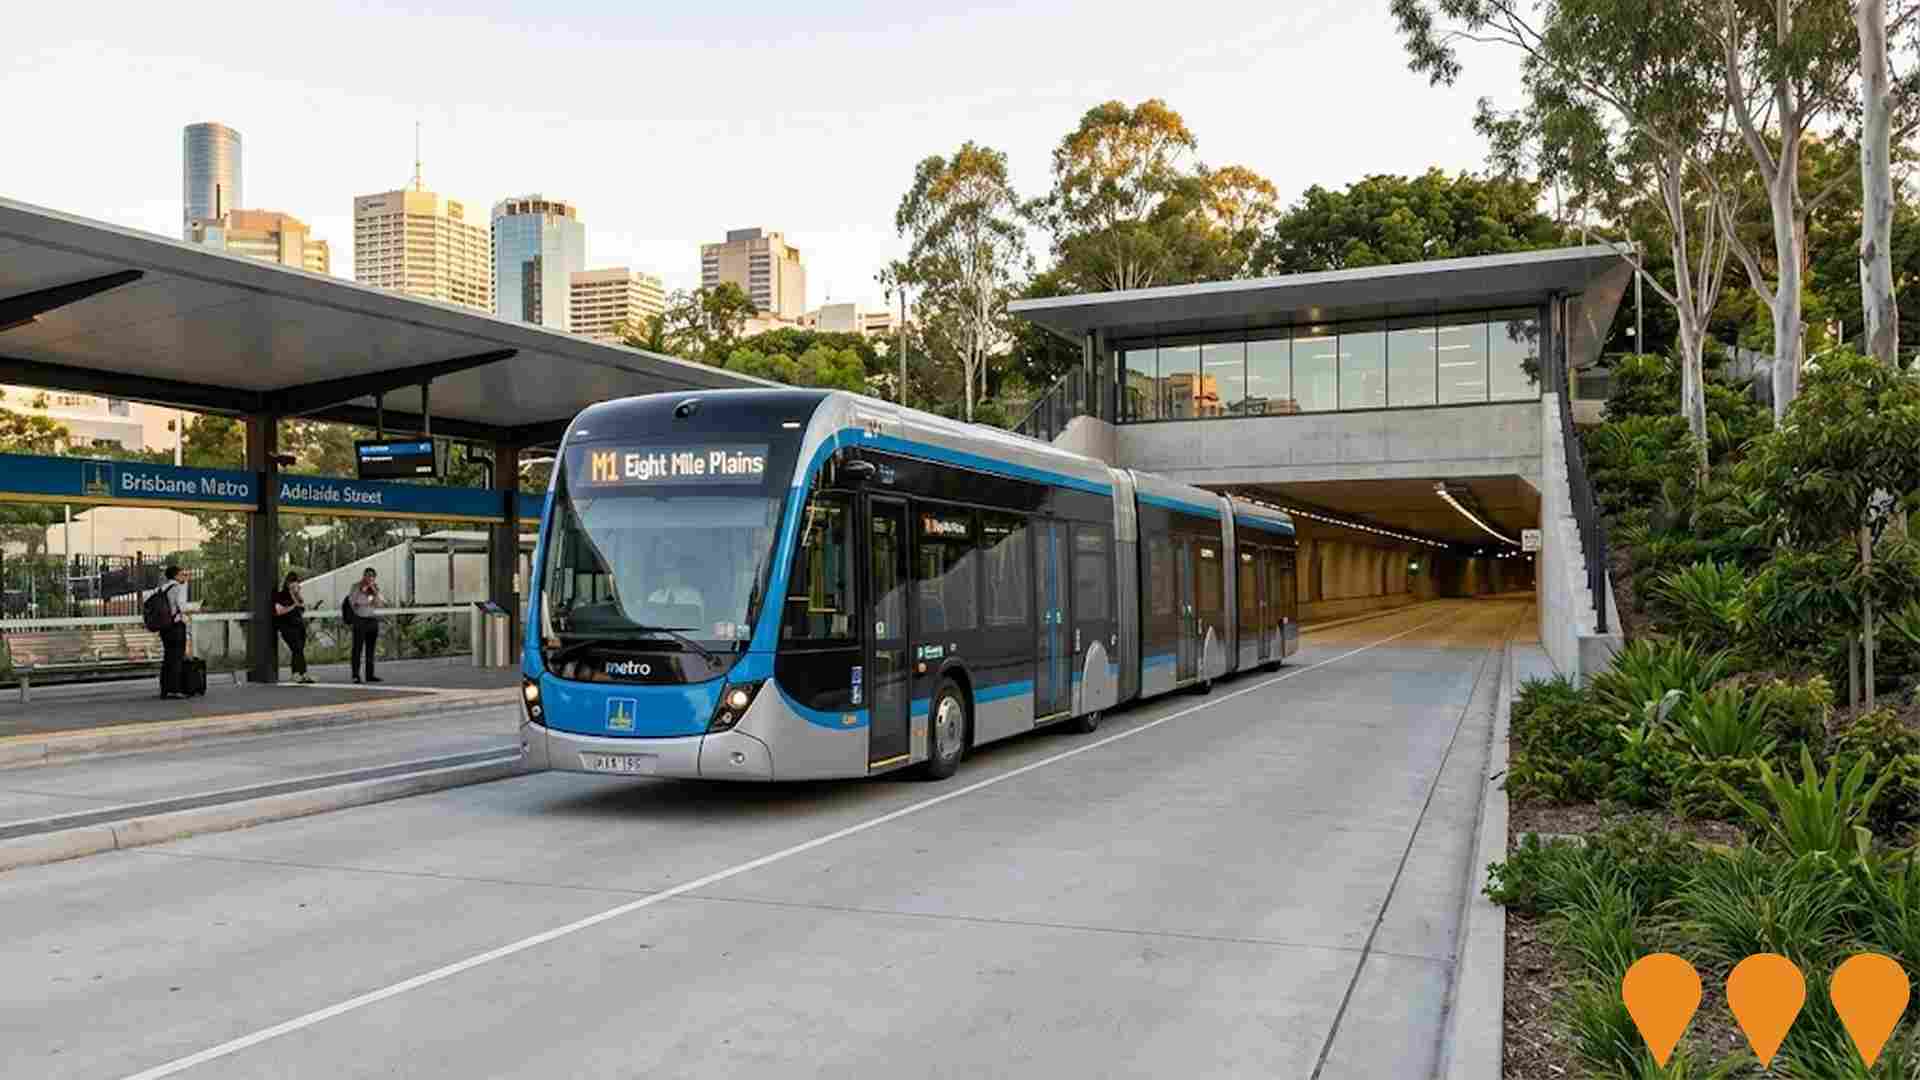
Brisbane Metro
High-capacity electric bus rapid transit system serving 21km of dedicated busways using 60 bi-articulated buses with 150-180 passenger capacity. Features two routes: M1 (Eight Mile Plains to Roma Street, operational June 2025) and M2 (RBWH to UQ Lakes, operational January 2025) serving 18 stations including 11 interchange stations. Includes new Adelaide Street tunnel, upgraded Victoria Bridge for pedestrians and active transport, and connections to Cross River Rail. Services every 3-5 minutes during peak periods with zero-emission vehicles and fast charging infrastructure.
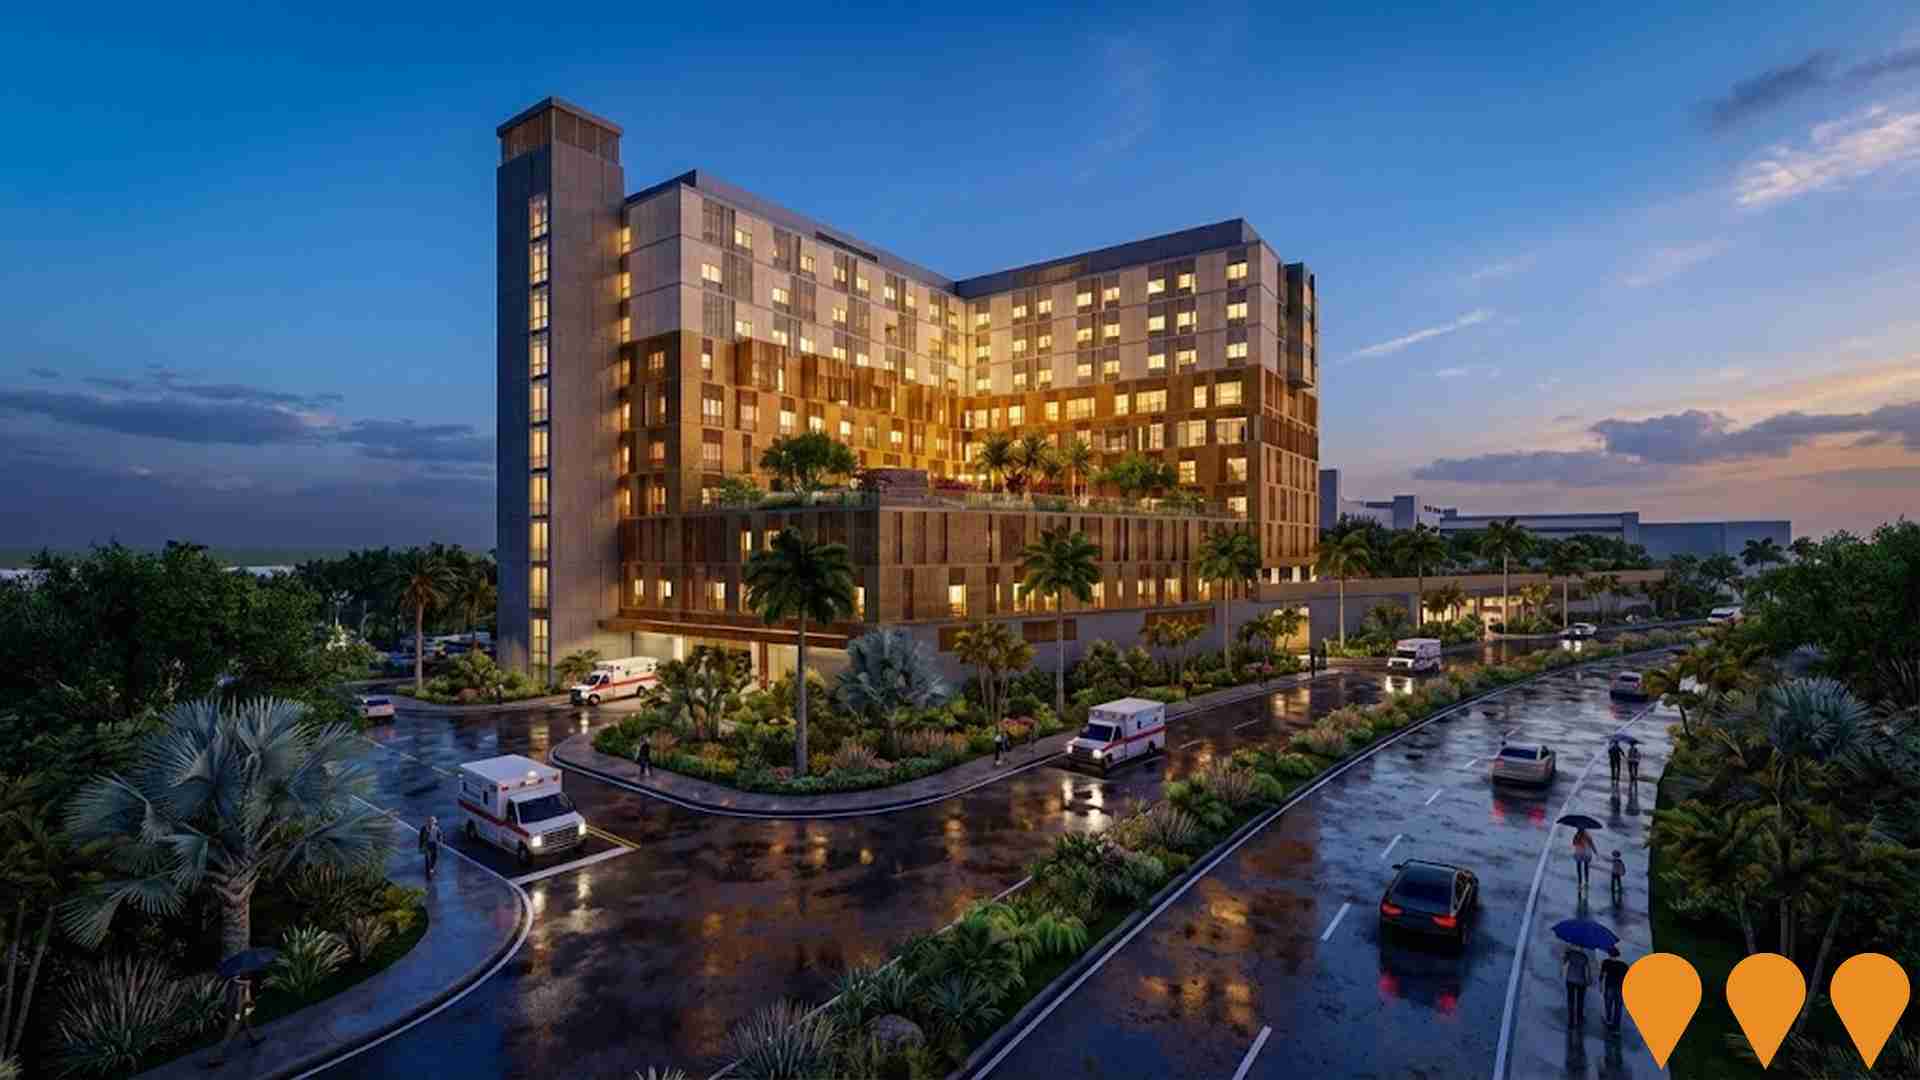
Building Future Hospitals Program
Queensland's flagship hospital infrastructure program delivering over 2,600 new and refurbished public hospital beds by 2031-32. Includes major expansions at Ipswich Hospital (Stage 2), Logan Hospital, Princess Alexandra Hospital, Townsville University Hospital, Gold Coast University Hospital and multiple new satellite hospitals and community health centres.
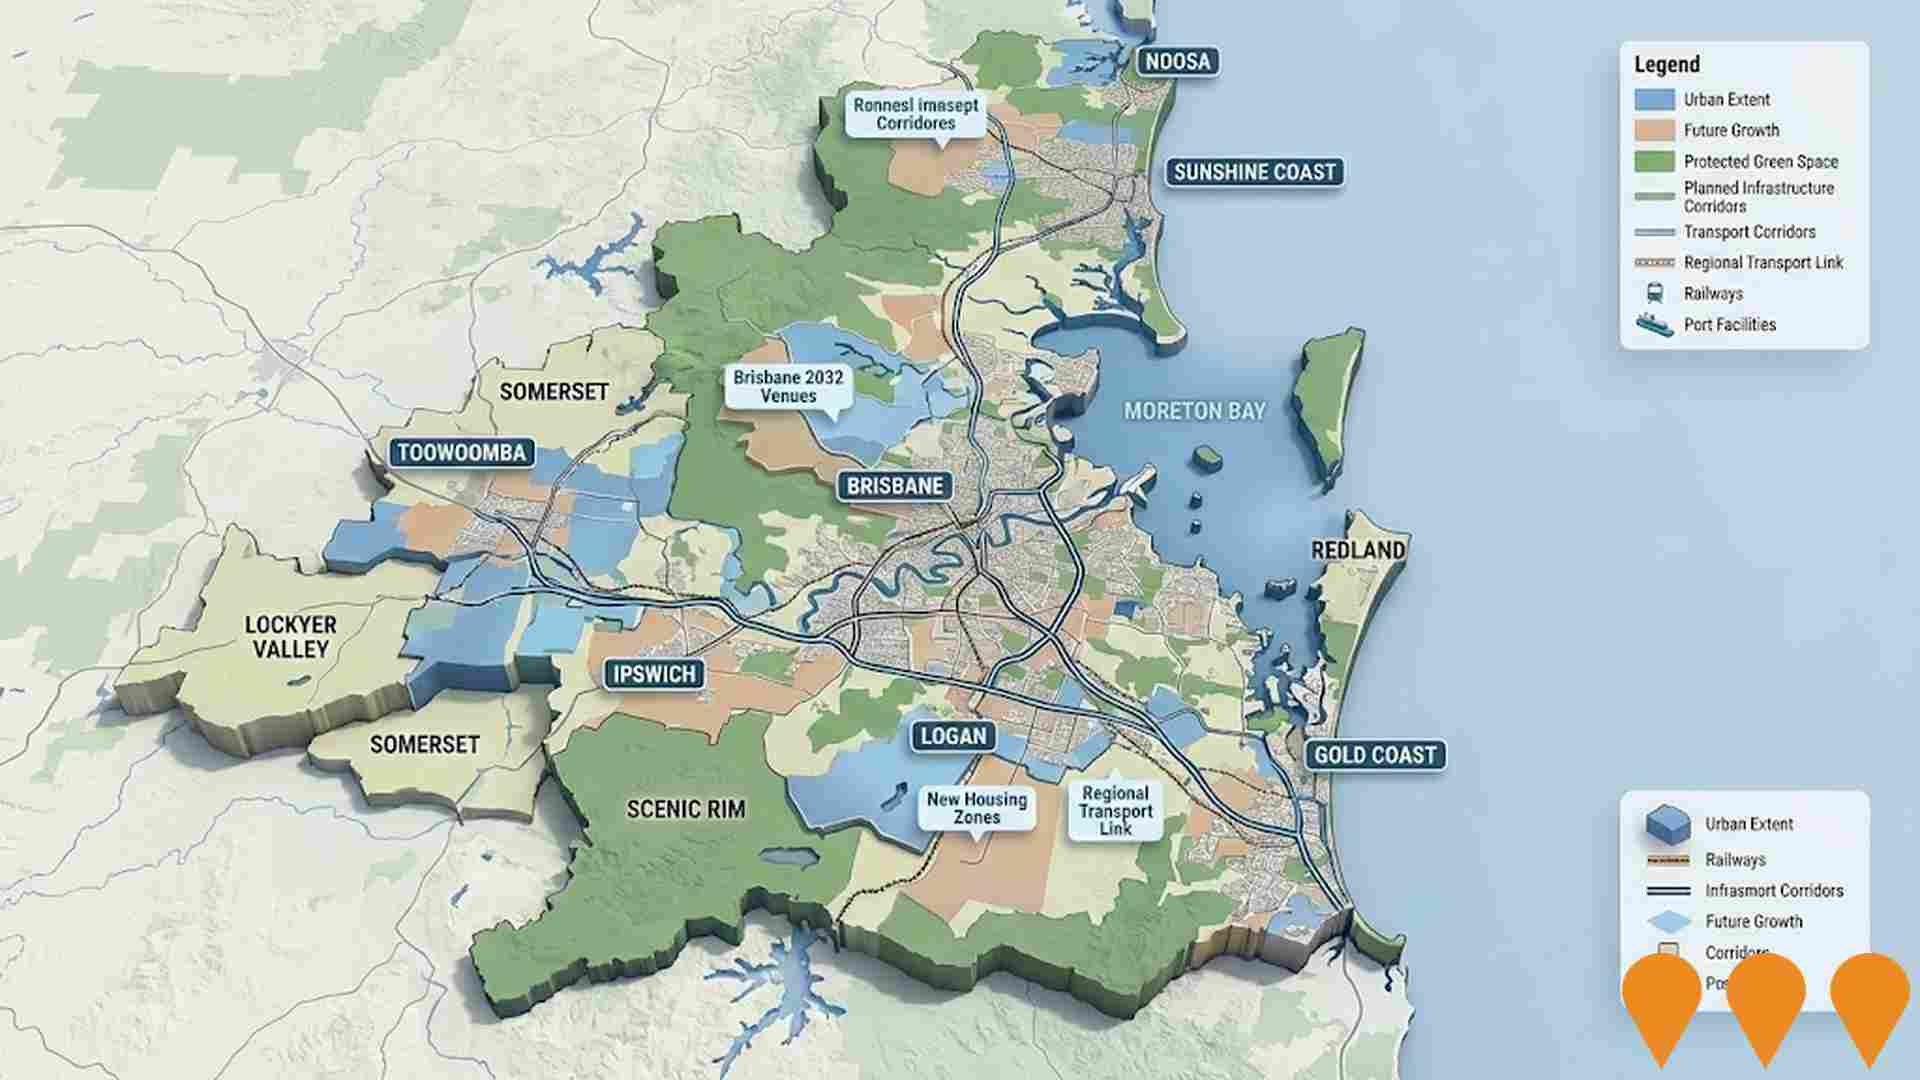
South East Queensland Infrastructure Plan and Supplement (SEQIP & SEQIS)
The South East Queensland Infrastructure Plan (SEQIP) and its accompanying Infrastructure Supplement (SEQIS) provide the strategic framework for infrastructure coordination across the SEQ region to 2046. The SEQIS specifically identifies priority infrastructure initiatives to support housing supply, economic growth and the delivery of the Brisbane 2032 Olympic and Paralympic Games, including transport, social infrastructure, and catalytic development projects.
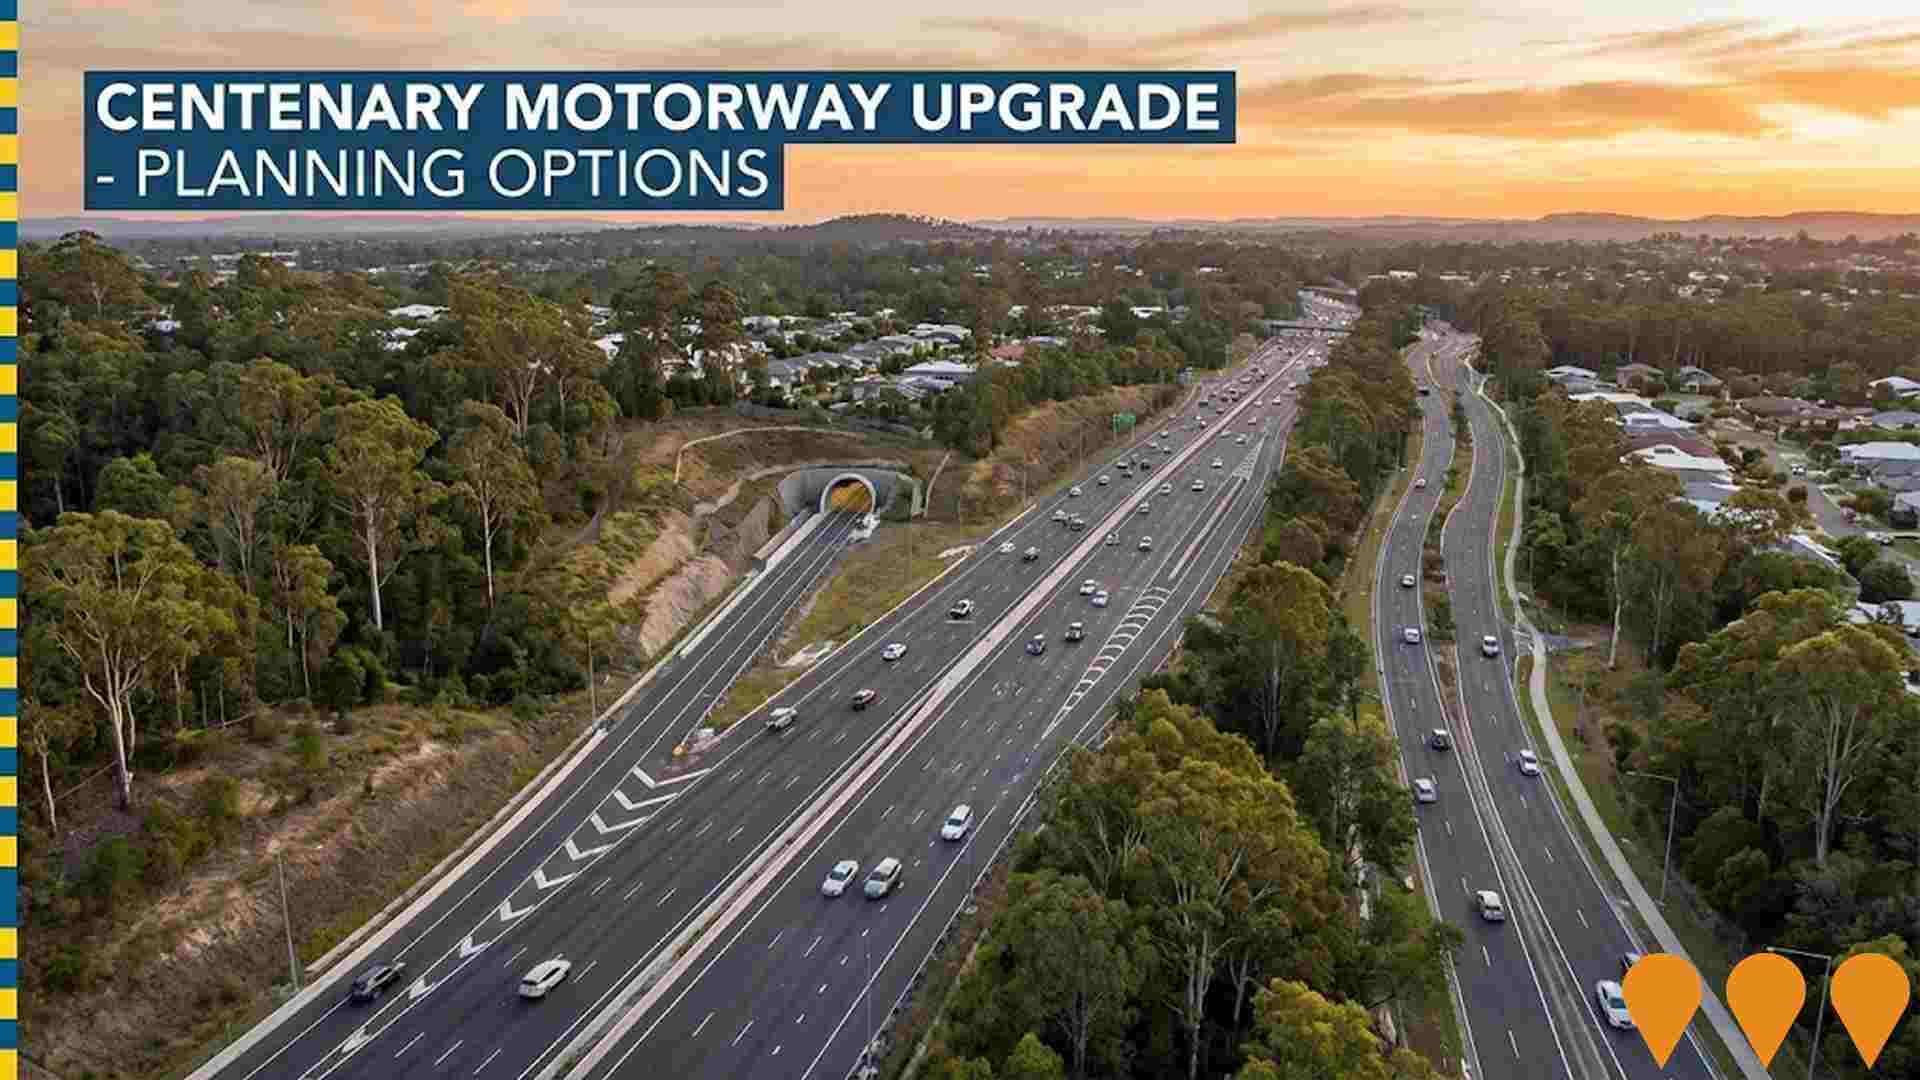
Centenary Motorway Upgrade Planning
The Queensland Department of Transport and Main Roads is developing a long-term corridor masterplan for the upgrade of the Centenary Motorway between Darra and Toowong. Two shortlisted options: Option 1 - a tunnel with targeted surface upgrades; Option 2 - widening of the existing motorway plus a new arterial road. The motorway serves high daily traffic volumes with significant forecasted growth. Masterplan finalisation expected in 2025, with community consultation on options in early-mid 2025. Upgrades to be delivered in stages subject to future funding. Separate to the ongoing Centenary Bridge Upgrade at Jindalee. Planning funded by $10 million from the Australian Government.
Ipswich to Springfield Central Public Transport Corridor (I2S)
The Ipswich to Springfield Central Public Transport Corridor (I2S) is a proposed 25 km dedicated mass transit corridor linking Ipswich Central and Springfield Central via Ripley and Redbank Plains. The project includes nine new stations and will support future growth in one of South East Queenslands fastest-growing regions. The Options Analysis was completed in late 2024. A Detailed Business Case, jointly funded by the Australian Government, Queensland Government and Ipswich City Council under the South East Queensland City Deal, is scheduled to commence in 2026. Delivery mode (heavy rail, trackless tram or other) and final alignment are still under investigation.

Logan West Upgrade
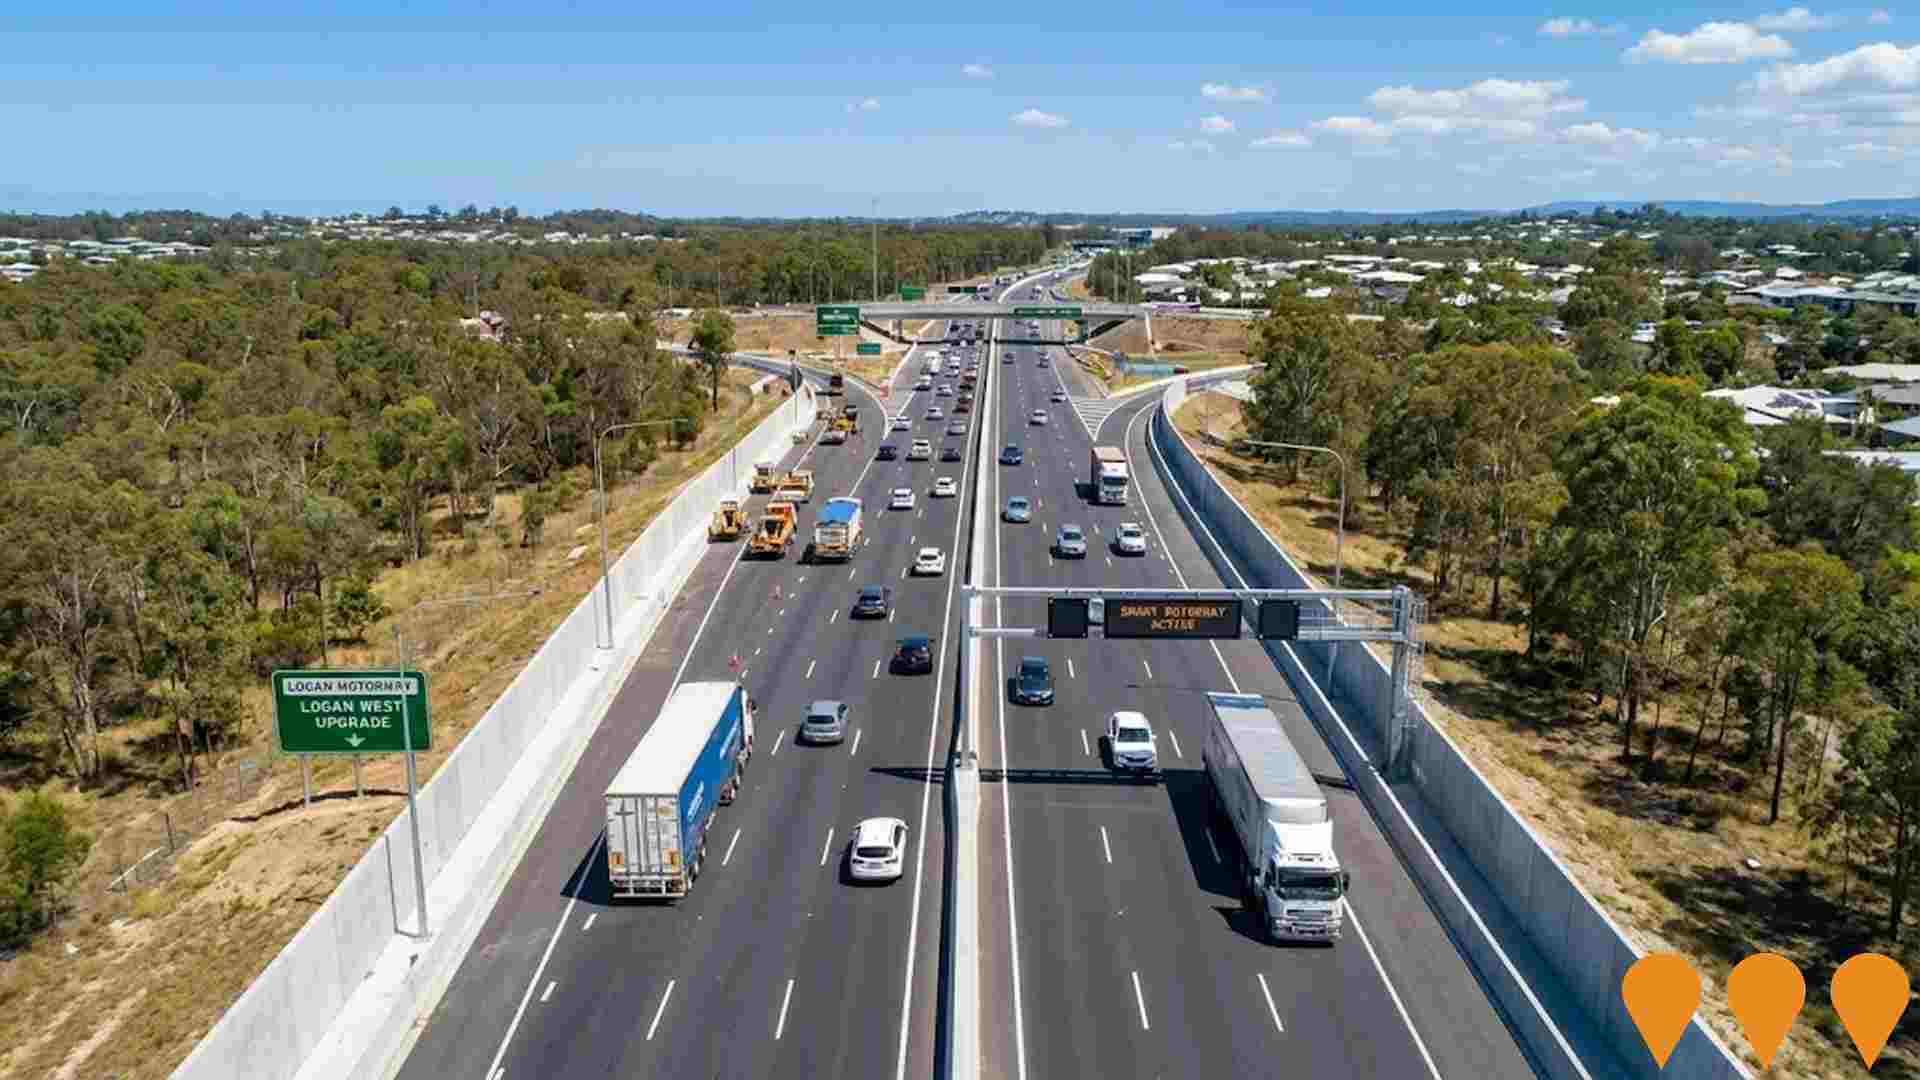
Major upgrade to the western section of the Logan Motorway in partnership with Transurban Queensland and the Queensland Government. Adds one additional lane in each direction along approximately 10-13km between the Centenary Highway and Mt Lindesay Highway, plus an extra westbound lane between Boundary Road and Formation Street. Includes upgrading the Formation Street interchange, installing smart motorway technologies, and increasing vehicle height capacity for over-dimensional vehicles. Expected to reduce peak travel times by up to 20 minutes, improve freight productivity on a route handling 210,000 daily trips, enhance safety, and support preparations for the 2032 Brisbane Olympics. Community consultation completed in 2024; construction targeted for completion before 2032.
Queensland Schools Infrastructure Program
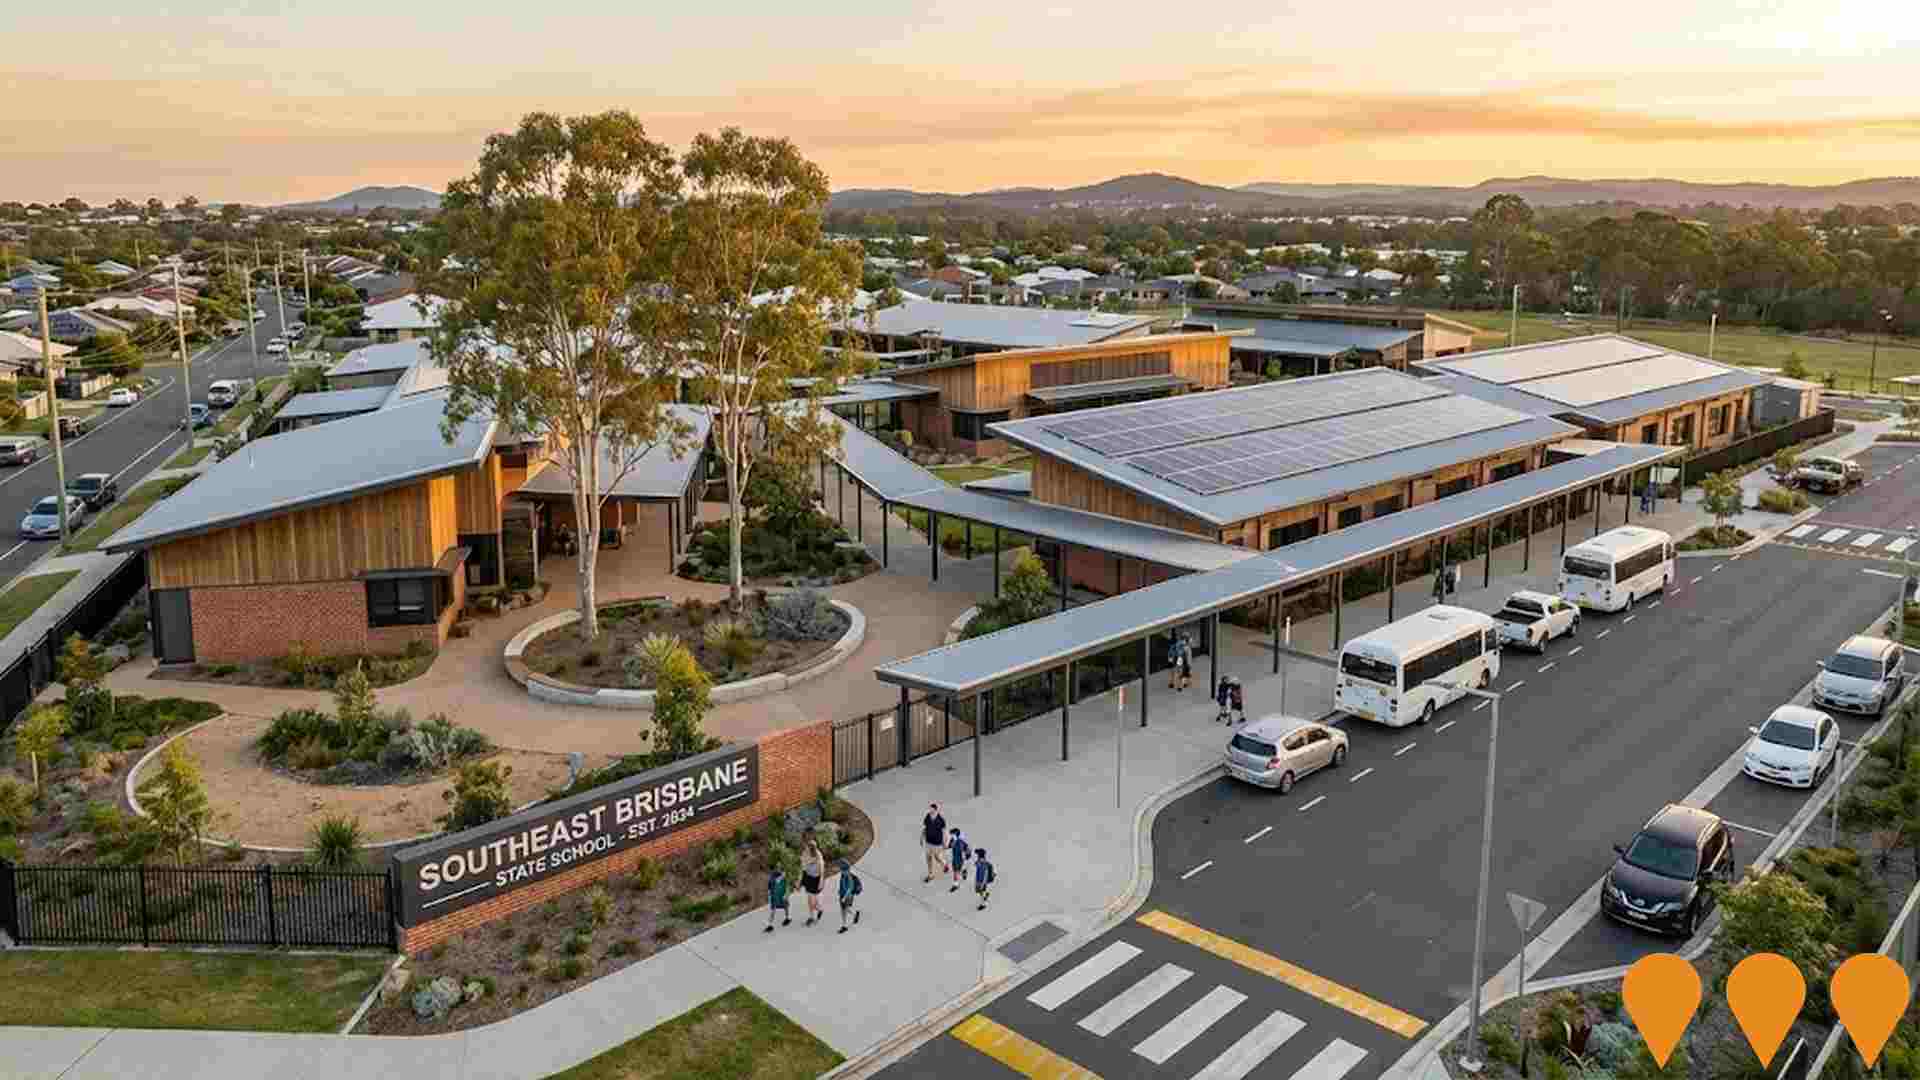
Ongoing $1.9 billion investment in state school infrastructure including new schools, expansions, and modernization across Queensland. Multiple projects planned for Southeast Brisbane to accommodate growing populations.
Employment
Employment conditions in Westlake demonstrate exceptional strength compared to most Australian markets
Westlake's workforce comprises highly educated individuals with significant representation in professional services. The unemployment rate in September 2025 was 2.2%.
At this time, 2,366 residents were employed at a rate of 1.8% lower than Greater Brisbane's 4.0%, while workforce participation was similar to Greater Brisbane's 64.5%. Key industries include health care & social assistance, education & training, and professional & technical services, with the latter being particularly strong at 1.4 times the regional level. Construction employs only 6.0% of local workers compared to Greater Brisbane's 9.0%. The predominantly residential area offers limited employment opportunities locally, as indicated by the difference between Census working population and resident population.
Over a 12-month period, Westlake's labour force decreased by 3.8%, with employment declining by 3.3%, resulting in an unemployment rate drop of 0.6 percentage points. In contrast, Greater Brisbane saw employment grow by 3.8% and labour force expand by 3.3%, while unemployment fell by 0.5 percentage points. State-level data from QLD to 25-Nov shows employment contracted by 0.01%, with an unemployment rate of 4.2%. Nationally, employment is forecast to grow by 6.6% over five years and 13.7% over ten years. Applying these projections to Westlake's employment mix suggests local employment should increase by 6.8% over five years and 14.0% over ten years.
Frequently Asked Questions - Employment
Income
The economic profile demonstrates exceptional strength, placing the area among the top 10% nationally based on comprehensive AreaSearch income analysis
AreaSearch's data for financial year 2022 indicates that Westlake SA2 has high national incomes. The median income is $63,624 and the average is $79,900. In contrast, Greater Brisbane has a median income of $55,645 and an average of $70,520. Based on Wage Price Index growth of 13.99% since financial year 2022, estimated incomes as of September 2025 are approximately $72,525 (median) and $91,078 (average). According to Census 2021 data, Westlake's incomes rank highly nationally, between the 79th and 93rd percentiles. The income bracket of $1,500 - 2,999 is dominant with 30.2% of residents. A significant 44.9% earn above $3,000 weekly. After housing costs, residents retain 89.0% of their income. Westlake's SEIFA income ranking places it in the 9th decile.
Frequently Asked Questions - Income
Housing
Westlake is characterized by a predominantly suburban housing profile, with above-average rates of outright home ownership
Westlake's dwelling structure, as per the latest Census, consisted of 96.9% houses and 3.1% other dwellings. In comparison, Brisbane metro had 91.4% houses and 8.6% other dwellings. Home ownership in Westlake was 44.0%, with mortgaged dwellings at 44.8% and rented ones at 11.2%. The median monthly mortgage repayment in Westlake was $2,275, higher than Brisbane metro's $2,000. The median weekly rent in Westlake was $550, compared to Brisbane metro's $450. Nationally, Westlake's mortgage repayments were significantly higher at $2,275 versus Australia's average of $1,863, and rents were substantially above the national figure of $375.
Frequently Asked Questions - Housing
Household Composition
Westlake features high concentrations of family households, with a higher-than-average median household size
Family households comprise 88.1% of all households, including 47.2% couples with children, 31.7% couples without children, and 8.3% single parent families. Non-family households account for 11.9%, with lone person households at 10.4% and group households making up 1.5%. The median household size is 3.0 people, larger than the Greater Brisbane average of 2.8.
Frequently Asked Questions - Households
Local Schools & Education
The educational profile of Westlake exceeds national averages, with above-average qualification levels and academic performance metrics
Westlake's educational attainment exceeds broader standards significantly. Among residents aged 15+, 44.9% hold university qualifications, compared to Queensland's 25.7% and Australia's 30.4%. Bachelor degrees are the most common at 28.7%, followed by postgraduate qualifications (12.3%) and graduate diplomas (3.9%). Vocational credentials are also prevalent, with 25.4% of residents aged 15+ holding them; advanced diplomas account for 11.3% and certificates for 14.1%.
Educational participation is high, with 29.7% currently enrolled in formal education. This includes 9.7% in primary education, 8.8% in secondary education, and 6.7% pursuing tertiary education.
Frequently Asked Questions - Education
Schools Detail
Nearby Services & Amenities
Transport
Transport servicing is low compared to other areas nationally based on assessment of service frequency, route connectivity and accessibility
The analysis of public transportation in Westlake shows that there are eight active transport stops currently operating. These stops serve a mix of bus routes, with four individual routes providing service. In total, these routes facilitate 271 weekly passenger trips.
The accessibility of transport in the area is rated as good, with residents typically located 303 meters from their nearest transport stop. On average, there are 38 trips per day across all routes, which equates to approximately 33 weekly trips per individual stop.
Frequently Asked Questions - Transport
Transport Stops Detail
Health
Westlake's residents are extremely healthy with very low prevalence of common health conditions across all age groups
Analysis shows Westlake's health metrics are strong across all age groups with low prevalence of common conditions.
Private health cover is high at approximately 60%, covering 2705 people. The most common conditions are asthma (7.4%) and arthritis (6.5%), while 71.9% report no medical ailments, compared to Greater Brisbane's 71.2%. Westlake has 22.1% seniors (1001 people), higher than Greater Brisbane's 20.4%. Seniors' health outcomes are strong, performing better than the general population in health metrics.
Frequently Asked Questions - Health
Cultural Diversity
Westlake was found to be more culturally diverse than the vast majority of local markets in Australia, upon assessment of a range of language and cultural background related metrics
Westlake's population showed high cultural diversity, with 26.0% speaking a language other than English at home and 36.6% born overseas. Christianity was the predominant religion in Westlake, accounting for 51.0% of its population. Notably, Judaism comprised 0.3%, higher than Greater Brisbane's 0.2%.
The top three ancestral groups were English (25.7%), Australian (19.3%), and Other (9.9%). Some ethnic groups had notable differences: Vietnamese at 3.0% compared to the regional 2.6%, Sri Lankan at 0.6% versus 0.5%, and Russian at 0.5% against Greater Brisbane's 0.4%.
Frequently Asked Questions - Diversity
Age
Westlake's median age exceeds the national pattern
The median age in Westlake is 43 years, which is significantly higher than Greater Brisbane's average of 36 years and Australia's average of 38 years. The 65-74 age group comprises 13.2% of the population in Westlake, compared to a lower percentage in Greater Brisbane. Conversely, the 25-34 age group makes up only 5.7% of Westlake's population. Post-2021 Census data shows that the 75 to 84 age group grew from 4.5% to 7.2%, while the 15 to 24 cohort increased from 11.9% to 13.8%. However, the 25 to 34 cohort declined from 8.2% to 5.7%, and the 55 to 64 group dropped from 15.9% to 13.6%. By 2041, population forecasts indicate that Westlake's 75 to 84 age group will grow by 46%, reaching 478 people from 327. The combined 65+ age groups are expected to account for 95% of the total population growth, reflecting Westlake's aging demographic profile. In contrast, the 15 to 24 and 0 to 4 age cohorts are projected to experience population declines.
