Chart Color Schemes
This analysis uses ABS Statistical Areas Level 2 (SA2) boundaries, which can materially differ from Suburbs and Localities (SAL) even when sharing similar names.
SA2 boundaries are defined by the Australian Bureau of Statistics and are designed to represent communities for statistical reporting (e.g., census and ERP).
Suburbs and Localities (SAL) represent commonly-used suburb/locality names (postal-style areas) and may use different geographic boundaries. For comprehensive analysis, consider reviewing both boundary types if available.
est. as @ -- *
ABS ERP | -- people | --
2021 Census | -- people
Sales Activity
Curious about local property values? Filter the chart to assess the volume and appreciation (including resales) trends and regional comparisons, or scroll to the map below view this information at an individual property level.
Find a Recent Sale
Sales Detail
Population
Warnervale - Wadalba lies within the top 10% of areas nationally in terms of population growth performance according to AreaSearch analysis of short and medium-term trends
Warnervale-Wadalba's population was around 22,872 as of November 2025. This figure reflects an increase of 2,821 people since the 2021 Census, which reported a population of 20,051. The growth is inferred from ABS data showing an estimated resident population of 22,353 in June 2024 and an additional 768 validated new addresses since the Census date. This results in a density ratio of 533 persons per square kilometer. Warnervale-Wadalba's growth rate of 14.1% since the 2021 census exceeded both its SA4 region (3.1%) and SA3 area, indicating it as a growth leader. Interstate migration contributed approximately 72.0% to overall population gains during recent periods.
AreaSearch uses ABS/Geoscience Australia projections for each SA2 area released in 2024 with 2022 as the base year. For areas not covered by this data, NSW State Government's SA2 level projections released in 2022 with 2021 as the base year are used. Growth rates by age group from these aggregations are applied to all areas for years 2032 to 2041. Future trends predict exceptional growth placing it in the top 10 percent of statistical areas nationally, with an expected expansion of 15,971 persons to 2041 based on latest annual ERP population numbers, reflecting a total increase of 67.6% over the 17 years.
Frequently Asked Questions - Population
Development
The level of residential development activity in Warnervale - Wadalba was found to be higher than 90% of real estate markets across the country
Warnervale-Wadalba averaged approximately 234 new dwelling approvals annually between FY-21 and FY-25. A total of 1,173 homes were approved during this period, with an additional 97 approved in FY-26. On average, about 3.4 people moved to the area for each dwelling built over these five years.
This high demand has outpaced supply, potentially exerting upward pressure on prices and intensifying competition among buyers. The average construction cost of new homes was $251,000, which is relatively affordable compared to regional levels. In FY-26 alone, $160.2 million in commercial development approvals were recorded, indicating robust local business investment. Compared to Greater Sydney, Warnervale-Wadalba has shown 173.0% higher new home approvals per person, offering buyers greater choice and reflecting strong developer confidence in the area. Recent construction trends comprise 81.0% detached houses and 19.0% townhouses or apartments, maintaining the area's traditional low-density character focused on family homes.
The location has approximately 87 people per dwelling approval, suggesting an expanding market. According to AreaSearch's latest quarterly estimate, Warnervale-Wadalba is projected to grow by 15,452 residents through to 2041. If current development rates continue, housing supply may not keep pace with population growth, potentially increasing competition among buyers and supporting stronger price growth.
Frequently Asked Questions - Development
Infrastructure
Warnervale - Wadalba has moderate levels of nearby infrastructure activity, ranking in the 45thth percentile nationally
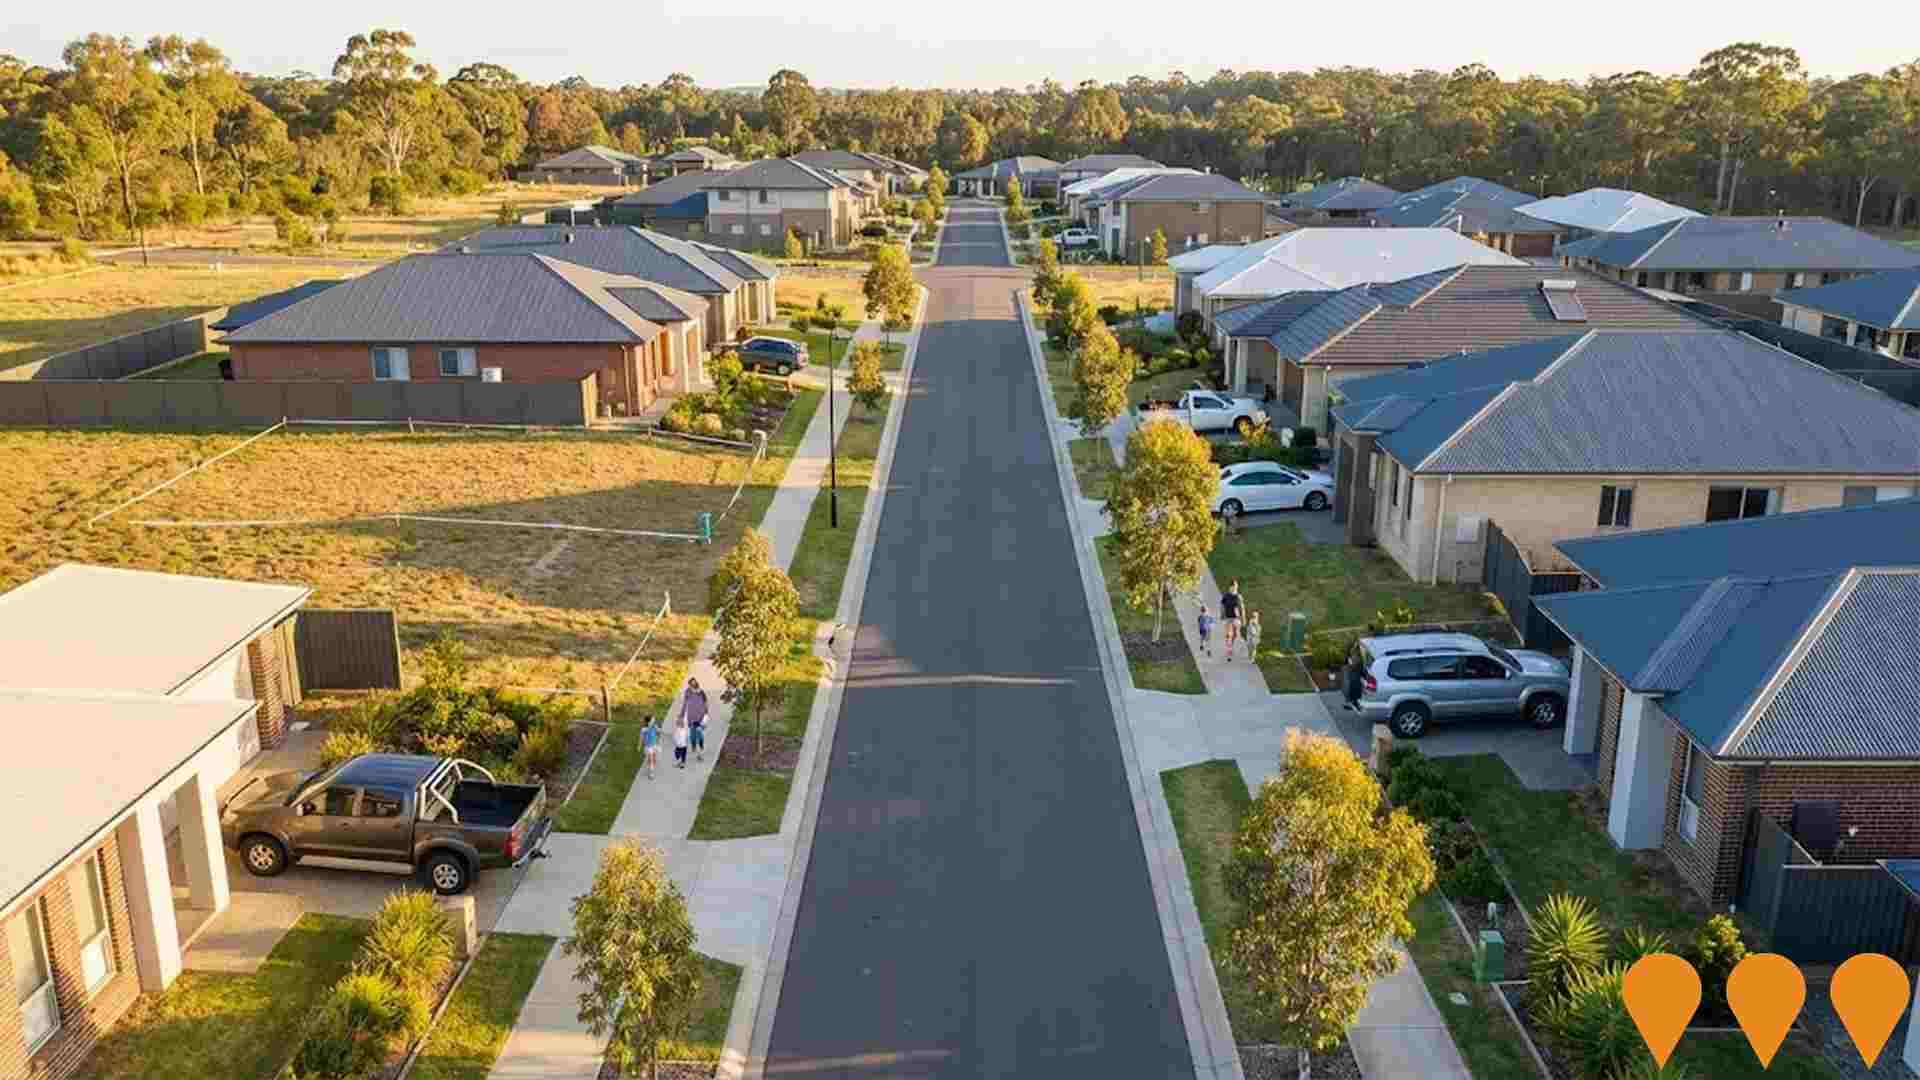
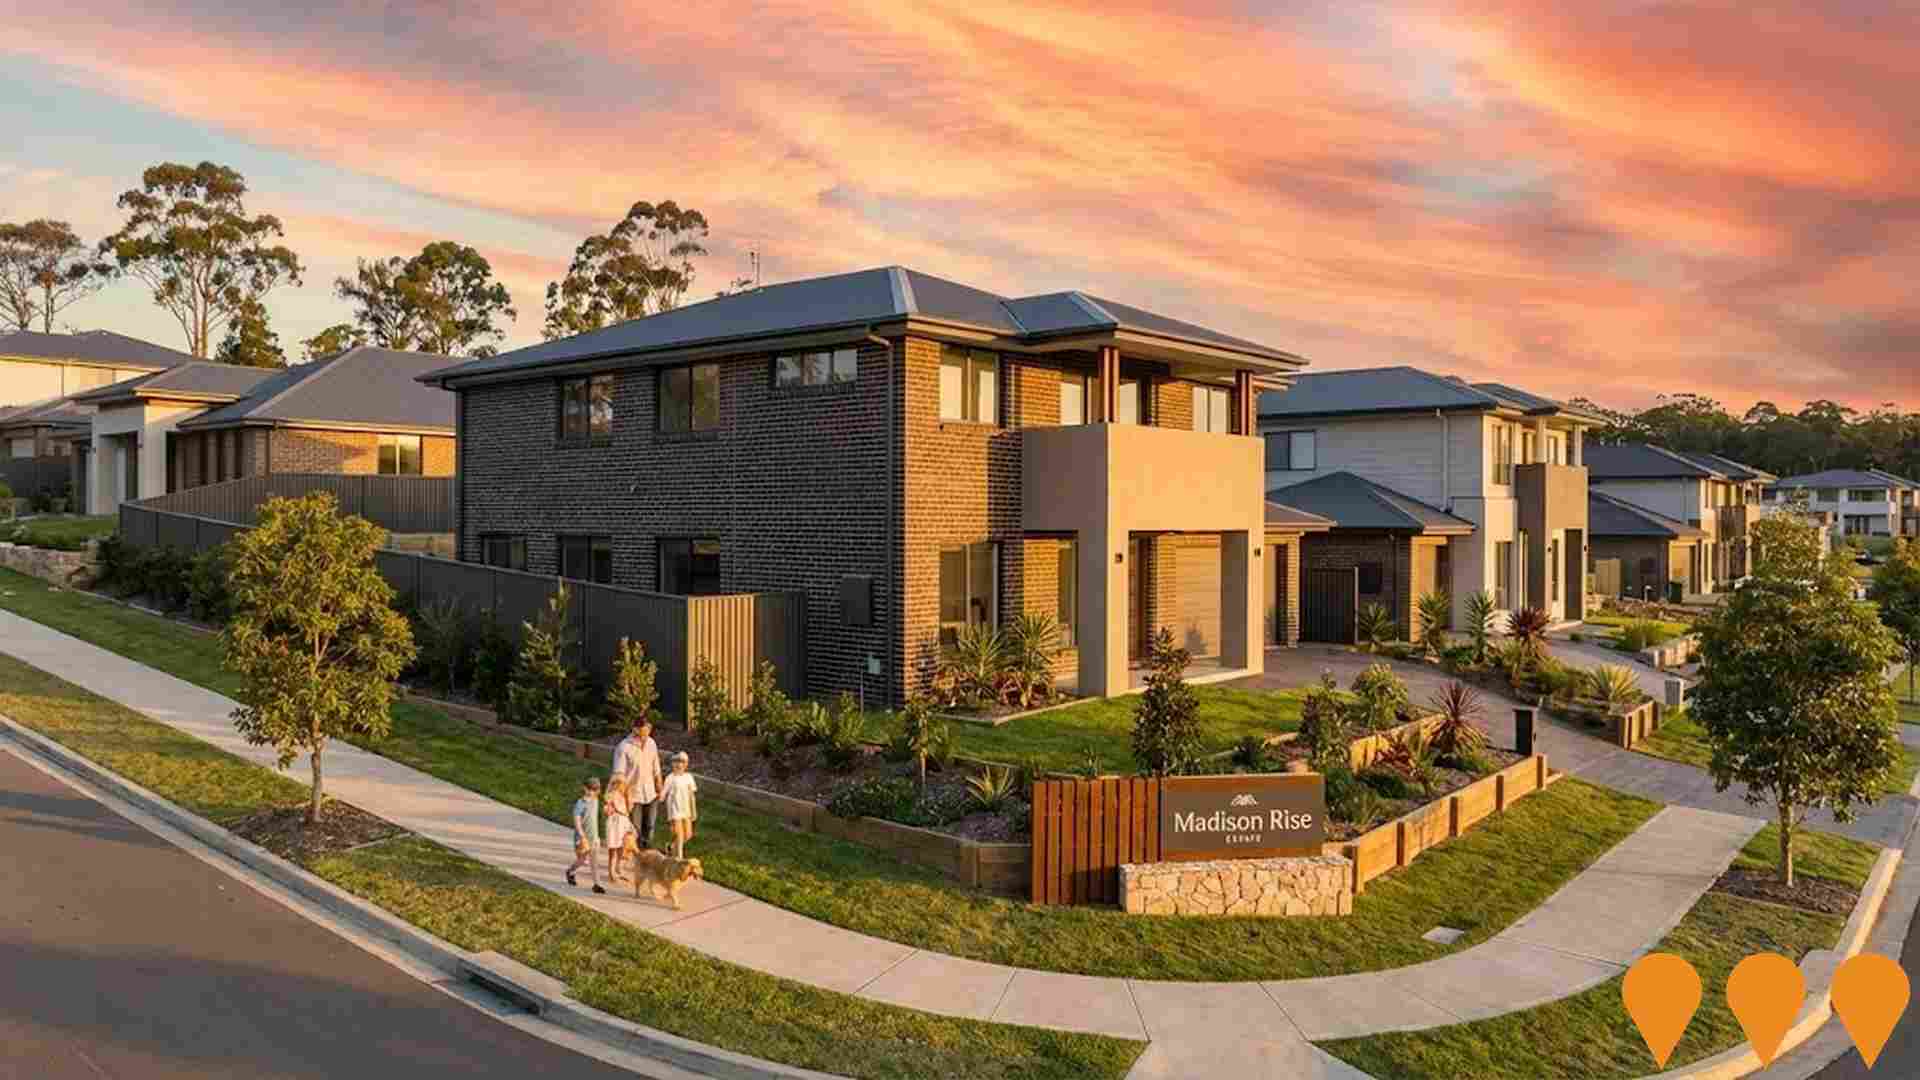
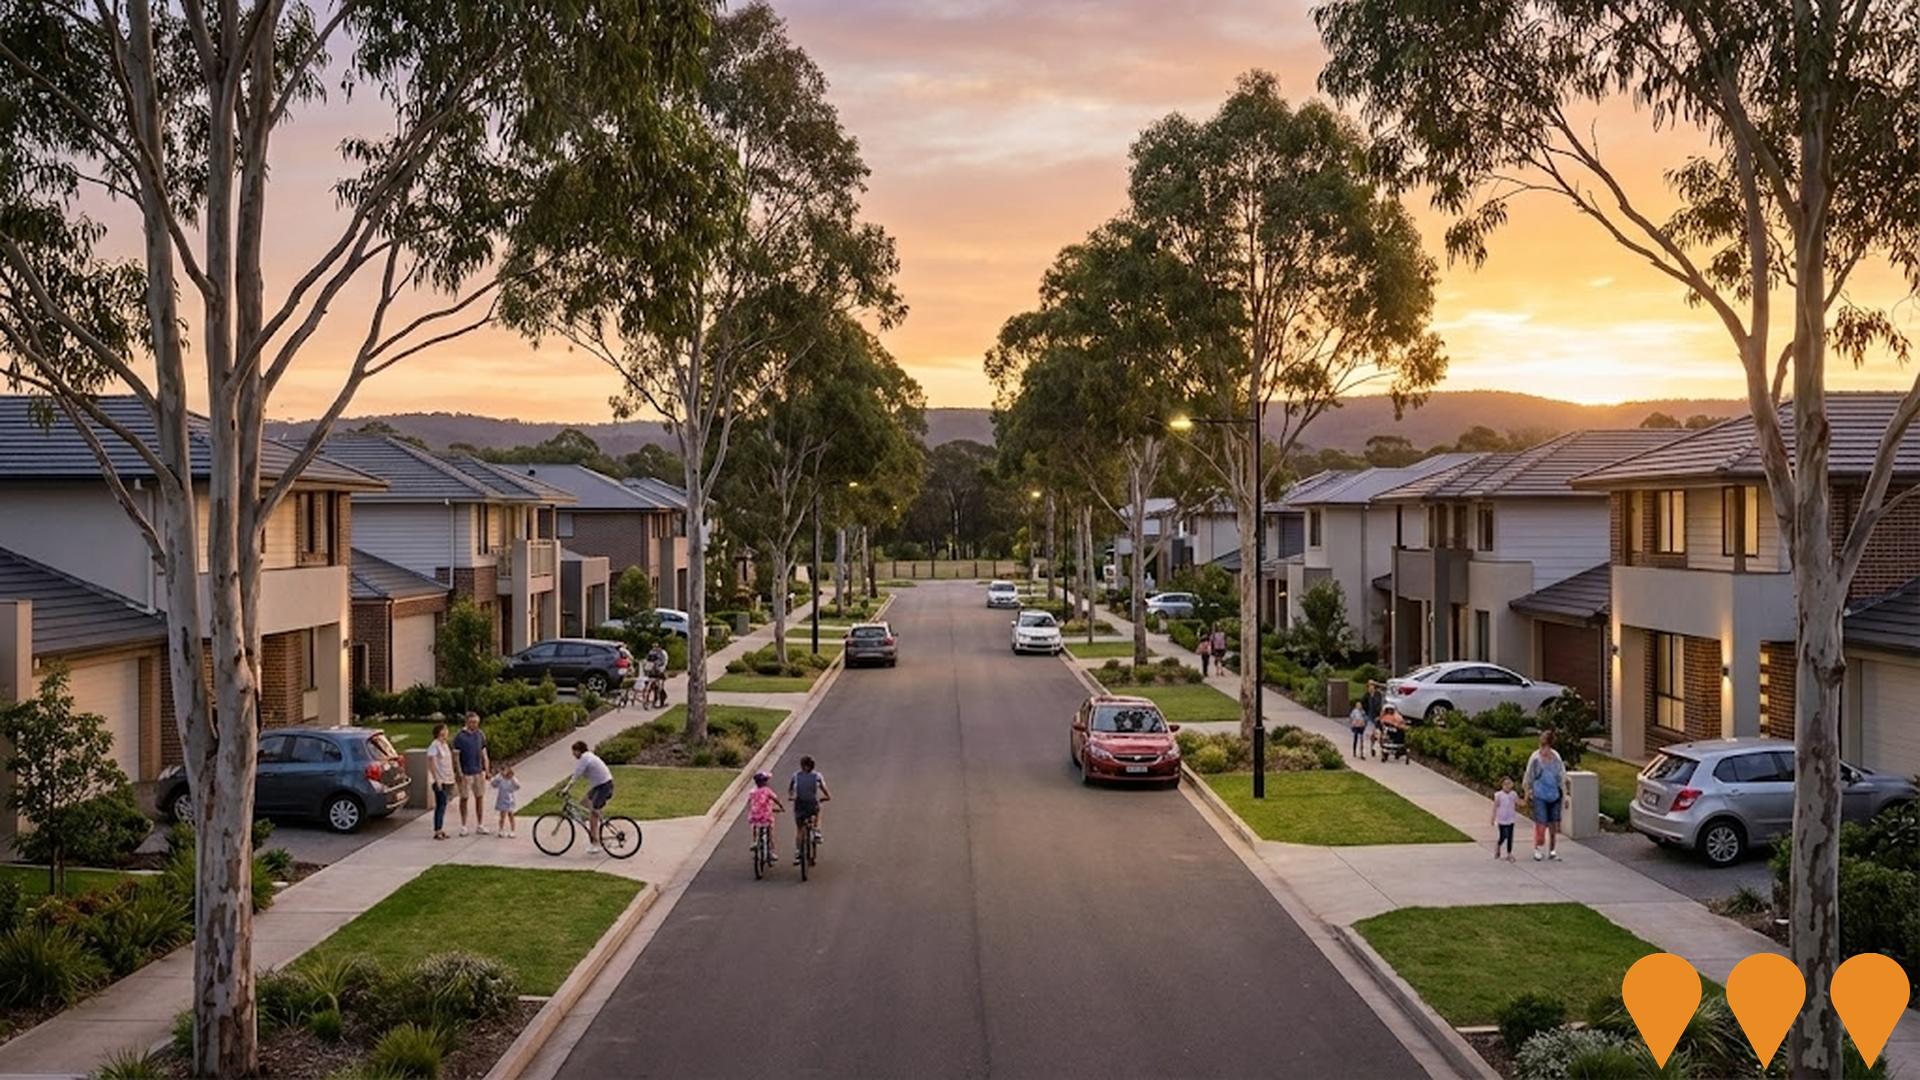
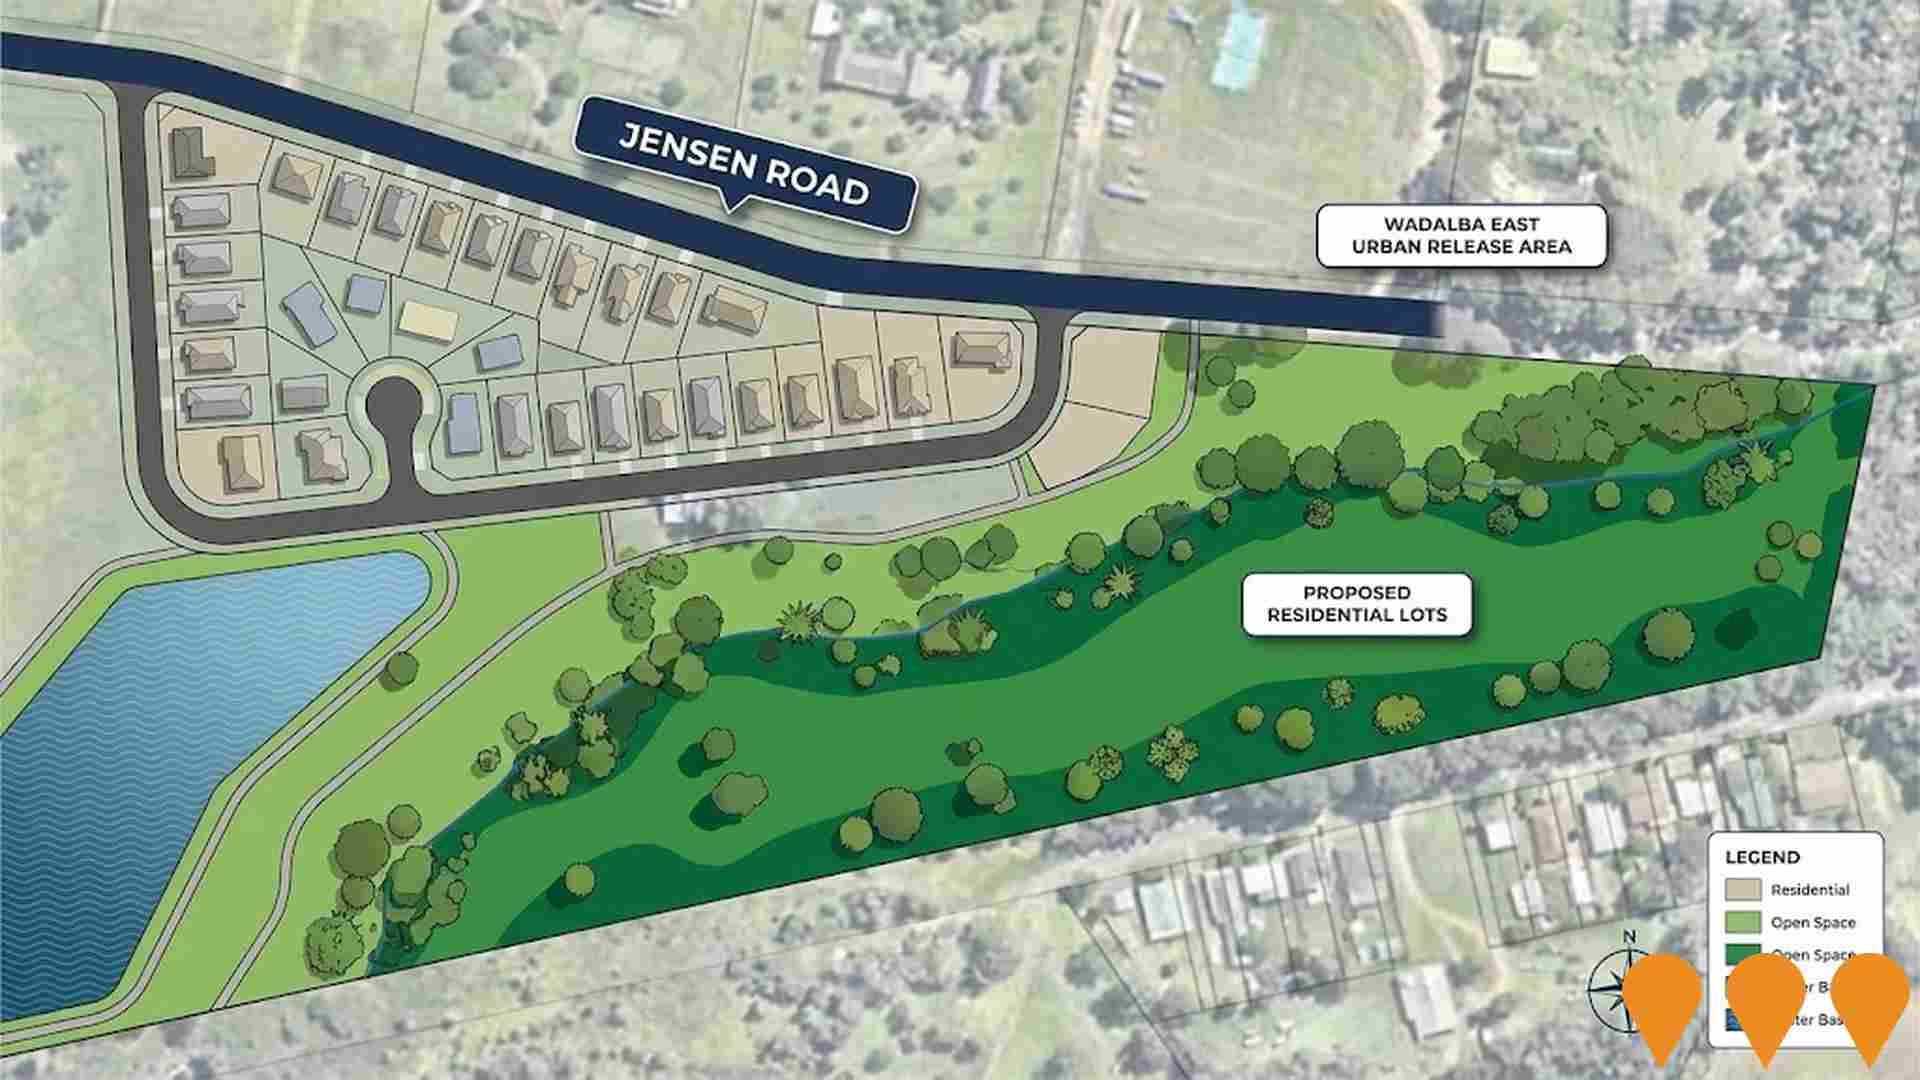
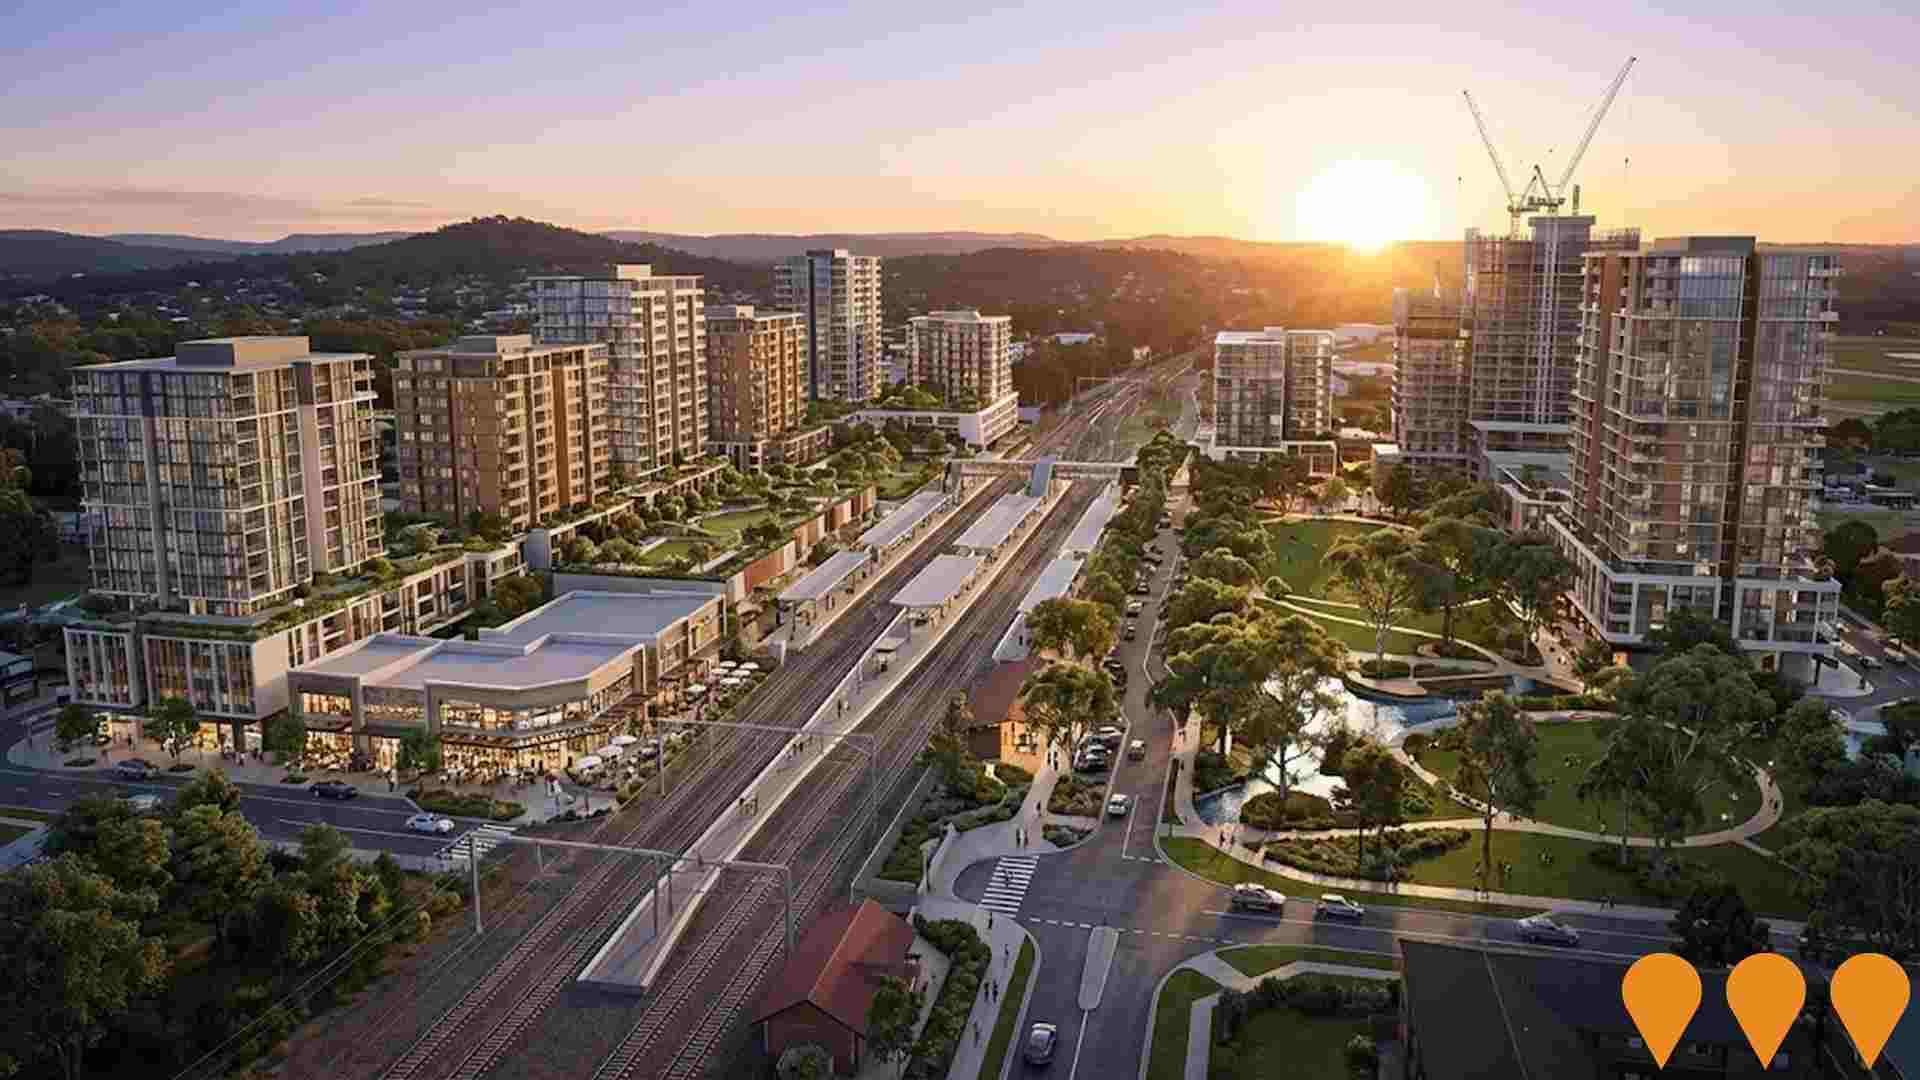
Changes to local infrastructure significantly influence an area's performance. AreaSearch has identified 37 projects likely impacting the area. Notable ones include Hamlyn View Estate, Cedarwood Estate, Yeramba Estates Central Coast Development, and The Sanctuary Estate Hamlyn Terrace. Below is a list detailing those most relevant.
Professional plan users can use the search below to filter and access additional projects.
INFRASTRUCTURE SEARCH
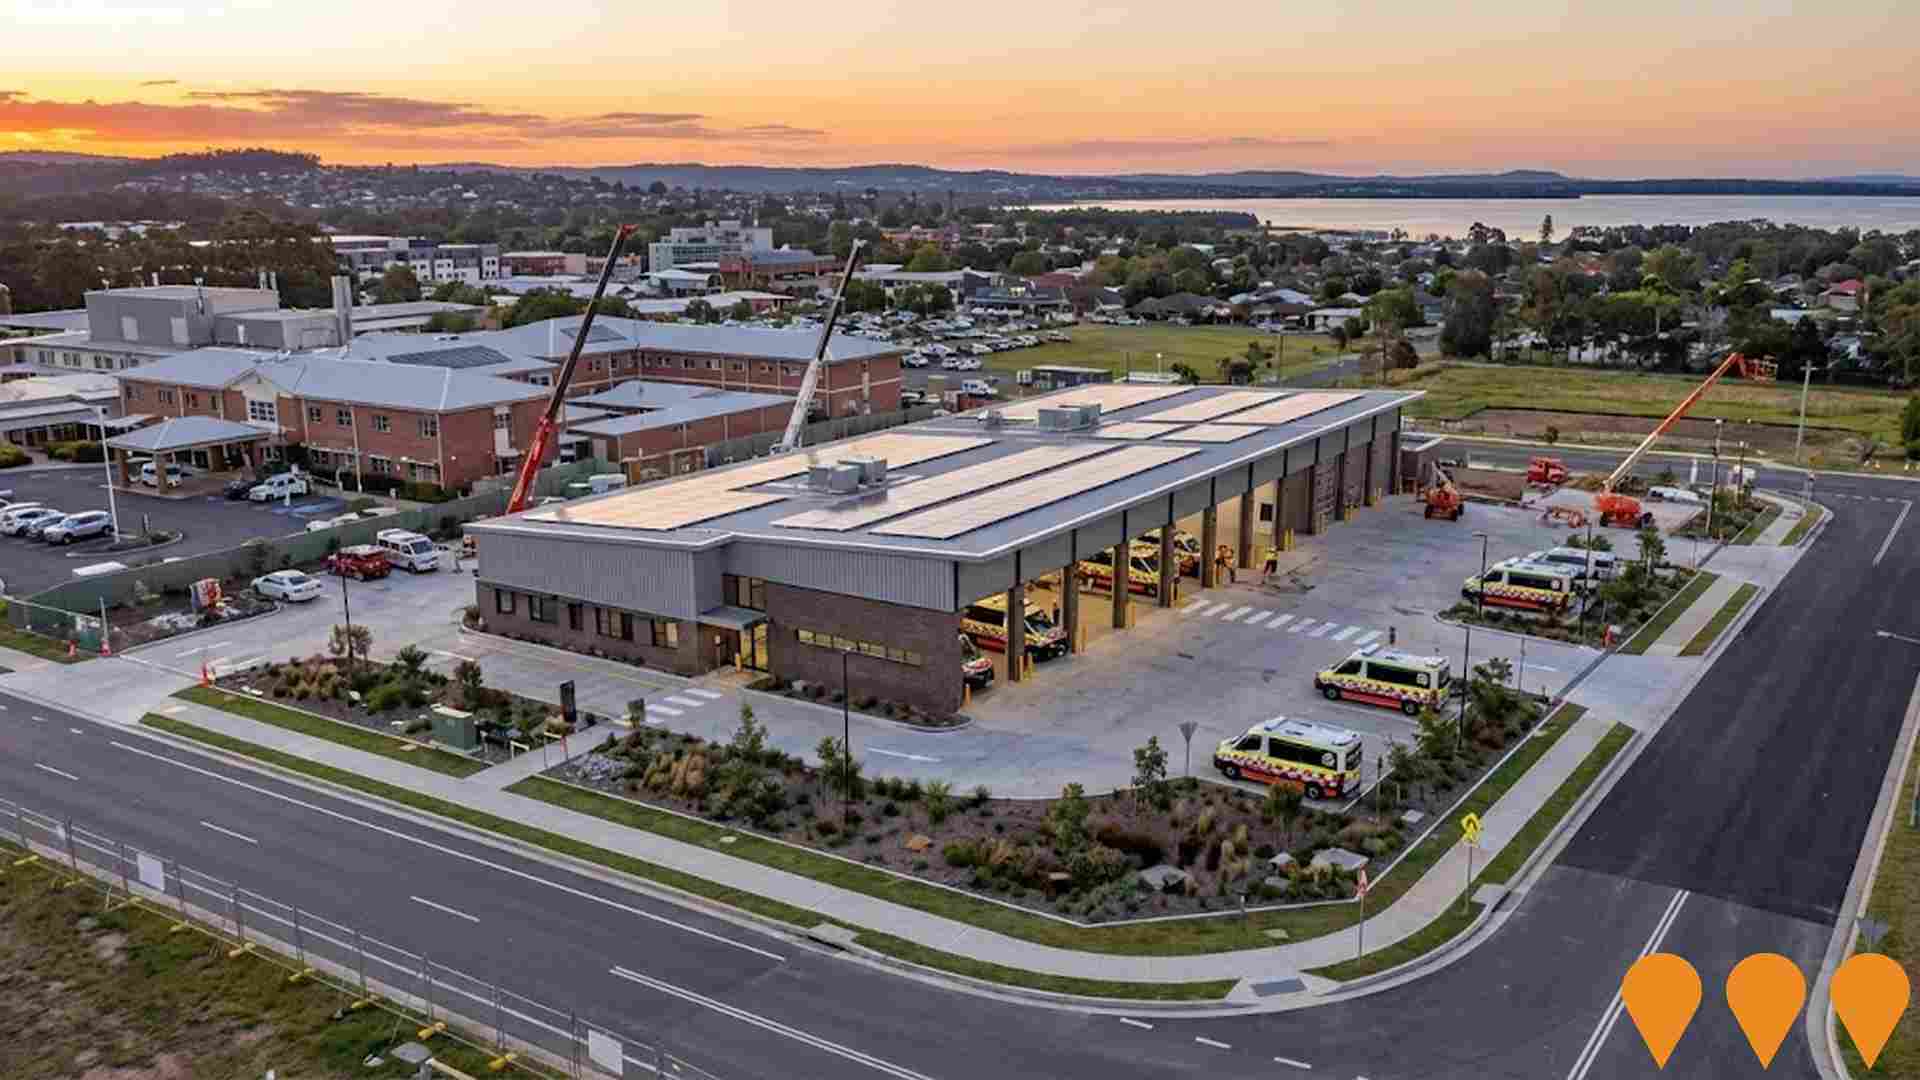
 Denotes AI-based impression for illustrative purposes only, not to be taken as definitive under any circumstances. Please follow links and conduct other investigations from the project's source for actual imagery. Developers and project owners wishing us to use original imagery please Contact Us and we will do so.
Frequently Asked Questions - Infrastructure
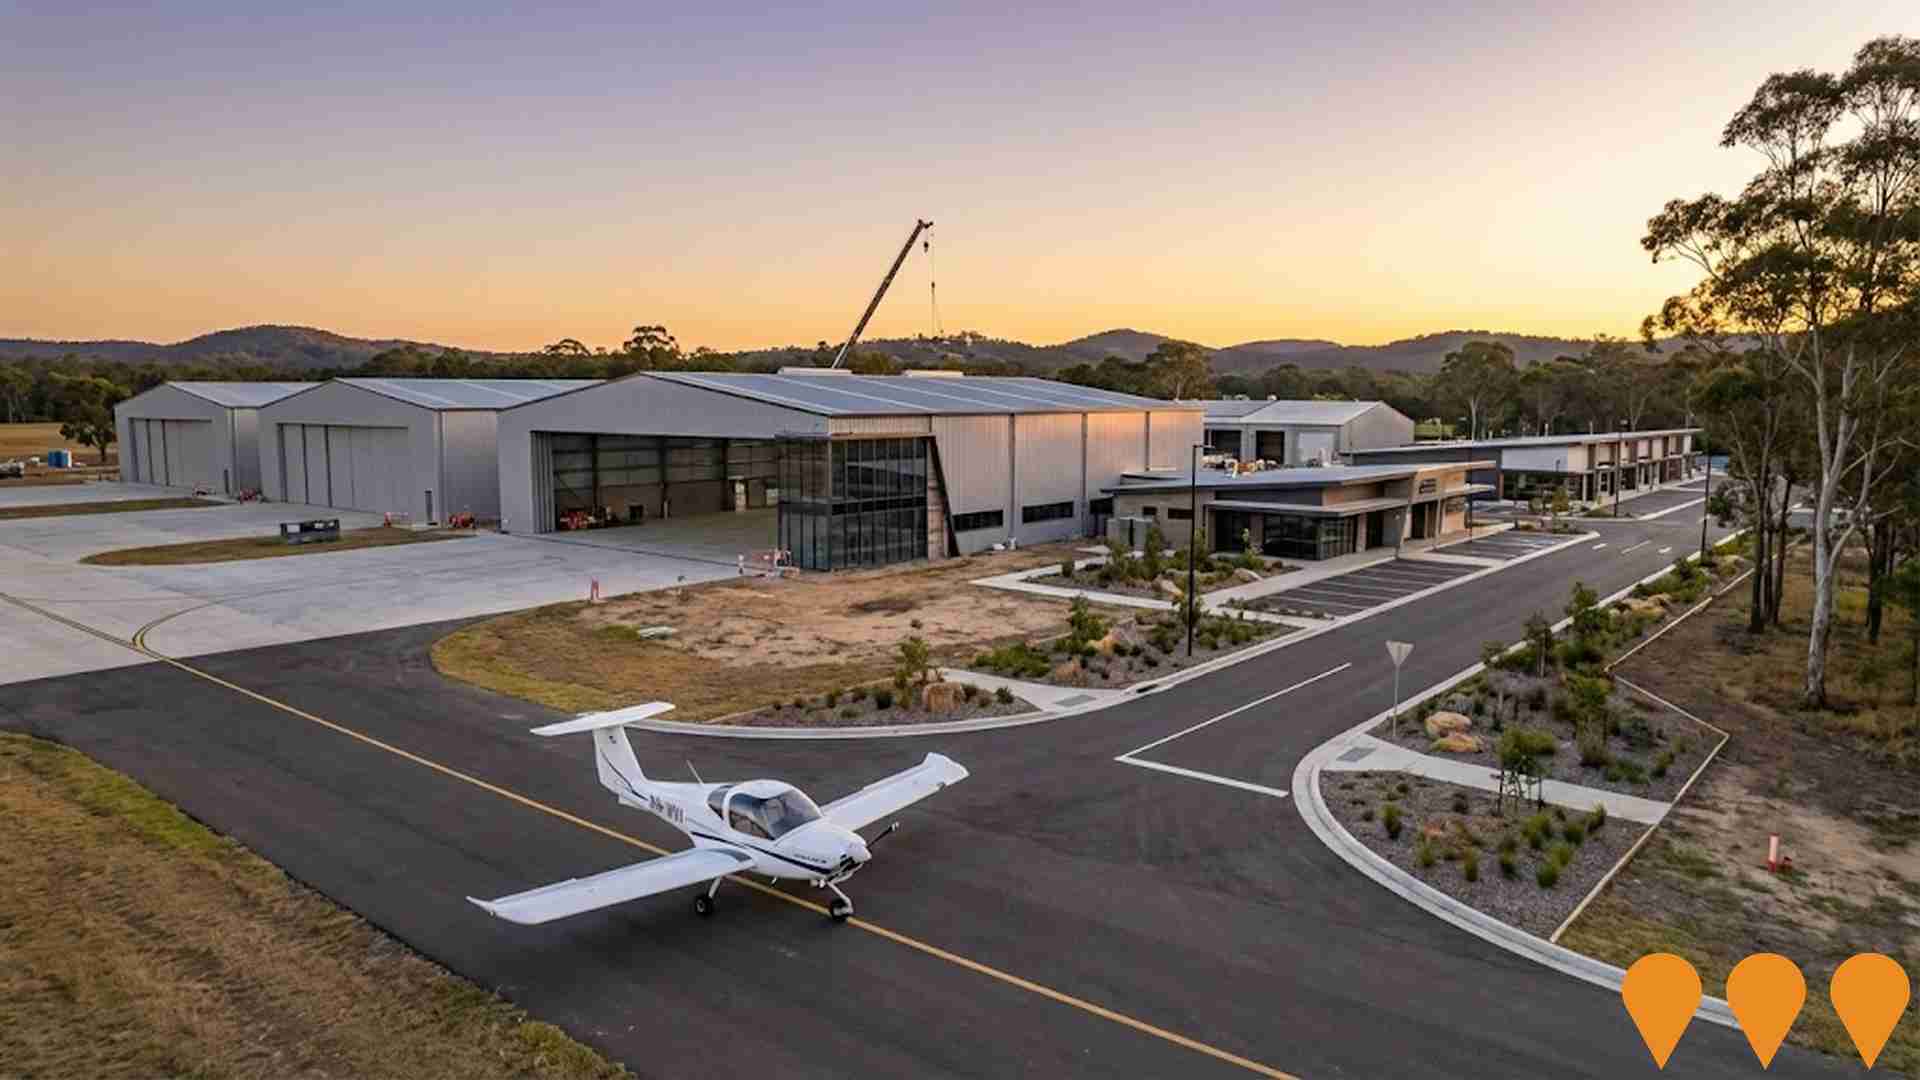
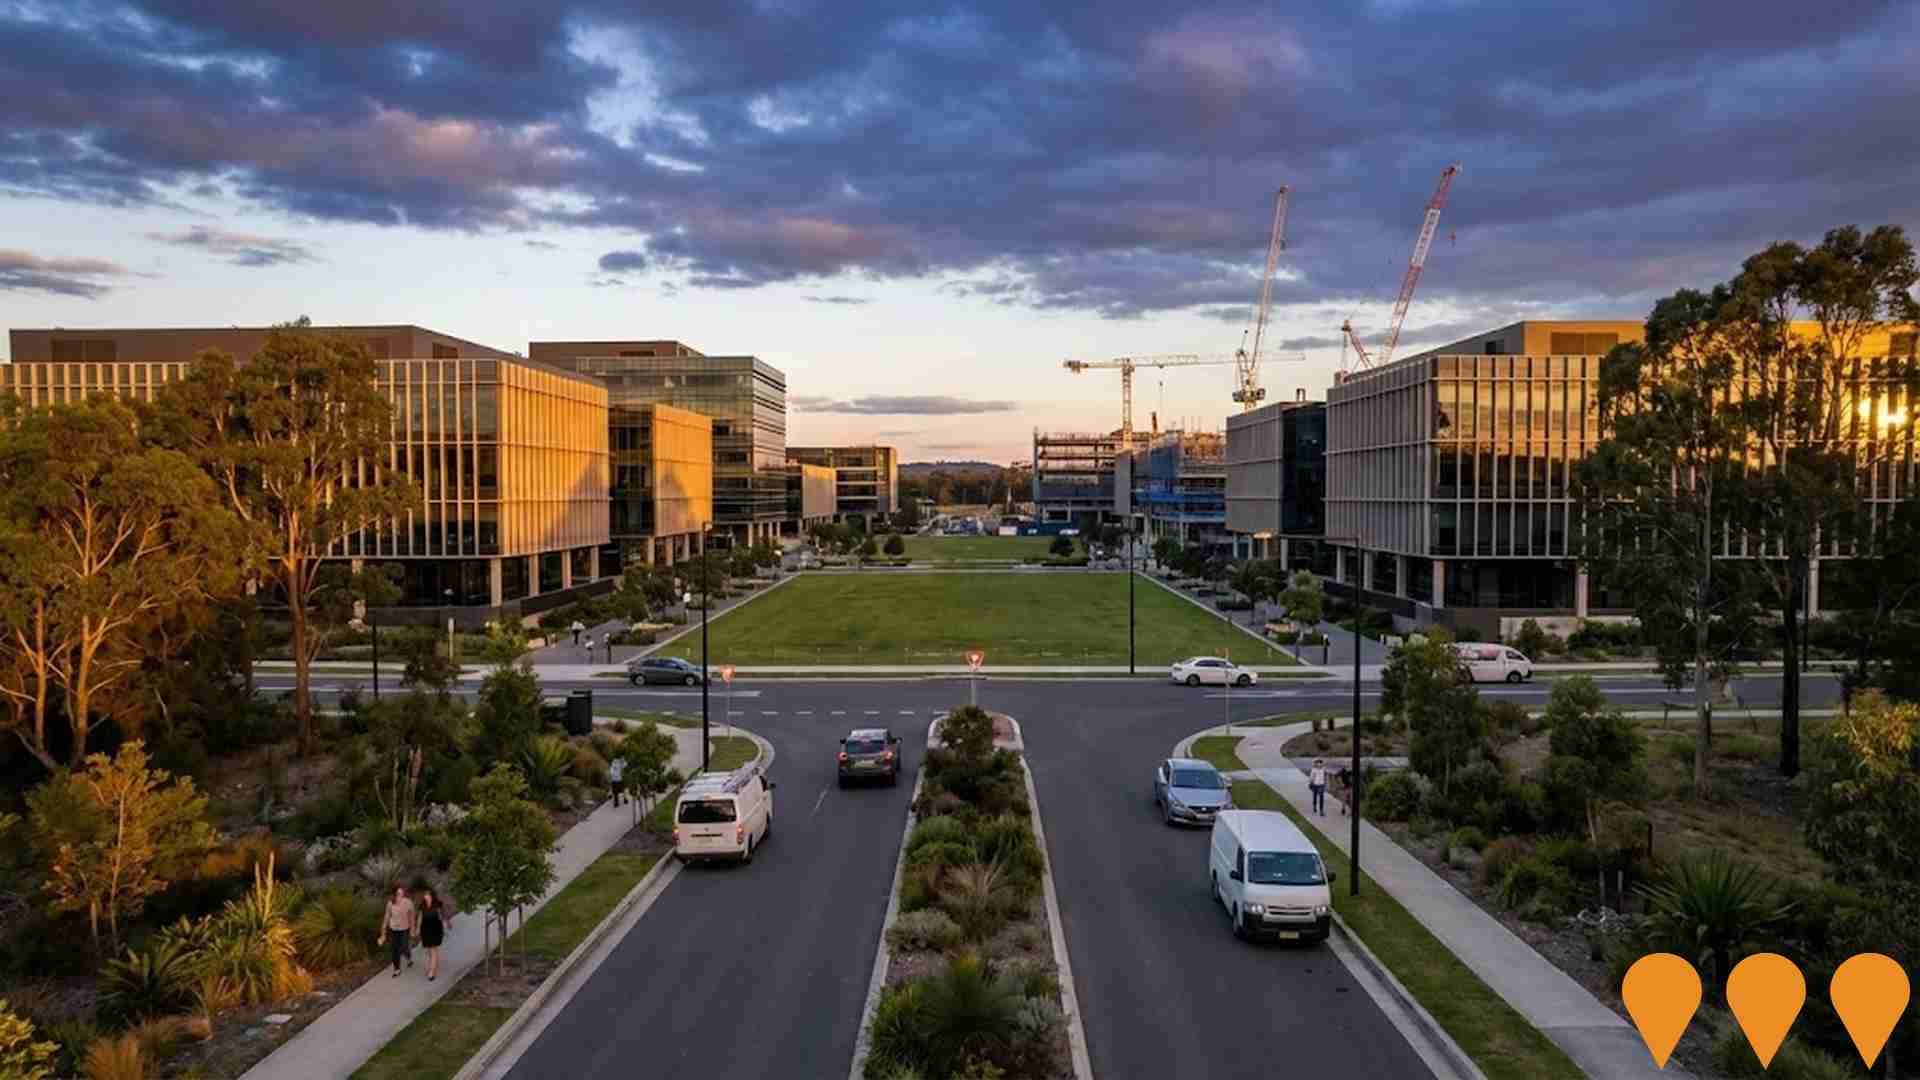
Central Coast Airport Precinct Development
The Central Coast Airport Precinct Development will upgrade the existing general aviation facility at Jack Grant Avenue, Warnervale into a regional general aviation, education and emergency services hub supported by commercial and aviation related ground leases. The adopted airport master plan and 2025 business case outline staged runway upgrades to Category 1B, new hangars and support infrastructure, land subdivision for aviation and business tenants, and an emergency operations centre for the Rural Fire Service and other agencies. Over time the precinct is intended to integrate with the Greater Warnervale structure plan, linking to surrounding business, education and town centre growth areas.
Yeramba Estates Central Coast Development
New estate development by Yeramba Estates, with over 60 years experience developing quality residential land estates. Located in convenient Central Coast location, halfway between Sydney and Newcastle, designed for modern living with community facilities.

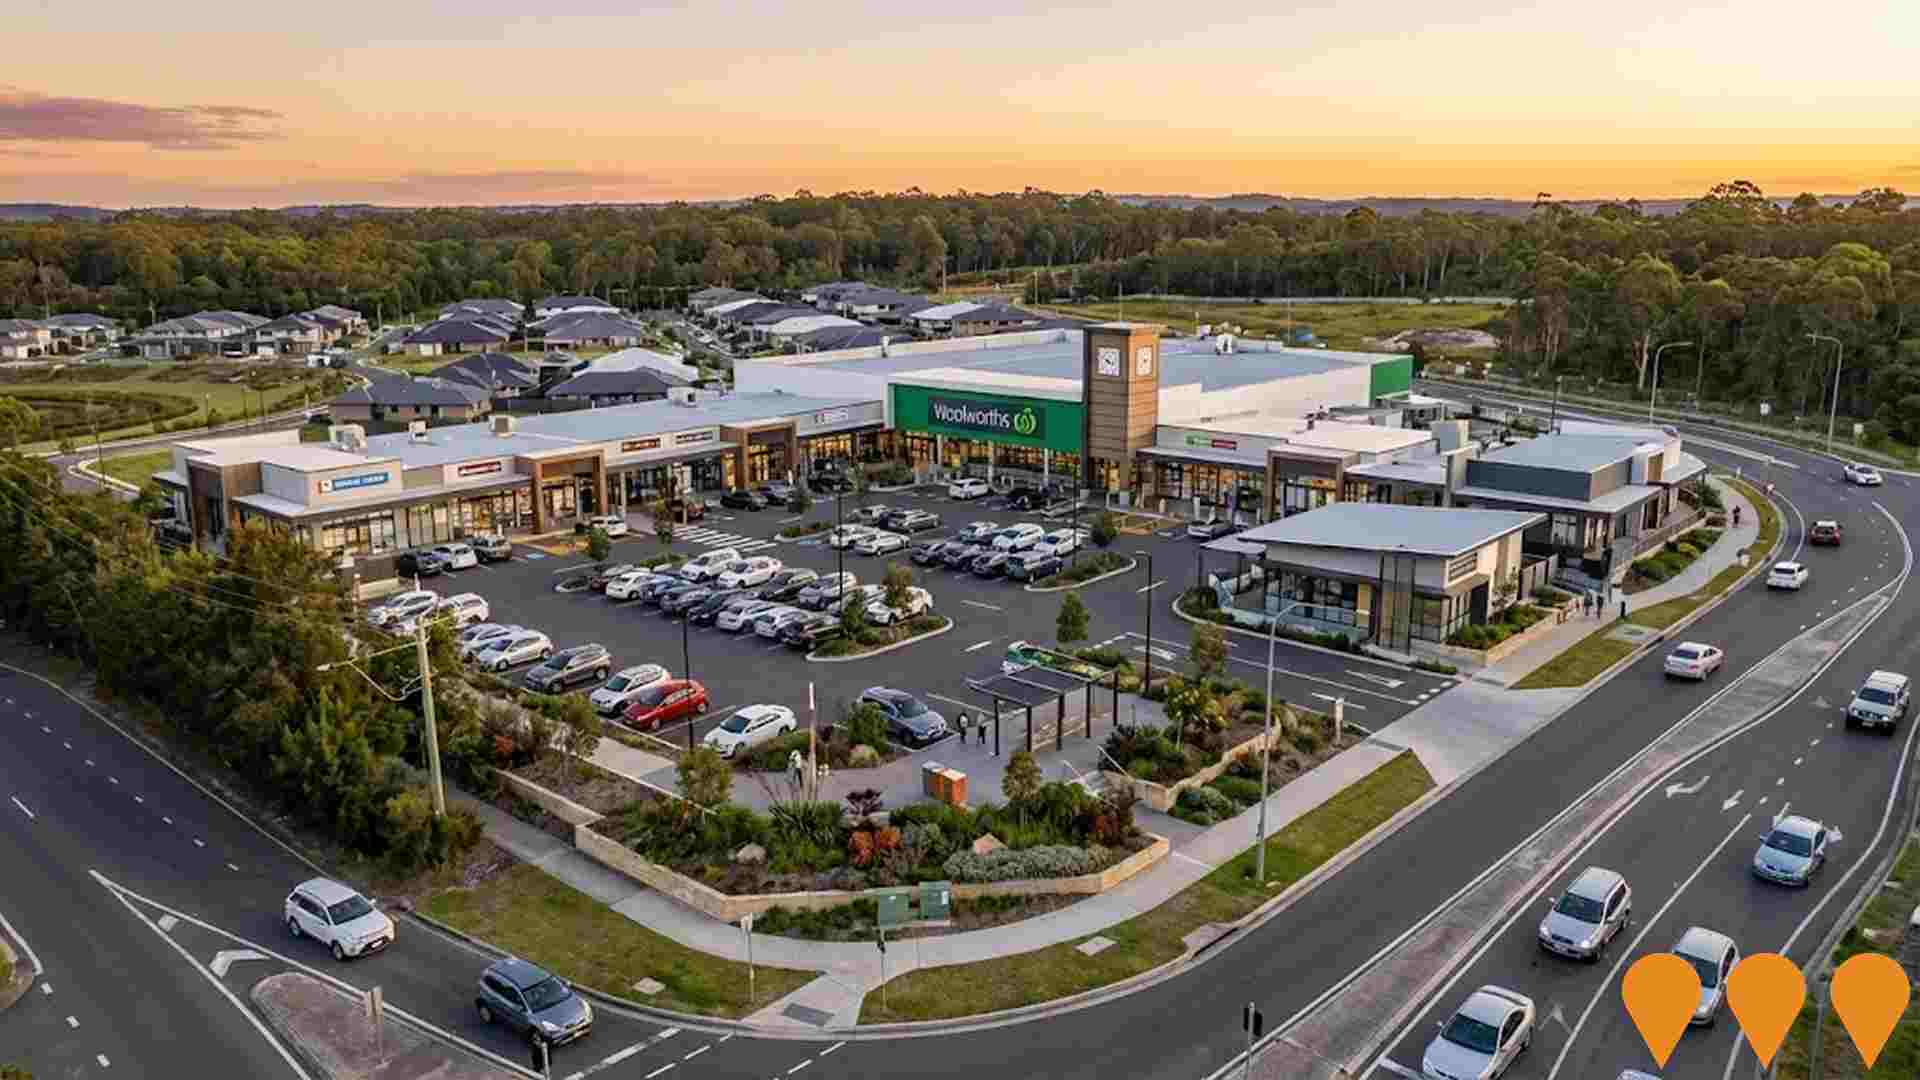
Warnervale Town Centre - Woolworths Shopping Centre
Development of a neighbourhood shopping centre within the proposed Warnervale Town Centre as part of Parklands Central Coast master-planned community. Includes a Woolworths supermarket with Home Delivery, specialty retail uses, commercial uses, medical centre, pharmacy, and community facilities. The development is designed to serve the growing Warnervale community and support the planned population growth in the area.
Warnervale Business Precinct
Council-led employment precinct within the Airport and Porters Creek Wetland landholdings, historically zoned for business park and education uses. In 2025 Council reports indicate the Master Plan/feasibility work is progressing with technical studies (heritage, CAD modelling, geotechnical) and subdivision steps to excise the precinct from broader lots. The precinct is intended to unlock serviced employment land for warehousing, logistics, manufacturing, offices and associated services to grow local jobs across Greater Warnervale.
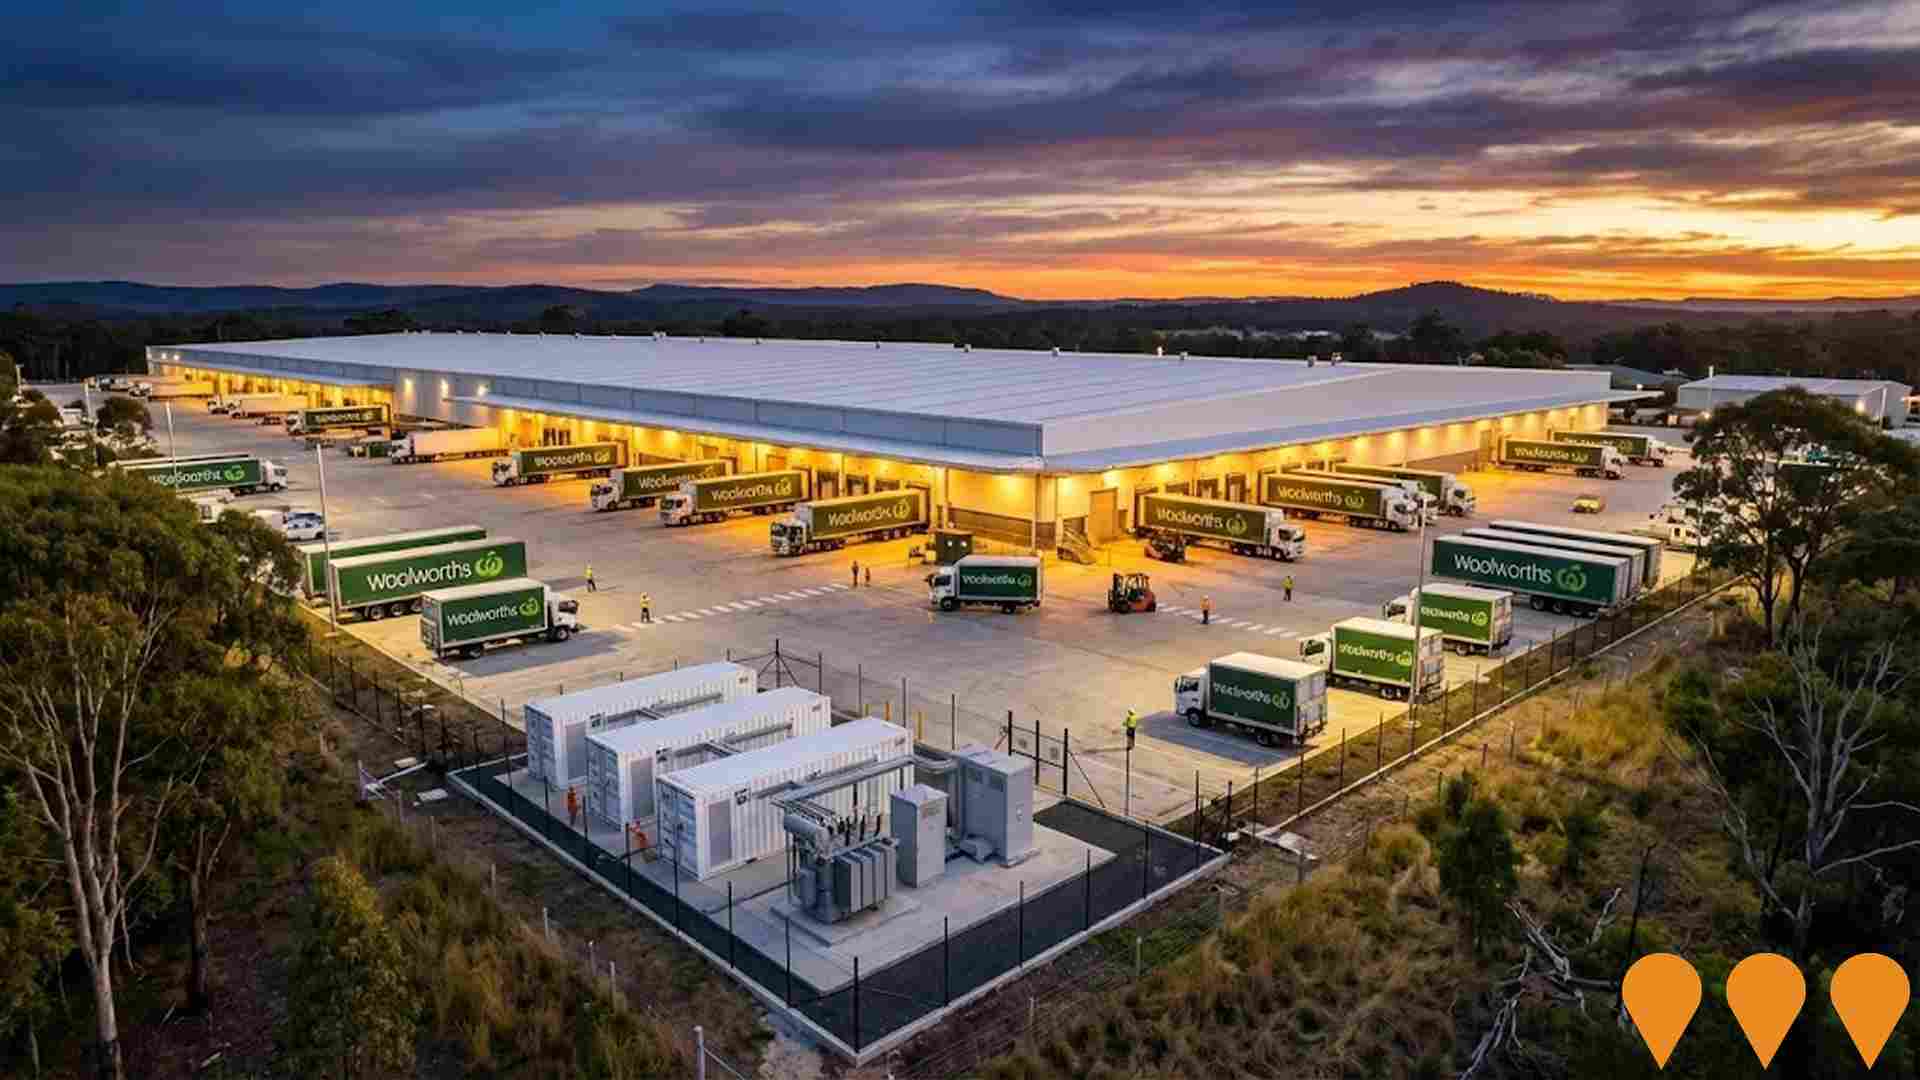
Woolworths Warnervale Distribution Centre Expansion
Expansion of the existing Woolworths Wyong (Warnervale) regional distribution centre, including extensions to temperature-controlled and ambient warehouses, additional banana ripening rooms, hardstand and parking upgrades. NSW Planning portal shows the SSD as More Information Required. A separate DA in 2025 proposes a battery energy storage system on-site. The 2024 EPBC decision reportedly found the previous expansion proposal clearly unacceptable due to impacts on a critically endangered orchid, indicating redesign or alternative pathways would be required before any approval.
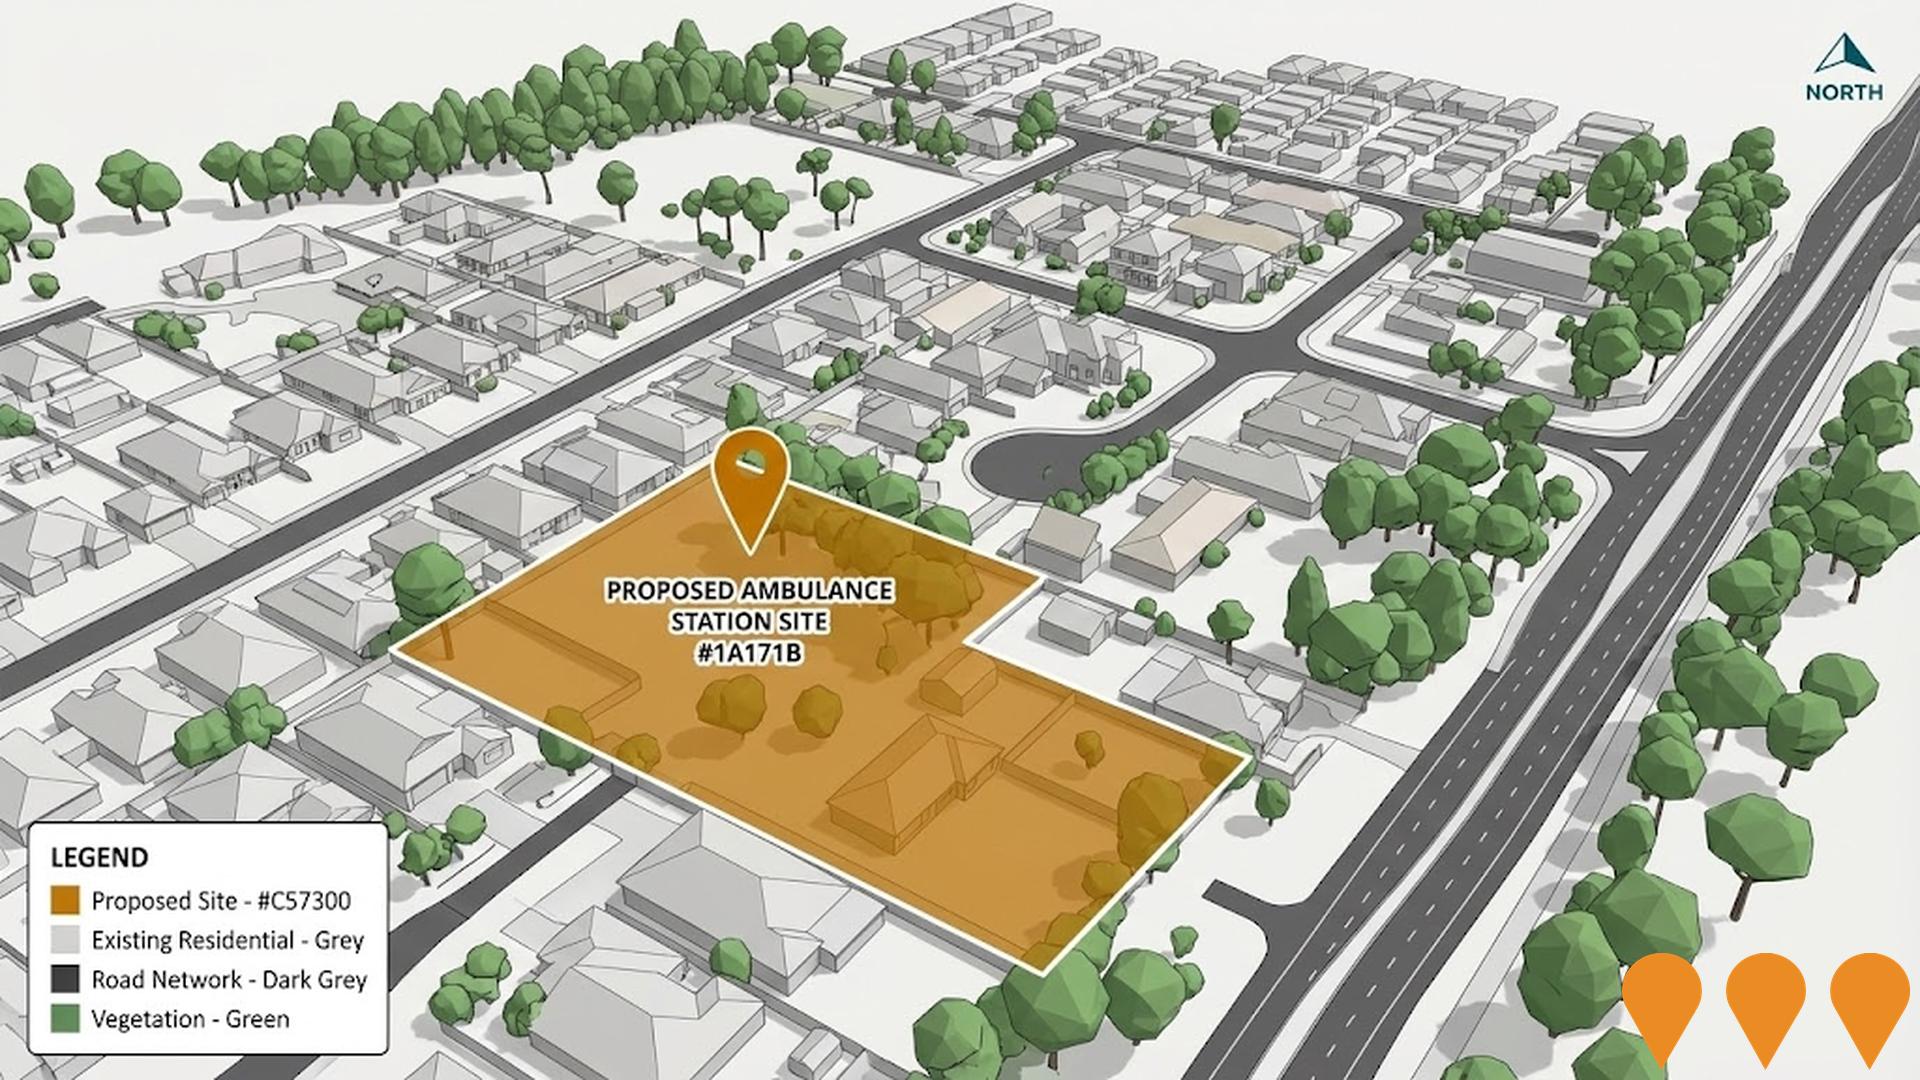
Hamlyn Terrace (Wyong) NSW Ambulance Station
New NSW Ambulance Station as part of the NSW Government's $132 million Rural Ambulance Infrastructure Reconfiguration (RAIR) Program. The program delivered 24 new or upgraded ambulance stations across NSW.
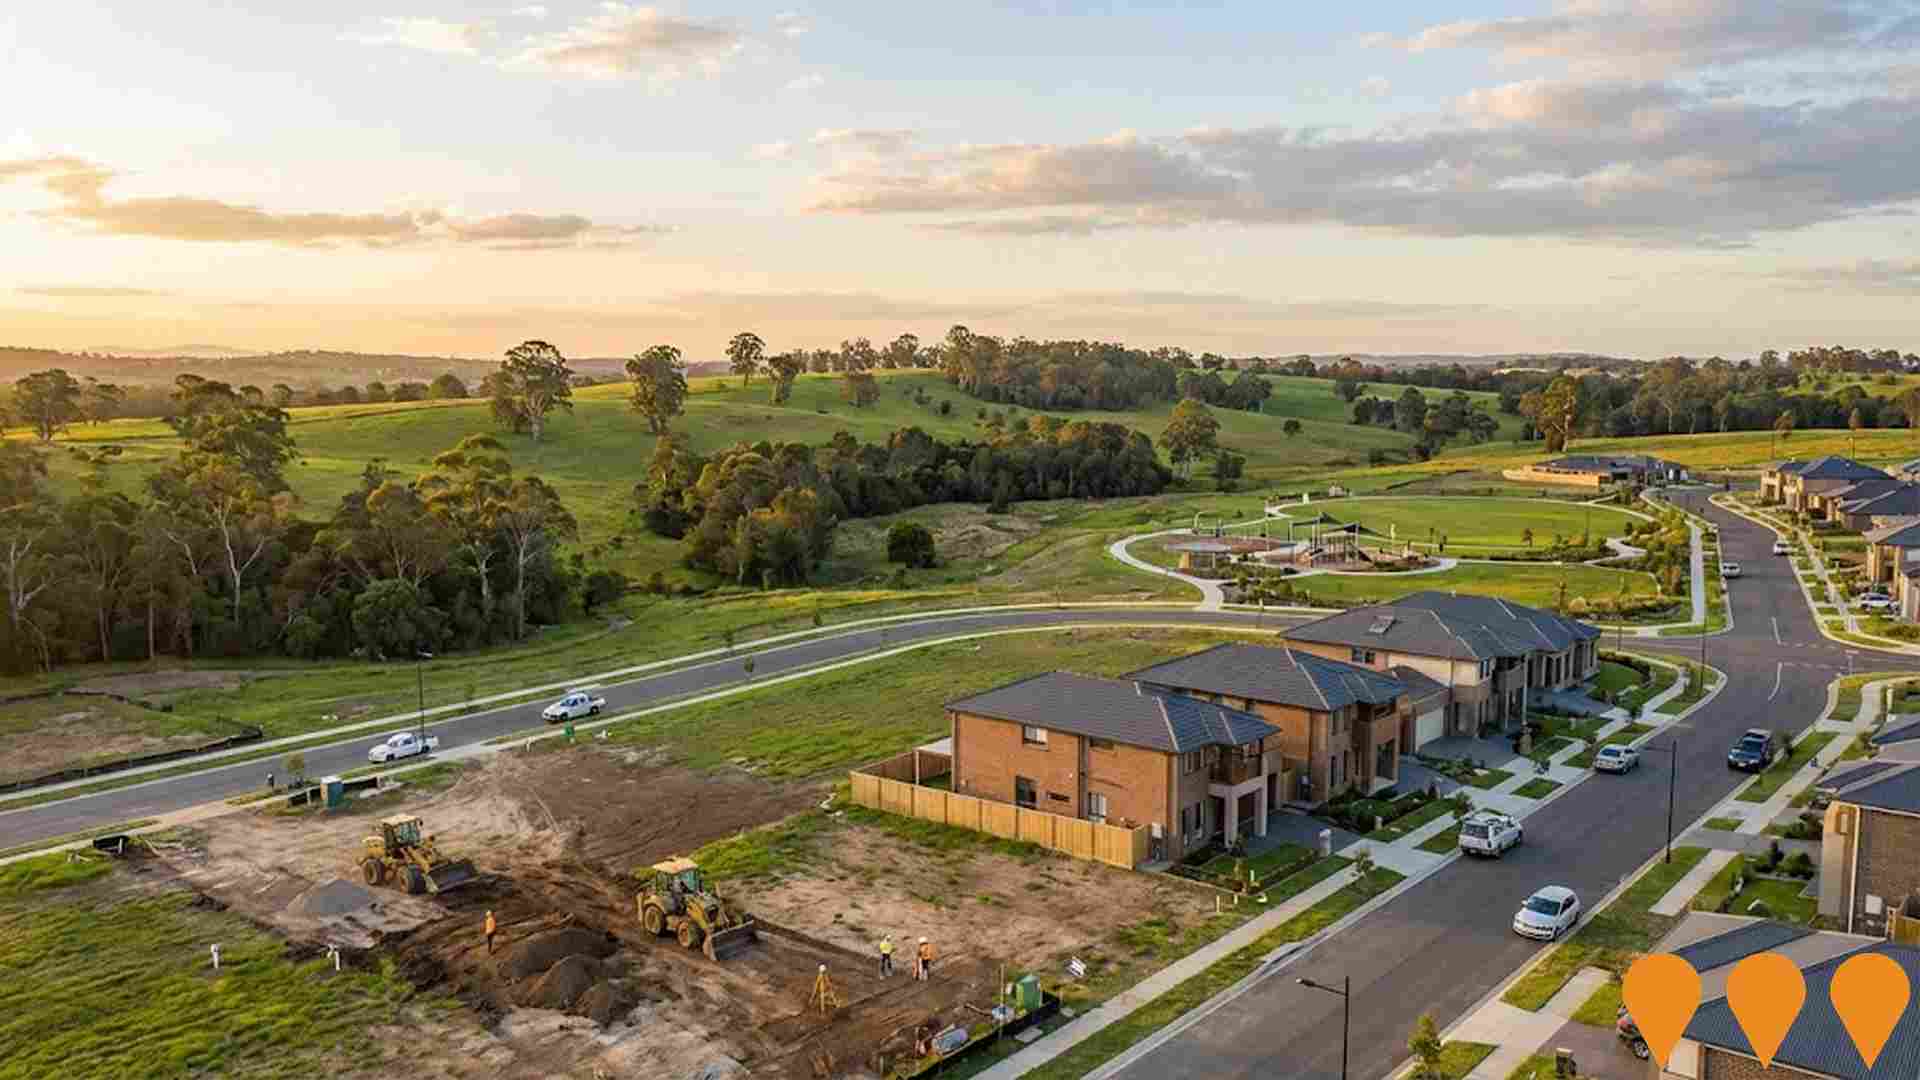
Hamlyn View Estate
Hamlyn View Estate is a master planned house and land community on the NSW Central Coast, developed by AVJennings and focused on delivering more than 600 residential lots and completed homes along Sparks Road in Hamlyn Terrace. Earlier stages of the estate have been built out and are occupied, while later stages continue to roll out through additional small lot housing and subdivision activity on the residue land at and around 94 Sparks Road, including a 2025 development application for small lot housing and subdivision on Residue Lot 87 (DA/511/2025) with Central Coast Council, indicating that civil works and dwelling construction are ongoing rather than fully complete. Nearby planning activity for residential flats and subdivision at 94 Sparks Road supports the view that this landholding is being progressively intensified as the final stages of the broader estate are delivered. :contentReference[oaicite:0]{index=0} :contentReference[oaicite:1]{index=1}
Cedarwood Estate
Master-planned residential community in Hamlyn Terrace, designed for families, couples, and seniors. The estate features quality investment properties and spacious homesites, fully serviced with underground power, sewerage, and NBN connectivity. Located near the Pacific Highway and M1 Motorway, it offers convenient access to Sydney and Newcastle.
Employment
The labour market in Warnervale - Wadalba shows considerable strength compared to most other Australian regions
Warnervale-Wadalba has a skilled workforce with essential services sectors well-represented. The unemployment rate was 3.0% as of the past year, with an estimated employment growth of 3.2%.
As of September 2025, there are 11,655 residents employed, with an unemployment rate of 1.1% below Greater Sydney's rate of 4.2%. Workforce participation is at 63.1%, compared to Greater Sydney's 60.0%. Leading employment industries include health care & social assistance, retail trade, and construction. Health care & social assistance has particularly notable concentration, with employment levels at 1.4 times the regional average.
Professional & technical services employ only 4.4% of local workers, below Greater Sydney's 11.5%. The area may offer limited local employment opportunities, as indicated by Census data comparing working population to resident population. Between September 2024 and September 2025, employment increased by 3.2%, while labour force increased by 3.9%, causing the unemployment rate to rise by 0.6 percentage points. In comparison, Greater Sydney recorded employment growth of 2.1% over the same period. As of 25-November-25, NSW employment contracted by 0.03%, losing 2,260 jobs, with a state unemployment rate of 3.9%. This compares favourably to the national unemployment rate of 4.3%. Jobs and Skills Australia's national employment forecasts from May-25 suggest that while national employment is expected to expand by 6.6% over five years and 13.7% over ten years, growth rates differ significantly between industry sectors. Applying these projections to Warnervale-Wadalba's employment mix suggests local employment should increase by 6.6% over five years and 13.8% over ten years.
Frequently Asked Questions - Employment
Income
Income levels align closely with national averages, indicating typical economic conditions for Australian communities according to AreaSearch analysis
Warnervale - Wadalba SA2 had a median taxpayer income of $49,288 and an average income of $59,885 in the financial year 2022, according to postcode level ATO data aggregated by AreaSearch. This is lower than national averages, with Greater Sydney's median income being $56,994 and average income $80,856. As of September 2025, estimated incomes are approximately $55,503 (median) and $67,436 (average), based on Wage Price Index growth of 12.61% since financial year 2022. In the 2021 Census, household income ranked at the 66th percentile ($2,022 weekly), while personal income was at the 47th percentile. The $1,500 - 2,999 income bracket dominated with 38.0% of residents (8,691 people), similar to regional levels where 30.9% occupied this bracket. High housing costs consumed 18.4% of income, yet strong earnings placed disposable income at the 63rd percentile. The area's SEIFA income ranking places it in the 5th decile.
Frequently Asked Questions - Income
Housing
Warnervale - Wadalba is characterized by a predominantly suburban housing profile, with a higher proportion of rental properties than the broader region
In Warnervale - Wadalba, as per the latest Census, 94.4% of dwellings were houses, with the remaining 5.7% being semi-detached homes, apartments, or other types. In comparison, Sydney metropolitan area had 83.2% houses and 16.7% other dwellings. Home ownership in Warnervale - Wadalba stood at 25.4%, with mortgaged dwellings at 42.6% and rented ones at 32.0%. The median monthly mortgage repayment was $2,167, higher than Sydney's average of $1,900. The median weekly rent in Warnervale - Wadalba was $495, compared to Sydney's $385. Nationally, mortgage repayments averaged $1,863 and rents were $375 per week.
Frequently Asked Questions - Housing
Household Composition
Warnervale - Wadalba features high concentrations of family households, with a higher-than-average median household size
Family households constitute 82.5% of all households, including 42.2% couples with children, 23.7% couples without children, and 15.7% single parent families. Non-family households account for 17.5%, with lone person households at 15.2% and group households making up 2.3%. The median household size is 3.0 people, larger than the Greater Sydney average of 2.5.
Frequently Asked Questions - Households
Local Schools & Education
Educational attainment in Warnervale - Wadalba aligns closely with national averages, showing typical qualification patterns and performance metrics
The area's university qualification rate is 16.9%, significantly lower than Greater Sydney's average of 38.0%. Among residents with higher education qualifications, bachelor degrees are the most common at 12.0%, followed by postgraduate qualifications (3.2%) and graduate diplomas (1.7%). Vocational credentials are held by 42.8% of residents aged 15 and above, with advanced diplomas at 12.0% and certificates at 30.8%. Educational participation is high, with 34.1% of residents currently enrolled in formal education.
This includes 12.6% in primary education, 10.2% in secondary education, and 3.7% pursuing tertiary education.
Frequently Asked Questions - Education
Schools Detail
Nearby Services & Amenities
Transport
Transport servicing is moderate compared to other areas nationally based on assessment of service frequency, route connectivity and accessibility
Warnervale - Wadalba has 161 operational public transport stops, offering a combination of train and bus services. These stops are covered by 97 distinct routes, facilitating 2,761 weekly passenger trips in total. The area's transport accessibility is deemed excellent, with residents on average situated 196 meters from the nearest stop.
Across all routes, service frequency stands at 394 trips per day, translating to roughly 17 weekly trips per individual stop.
Frequently Asked Questions - Transport
Transport Stops Detail
Health
Health performance in Warnervale - Wadalba is lower than average with common health conditions somewhat prevalent across the board, though to a considerably higher degree among older age cohorts
Warnervale-Wadalba faces significant health challenges with common health conditions prevalent across all age groups but more so among older cohorts. Approximately half of its total population (~11,321 people) has private health cover, lower than the national average of 55.3%.
The most common medical conditions are mental health issues (10.0% of residents) and asthma (8.6%). Sixty-six point three percent of residents claim to be completely clear of medical ailments, higher than Greater Sydney's 61.5%. Fourteen point one percent of residents are aged 65 and over (3,227 people), lower than Greater Sydney's 22.3%. Health outcomes among seniors require more attention due to the specific challenges they face.
Frequently Asked Questions - Health
Cultural Diversity
Warnervale - Wadalba ranks below the Australian average when compared to other local markets across a number of language and cultural background related metrics
Warnervale-Wadalba had low cultural diversity, with 82.3% of residents born in Australia, 89.8% being citizens, and 89.2% speaking English only at home. Christianity was the predominant religion at 57.6%, slightly higher than Greater Sydney's 56.2%. Ancestry wise, Australian (29.6%), English (28.9%) and Irish (6.6%) were top groups.
Notably, Maltese (1.2% vs regional 1.0%), Australian Aboriginal (4.6% vs 4.5%) and Maori (0.7% vs 0.6%) had higher representations than the Greater Sydney region.
Frequently Asked Questions - Diversity
Age
Warnervale - Wadalba's population is younger than the national pattern
Warnervale-Wadalba's median age of 35 years is slightly younger than Greater Sydney's 37 and the national average of 38. The 5-14 age group comprises 15.7%, higher than Greater Sydney's percentage. The 25-34 cohort, however, makes up 12.1% of the population, lower compared to Greater Sydney. Between 2021 and present, the 15-24 age group has increased from 13.6% to 14.5%. Conversely, the 5-14 cohort has decreased from 16.4% to 15.7%. By 2041, population forecasts indicate significant demographic shifts in Warnervale-Wadalba, with the 45-54 age group projected to rise substantially by 86%, from 3,025 to 5,623 people.
