Chart Color Schemes
This analysis uses ABS Statistical Areas Level 2 (SA2) boundaries, which can materially differ from Suburbs and Localities (SAL) even when sharing similar names.
SA2 boundaries are defined by the Australian Bureau of Statistics and are designed to represent communities for statistical reporting (e.g., census and ERP).
Suburbs and Localities (SAL) represent commonly-used suburb/locality names (postal-style areas) and may use different geographic boundaries. For comprehensive analysis, consider reviewing both boundary types if available.
est. as @ -- *
ABS ERP | -- people | --
2021 Census | -- people
Sales Activity
Curious about local property values? Filter the chart to assess the volume and appreciation (including resales) trends and regional comparisons, or scroll to the map below view this information at an individual property level.
Find a Recent Sale
Sales Detail
Population
Wyong has seen population growth performance typically on par with national averages when looking at short and medium term trends
Wyong's population was around 9,427 as of November 2025. This figure reflects an increase of 307 people since the 2021 Census, which reported a population of 9,120. The change is inferred from the estimated resident population of 9,360 in June 2024 and an additional 53 validated new addresses since the Census date. This results in a density ratio of 627 persons per square kilometer. Wyong's growth rate of 3.4% since the 2021 census exceeded the SA4 region's growth rate of 3.1%. Overseas migration contributed approximately 56.8% of overall population gains during recent periods.
AreaSearch is using ABS/Geoscience Australia projections for each SA2 area, released in 2024 with a base year of 2022. For areas not covered by this data, AreaSearch uses NSW State Government's SA2 level projections, released in 2022 with a base year of 2021. Growth rates by age group are applied to all areas for years 2032 to 2041. Population projections indicate an increase just below the median of national statistical areas, with Wyong expected to grow by 899 persons to 2041, reflecting an increase of 8.8% over the 17-year period.
Frequently Asked Questions - Population
Development
Residential development activity is lower than average in Wyong according to AreaSearch's national comparison of local real estate markets
Wyong has seen around 33 new homes approved annually over the past five financial years, totalling 166 homes. So far in FY2025/26, 4 approvals have been recorded. On average, one new resident arrives per year for each new home approved between FY2020/21 and FY2024/25, indicating that supply is meeting or exceeding demand. The average construction cost of new properties in Wyong is $266,000, which is below the regional average, suggesting more affordable housing options for buyers.
In this financial year alone, $31.5 million worth of commercial development approvals have been recorded, indicating strong commercial development momentum. When compared to Greater Sydney, Wyong records 16.0% less building activity per person. Nationally, it ranks in the 44th percentile of areas assessed, suggesting somewhat limited buyer options while strengthening demand for established properties. This lower-than-average activity reflects the area's maturity and potential planning constraints. New development in Wyong consists of 41.0% standalone homes and 59.0% townhouses or apartments, indicating a shift towards higher-density living to create more affordable entry points for downsizers, investors, and first-home buyers. This represents a notable change from the area's existing housing composition, which is currently 80.0% houses.
The estimated population density in Wyong is 444 people per dwelling approval, reflecting its quiet and low activity development environment. Future projections estimate that Wyong will add 832 residents by 2041, based on the latest AreaSearch quarterly estimate. With current construction levels, housing supply should adequately meet demand, creating favourable conditions for buyers while potentially enabling growth that exceeds current forecasts.
Frequently Asked Questions - Development
Infrastructure
Wyong has emerging levels of nearby infrastructure activity, ranking in the 33rdth percentile nationally
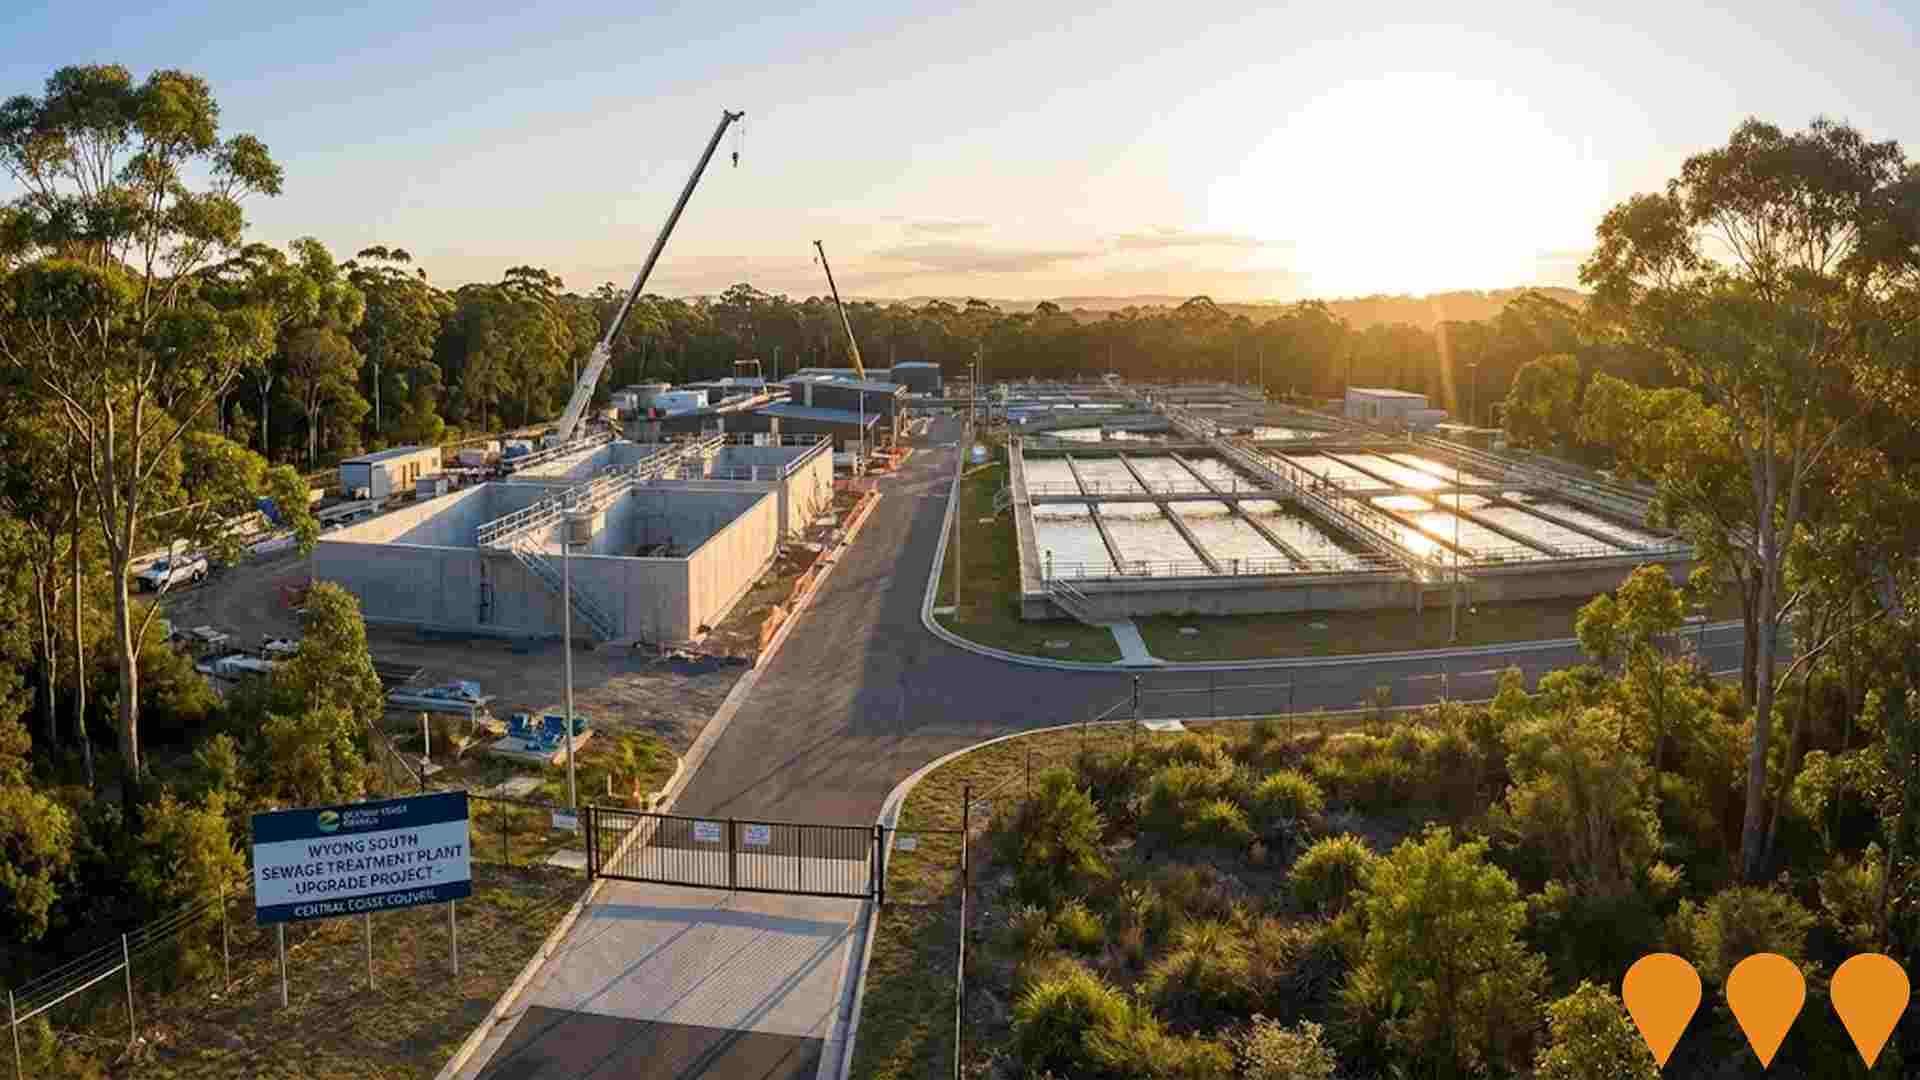
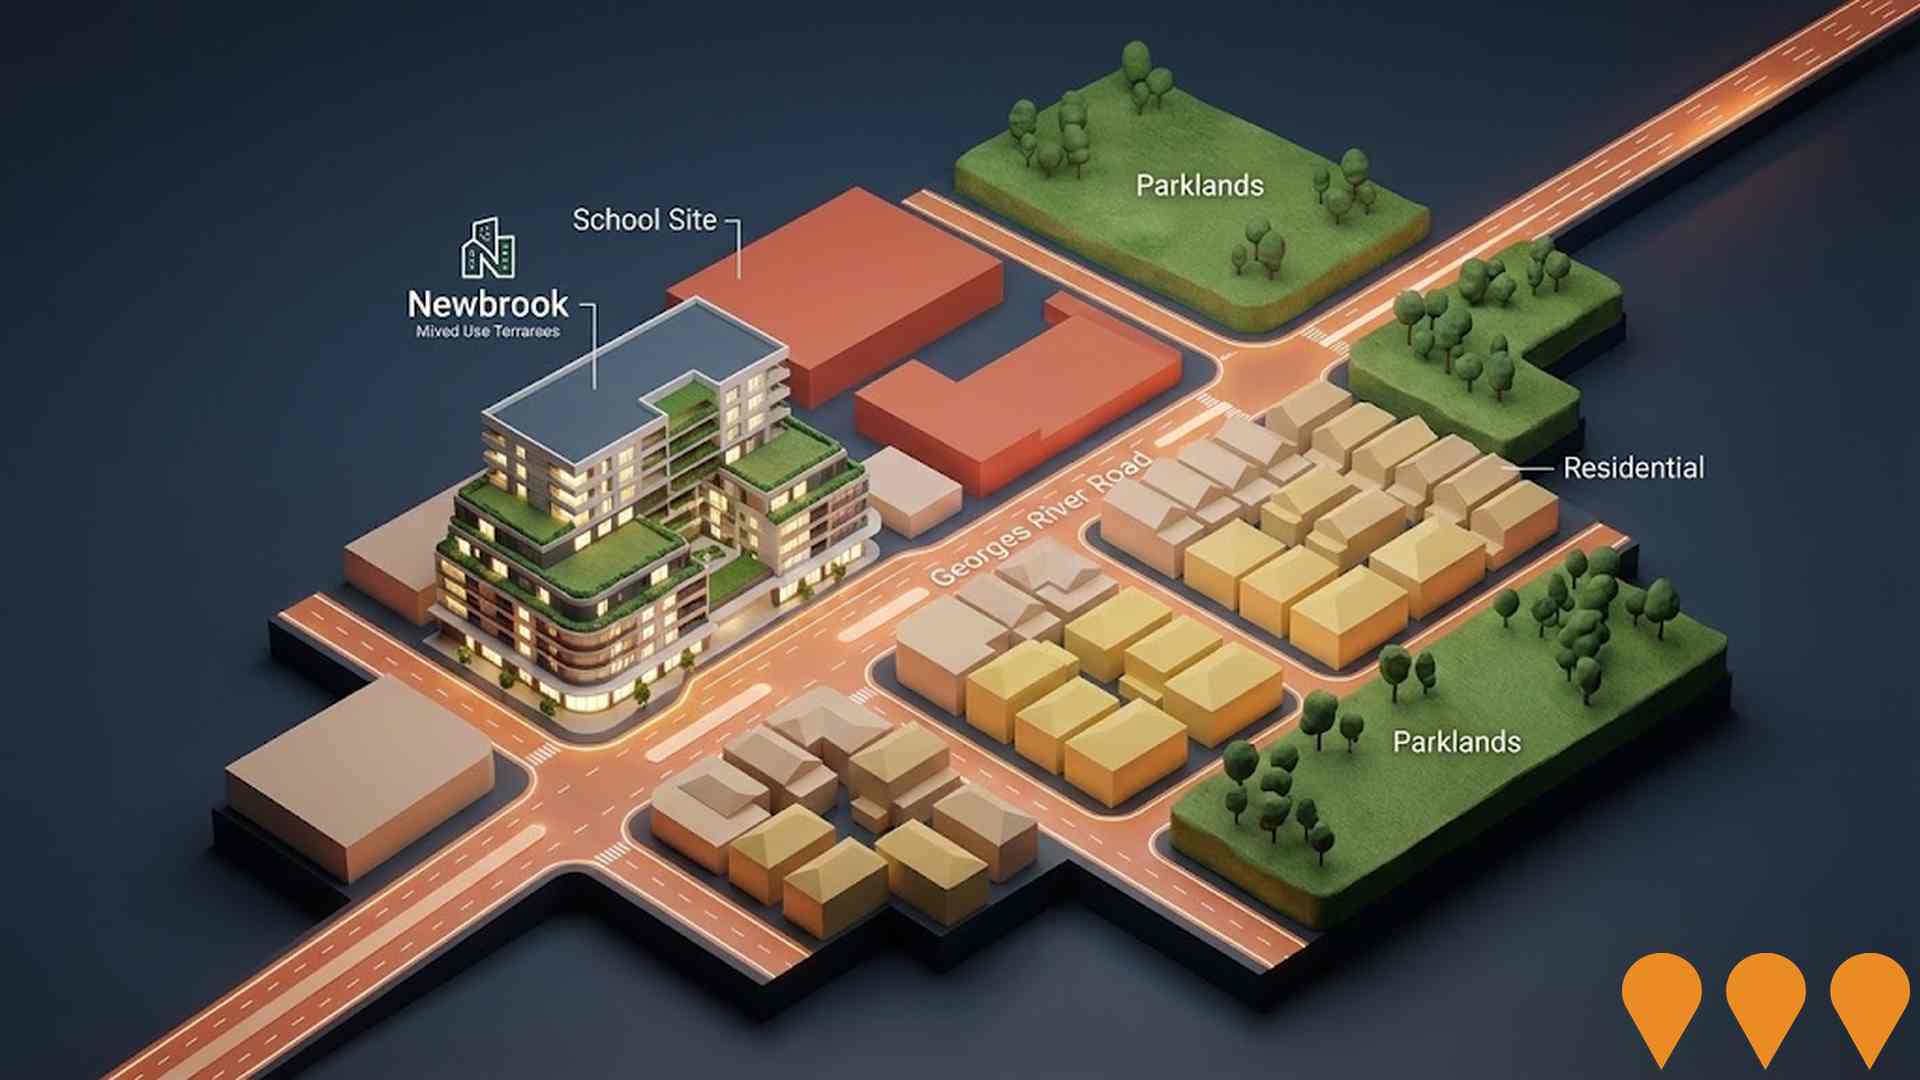
The performance of an area is significantly influenced by changes in local infrastructure, major projects, and planning initiatives. AreaSearch has identified 20 such projects that are expected to impact the area. Notable ones include the Warnervale Water and Sewer Infrastructure Program, Wadalba Small Lot Housing Development, Pacific Highway Upgrade through Wyong Town Centre, and Warnervale Link Road. The following list provides more details on these projects.
Professional plan users can use the search below to filter and access additional projects.
INFRASTRUCTURE SEARCH
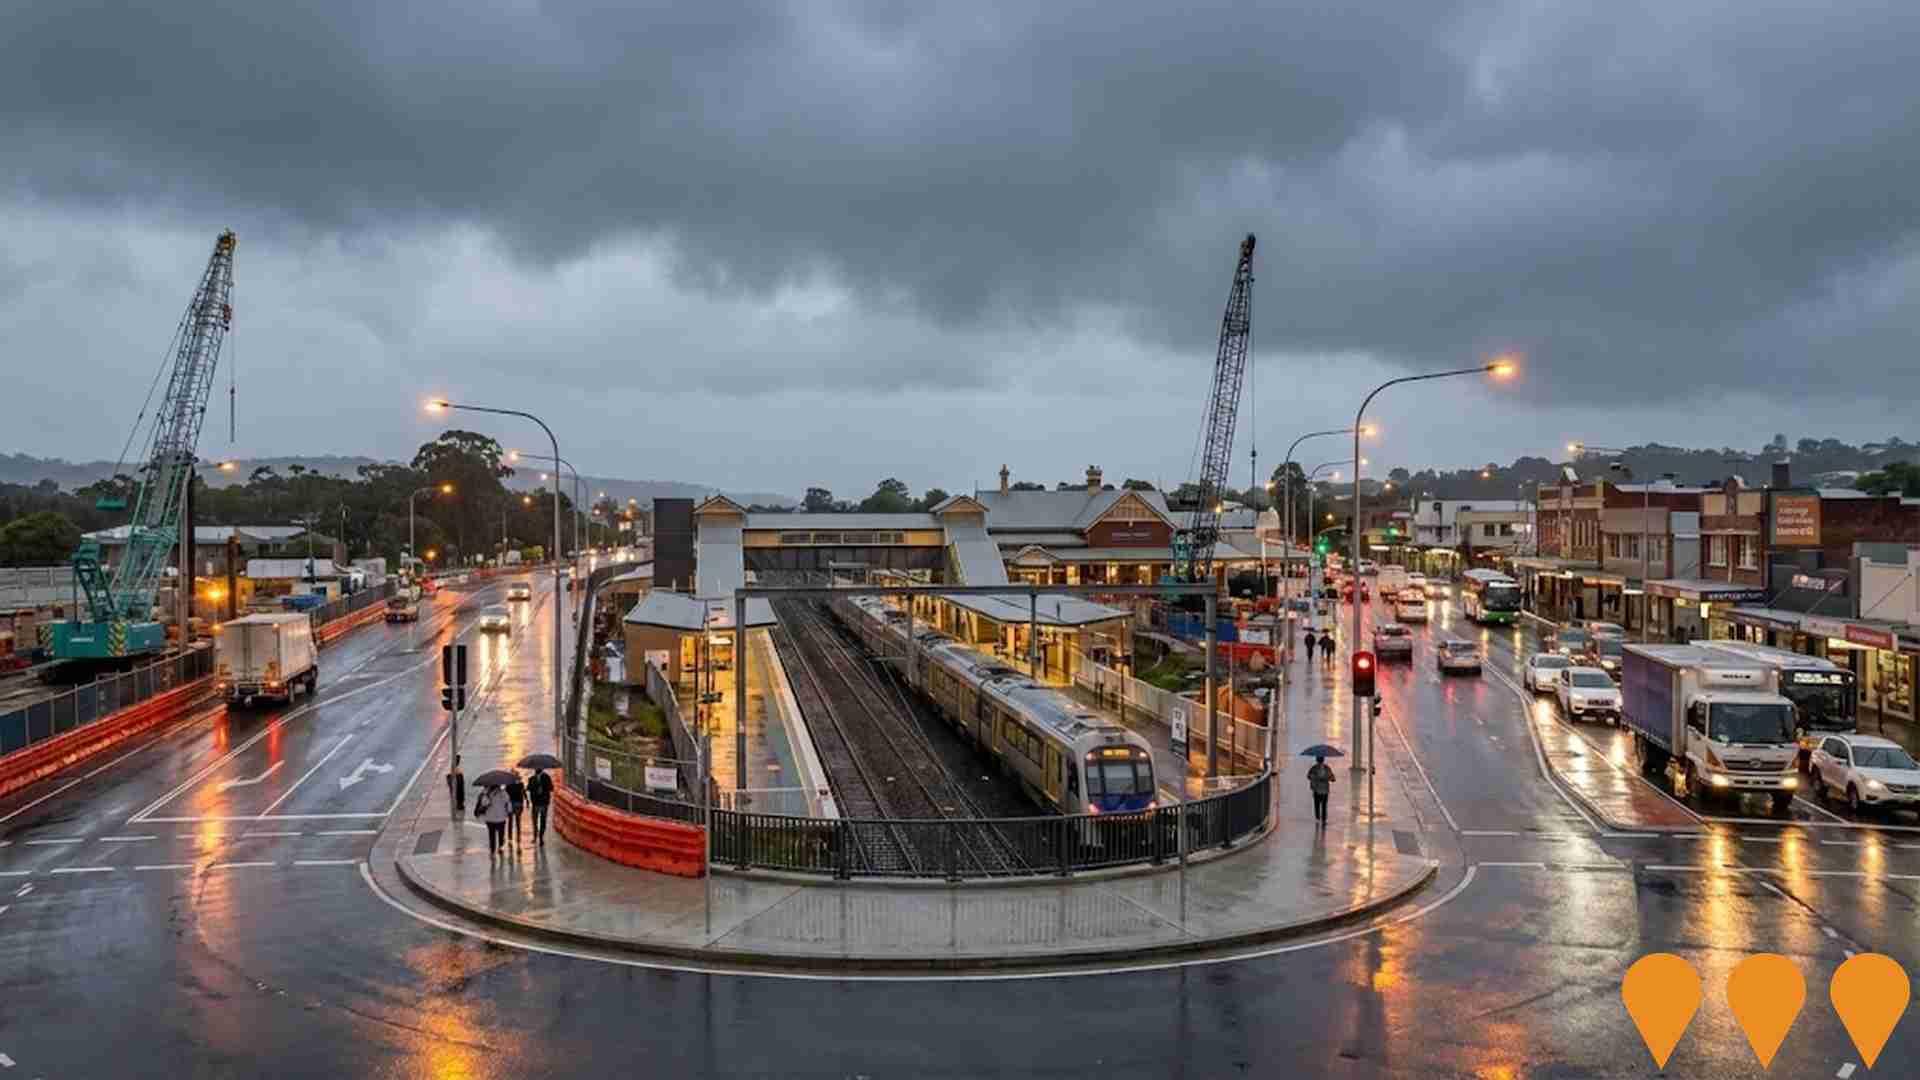
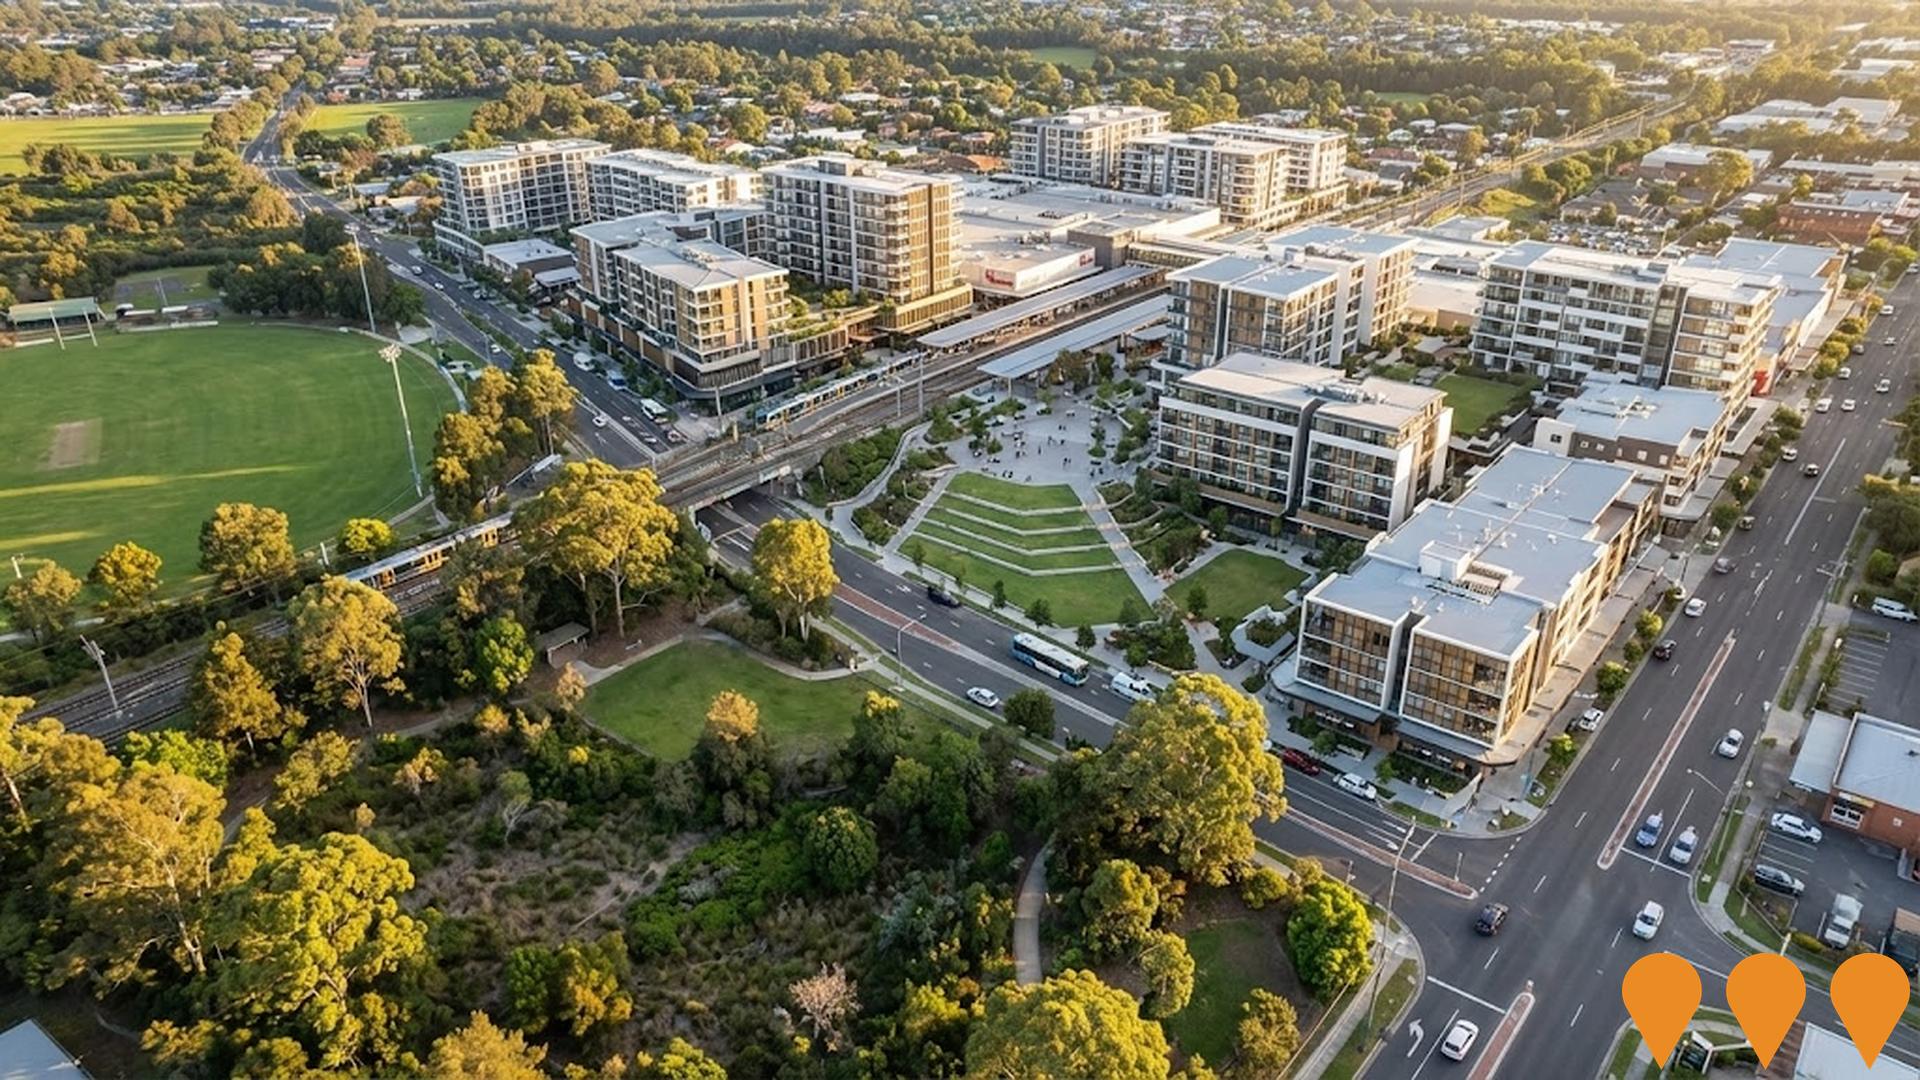
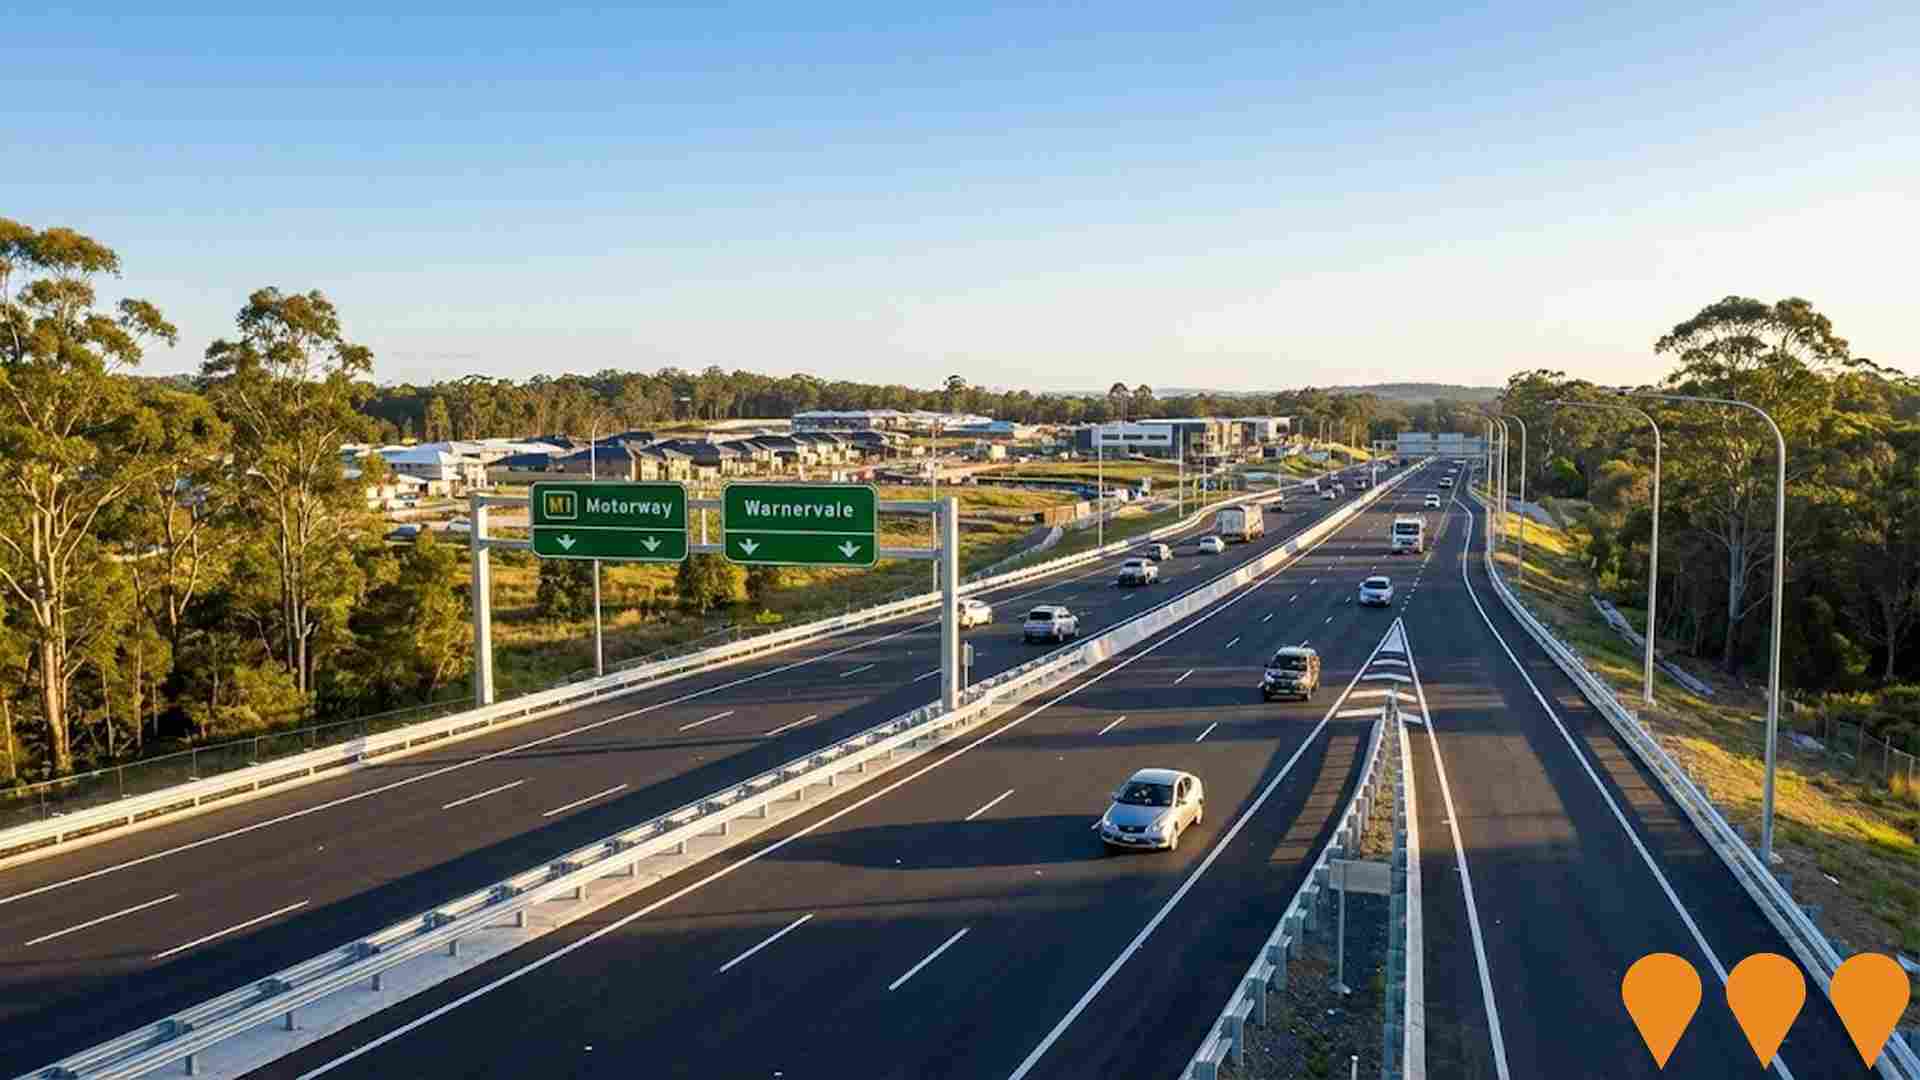
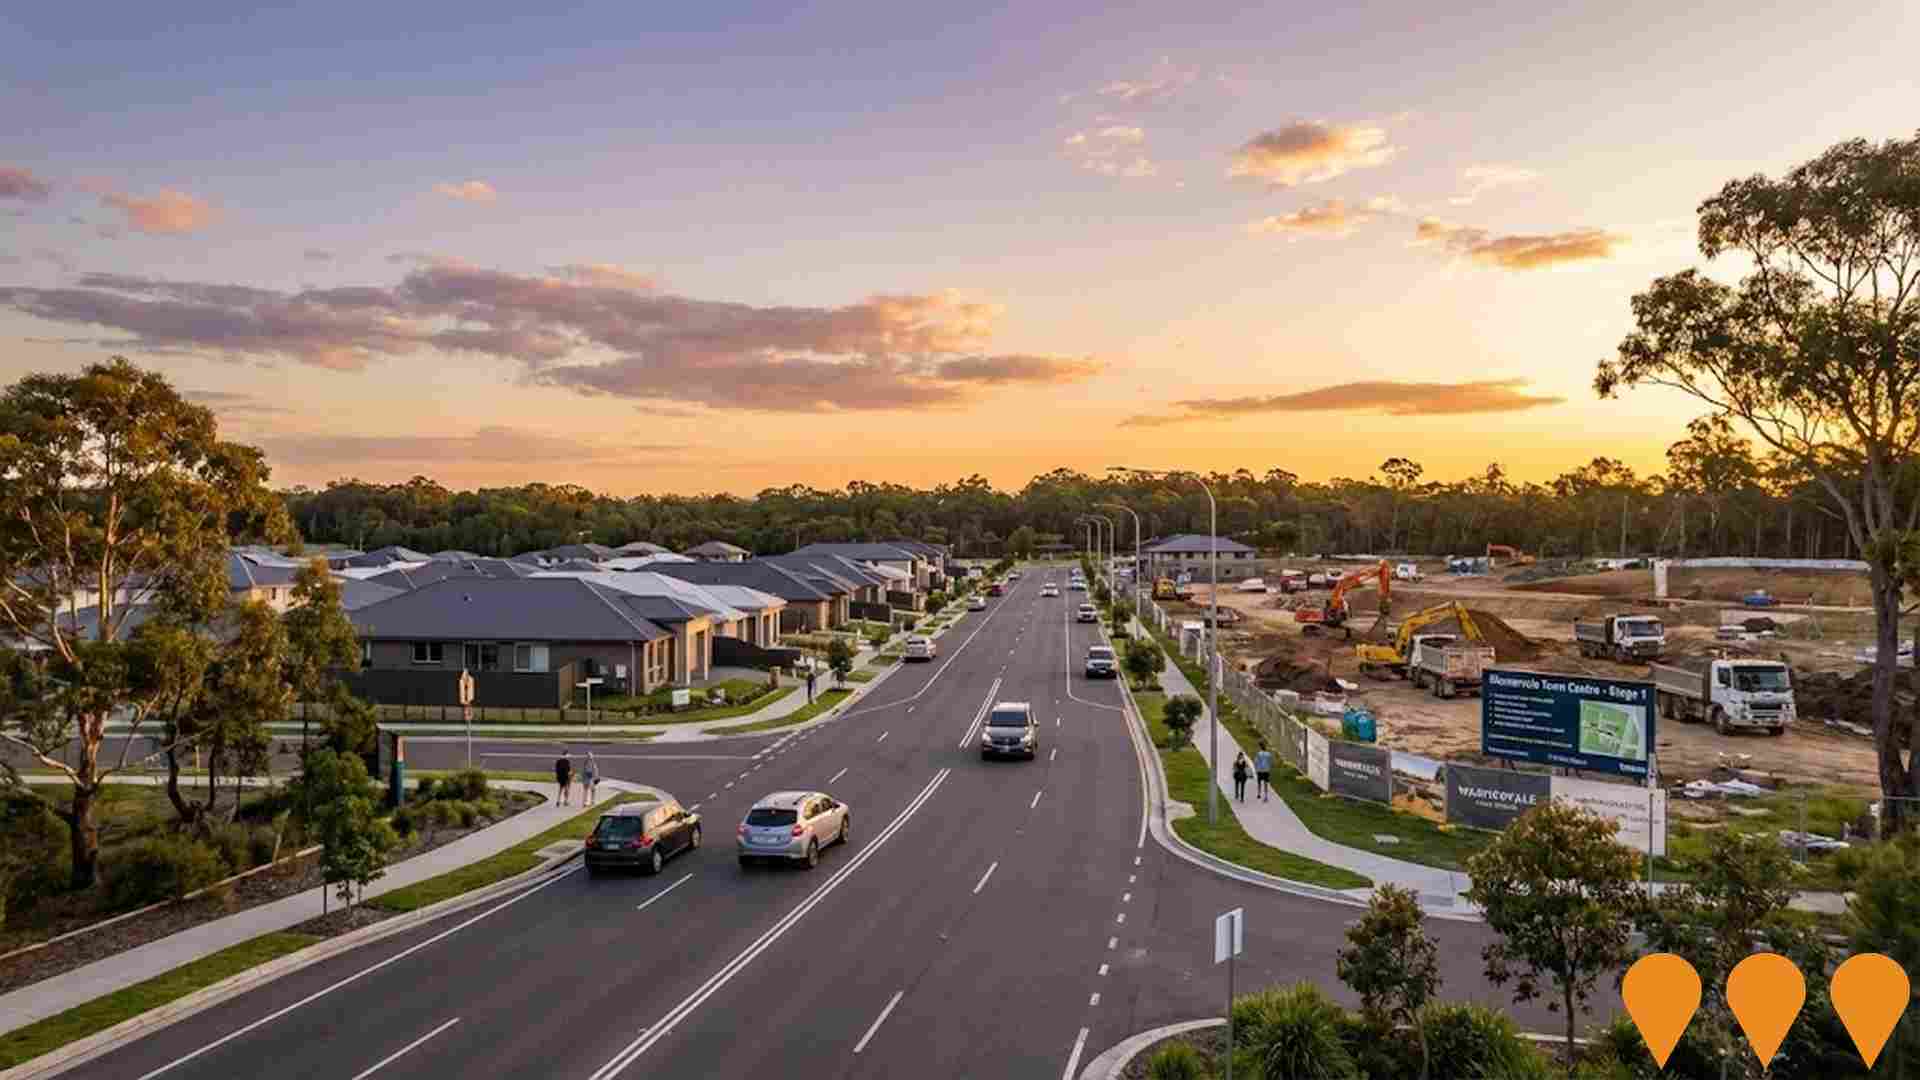
 Denotes AI-based impression for illustrative purposes only, not to be taken as definitive under any circumstances. Please follow links and conduct other investigations from the project's source for actual imagery. Developers and project owners wishing us to use original imagery please Contact Us and we will do so.
Frequently Asked Questions - Infrastructure
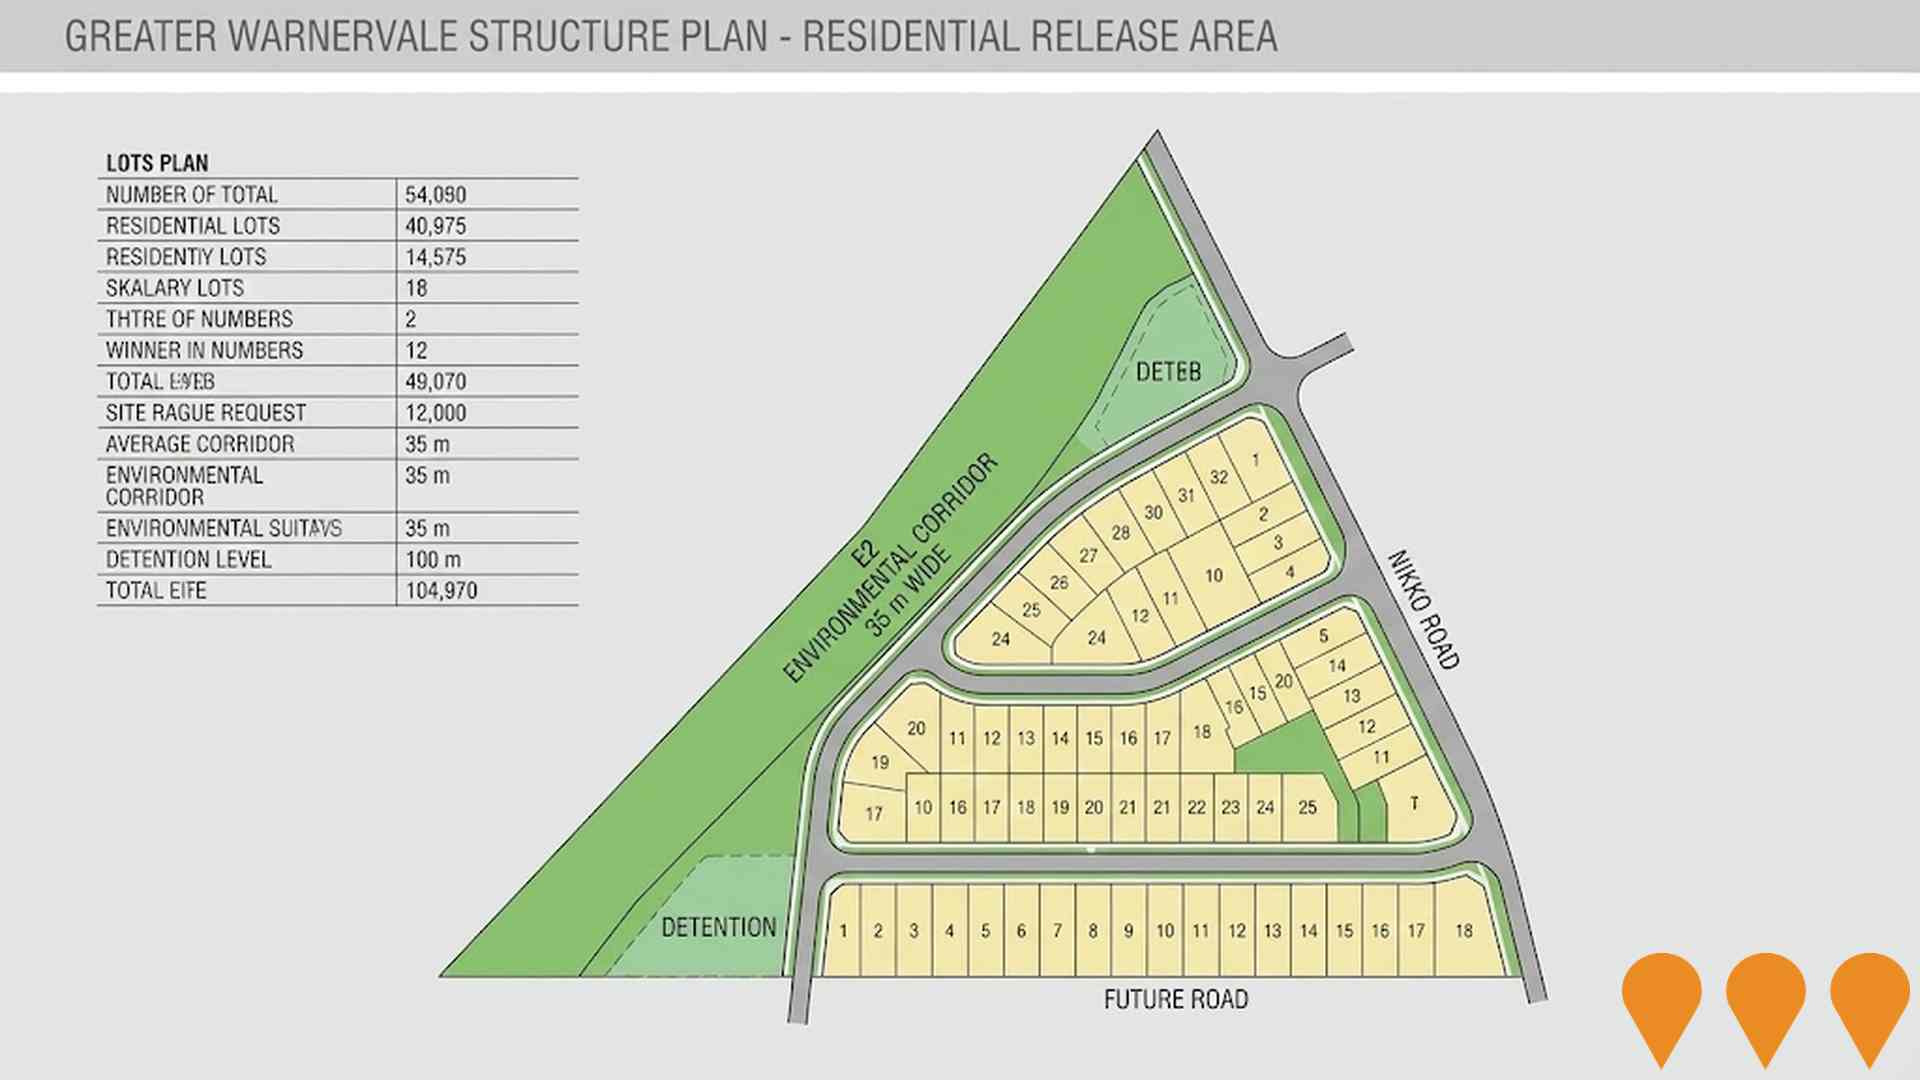
Greater Warnervale Structure Plan
Long-term strategic framework adopted by Central Coast Council in July 2024 to guide sustainable growth in the Greater Warnervale area over the next 20+ years. The plan supports population growth from approximately 20,000 to 57,000 residents through new residential release areas, two new neighbourhood centres, employment lands, community facilities and environmental protection measures.
Wyong Hospital Redevelopment - Stage 3
Stage 3 of the Wyong Hospital Redevelopment delivers a new Cancer Day Unit, Womens Health Clinic, Nunyara Aboriginal Health Unit, Carer Support Unit, expanded medical imaging and workspace, and an upgraded NSW Pathology laboratory. This $200 million+ multi-stage project (Stage 3 valued at approximately $19 million) continues to expand and modernise healthcare services for the growing Central Coast population.

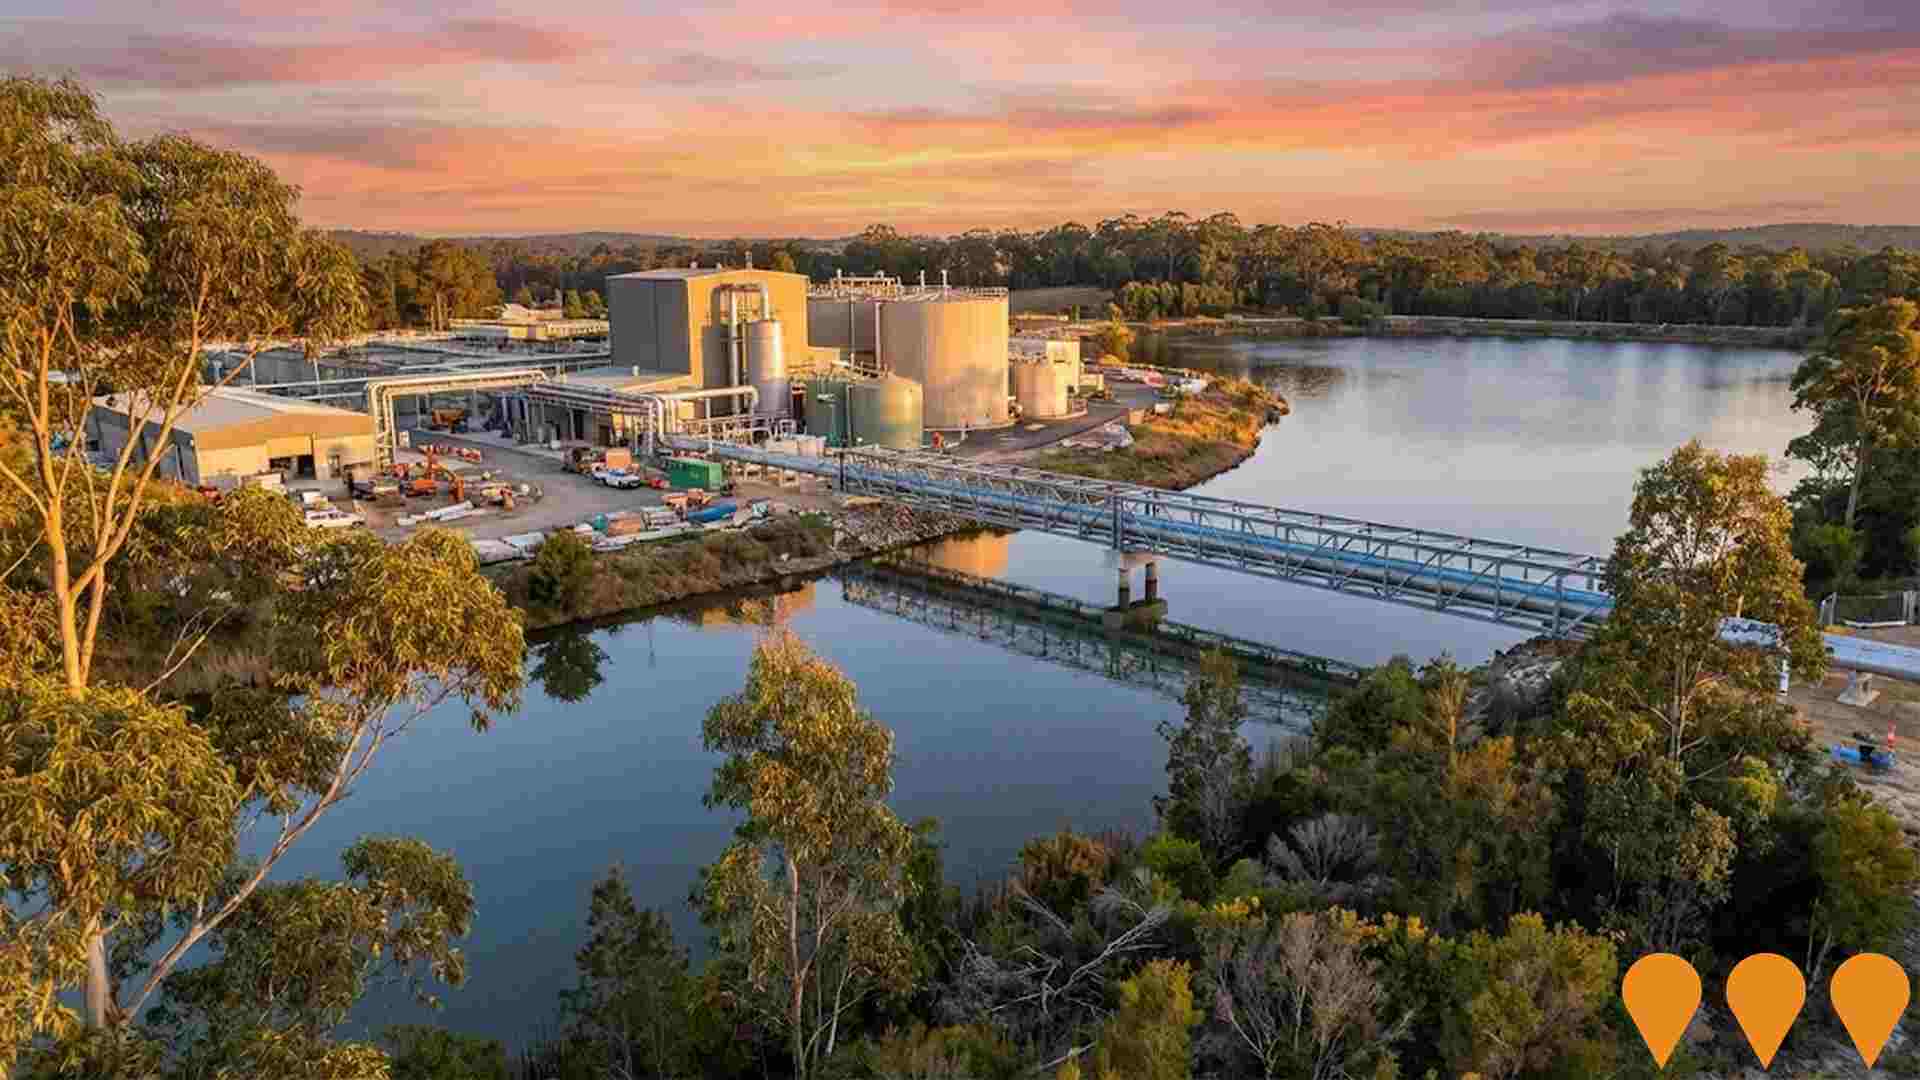
Warnervale Water and Sewer Infrastructure Program
Central Coast Council's multi-stage water and sewer infrastructure program to support growth in the Warnervale area. Includes the completed Mardi to Warnervale Pipeline (2023), ongoing sewer rising main upgrades, water and sewer network extensions in Warnervale Town Centre, and a major upgrade and expansion of Mardi Water Treatment Plant to increase capacity.
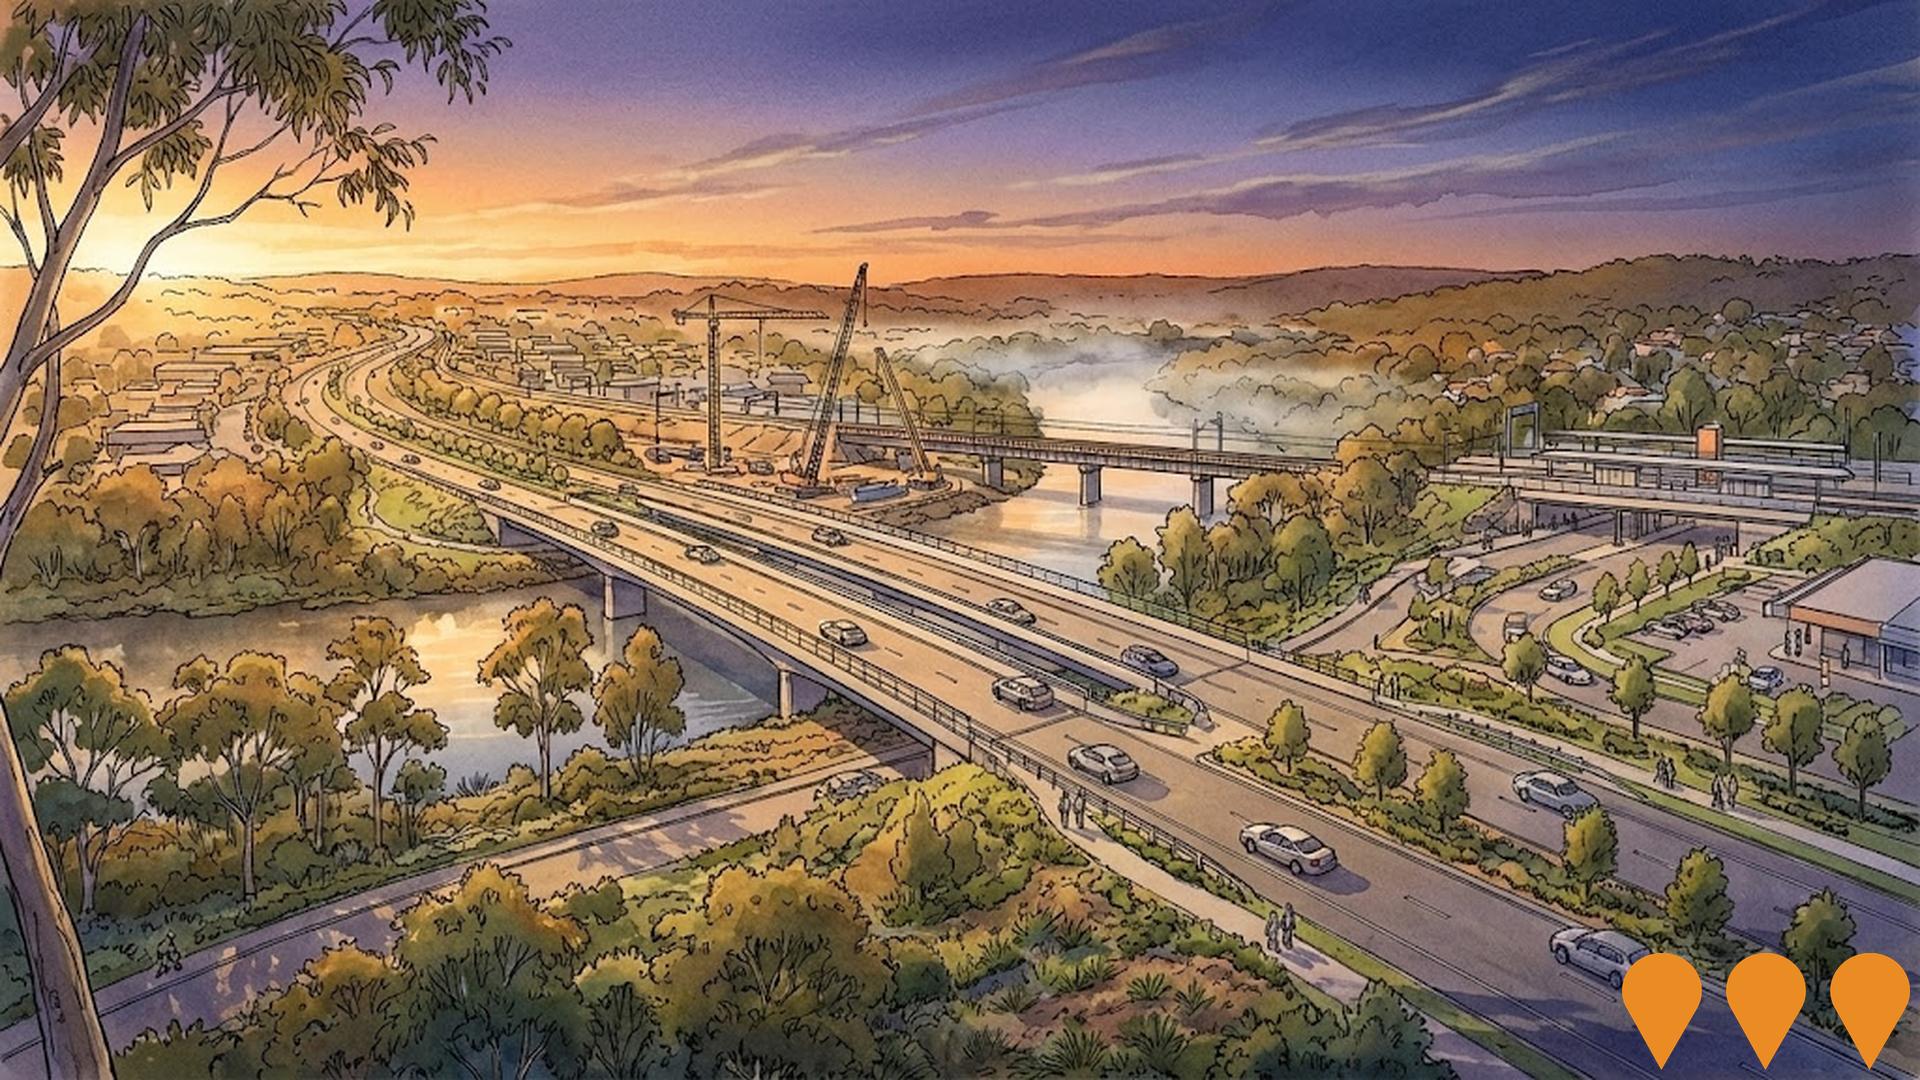
Pacific Highway Upgrade through Wyong Town Centre
Major upgrade to duplicate the Pacific Highway to two lanes in each direction between Johnson Road, Tuggerah and Cutler Drive, Wyong. The project includes replacing the Wyong River bridges, upgrading the Rose Street rail bridge, and improving the Wyong Station transport interchange to reduce congestion and improve travel times.
Warnervale Town Centre
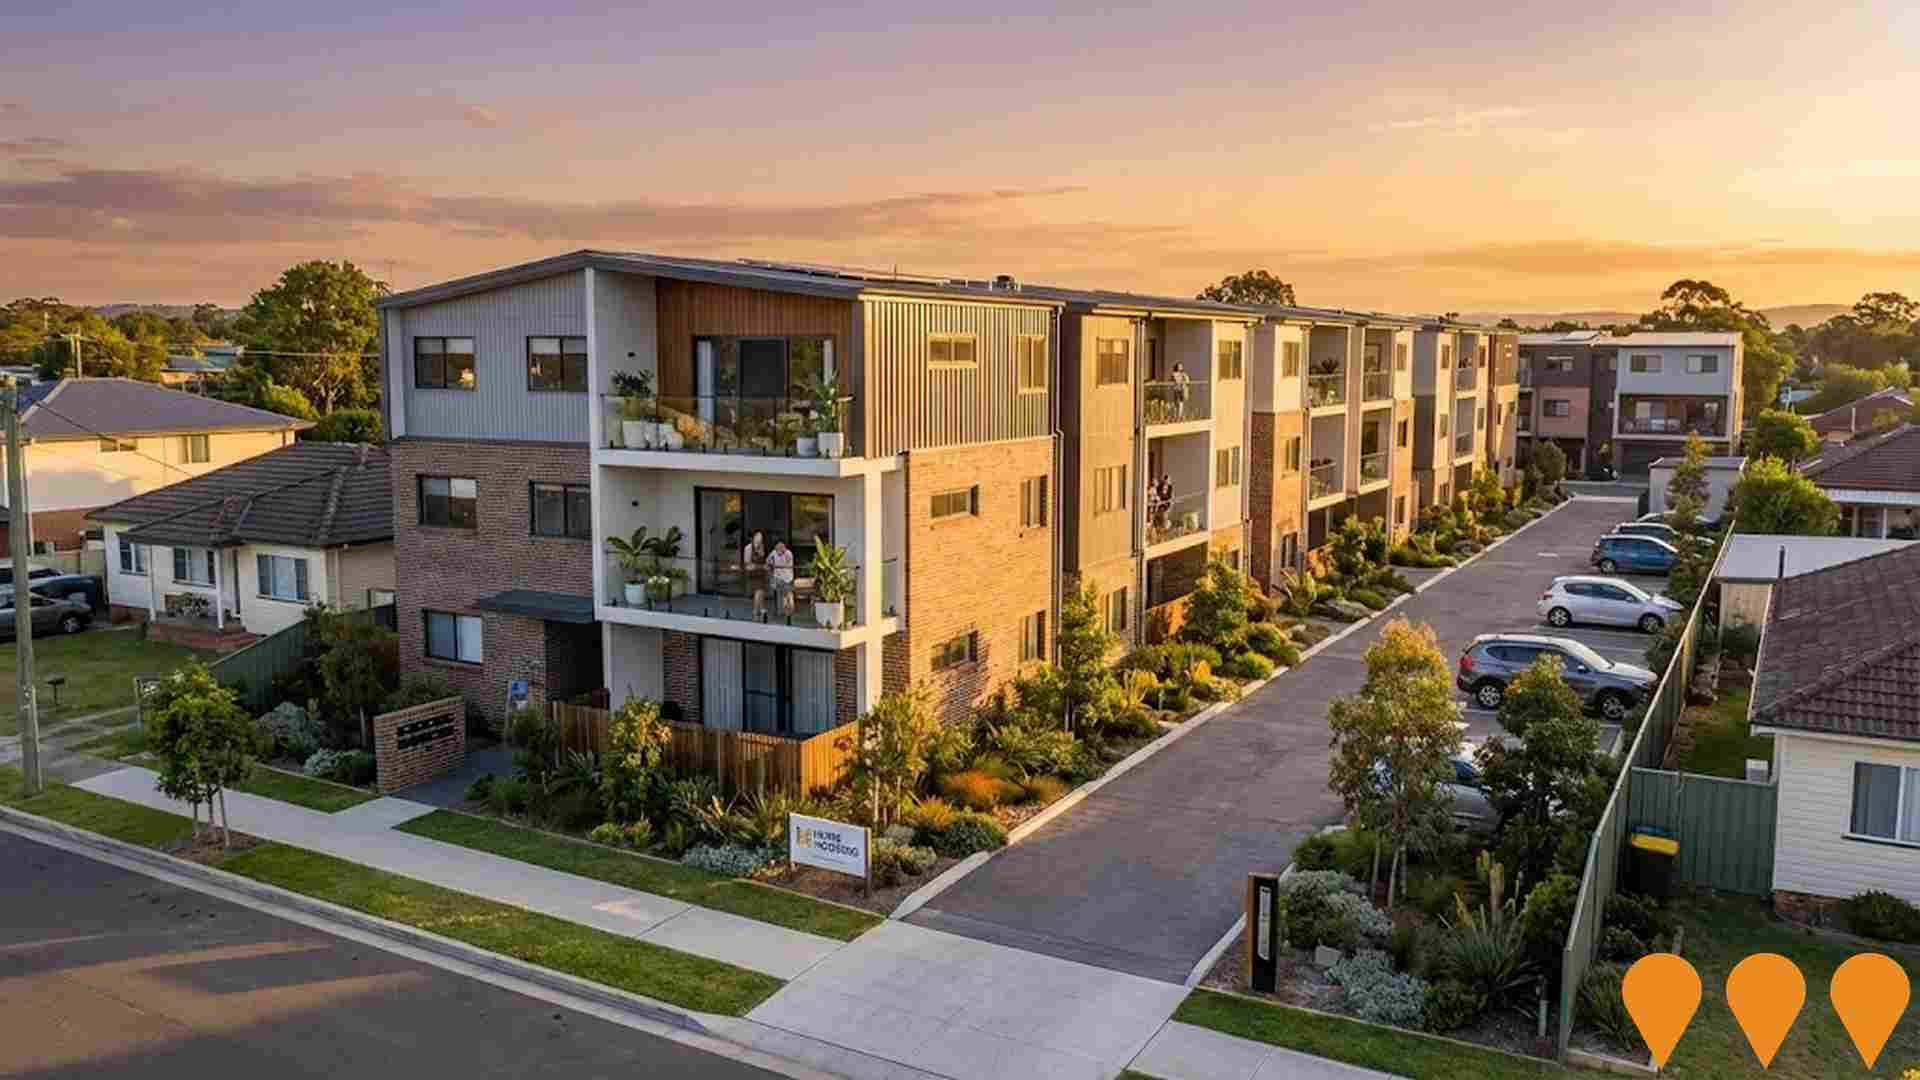
Masterplanned town centre delivering a new mixed-use precinct on the Central Coast. Includes a full-line Woolworths supermarket, specialty retail, medical centre, childcare facility, community amenities, parklands and staged release of residential land (approximately 200+ lots across multiple stages). The project will deliver significant new housing, retail and employment opportunities in Warnervale.
Tuggerah Precinct Activation - Westfield Redevelopment
A transformational $2.8 billion mixed-use redevelopment of Westfield Tuggerah and surrounding 70.85 hectares to create a new town centre. The project includes up to 5,000 new homes (with the Tuggerah Gateway Planning Proposal for the residential component achieving rezoning approval in 2025), a transport interchange, health and education services, and expanded retail and leisure offerings. It features 18 hectares of parkland and is an integrated transport-oriented development.
Warnervale Link Road
Key enabling transport infrastructure project - new arterial road connecting the M1 Motorway to the Warnervale area, improving traffic flow and supporting future development in the Warnervale business and residential precincts. Enhances Central Coast connectivity and economic potential, supporting residential and business growth.
Warnervale Town Centre Development Control Plan (WTC DCP)
Provides detailed planning provisions for the Warnervale Town Centre site, aiming to create a compact, well-connected urban area with housing, jobs, services, community facilities, and entertainment. It sets guidelines for development, including retail premises over 5,000 sqm or $10M capital investment value as State Significant Development (SSD).
Employment
Employment drivers in Wyong are experiencing difficulties, placing it among the bottom 20% of areas assessed across Australia
Wyong has a balanced workforce with both white and blue collar jobs. Key sectors include essential services.
The unemployment rate was 8.8% in September 2024, with an estimated employment growth of 1.7%. As of September 2025, 3,970 residents are employed, with an unemployment rate of 4.6%, compared to Greater Sydney's 4.2%. Workforce participation is lower at 50.6% versus Greater Sydney's 60.0%. Leading industries for Wyong residents are health care & social assistance, retail trade, and construction, with healthcare being particularly notable at 1.3 times the regional average.
However, professional & technical jobs are under-represented at 4.6%, compared to Greater Sydney's 11.5%. The worker-to-resident ratio is 0.6, indicating local employment opportunities above the norm. Over the year to September 2025, employment increased by 1.7% while labour force grew by 3.2%, leading to a 1.4 percentage point rise in unemployment rate. In comparison, Greater Sydney saw employment grow by 2.1%, labour force expand by 2.4%, and unemployment rise by 0.2 percentage points. State-level data from NSW as of 25-Nov shows employment contracted by 0.03% (losing 2,260 jobs), with a state unemployment rate of 3.9%. Nationally, the unemployment rate is 4.3%. Job and Skills Australia's national employment forecasts from May-25 suggest that national employment will grow by 6.6% over five years and 13.7% over ten years. Applying these projections to Wyong's employment mix indicates local employment should increase by 6.4% over five years and 13.5% over ten years, though this is a simple extrapolation for illustrative purposes only.
Frequently Asked Questions - Employment
Income
Income figures position the area below 75% of locations analysed nationally by AreaSearch
Wyong SA2 had a median taxpayer income of $45,116 and an average of $54,821 in financial year 2022, according to postcode level ATO data aggregated by AreaSearch. This was below the national average, with Greater Sydney's median income being $56,994 and average income $80,856 during the same period. By September 2025, estimated median income would be approximately $50,805 and average $61,734, based on Wage Price Index growth of 12.61%. Census data shows Wyong's household, family, and personal incomes all fall between the 14th and 14th percentiles nationally. The earnings profile indicates that 27.5% of residents (2,592 people) earn between $1,500 - 2,999, similar to regional levels where 30.9% occupy this range. Housing affordability pressures are severe in Wyong, with only 78.6% of income remaining, ranking at the 11th percentile nationally.
Frequently Asked Questions - Income
Housing
Wyong is characterized by a predominantly suburban housing profile, with a higher proportion of rental properties than the broader region
Wyong's dwelling structure, as per the latest Census, consisted of 79.7% houses and 20.3% other dwellings (semi-detached, apartments, 'other' dwellings). In contrast, Sydney metro had 83.2% houses and 16.7% other dwellings. Home ownership in Wyong was at 30.3%, with mortgaged dwellings at 29.3% and rented ones at 40.4%. The median monthly mortgage repayment in Wyong was $1,690, lower than Sydney metro's $1,900. The median weekly rent in Wyong was $360, compared to Sydney metro's $385. Nationally, Wyong's mortgage repayments were below the Australian average of $1,863, and rents were less than the national figure of $375.
Frequently Asked Questions - Housing
Household Composition
Wyong features high concentrations of group households, with a lower-than-average median household size
Family households account for 66.3% of all households, including 23.2% couples with children, 23.9% couples without children, and 17.8% single parent families. Non-family households constitute the remaining 33.7%, with lone person households at 29.3% and group households comprising 4.3%. The median household size is 2.4 people, which is smaller than the Greater Sydney average of 2.5.
Frequently Asked Questions - Households
Local Schools & Education
Educational outcomes in Wyong fall within the lower quartile nationally, indicating opportunities for improvement in qualification attainment
The area's university qualification rate is 14.5%, significantly lower than Greater Sydney's average of 38.0%. This difference presents both a challenge and an opportunity for targeted educational initiatives. Bachelor degrees are the most common at 10.6%, followed by postgraduate qualifications (2.5%) and graduate diplomas (1.4%). Vocational credentials are prevalent, with 40.6% of residents aged 15 and above holding them, including advanced diplomas (10.1%) and certificates (30.5%).
Educational participation is high, with 29.6% of residents currently enrolled in formal education. This includes primary education (9.8%), secondary education (8.1%), and tertiary education (3.6%).
Frequently Asked Questions - Education
Schools Detail
Nearby Services & Amenities
Transport
Transport servicing is high compared to other areas nationally based on assessment of service frequency, route connectivity and accessibility
Wyong has 103 active public transport stops offering a mix of train and bus services. These stops are served by 85 individual routes, collectively facilitating 4,224 weekly passenger trips. The accessibility of transport is rated excellent, with residents typically located 178 meters from the nearest stop.
On average, service frequency across all routes is 603 trips per day, equating to approximately 41 weekly trips per stop.
Frequently Asked Questions - Transport
Transport Stops Detail
Health
Health performance in Wyong is well below average with prevalence of common health conditions notable across both younger and older age cohorts
Wyong faces significant health challenges, as indicated by data on common health conditions affecting both younger and older age groups. Private health cover is low in Wyong at approximately 47% (around 4,449 people), compared to 49.3% across Greater Sydney and the national average of 55.3%. Mental health issues and arthritis are the most prevalent conditions, affecting 11.9% and 9.9% of residents respectively.
Around 60.6% of Wyong residents report no medical ailments, compared to 61.5% in Greater Sydney. The area has 19.6% (1,848 people) of residents aged 65 and over, lower than the 22.3% in Greater Sydney. Health outcomes among seniors present similar challenges to those faced by the general population.
Frequently Asked Questions - Health
Cultural Diversity
Wyong ranks below the Australian average when compared to other local markets across a number of language and cultural background related metrics
Wyong had a cultural diversity level below average, with 86.4% citizens, 82.4% born in Australia, and 89.5% speaking English only at home. Christianity was the predominant religion, comprising 53.1%, compared to Greater Sydney's 56.2%. The top three ancestry groups were Australian (29.8%), English (29.7%), and Irish (7.2%).
Notably, Australian Aboriginal representation was higher at 5.2% versus the regional average of 4.5%, Spanish was at 0.6% compared to 0.3%, and Maori was at 0.8% compared to 0.6%.
Frequently Asked Questions - Diversity
Age
Wyong's population is slightly older than the national pattern
Wyong has a median age of 40, which is slightly higher than Greater Sydney's figure of 37 and Australia's national average of 38 years. Compared to the Greater Sydney average, Wyong has a notably higher proportion of individuals aged 55-64 (13.3%) and a lower proportion of those aged 35-44 (11.6%). Between 2021 and present, the population aged 75 to 84 has increased from 6.0% to 7.2%, while the 45 to 54 age group has decreased from 13.2% to 12.4%. By 2041, demographic modeling suggests Wyong's age profile will change significantly. The 75 to 84 age cohort is projected to grow by 236 people (35%), reaching 918 individuals. Notably, the combined age groups of 65 and above are expected to account for 71% of total population growth, reflecting Wyong's aging demographic profile. Conversely, the 35 to 44 and 5 to 14 age cohorts are projected to experience population declines.
