Chart Color Schemes
This analysis uses ABS Statistical Areas Level 2 (SA2) boundaries, which can materially differ from Suburbs and Localities (SAL) even when sharing similar names.
SA2 boundaries are defined by the Australian Bureau of Statistics and are designed to represent communities for statistical reporting (e.g., census and ERP).
Suburbs and Localities (SAL) represent commonly-used suburb/locality names (postal-style areas) and may use different geographic boundaries. For comprehensive analysis, consider reviewing both boundary types if available.
est. as @ -- *
ABS ERP | -- people | --
2021 Census | -- people
Sales Activity
Curious about local property values? Filter the chart to assess the volume and appreciation (including resales) trends and regional comparisons, or scroll to the map below view this information at an individual property level.
Find a Recent Sale
Sales Detail
Population
Population growth drivers in Singleton Surrounds are above average based on AreaSearch's ranking of recent, and medium to long-term trends
Singleton Surrounds' population is approximately 5,555 as of November 2025. This figure reflects a growth of 223 people since the 2021 Census, which recorded a population of 5,332. The increase is inferred from an estimated resident population of 5,480 in June 2024 and an additional 110 validated new addresses since the Census date. This results in a population density of 1.4 persons per square kilometer. Singleton Surrounds' growth rate of 4.2% since the Census is within 0.9 percentage points of the non-metro area's growth rate of 5.1%. The primary driver for this growth was natural increase, contributing approximately 67.0% of overall population gains.
Other factors such as overseas and interstate migration also played positive roles. AreaSearch uses ABS/Geoscience Australia projections released in 2024 with a base year of 2022 for each SA2 area. For areas not covered by this data, NSW State Government's SA2 level projections released in 2022 with a base year of 2021 are used. Growth rates by age group from these aggregations are applied to all areas for years 2032 to 2041. Based on projected demographic shifts, Singleton Surrounds is expected to increase its population by 904 persons by 2041, reflecting a total increase of 14.9% over the 17-year period.
Frequently Asked Questions - Population
Development
AreaSearch analysis of residential development drivers sees Singleton Surrounds recording a relatively average level of approval activity when compared to local markets analysed countrywide
Singleton Surrounds has recorded approximately 14 residential properties granted approval annually over the past five financial years, totalling 70 homes. In FY-26 so far, 3 approvals have been recorded. On average, 3.7 people move to the area each year for every dwelling built between FY-21 and FY-25, indicating high demand outpacing supply. The average construction value of new homes is $444,000.
This financial year has seen $33.6 million in commercial approvals, reflecting significant local commercial activity. Compared to the Rest of NSW, Singleton Surrounds records markedly lower building activity, which is 75.0% below the regional average per person. Recent development has been exclusively detached dwellings, preserving the area's low density nature with around 323 people per dwelling approval. By 2041, Singleton Surrounds is forecasted to gain 829 residents, and building activity is keeping pace with growth projections.
Population forecasts indicate Singleton Surrounds will gain 829 residents through to 2041 (from the latest AreaSearch quarterly estimate). Building activity is keeping pace with growth projections, though buyers may experience heightened competition as the population grows.
Frequently Asked Questions - Development
Infrastructure
Singleton Surrounds has limited levels of nearby infrastructure activity, ranking in the 0thth percentile nationally
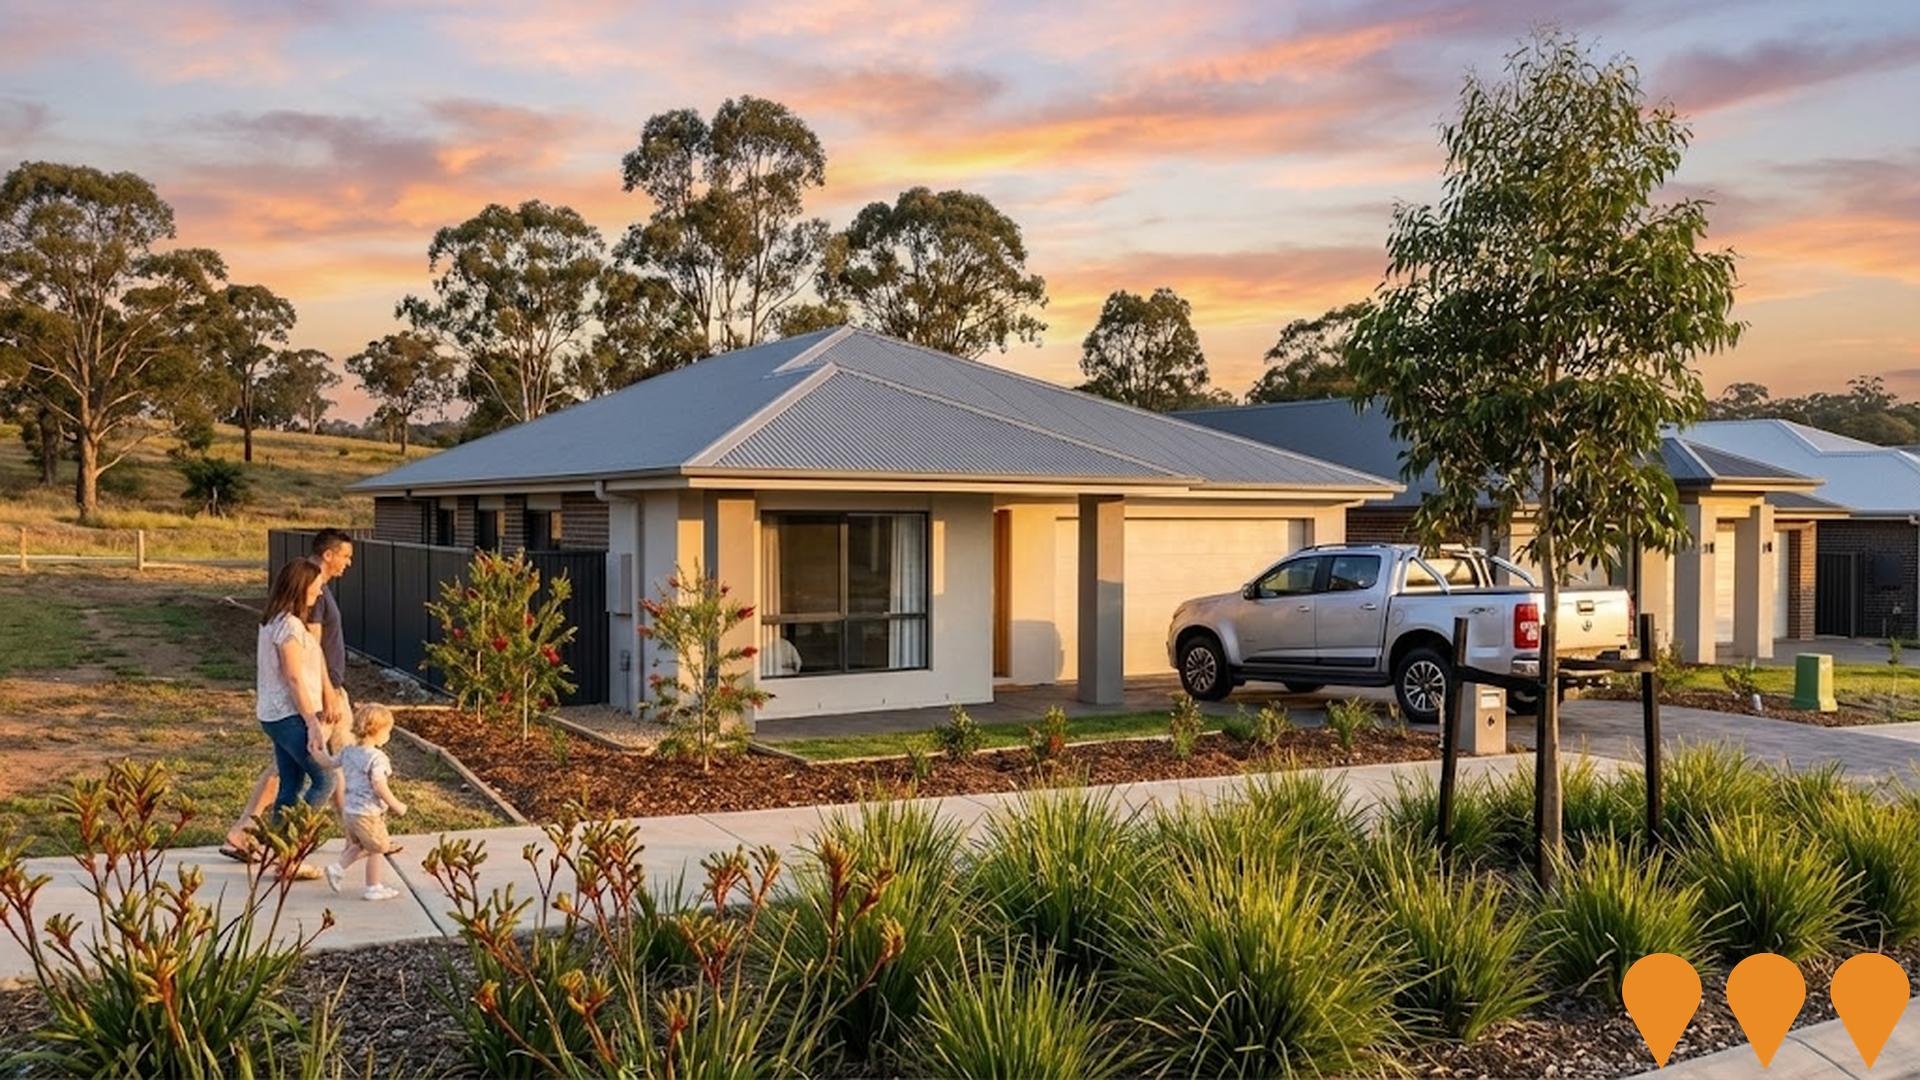
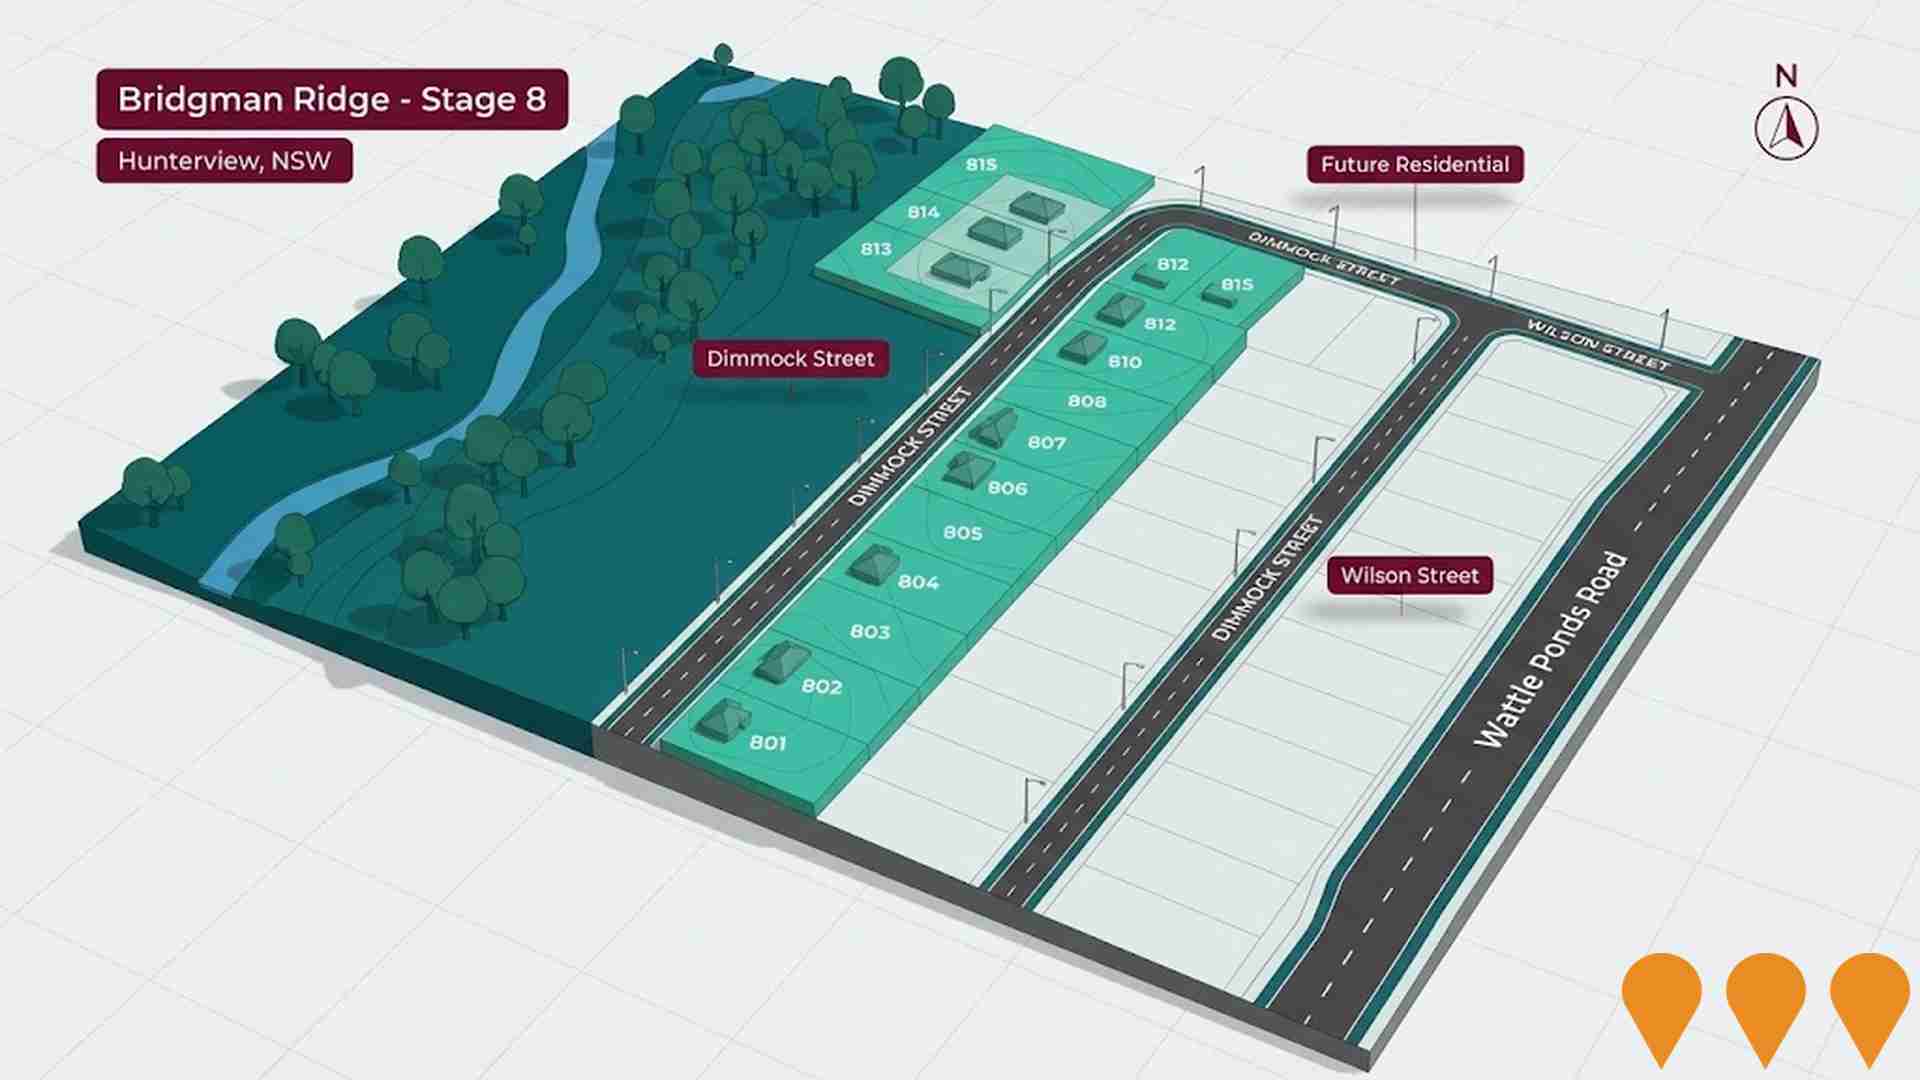
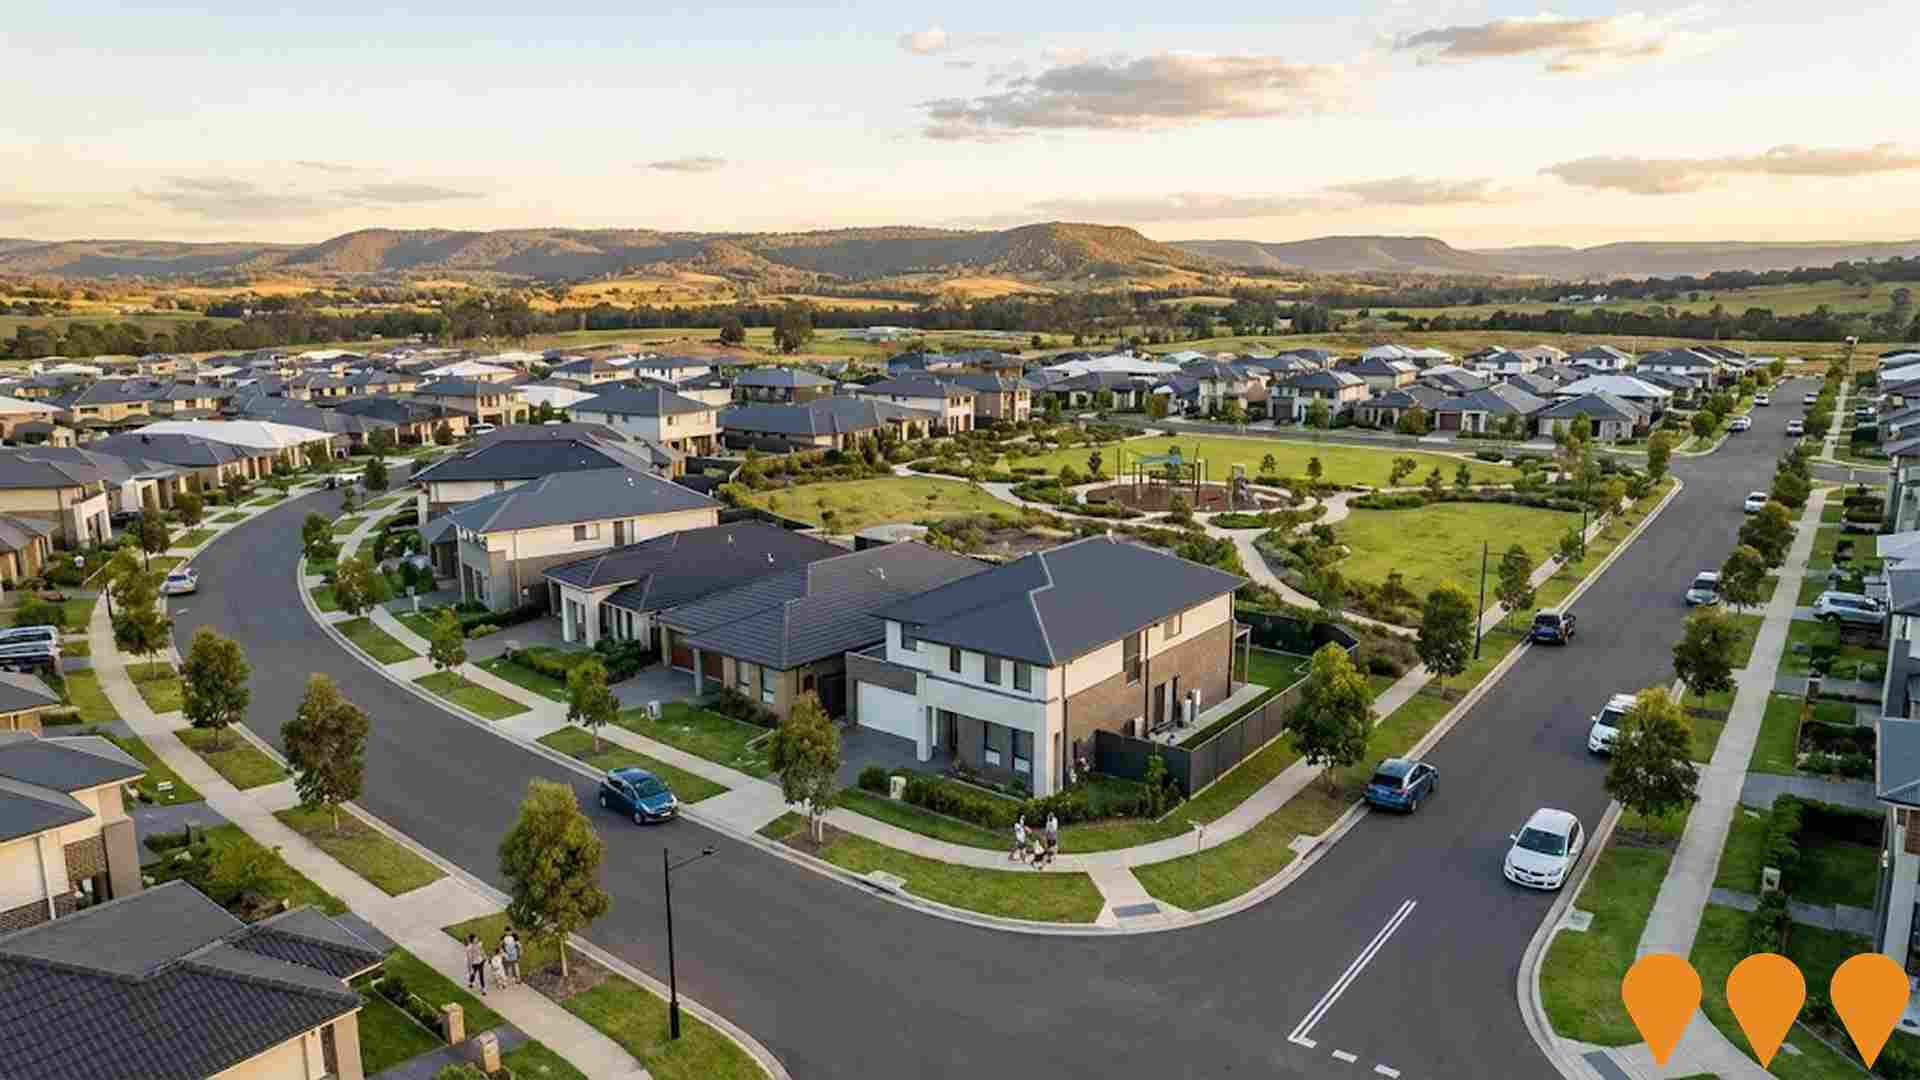
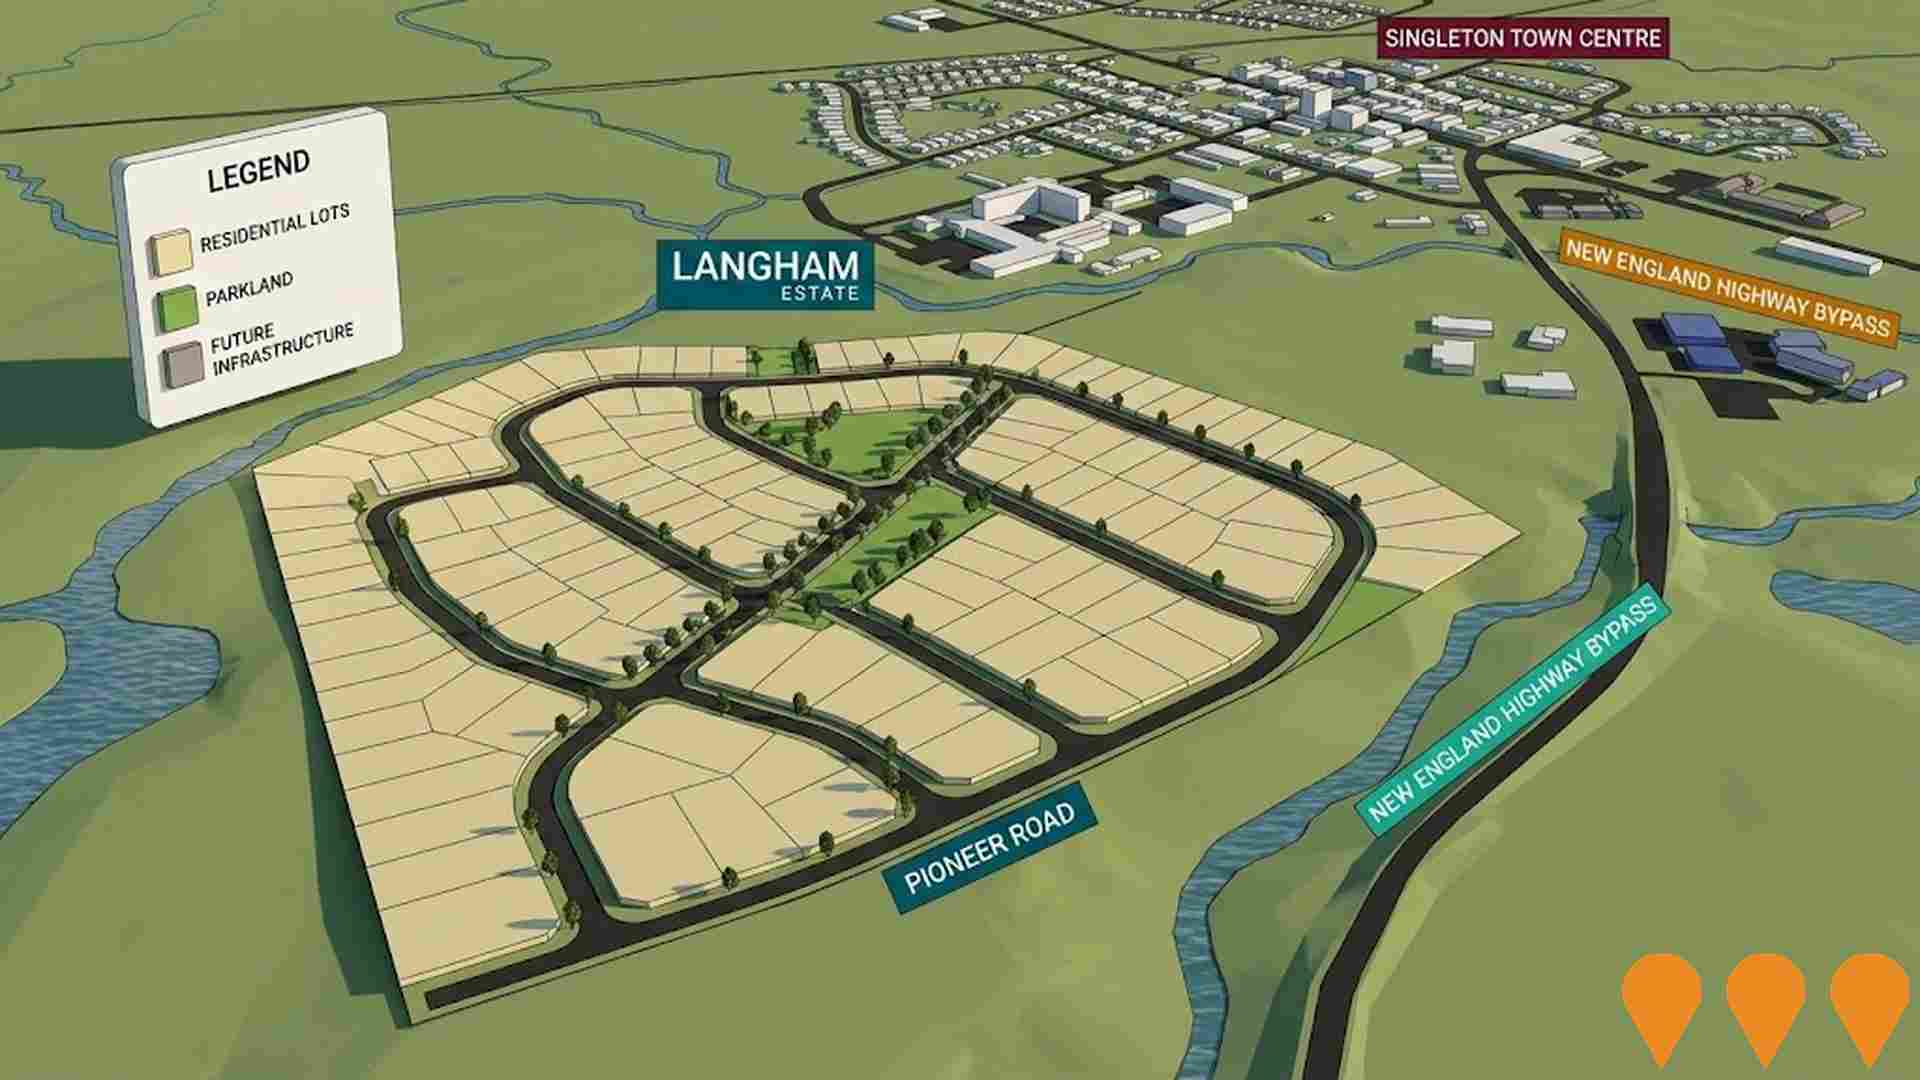
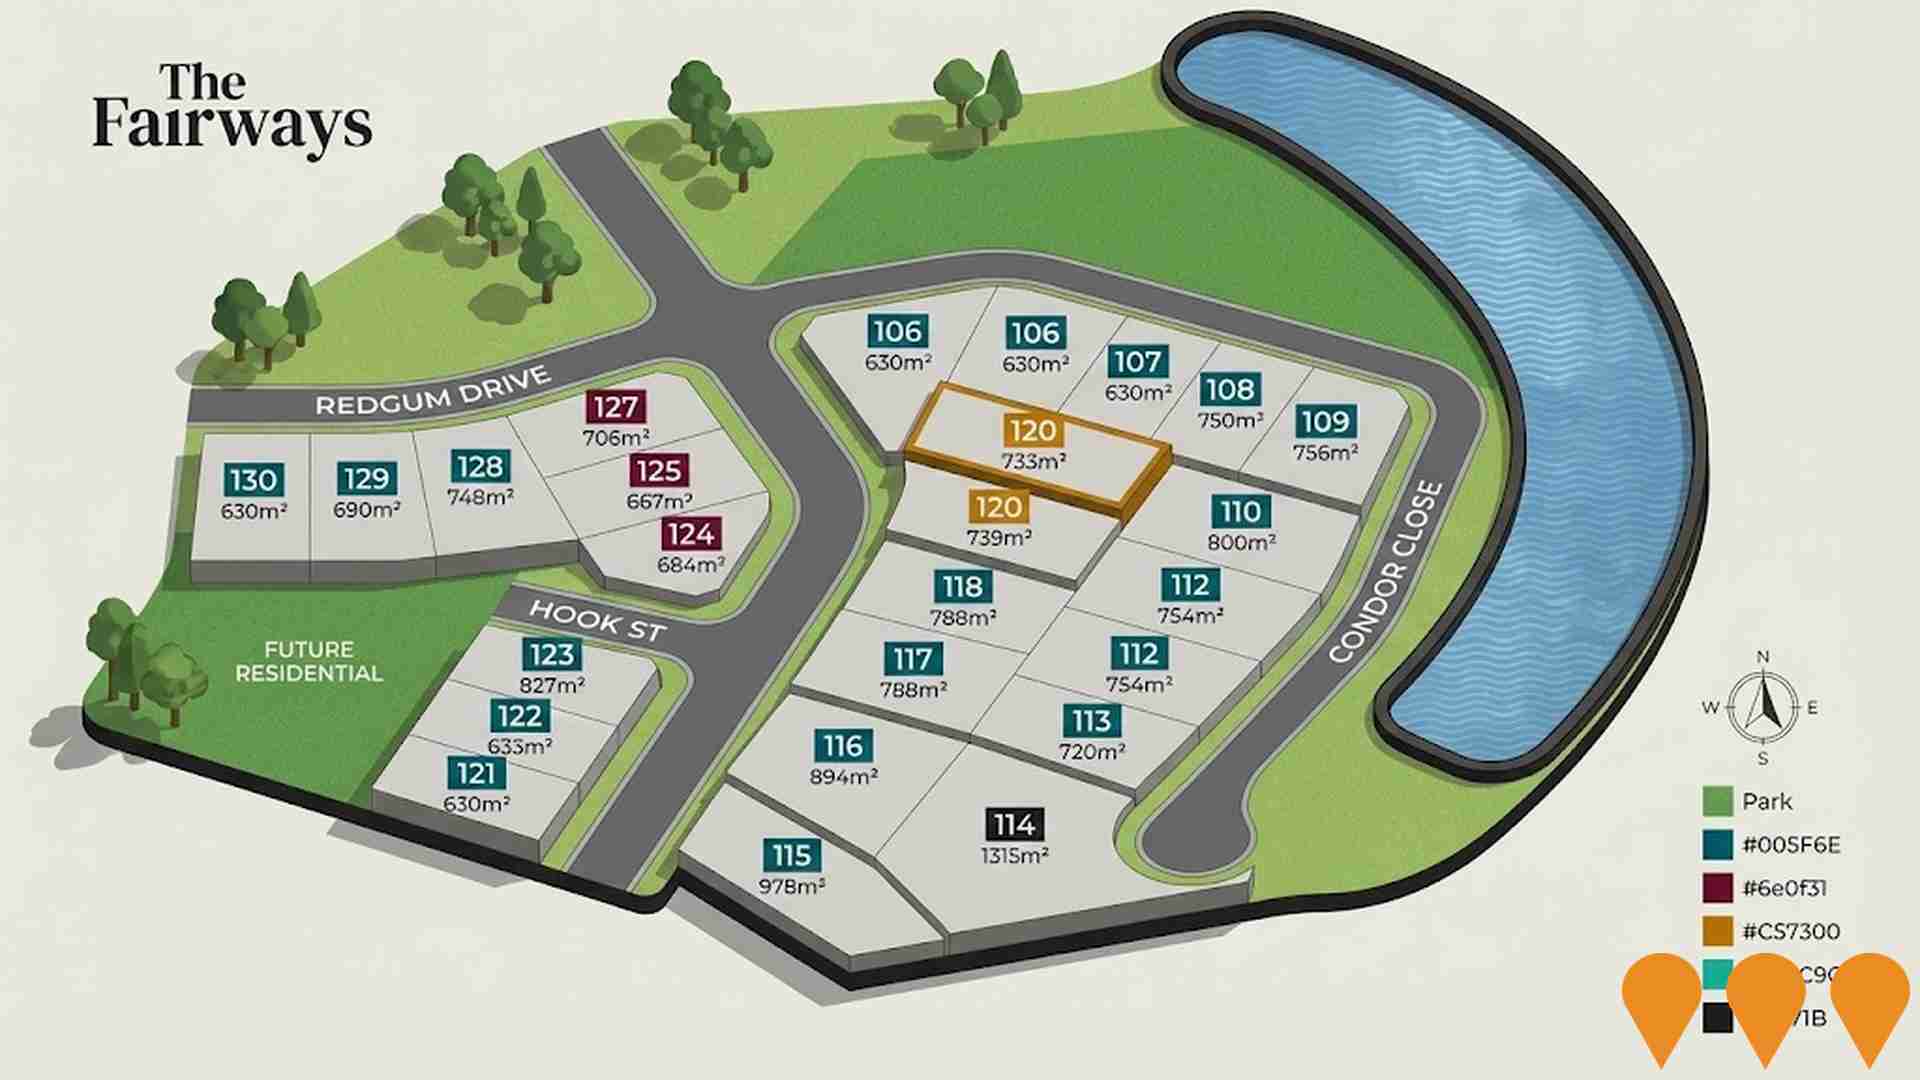
Over 120 projects identified by AreaSearch could significantly impact the region's performance due to their influence on local infrastructure. Key initiatives include the New England Highway Singleton Bypass project, the Bridgman Ridge Estate Hunterview development, Langham Estate Hunterview plans, and the Singleton Housing Acceleration Plan. The following list details those considered most relevant.
Professional plan users can use the search below to filter and access additional projects.
INFRASTRUCTURE SEARCH
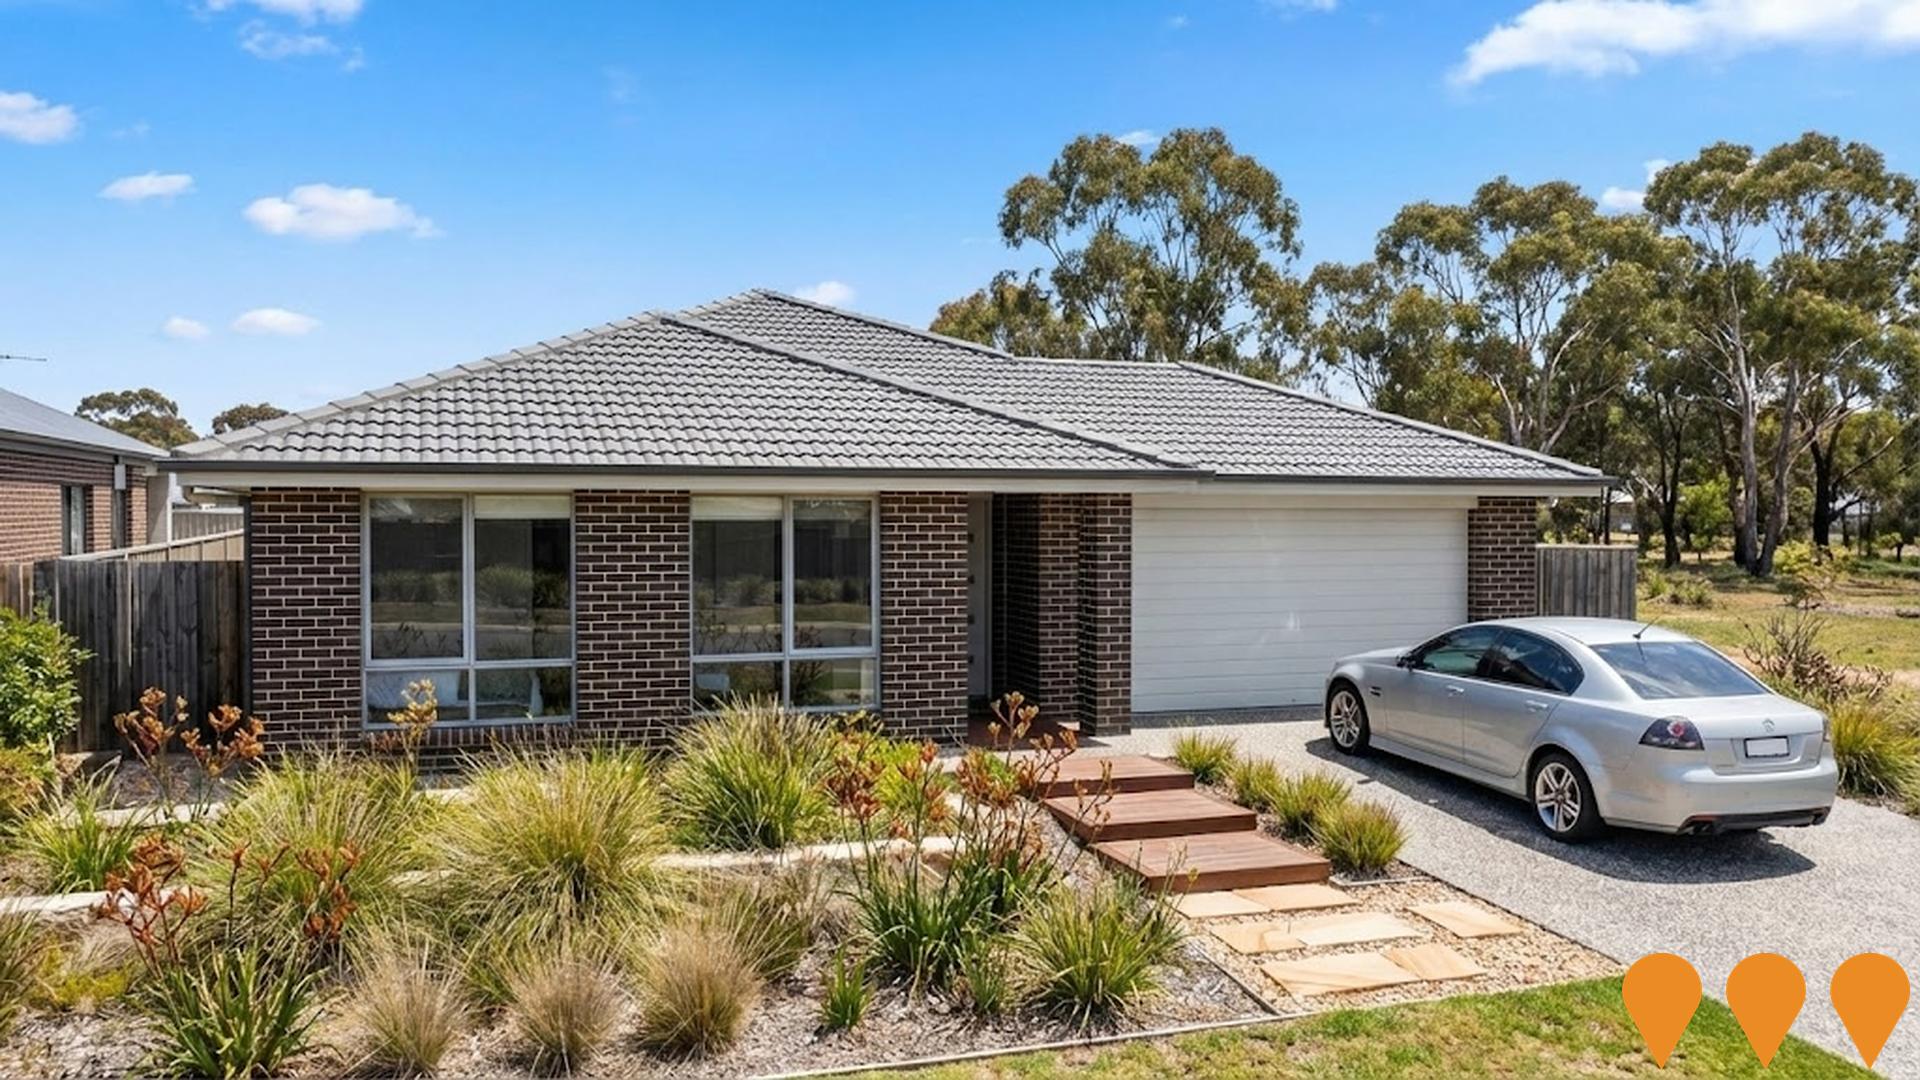
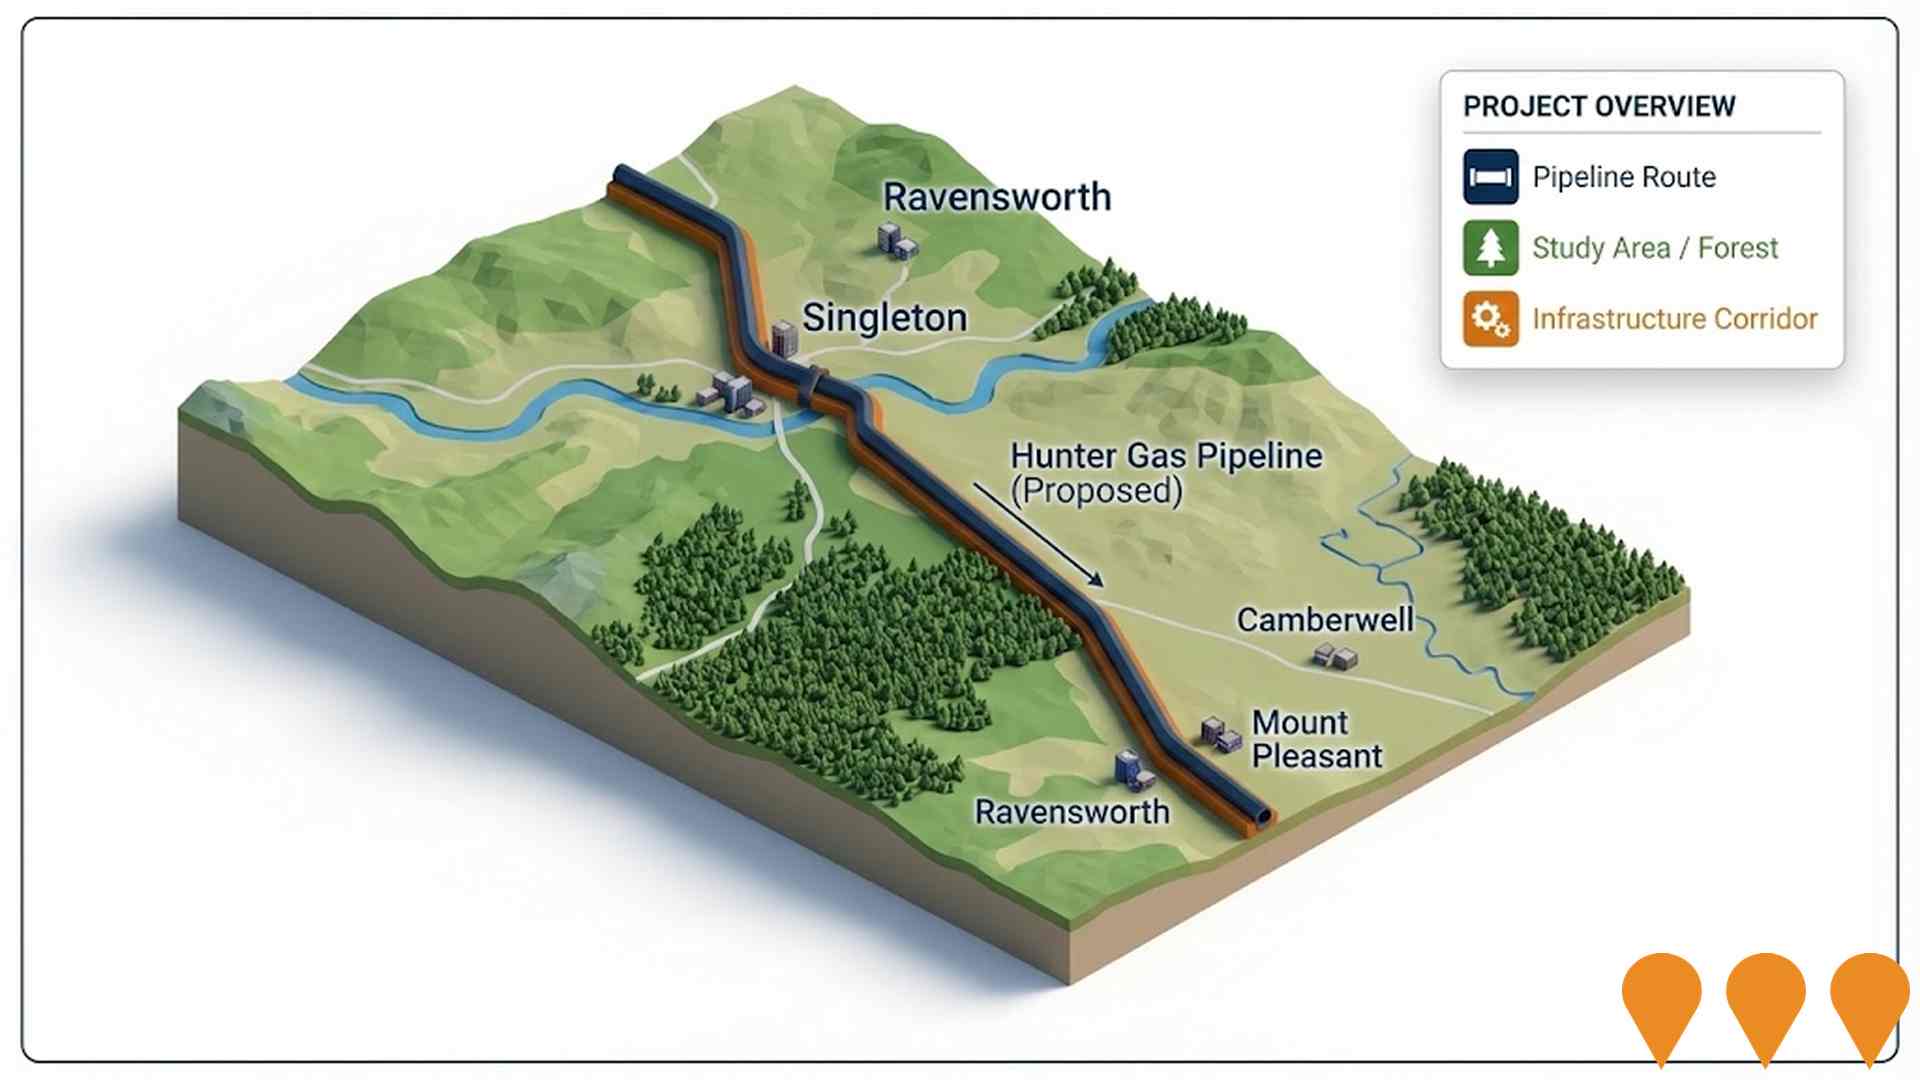
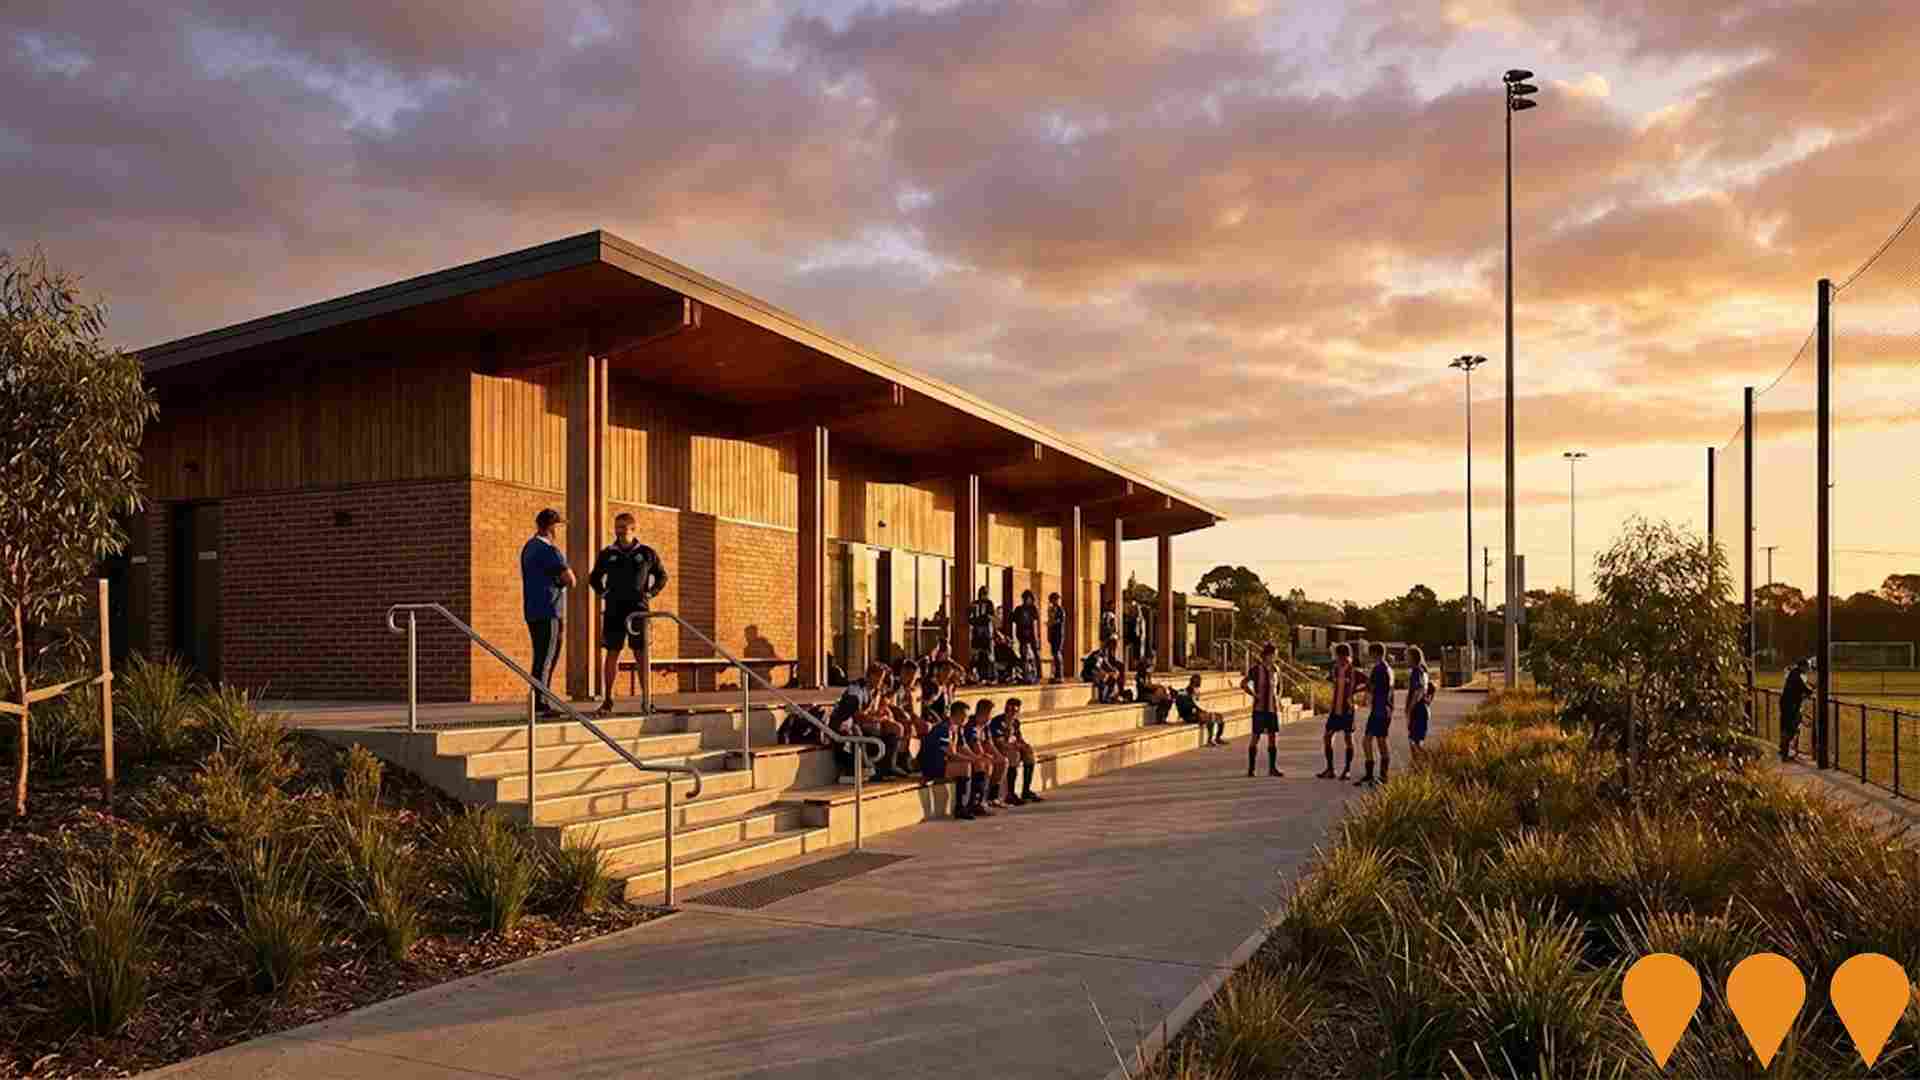
 Denotes AI-based impression for illustrative purposes only, not to be taken as definitive under any circumstances. Please follow links and conduct other investigations from the project's source for actual imagery. Developers and project owners wishing us to use original imagery please Contact Us and we will do so.
Frequently Asked Questions - Infrastructure
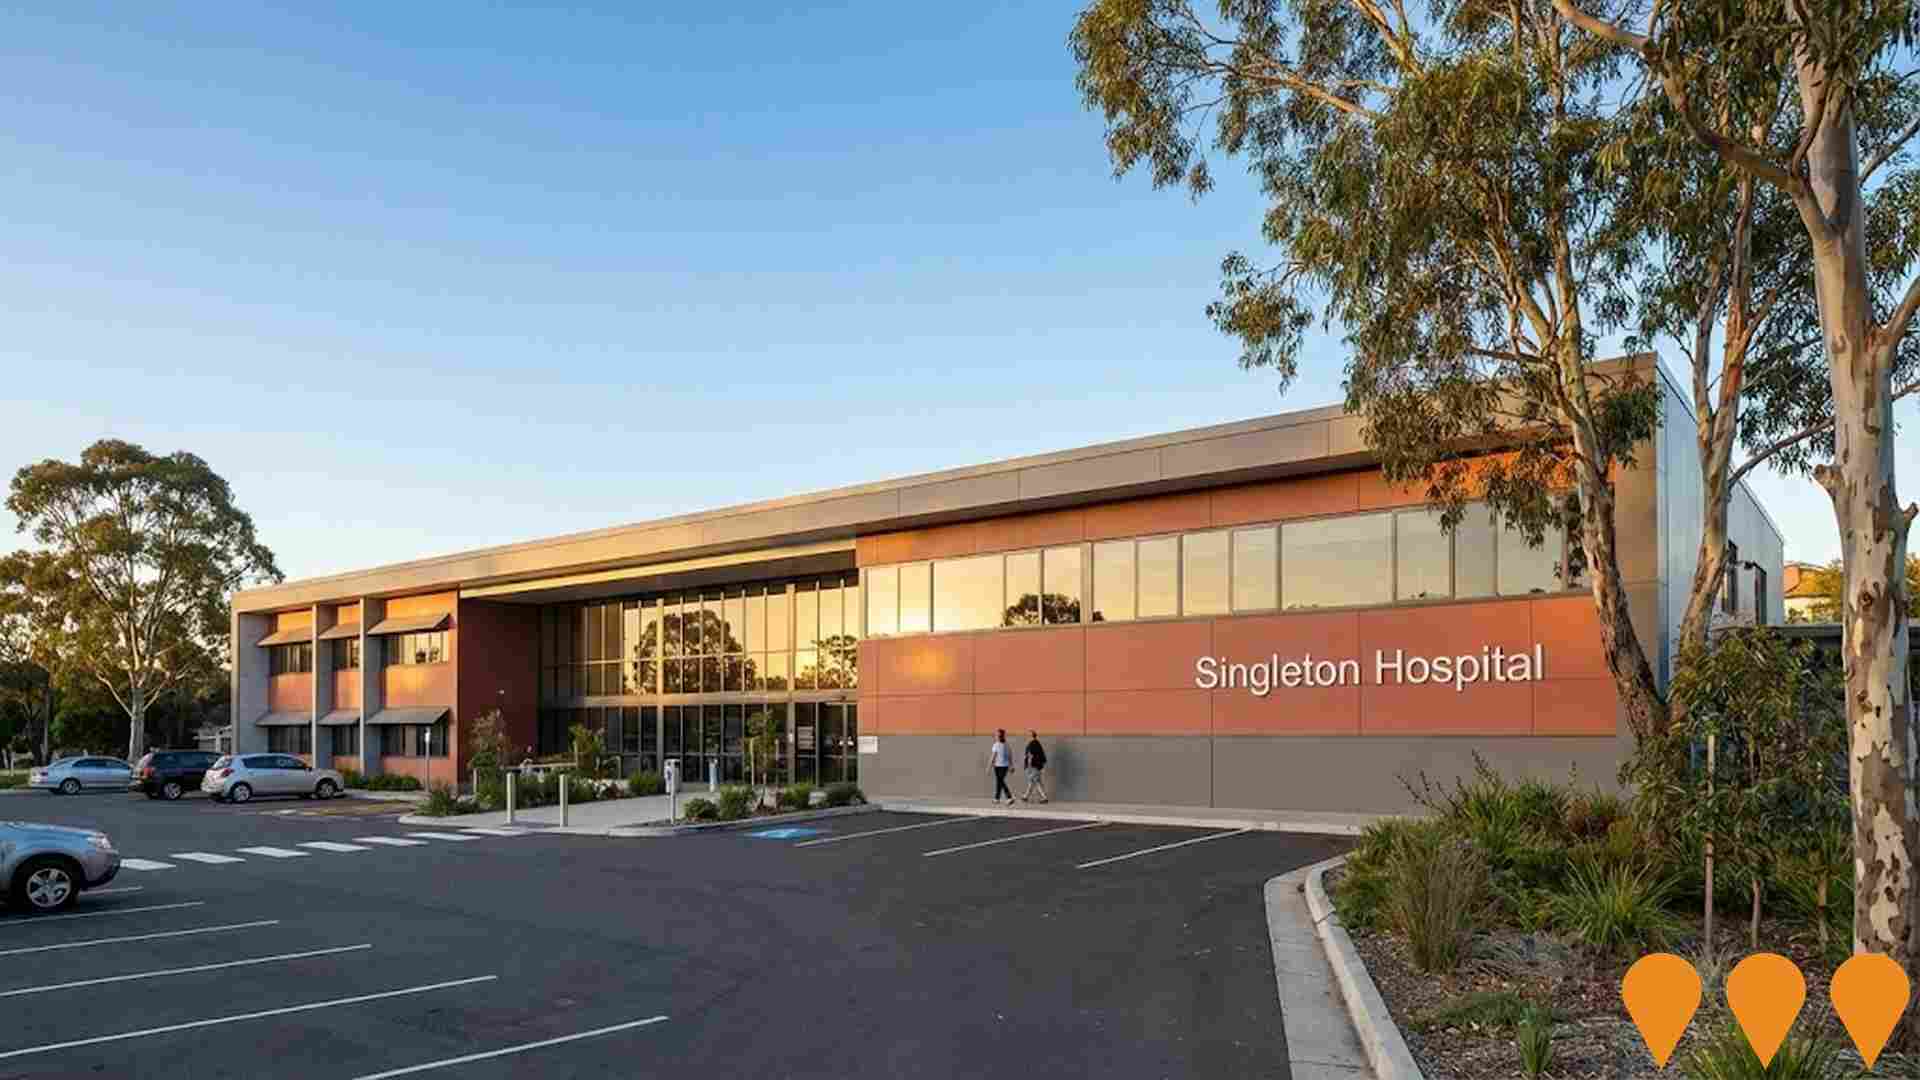
Singleton Hospital Redevelopment
Major redevelopment of Singleton District Hospital including a new West Wing with imaging facilities, renal dialysis services, ambulatory care, community health facilities, patient and medical rooms, staff offices, common areas, and waiting rooms across two levels. The project also included refurbishment of existing hospital areas and replacement of outdated demountable buildings.
New England Highway - Singleton Bypass
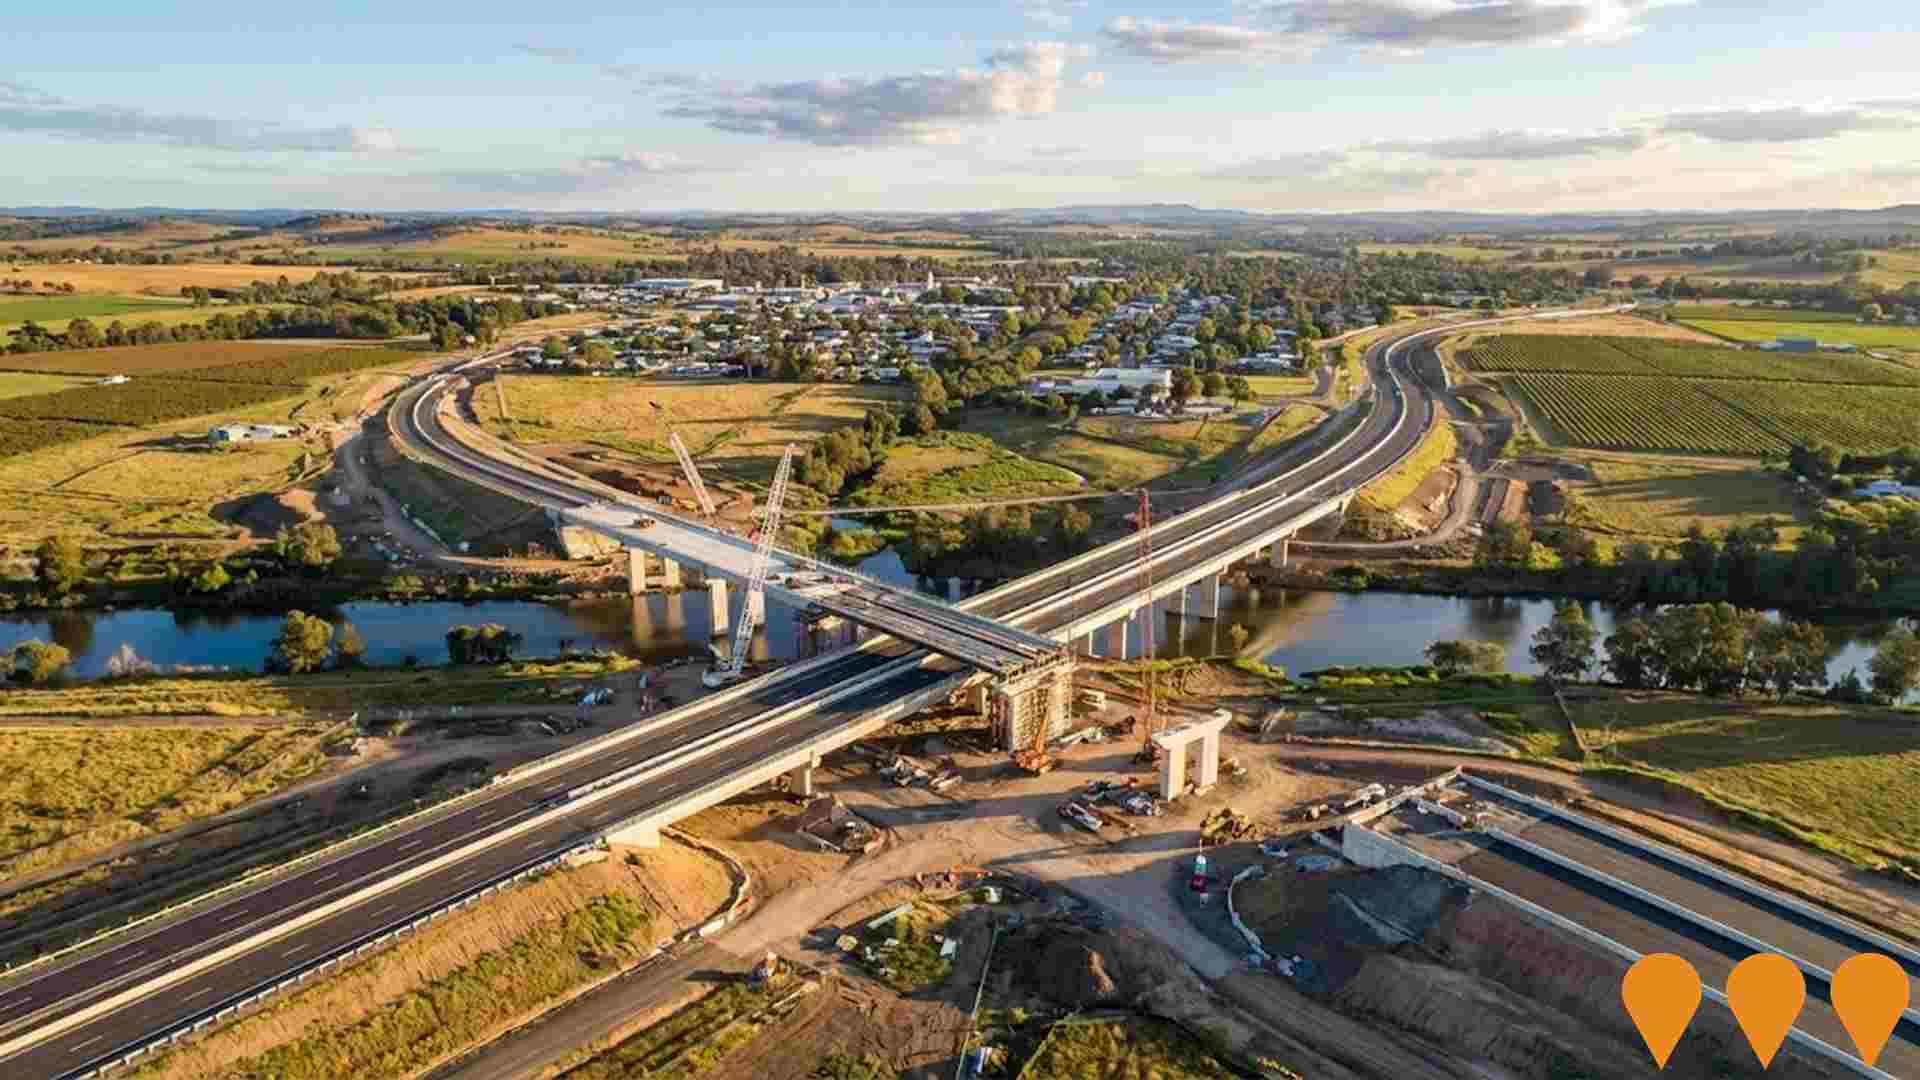
An $800 million (revised) Australian and NSW Government-funded project to construct an 8 km bypass of Singleton on the New England Highway. The bypass will remove up to 15,000 vehicles per day (including heavy freight) from the town centre, improving safety, traffic flow and amenity. Key features include six bridges, notably a 1.6 km bridge over the Hunter River and floodplains. Major construction is well underway with the project on track to open to traffic in late 2027.
Singleton Centre Redevelopment
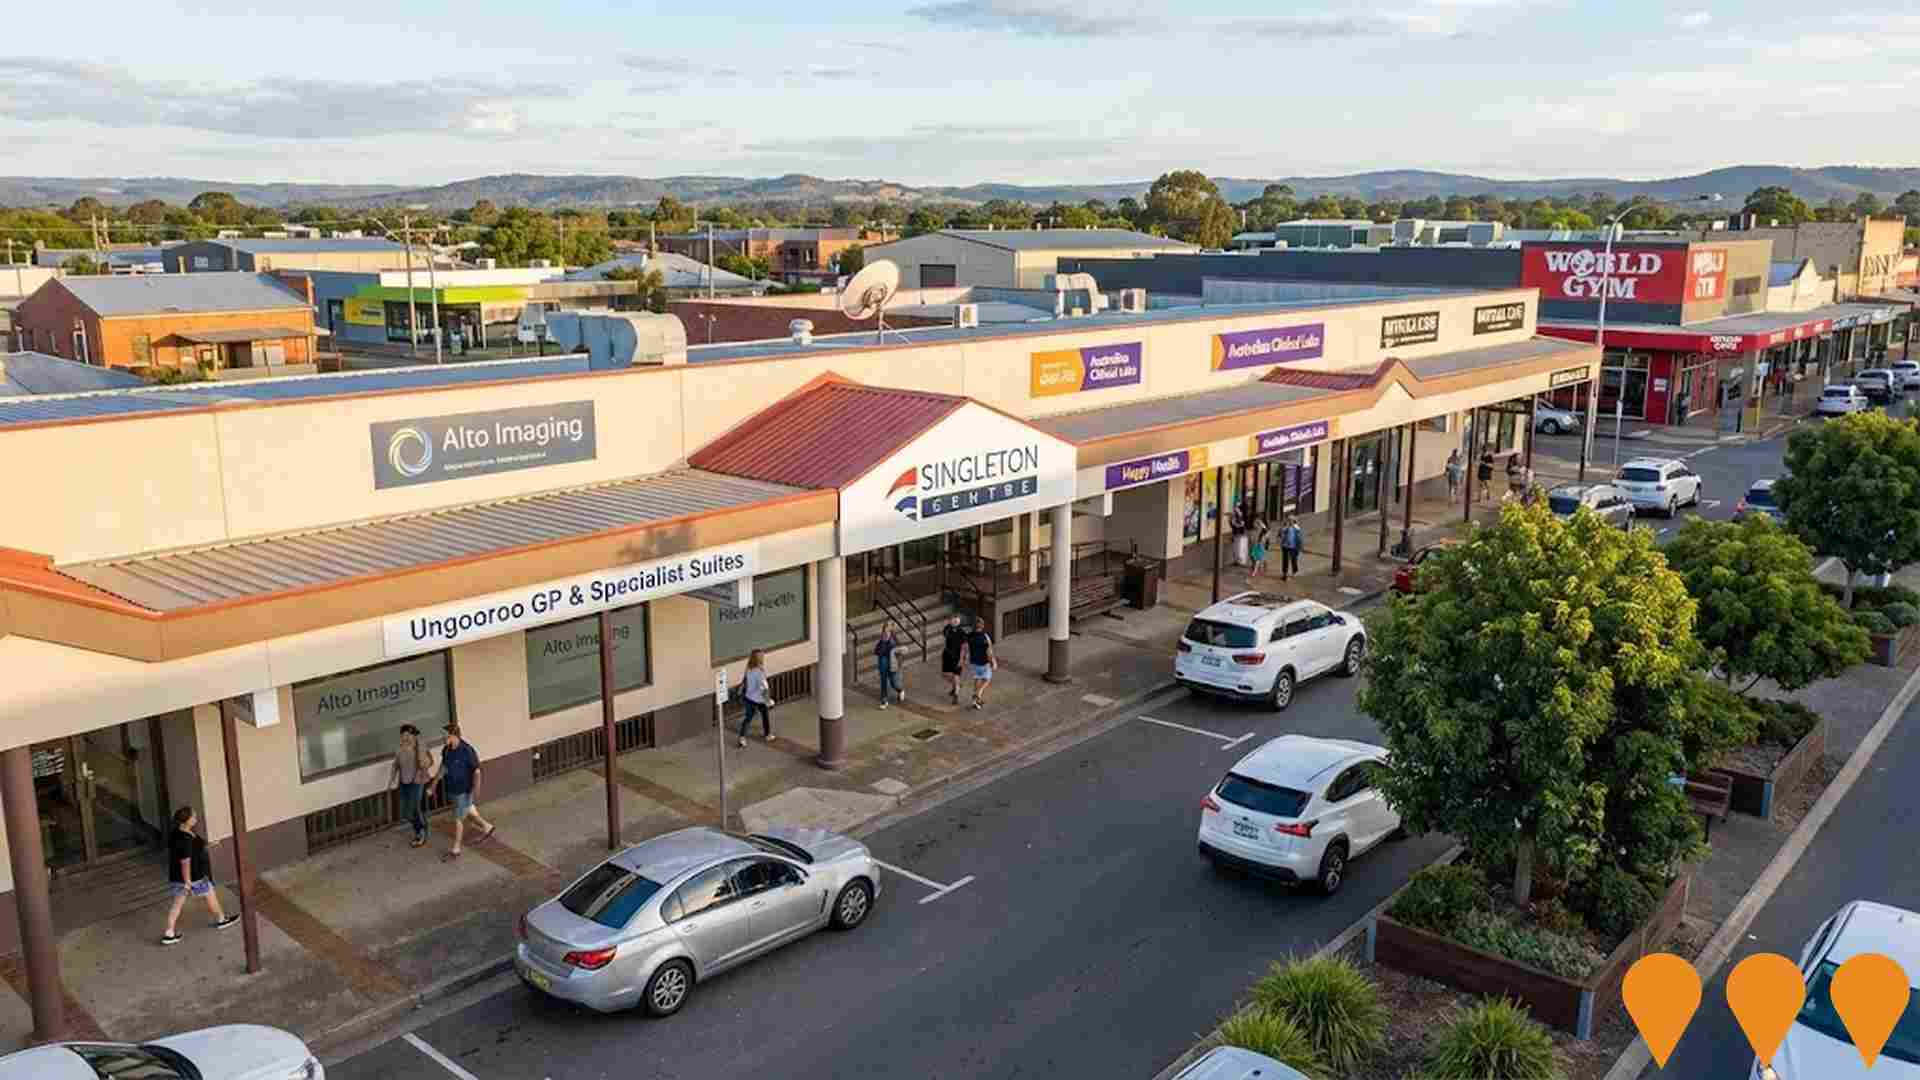
Redevelopment of the former Singleton Town Square into a mixed-use medical and services precinct. The transformation includes the largest medical facility in Singleton featuring Alto Imaging radiology clinic with X-ray, Ultrasound, CT and MRI services, Ungooroo Aboriginal Corporation GP and specialist medical suites, Happy Health occupational health services, pathology services by Australian Clinical Labs, sessional specialist medical suites, a World Gym fitness facility (opening June 2025), Wattaka Cafe, and various office tenancies. The centre provides 140 undercover car spaces and shared reception services for medical tenants.
Singleton Town Centre Master Plan
A master plan adopted by Singleton Council to guide the revitalisation and public domain improvements of the Singleton town centre. The plan aims to enhance amenity, sustainability, and attractiveness to support visitation and liveability. It includes upgrades to streets, footpaths, lighting, and public spaces.

Singleton Arts and Cultural Centre
A community-based regional cultural facility featuring over 300 square metres of state-of-the-art exhibition space, two artists' workshops (wet and digital studios), and housing Singleton's Civic Art Collection. The Centre provides engaging exhibitions of contemporary art by local, regional, national, and international artists, alongside public events, lectures, activities and workshops for all ages. Located in Singleton's Townhead Park precinct with the Visitor Information Centre, ParkView Cafe, and children's playground.
Singleton Housing Acceleration Plan
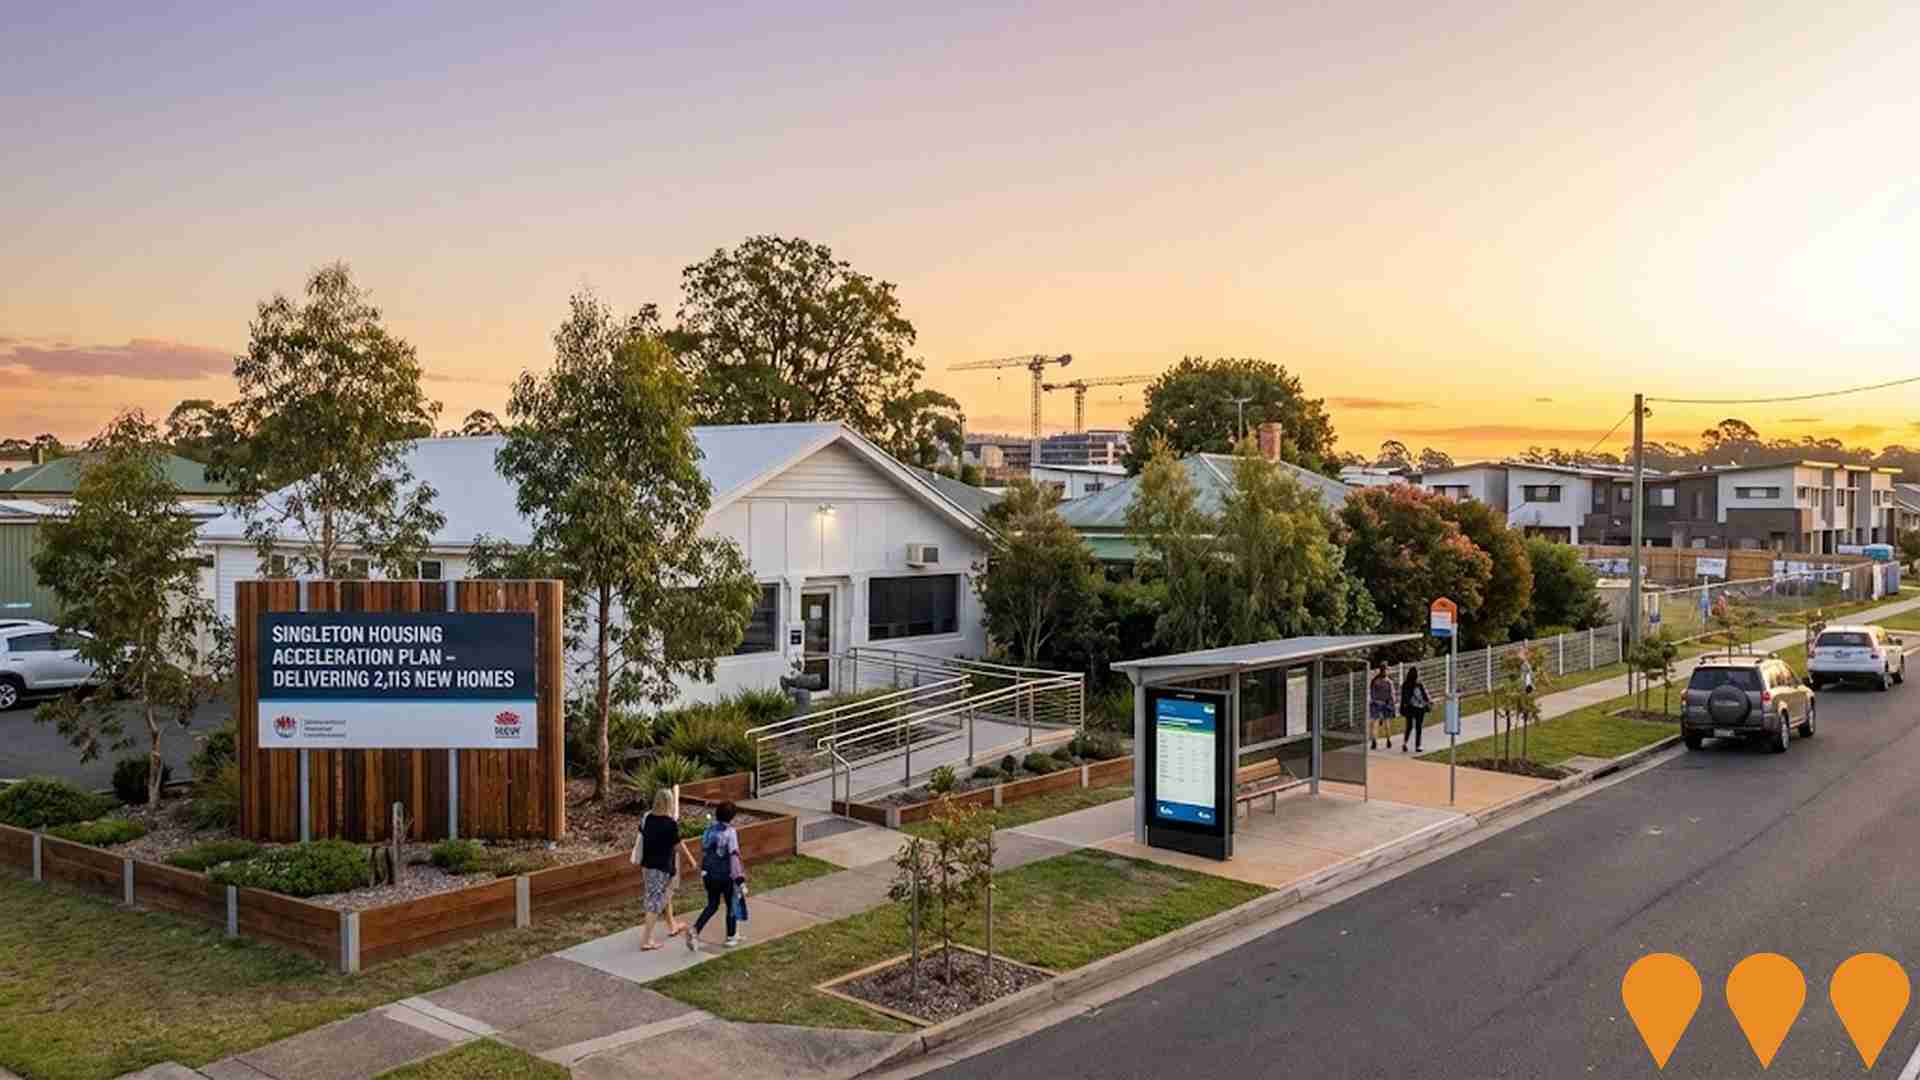
State Government initiative under the Regional Housing Strategic Planning Fund providing $120,671 to Singleton Council for planning control review to accelerate and unlock 2,113 new homes in the Singleton local government area. The project aims to address housing supply through strategic planning, developing and updating housing strategies, and bringing forward diverse and affordable housing options across the region.
Hunter Gas Pipeline
A proposed underground natural gas pipeline connecting the gas hub at Wallumbilla in Queensland to Newcastle and the Sydney market. The pipeline route passes through the Singleton local government area.
Alroy Oval Sports Precinct Redevelopment
Major upgrade of the sports precinct delivering 95% of the Alroy Oval Masterplan. The project includes demolition of existing facilities and construction of three full-sized irrigated and floodlit football fields, a new female-friendly and gender-neutral amenities building with change rooms, canteen and storerooms, upgraded car park with improved lighting, new footpaths, and enhanced personal safety features. Designed in collaboration with GroupGSA architects to promote participation in organised sports, particularly football, among women and girls. The facility will serve as the home hub for Singleton Strikers Football Club and the wider community.
Employment
Employment conditions in Singleton Surrounds demonstrate strong performance, ranking among the top 35% of areas assessed nationally
Singleton Surrounds has a balanced workforce with representation from both white and blue collar jobs. Manufacturing and industrial sectors are strongly represented in the area.
As of September 2025, the unemployment rate is 2.1%. There are 2,835 residents employed, with an unemployment rate that is 1.7% lower than Rest of NSW's rate of 3.8%. The workforce participation rate is higher at 62.1%, compared to Rest of NSW's 56.4%. Key industries for employment among residents are mining, agriculture, forestry & fishing, and construction.
Mining shows a notable concentration with employment levels at 9.2 times the regional average. Conversely, health care & social assistance has lower representation at 7.3% compared to the regional average of 16.9%. There is a ratio of 1.5 workers for every resident in Singleton Surrounds, indicating it functions as an employment hub attracting workers from surrounding areas. In the year to September 2025, the labour force decreased by 2.8% and employment decreased by 3.0%, resulting in unemployment rising by 0.2 percentage points. In comparison, Rest of NSW recorded an employment decline of 0.5%, a labour force decline of 0.1%, with unemployment rising by 0.4 percentage points. Providing broader context, state-level data from 25-Nov shows NSW employment contracted by 0.03% (losing 2,260 jobs), with the state unemployment rate at 3.9%. This compares favourably to the national unemployment rate of 4.3%. Jobs and Skills Australia's national employment forecasts from May-25 offer insight into potential future demand within Singleton Surrounds. National employment is forecast to expand by 6.6% over five years and 13.7% over ten years. Applying these industry-specific projections to Singleton Surrounds' employment mix suggests local employment should increase by 4.8% over five years and 11.1% over ten years, based on a simple weighting extrapolation for illustrative purposes.
Frequently Asked Questions - Employment
Income
Income analysis reveals strong economic positioning, with the area outperforming 60% of locations assessed nationally by AreaSearch
The Singleton Surrounds SA2 had a high national income level in financial year 2022, according to the latest ATO data aggregated by AreaSearch. The median income among taxpayers was $55,360 and the average income stood at $73,821. These figures compare to Rest of NSW's median income of $49,459 and average income of $62,998. Based on Wage Price Index growth of 12.61% since financial year 2022, current estimates would be approximately $62,341 (median) and $83,130 (average) as of September 2025. According to 2021 Census figures, household income ranked at the 67th percentile ($2,034 weekly), while personal income sat at the 44th percentile. Distribution data showed that the $1,500 - 2,999 bracket dominated with 29.6% of residents (1,644 people), mirroring regional levels where 29.9% occupied this bracket. Singleton Surrounds demonstrated considerable affluence with 30.4% earning over $3,000 per week. After housing costs, residents retained 86.8% of income, reflecting strong purchasing power and the area's SEIFA income ranking placed it in the 5th decile.
Frequently Asked Questions - Income
Housing
Singleton Surrounds is characterized by a predominantly suburban housing profile, with above-average rates of outright home ownership
Singleton Surrounds' dwellings, as per the latest Census, were 98.9% houses and 1.1% other dwellings (semi-detached, apartments, 'other' dwellings), compared to Non-Metro NSW's 90.9% houses and 9.0% other dwellings. Home ownership in Singleton Surrounds was 41.0%, with the rest mortgaged (40.5%) or rented (18.5%). The median monthly mortgage repayment was $2,167, higher than Non-Metro NSW's average of $1,733 and the national average of $1,863. Median weekly rent in Singleton Surrounds was $360, slightly higher than Non-Metro NSW's $340 but lower than the national figure of $375.
Frequently Asked Questions - Housing
Household Composition
Singleton Surrounds features high concentrations of family households, with a higher-than-average median household size
Family households comprise 80.7% of all households, including 39.6% couples with children, 32.0% couples without children, and 8.2% single parent families. Non-family households account for 19.3%, with lone person households at 17.5% and group households making up 1.8%. The median household size is 2.8 people, larger than the Rest of NSW average of 2.6.
Frequently Asked Questions - Households
Local Schools & Education
Singleton Surrounds faces educational challenges, with performance metrics placing it in the bottom quartile of areas assessed nationally
The area's university qualification rate is 13.7%, significantly lower than the NSW average of 32.2%. This disparity presents both a challenge and an opportunity for targeted educational initiatives. Bachelor degrees are the most common at 10.6%, followed by postgraduate qualifications at 1.8% and graduate diplomas at 1.3%. Vocational credentials are prevalent, with 47.7% of residents aged 15+ holding such qualifications - advanced diplomas at 9.7% and certificates at 38.0%.
Educational participation is high, with 30.6% of residents currently enrolled in formal education. This includes 12.4% in primary education, 9.2% in secondary education, and 2.4% pursuing tertiary education.
Frequently Asked Questions - Education
Schools Detail
Nearby Services & Amenities
Transport
Transport servicing is low compared to other areas nationally based on assessment of service frequency, route connectivity and accessibility
Singleton Surrounds has 173 active public transport stops, all of which are bus stops. These stops are served by 32 different routes that together provide 240 weekly passenger trips. The accessibility of these services is rated as moderate, with residents on average being located 580 meters from the nearest stop.
On average, there are 34 trips per day across all routes, which equates to approximately one weekly trip per individual stop.
Frequently Asked Questions - Transport
Transport Stops Detail
Health
Health outcomes in Singleton Surrounds are marginally below the national average with common health conditions slightly more prevalent than average across both younger and older age cohorts
Singleton Surrounds shows below-average health outcomes with common conditions slightly more prevalent than average across both younger and older age groups. Private health cover is very high at approximately 56% (~3,138 people), compared to 51.9% across Rest of NSW.
The most common medical conditions are arthritis (9.5%) and asthma (8.5%). 68.1% of residents report no medical ailments, compared to 62.6% in Rest of NSW. The area has 19.0% of residents aged 65 and over (1,054 people), higher than the 16.9% in Rest of NSW. Health outcomes among seniors are above average, better than the general population in health metrics.
Frequently Asked Questions - Health
Cultural Diversity
The latest Census data sees Singleton Surrounds placing among the least culturally diverse areas in the country when compared across a range of language and cultural background related metrics
Singleton Surrounds was found to have a low level of cultural diversity, with 89.7% of its population being Australian citizens, 92.8% born in Australia, and 98.1% speaking English only at home. Christianity is the predominant religion in Singleton Surrounds, comprising 64.2% of the population, compared to 55.7% across Rest of NSW. The top three ancestry groups are Australian (36.5%), English (30.9%), and Scottish (7.4%).
Notably, some ethnic groups have higher representation in Singleton Surrounds than regionally: Australian Aboriginal at 5.7% vs 6.3%, South African at 0.5% vs 0.2%, and Maltese at 0.5% vs 0.3%.
Frequently Asked Questions - Diversity
Age
Singleton Surrounds's median age exceeds the national pattern
Singleton Surrounds has a median age of 42 years, similar to Rest of NSW's average of 43 but considerably older than Australia's median age of 38 years. The age profile shows that individuals aged 55-64 years are particularly prominent, making up 15.2% of the population, while those aged 75-84 years form a comparatively smaller group at 5.7%. Between 2021 and present, the 75-84 age group has grown from 4.4% to 5.7%, and the 65-74 cohort has increased from 10.6% to 11.9%. Conversely, the 45-54 age group has declined from 15.3% to 13.2%, and the 5-14 age group has dropped from 14.5% to 12.6%. Population forecasts for Singleton Surrounds indicate substantial demographic changes by 2041. The 75-84 age cohort is projected to grow by 59%, adding 187 residents to reach a total of 506. In contrast, the number of individuals in the 5-14 age range is expected to fall by 46%.
