Chart Color Schemes
This analysis uses ABS Statistical Areas Level 2 (SA2) boundaries, which can materially differ from Suburbs and Localities (SAL) even when sharing similar names.
SA2 boundaries are defined by the Australian Bureau of Statistics and are designed to represent communities for statistical reporting (e.g., census and ERP).
Suburbs and Localities (SAL) represent commonly-used suburb/locality names (postal-style areas) and may use different geographic boundaries. For comprehensive analysis, consider reviewing both boundary types if available.
est. as @ -- *
ABS ERP | -- people | --
2021 Census | -- people
Sales Activity
Curious about local property values? Filter the chart to assess the volume and appreciation (including resales) trends and regional comparisons, or scroll to the map below view this information at an individual property level.
Find a Recent Sale
Sales Detail
Population
Granville - Clyde lies within the top quartile of areas nationally for population growth performance according to AreaSearch analysis of recent, and medium to long-term trends
Granville - Clyde's population, as per AreaSearch's analysis, was around 24,929 by November 2025. This figure represents an increase of 1,679 people, a rise of 7.2% since the 2021 Census which reported a population of 23,250. The change is inferred from the estimated resident population of 24,966 as of June 2024 and an additional 260 validated new addresses since the Census date. This results in a population density ratio of 4,443 persons per square kilometer, placing Granville - Clyde in the top 10% of national locations assessed by AreaSearch, indicating high demand for land in the area. The area's growth of 7.2% since the 2021 census exceeded both the SA3 area (6.5%) and the state level, positioning it as a regional growth leader. Overseas migration contributed approximately 69.0% of overall population gains during recent periods, driving this growth.
AreaSearch is adopting ABS/Geoscience Australia projections for each SA2 area, released in 2024 with 2022 as the base year. For areas not covered by this data, NSW State Government's SA2 level projections are used, released in 2022 with 2021 as the base year. Growth rates by age group from these aggregations are applied to all areas for years 2032 to 2041. Future population trends suggest a significant increase in the top quartile of Australian statistical areas, with Granville - Clyde expected to grow by 7,356 persons to 2041 based on the latest annual ERP population numbers, reflecting an overall increase of 29.7% over the 17 years.
Frequently Asked Questions - Population
Development
AreaSearch assessment of residential development activity positions Granville - Clyde among the top 25% of areas assessed nationwide
Granville - Clyde has seen approximately 69 new homes approved annually on average over the past five financial years, from FY-21 to FY-25, with a total of 346 homes approved during this period and an additional 28 approved so far in FY-26. Each year, around 4.5 new residents have arrived per dwelling constructed on average between FY-21 and FY-25. This has led to demand outpacing supply, which typically exerts upward pressure on prices and intensifies competition among buyers.
The average value of new dwellings developed is $363,000. In the current financial year, there have been $43.6 million in commercial development approvals recorded, indicating high levels of local commercial activity. Compared to Greater Sydney, Granville - Clyde shows significantly reduced construction rates, with 59.0% fewer new dwellings approved per person on average. This scarcity often strengthens demand and prices for existing properties but building activity has been accelerating recently. Nationally, construction is also lower than the national average, suggesting possible development constraints. The new building activity in Granville - Clyde consists of approximately 40.0% detached houses and 60.0% medium to high-density housing, indicating a trend towards denser development that caters to downsizers, investors, and entry-level buyers.
With around 482 people per dwelling approval, the area shows signs of a developed market. According to the latest AreaSearch quarterly estimate, Granville - Clyde is projected to grow by approximately 7,393 residents by 2041. If current development rates continue, housing supply may struggle to keep pace with population growth, potentially leading to increased buyer competition and price increases.
Frequently Asked Questions - Development
Infrastructure
Granville - Clyde has very high levels of nearby infrastructure activity, ranking in the top 20% nationally
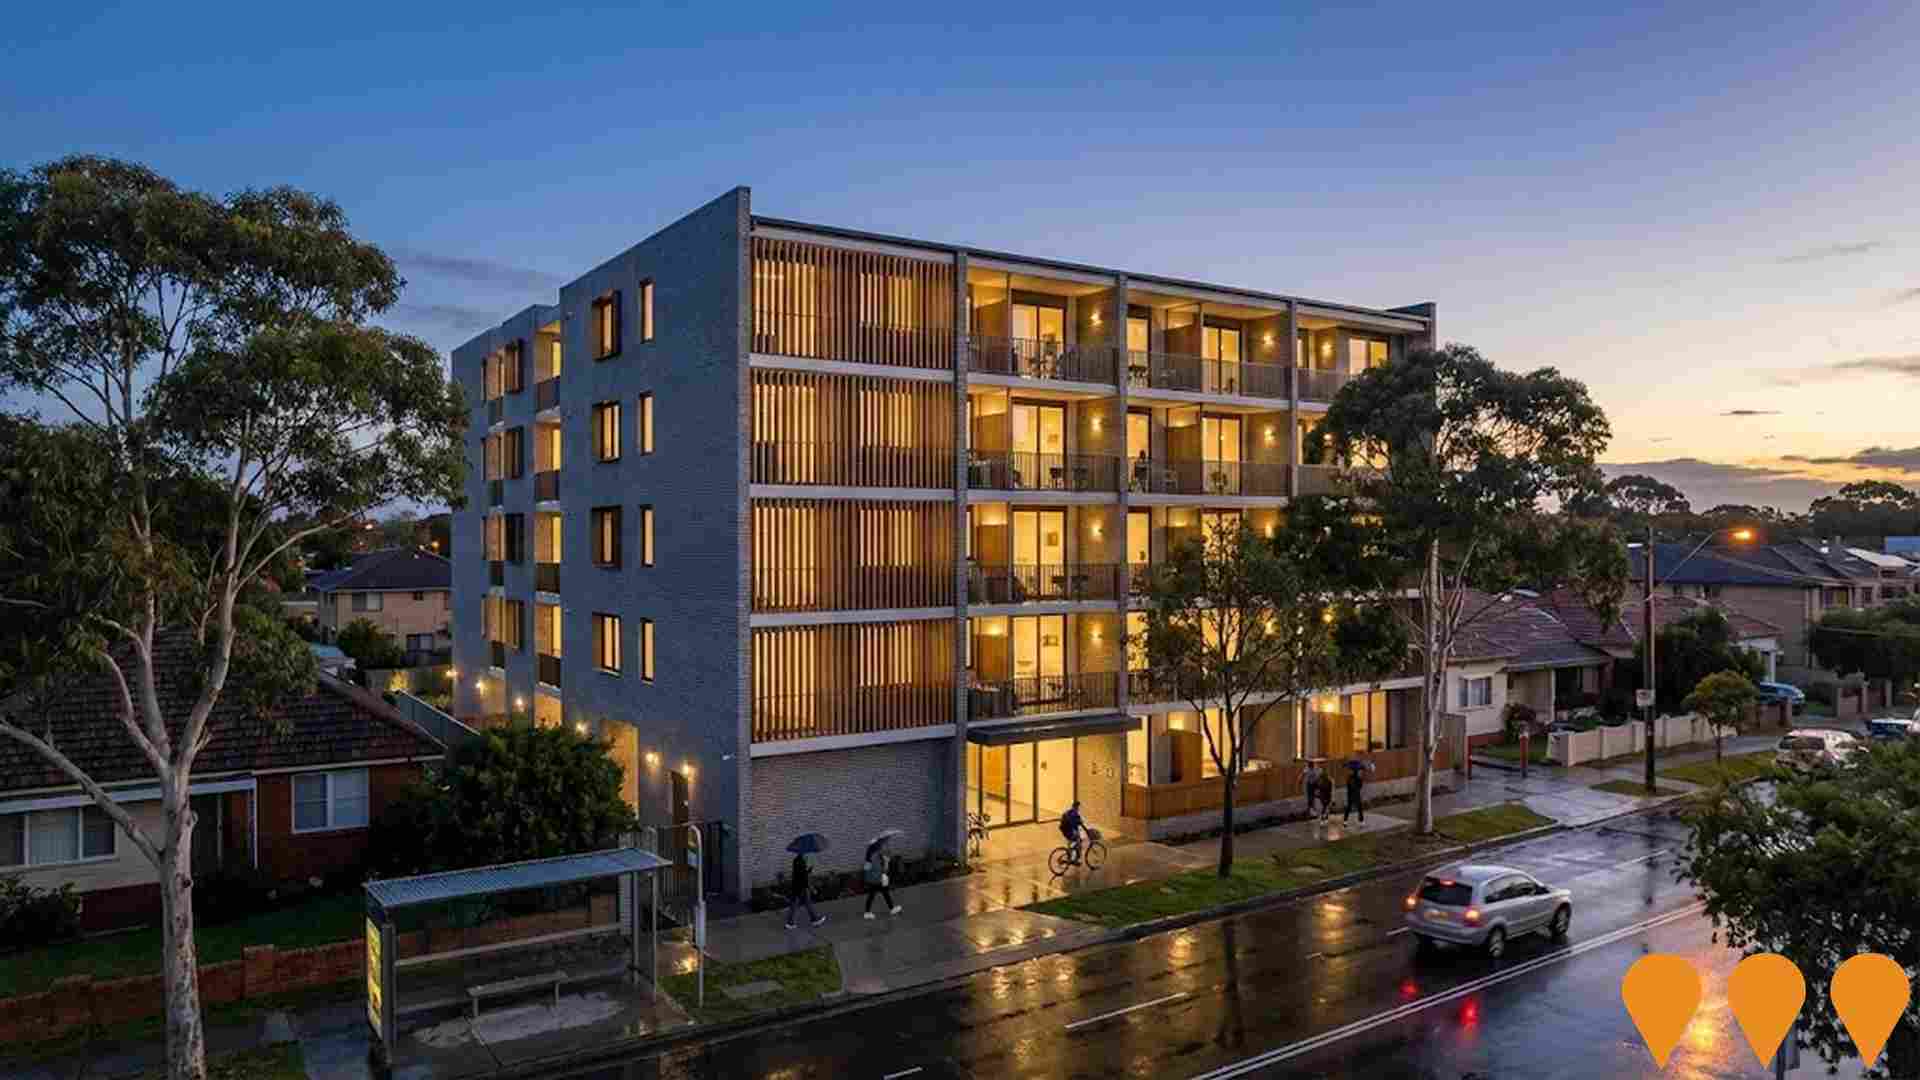
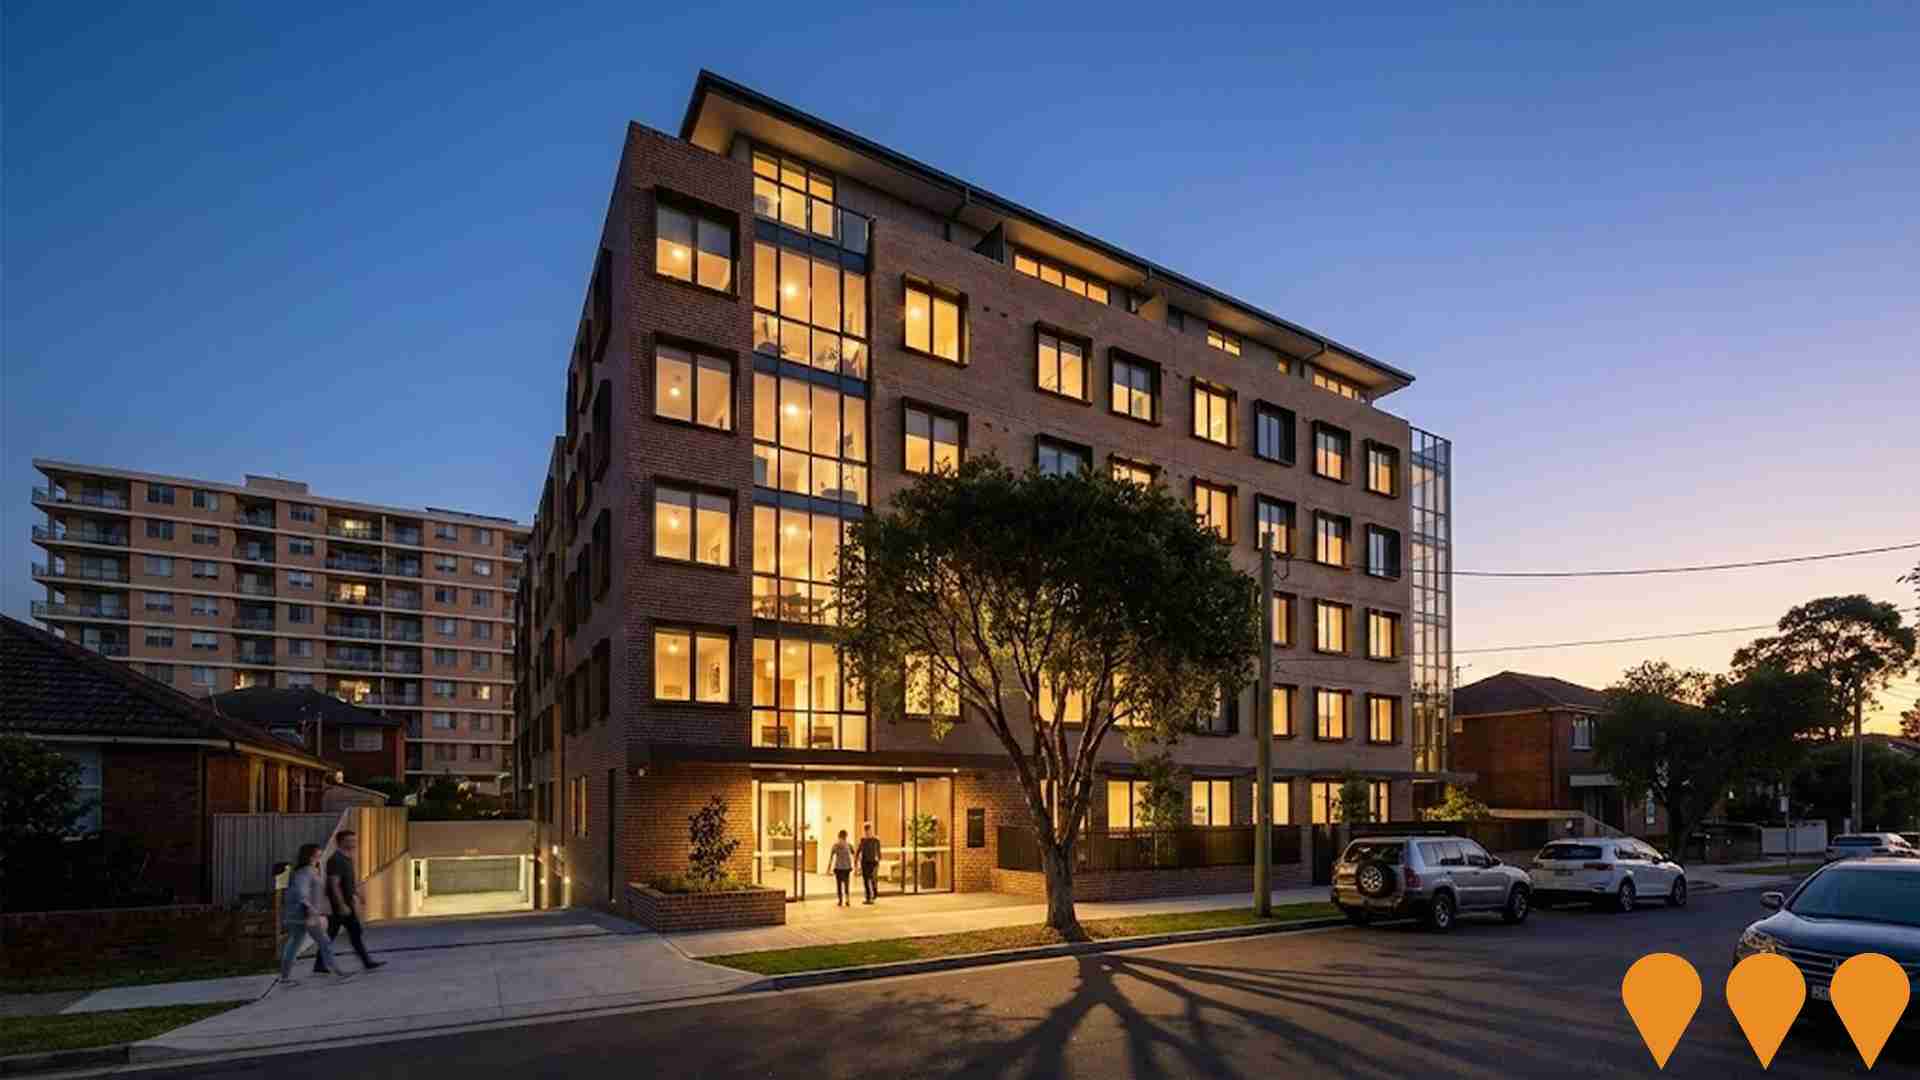
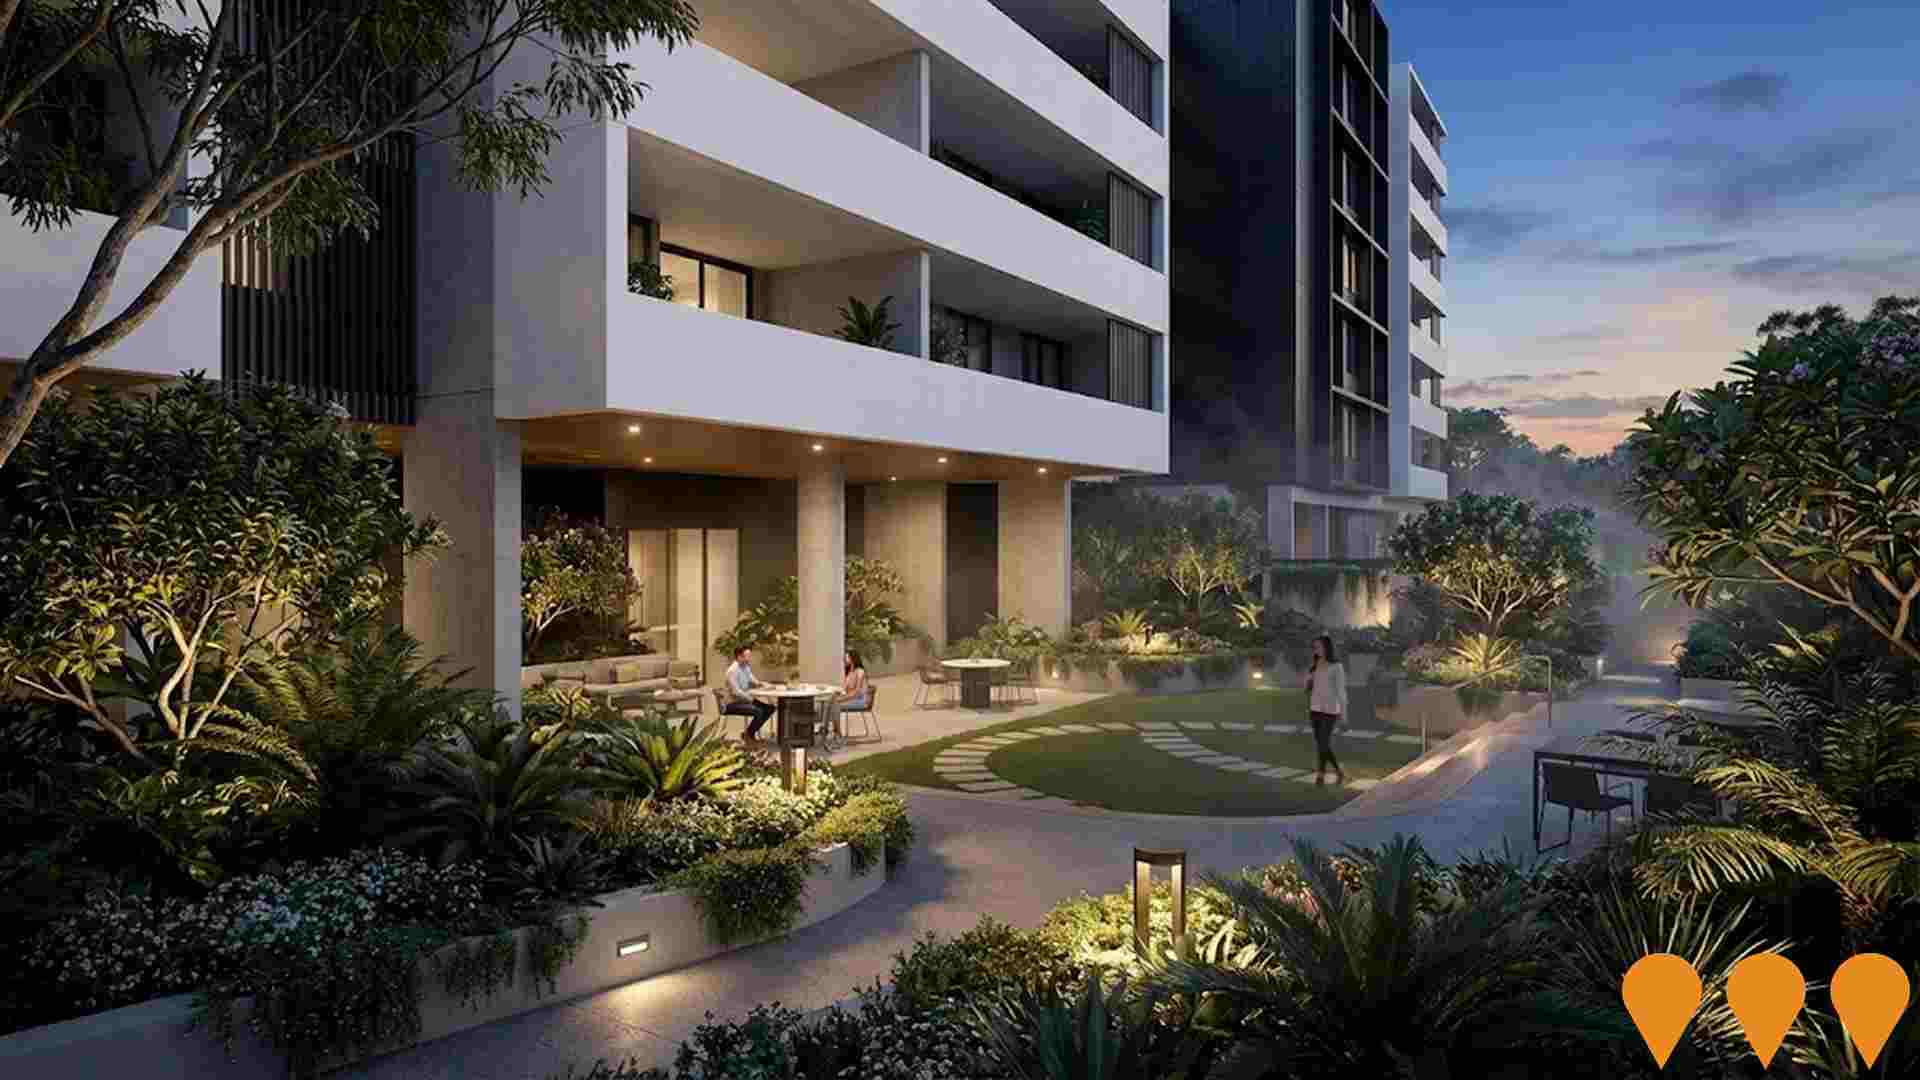
Changes in local infrastructure significantly impact an area's performance. AreaSearch has identified 67 projects that could affect this region. Notable ones include Gran Central Granville, Granville Town Square, Connecting Granville Centres, and the mixed-use precinct at 171-187 Parramatta Road & 58-64 Victoria Street. The following list details those most likely to be relevant.
Professional plan users can use the search below to filter and access additional projects.
INFRASTRUCTURE SEARCH
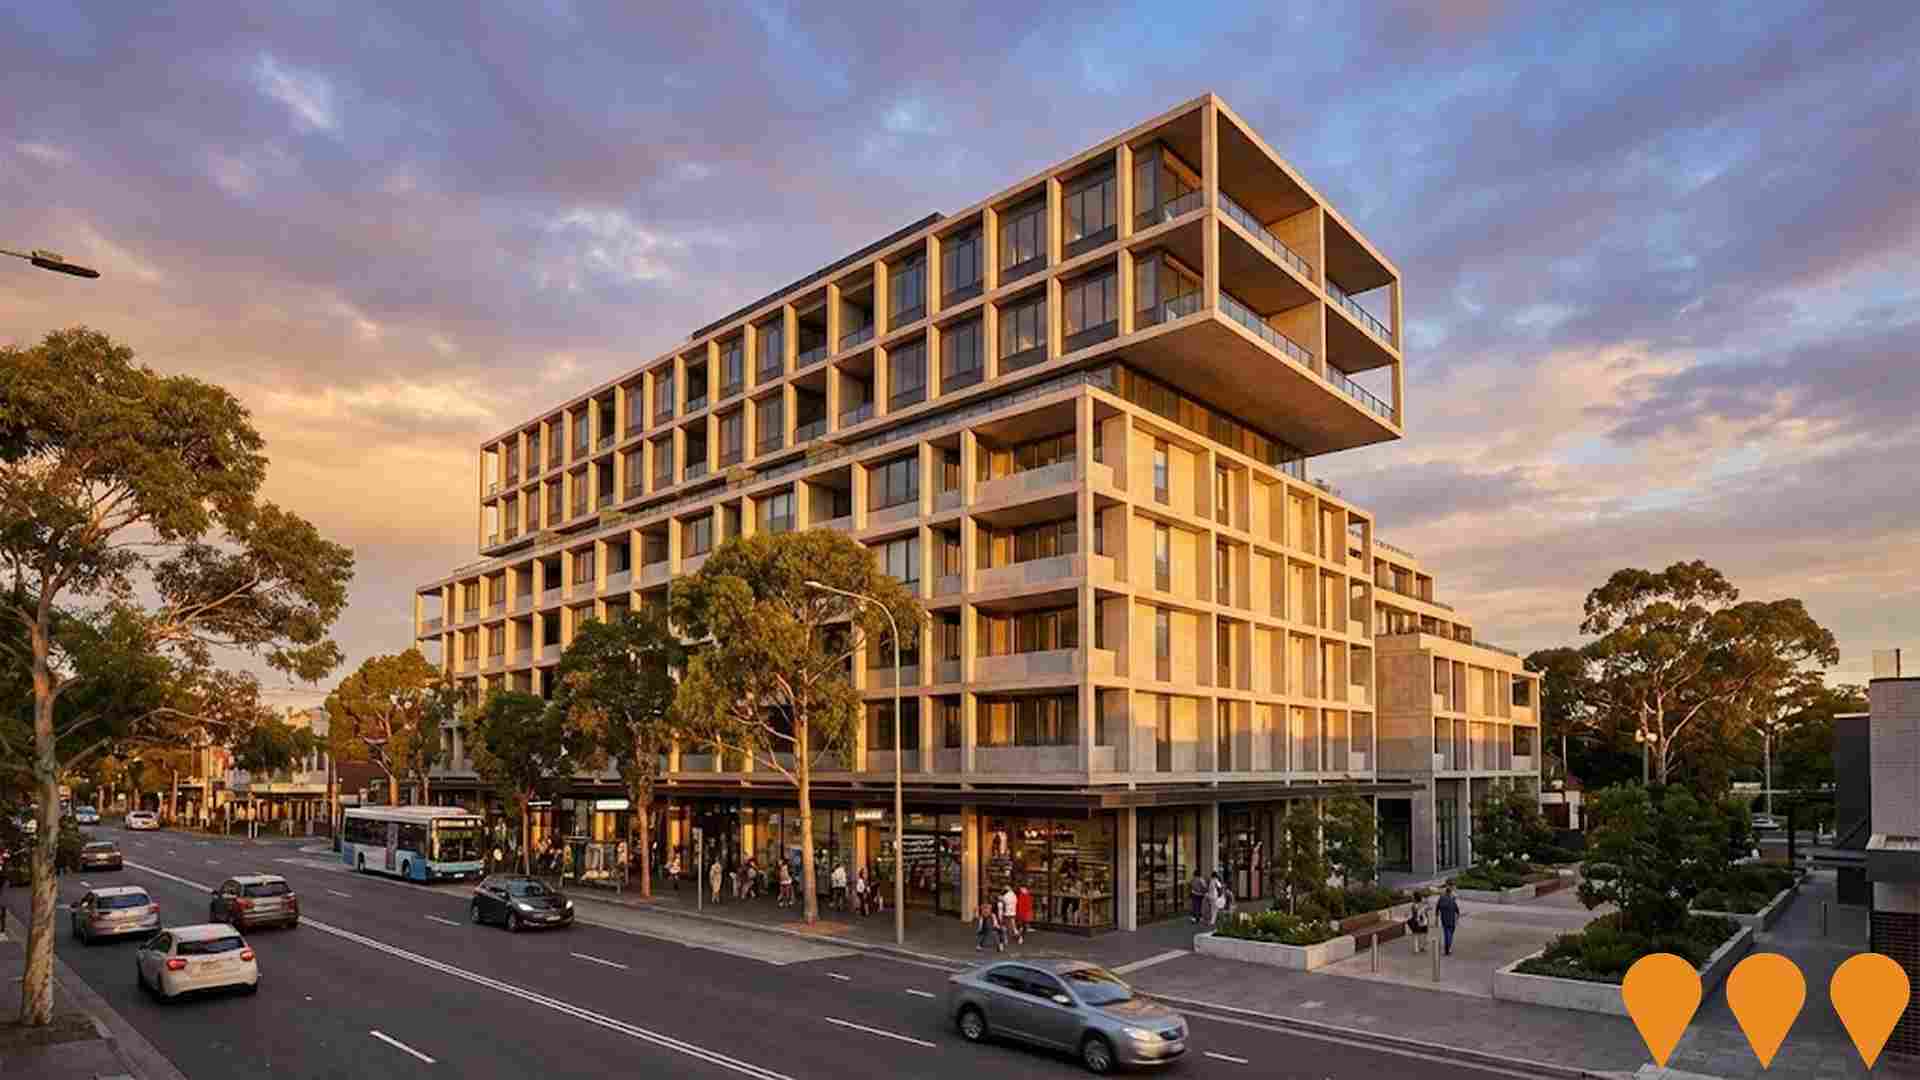
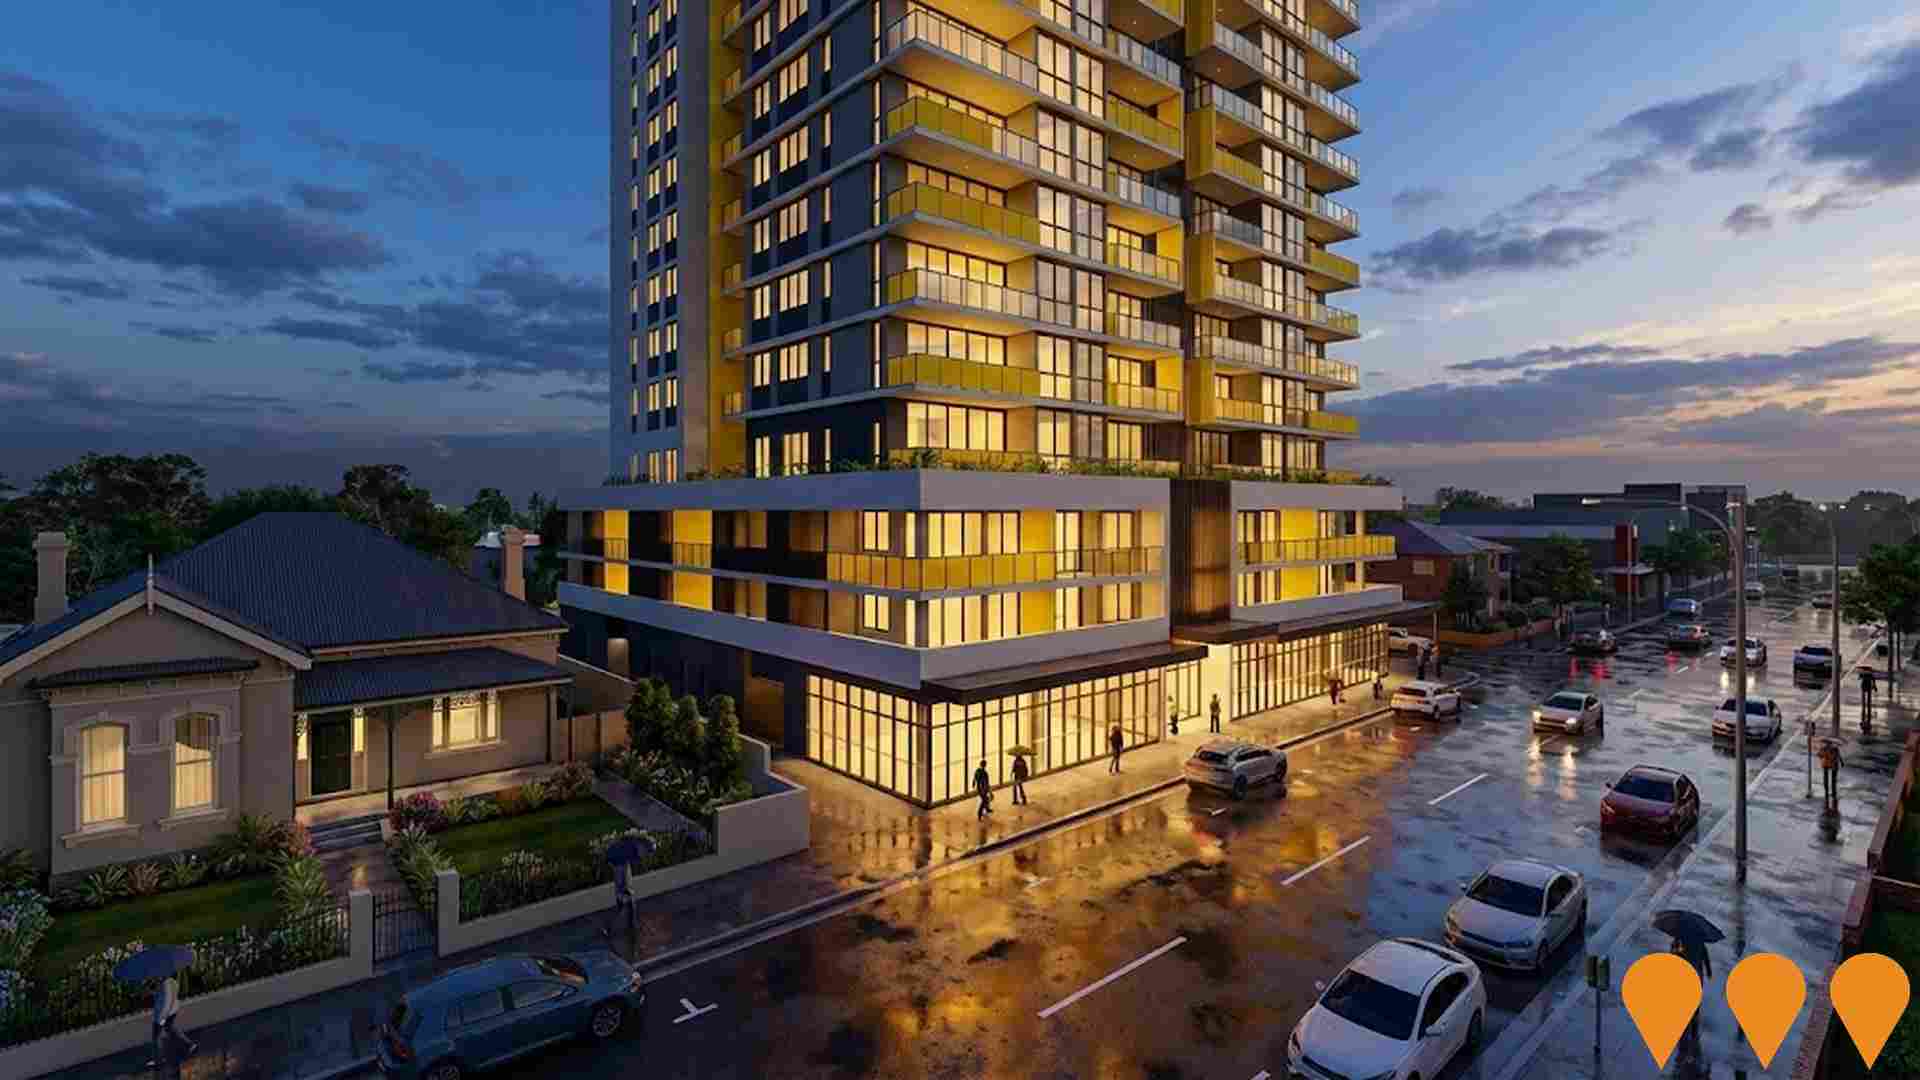
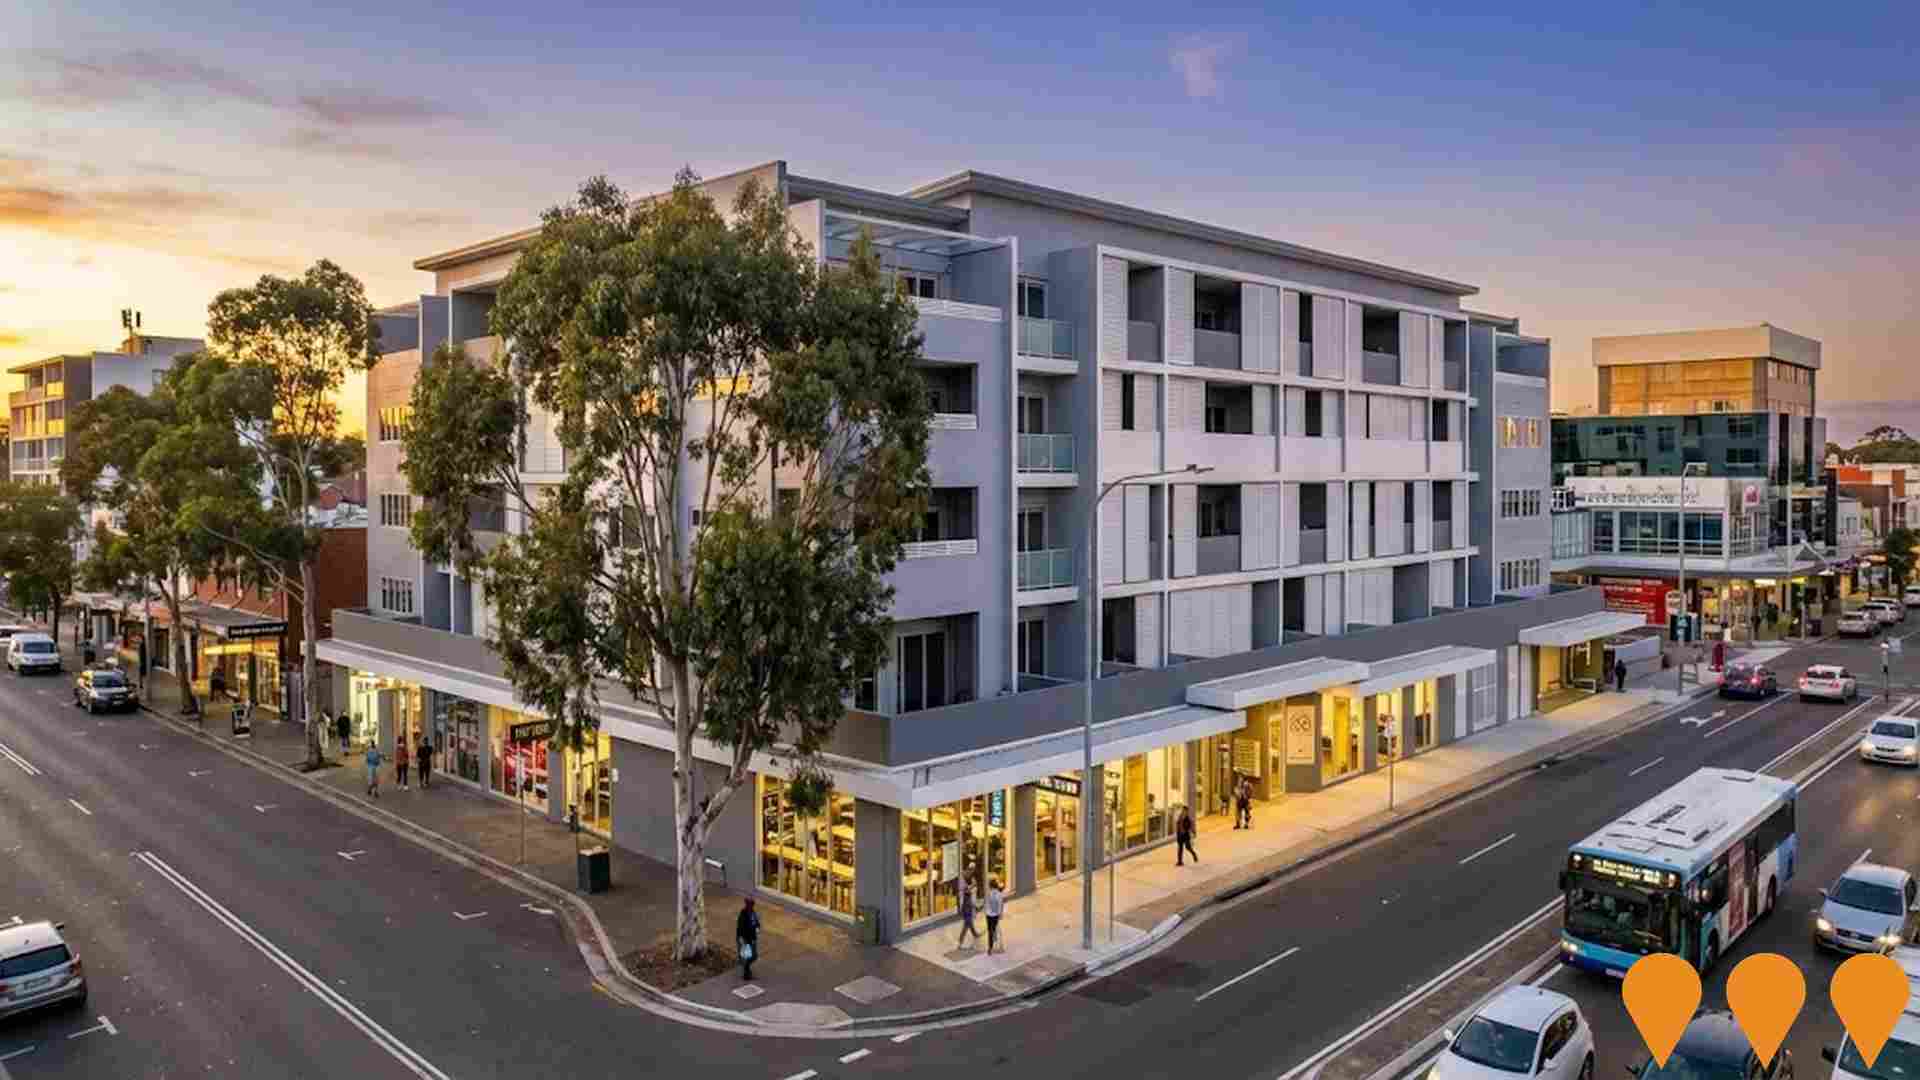
 Denotes AI-based impression for illustrative purposes only, not to be taken as definitive under any circumstances. Please follow links and conduct other investigations from the project's source for actual imagery. Developers and project owners wishing us to use original imagery please Contact Us and we will do so.
Frequently Asked Questions - Infrastructure
Camellia-Rosehill Place Strategy
A finalised 20-year place strategy to renew the 320-hectare Camellia-Rosehill precinct into a vibrant town centre with an 18-hour entertainment precinct, up to 15,400 jobs, 10,000 new homes, improved transport connections (including light rail and road upgrades), new public open spaces along the Parramatta River foreshore, a new urban services precinct, and retention of heavy industrial land. The strategy was finalised in 2022 with rezoning proposals now in preparation. A separate larger consortium proposal to include the adjacent Rosehill Racecourse site (for up to 45,000 homes total) was rejected by Australian Turf Club members on 27 May 2025.
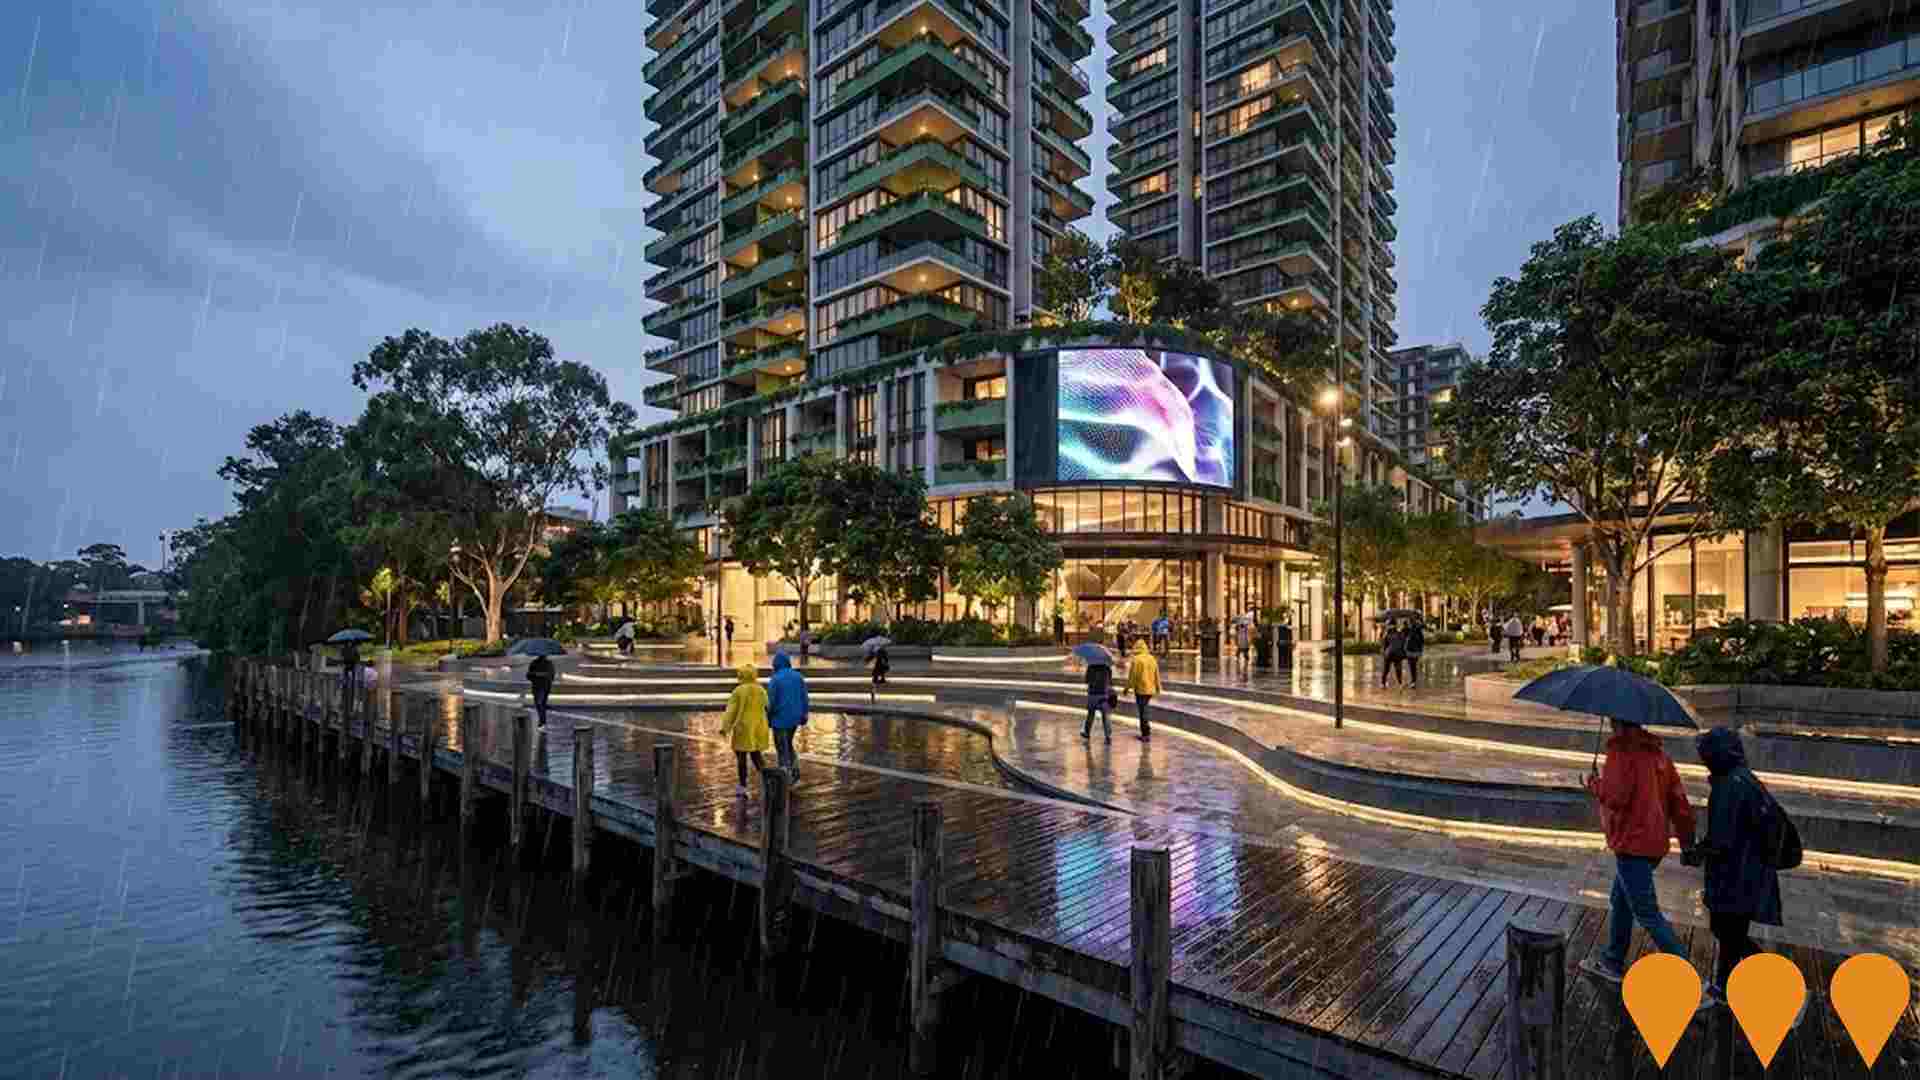
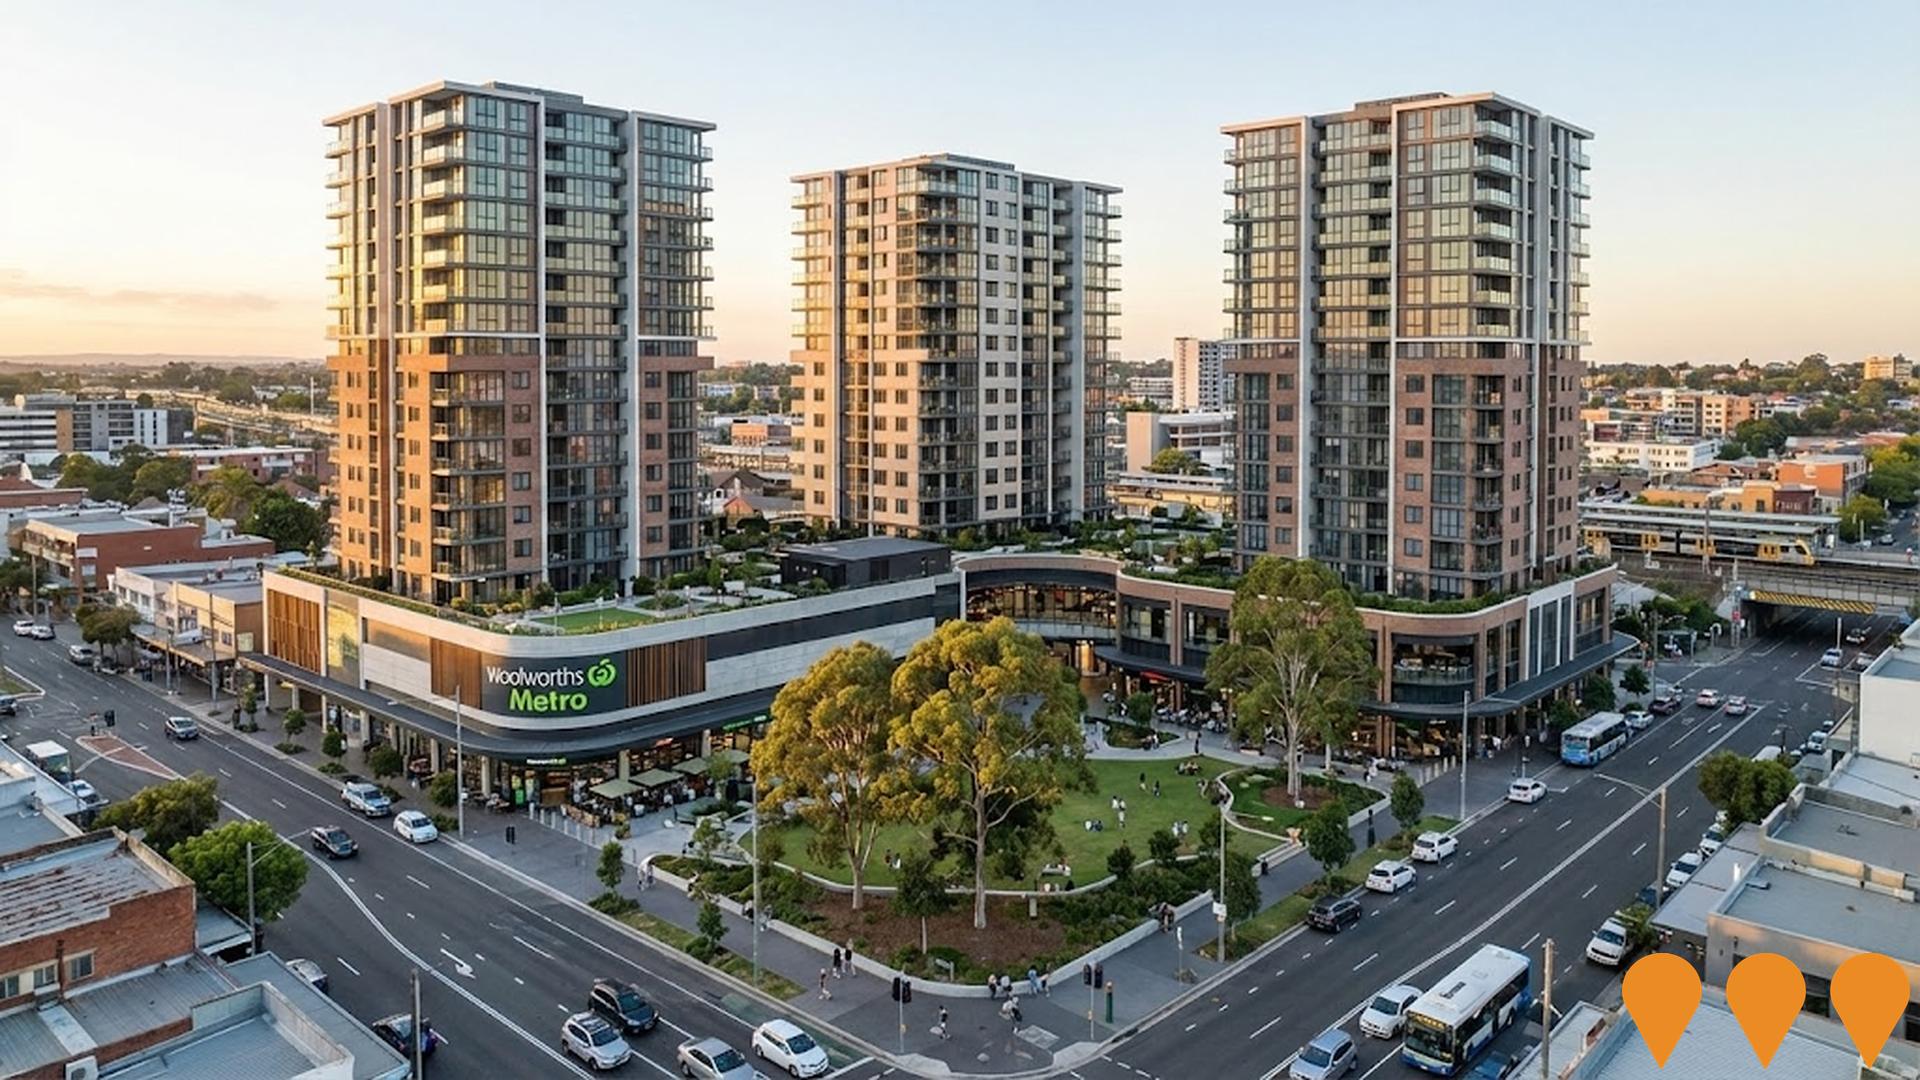
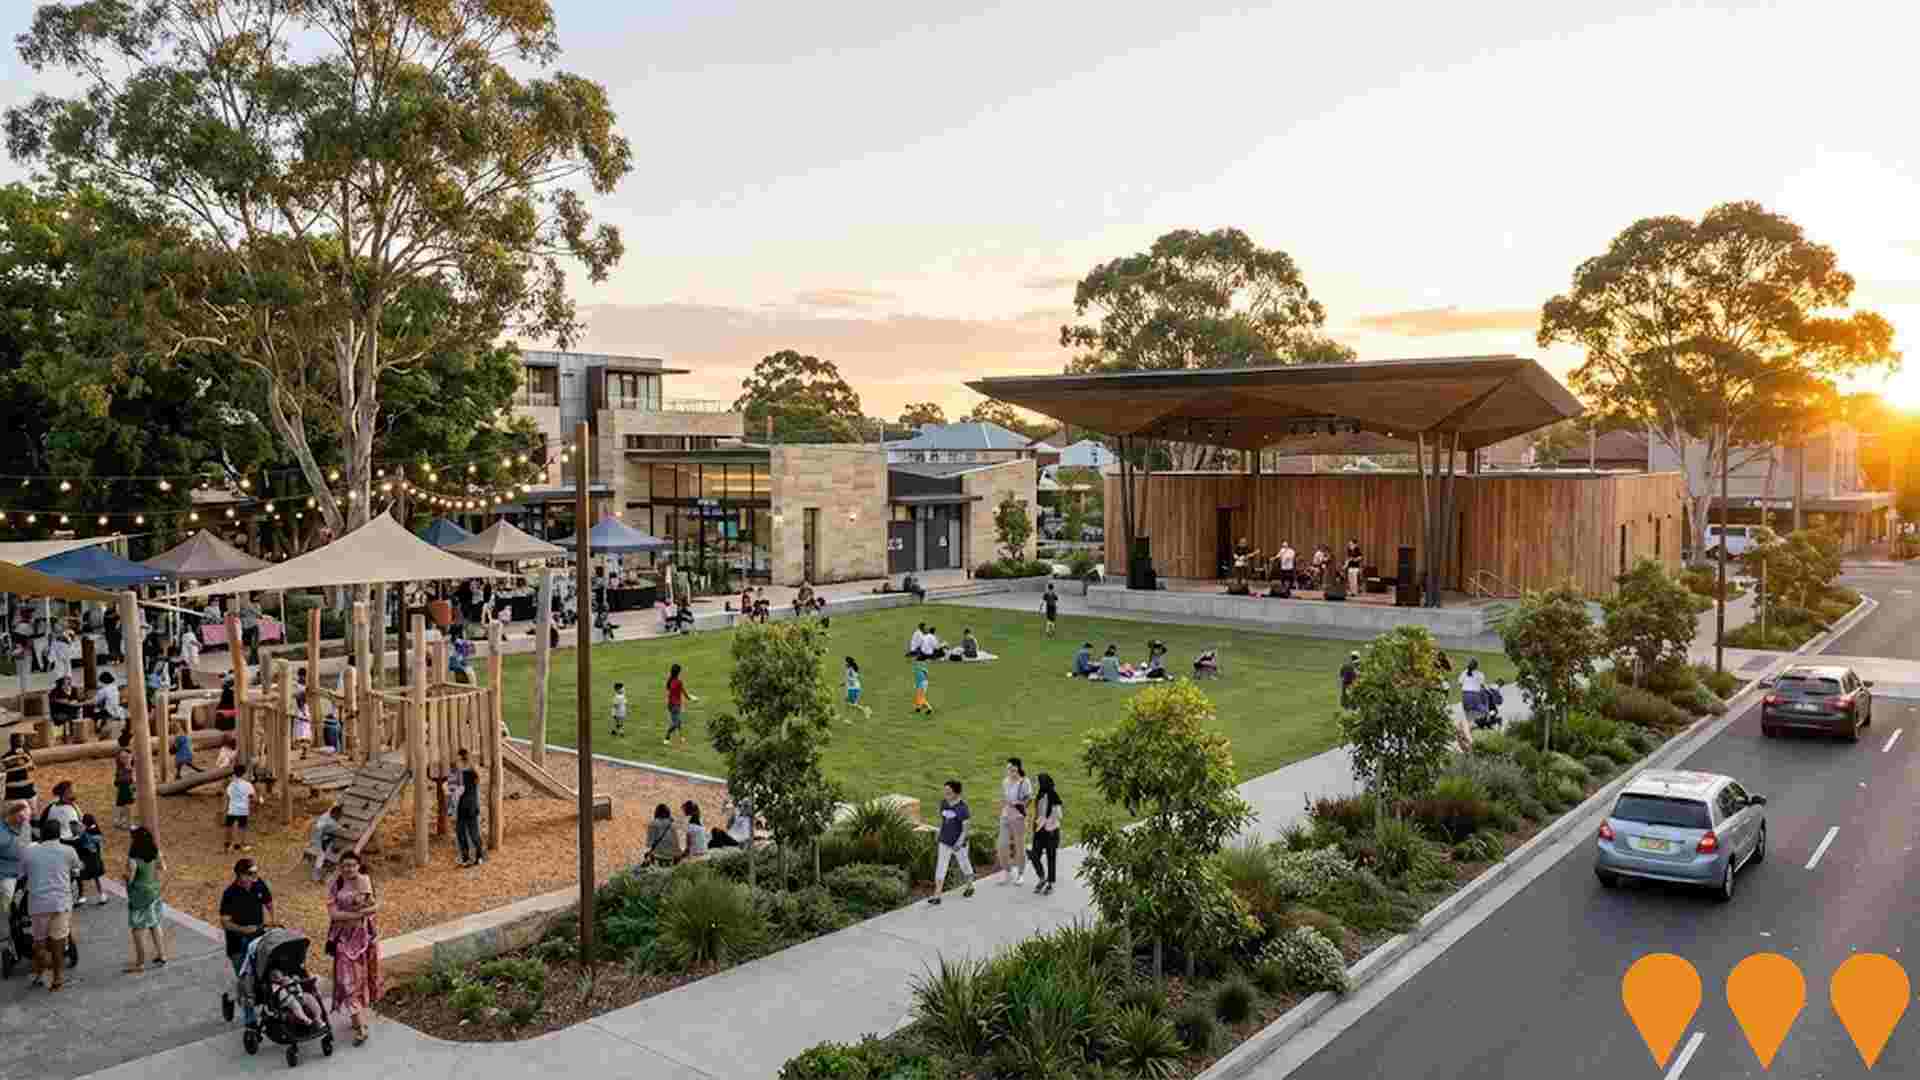
Granville Town Square
Transformation of a 3,500 sqm council-owned car park and adjacent buildings into a new civic heart for Granville featuring a large village green, performance stage, public amenities, children's playground, market spaces and community event areas.
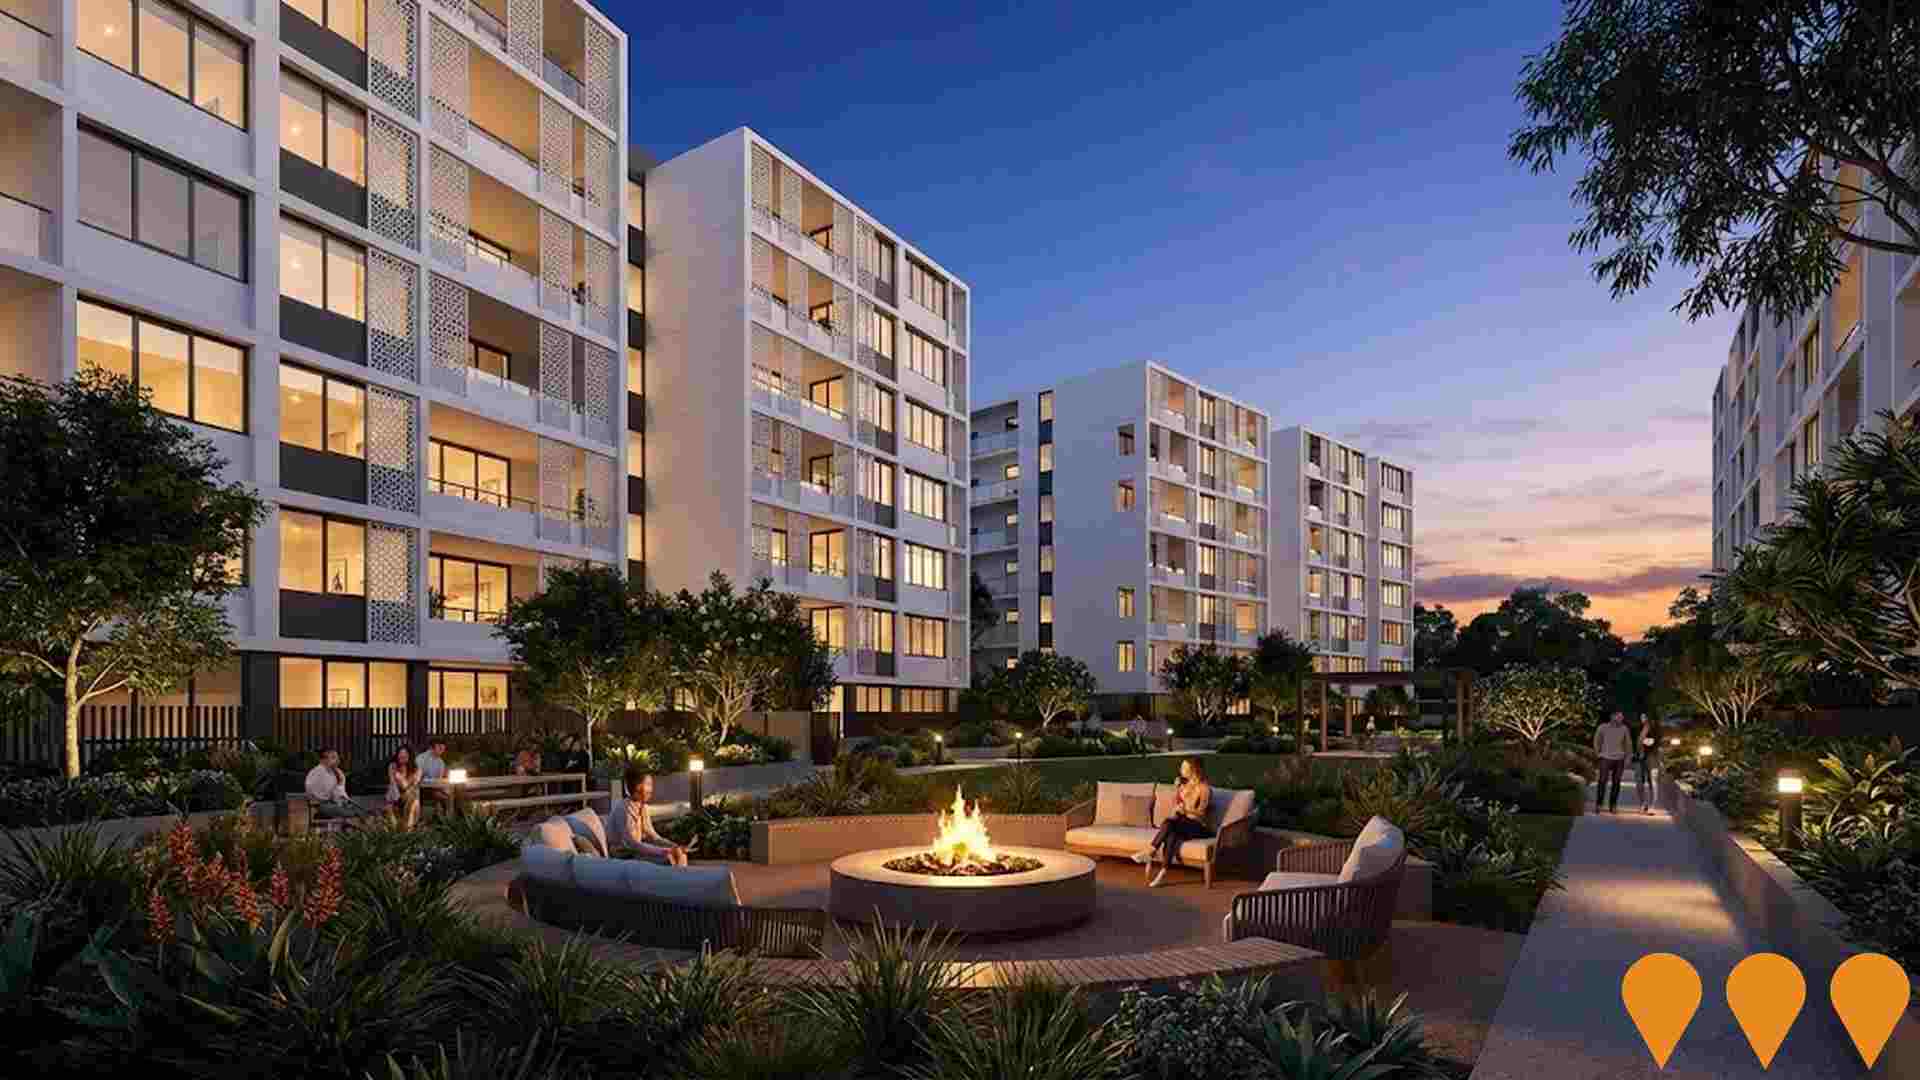
Granville Place
A large-scale, mixed-use development that has revitalised the Granville town centre. The project features 663 residential apartments across three towers, a 12,000 sqm retail precinct anchored by a Woolworths and other specialty stores, a 7,000 sqm public open space including a park and plaza, and a community centre. The development aims to create a vibrant local hub with improved amenities and public facilities.
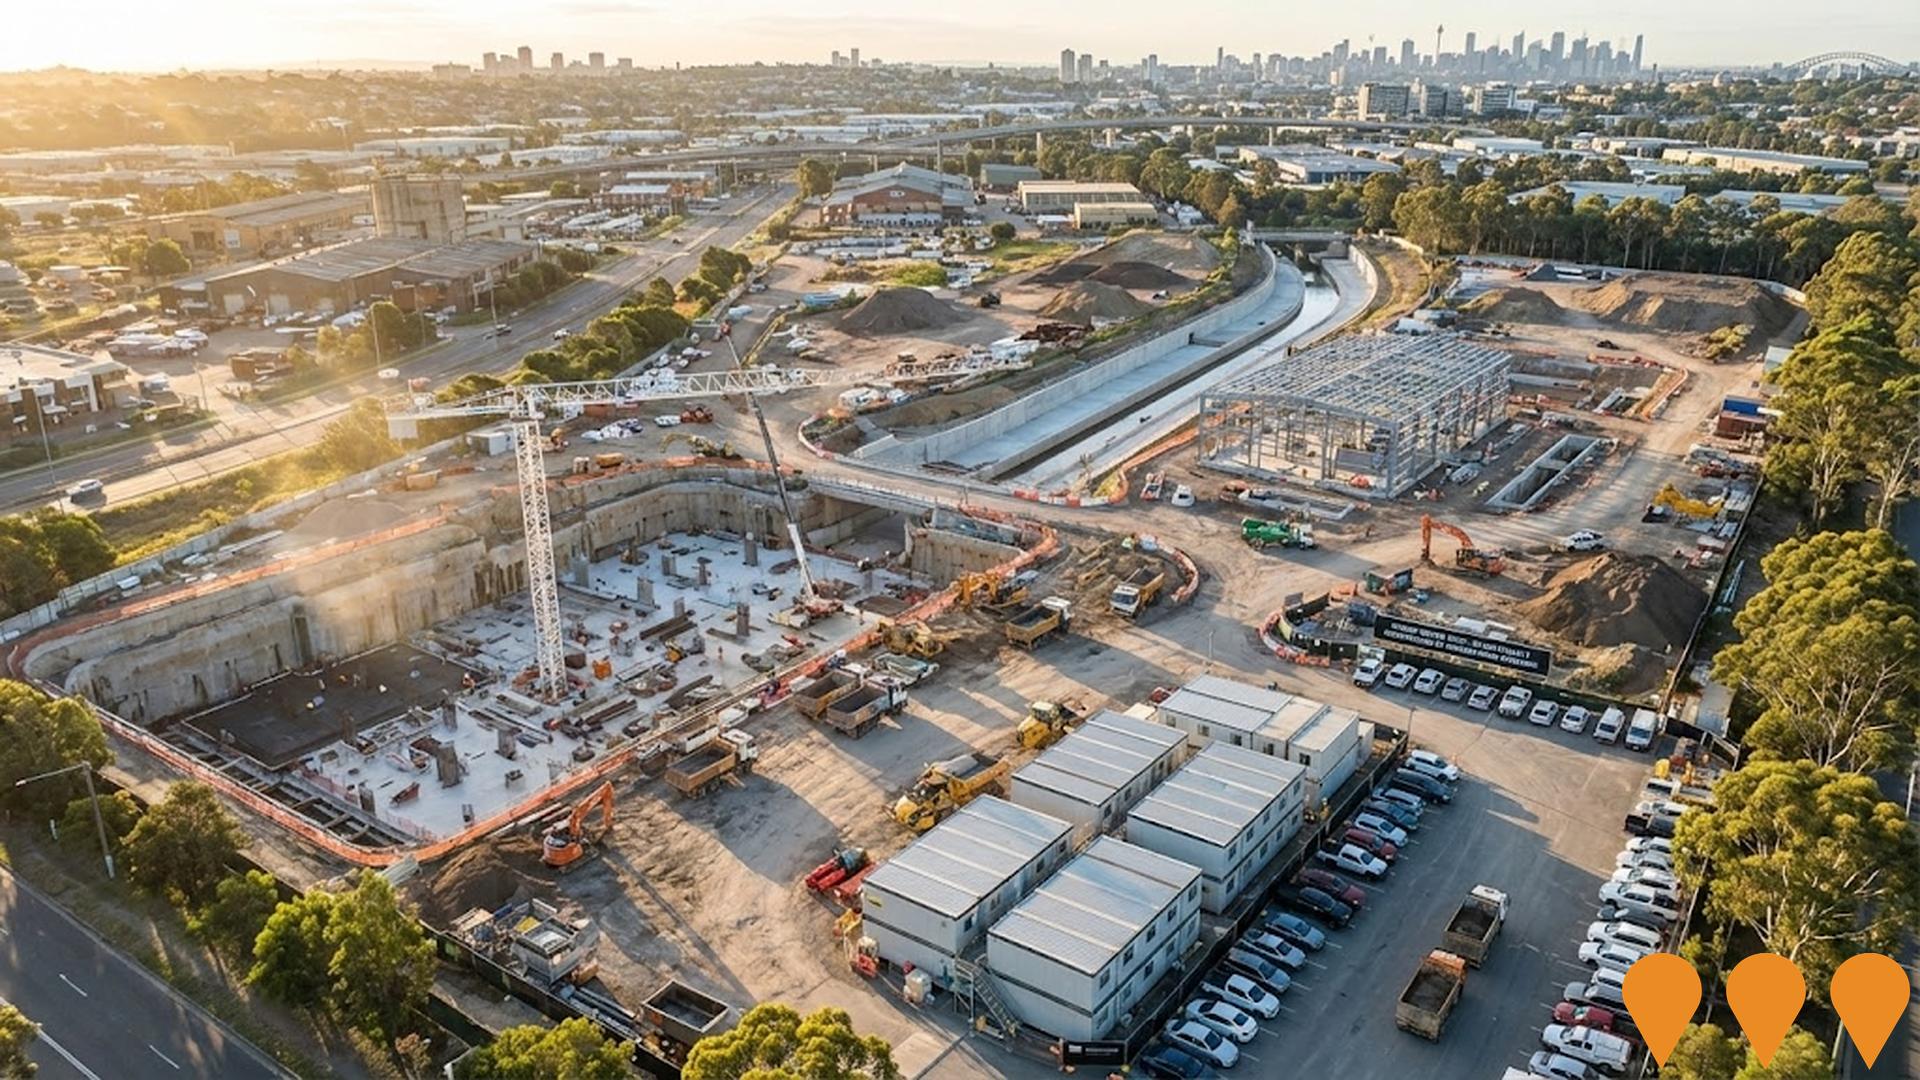
Sydney Metro West - Clyde Stabling and Maintenance Facility
A major transport infrastructure facility to support the new 24-kilometre Sydney Metro West line. Located at Clyde, the facility will provide for the stabling and maintenance of the new metro fleet. It includes a traction substation for power, a water treatment plant, offices, parking, and storage. The facility is a key component of the Western Tunnelling Package (WTP), a $2.16 billion contract awarded to the Gamuda Australia and Laing O'Rourke Consortium (GLC). Tunnelling Boring Machines were launched from the site in late 2023 and major construction of bridges, creek realignment, and earthworks are ongoing.
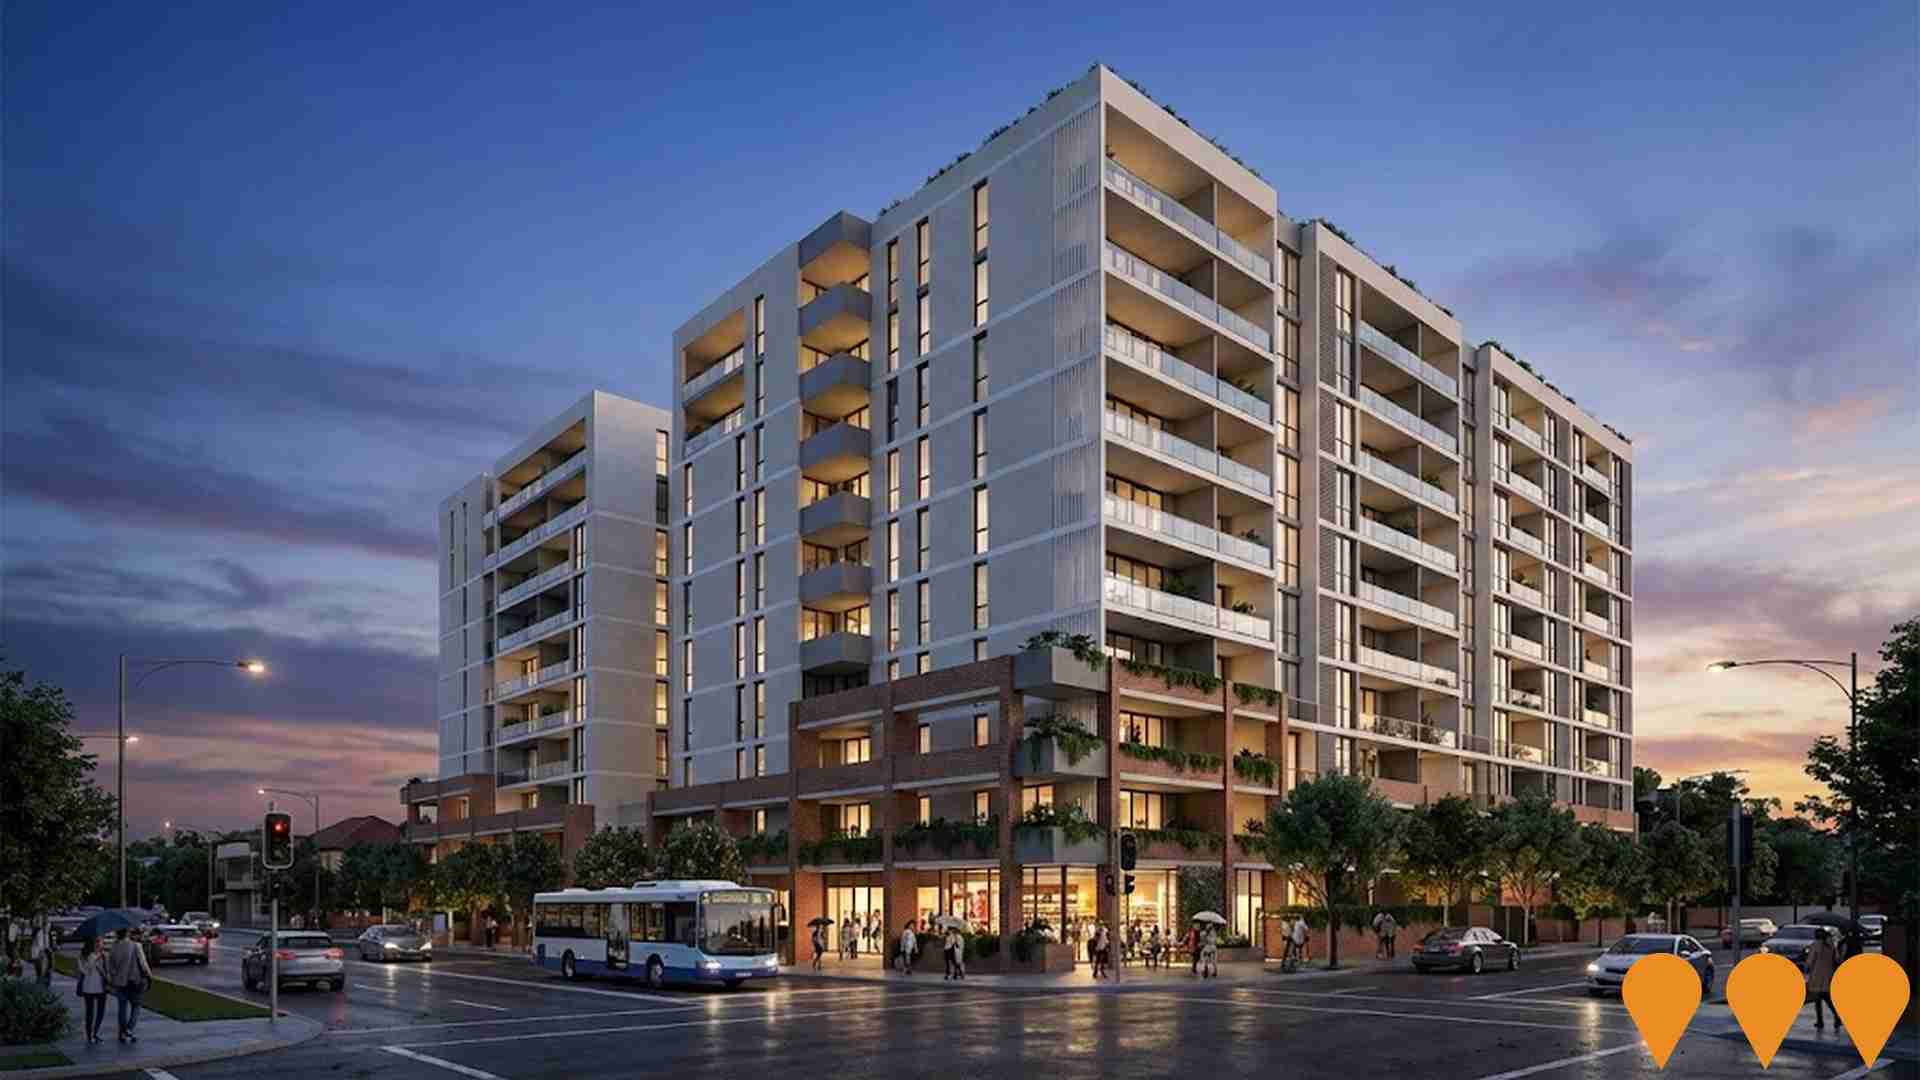
North Village Auburn Square Stage 2
The second stage of the Auburn Square precinct, North Village delivers 264 one, two, and three-bedroom apartments with premium fixtures, elevated finishes, lush communal gardens, and BBQ areas. It includes ground-floor retail anchored by a Coles supermarket and is backed by 10-year Latent Defect Insurance for peace of mind.
Parramatta Road Urban Amenity Improvement Program Auburn
The program aims to improve Auburn's liveability by enhancing public spaces, rejuvenating the area as a place to live, shop, and do business. It includes streetscape upgrades, public domain improvements, and enhanced connectivity along the Parramatta Road corridor. Funded by a $27 million NSW Government grant to Cumberland City Council, it is part of the 30-year Parramatta Road Urban Transformation Strategy. Recent updates include park upgrades and public art installations in 2025.
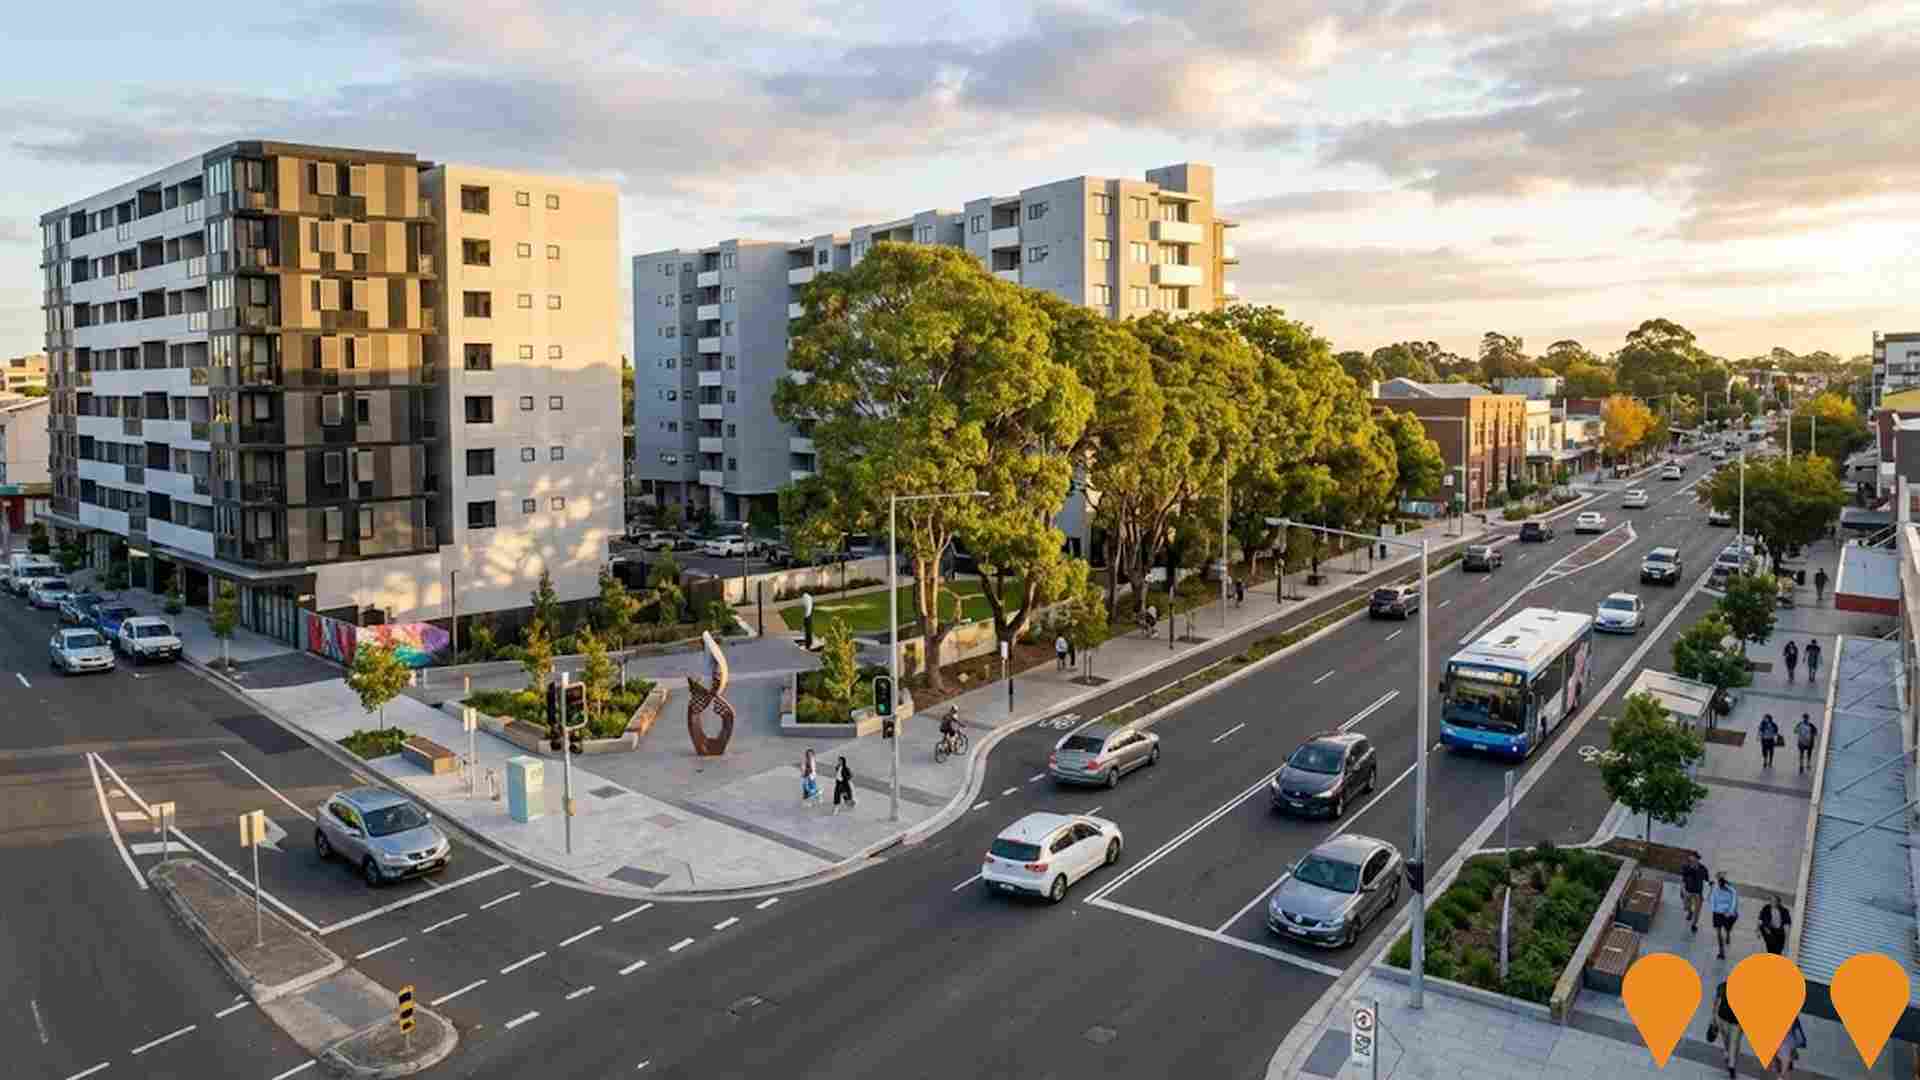
Gran Central Granville
Major mixed-use development comprising 373 residential apartments in two 25-storey towers, ground-floor retail and food & beverage tenancies, commercial office space, a new public plaza, basement parking, communal rooftop gardens with BBQ facilities and resident lounge.
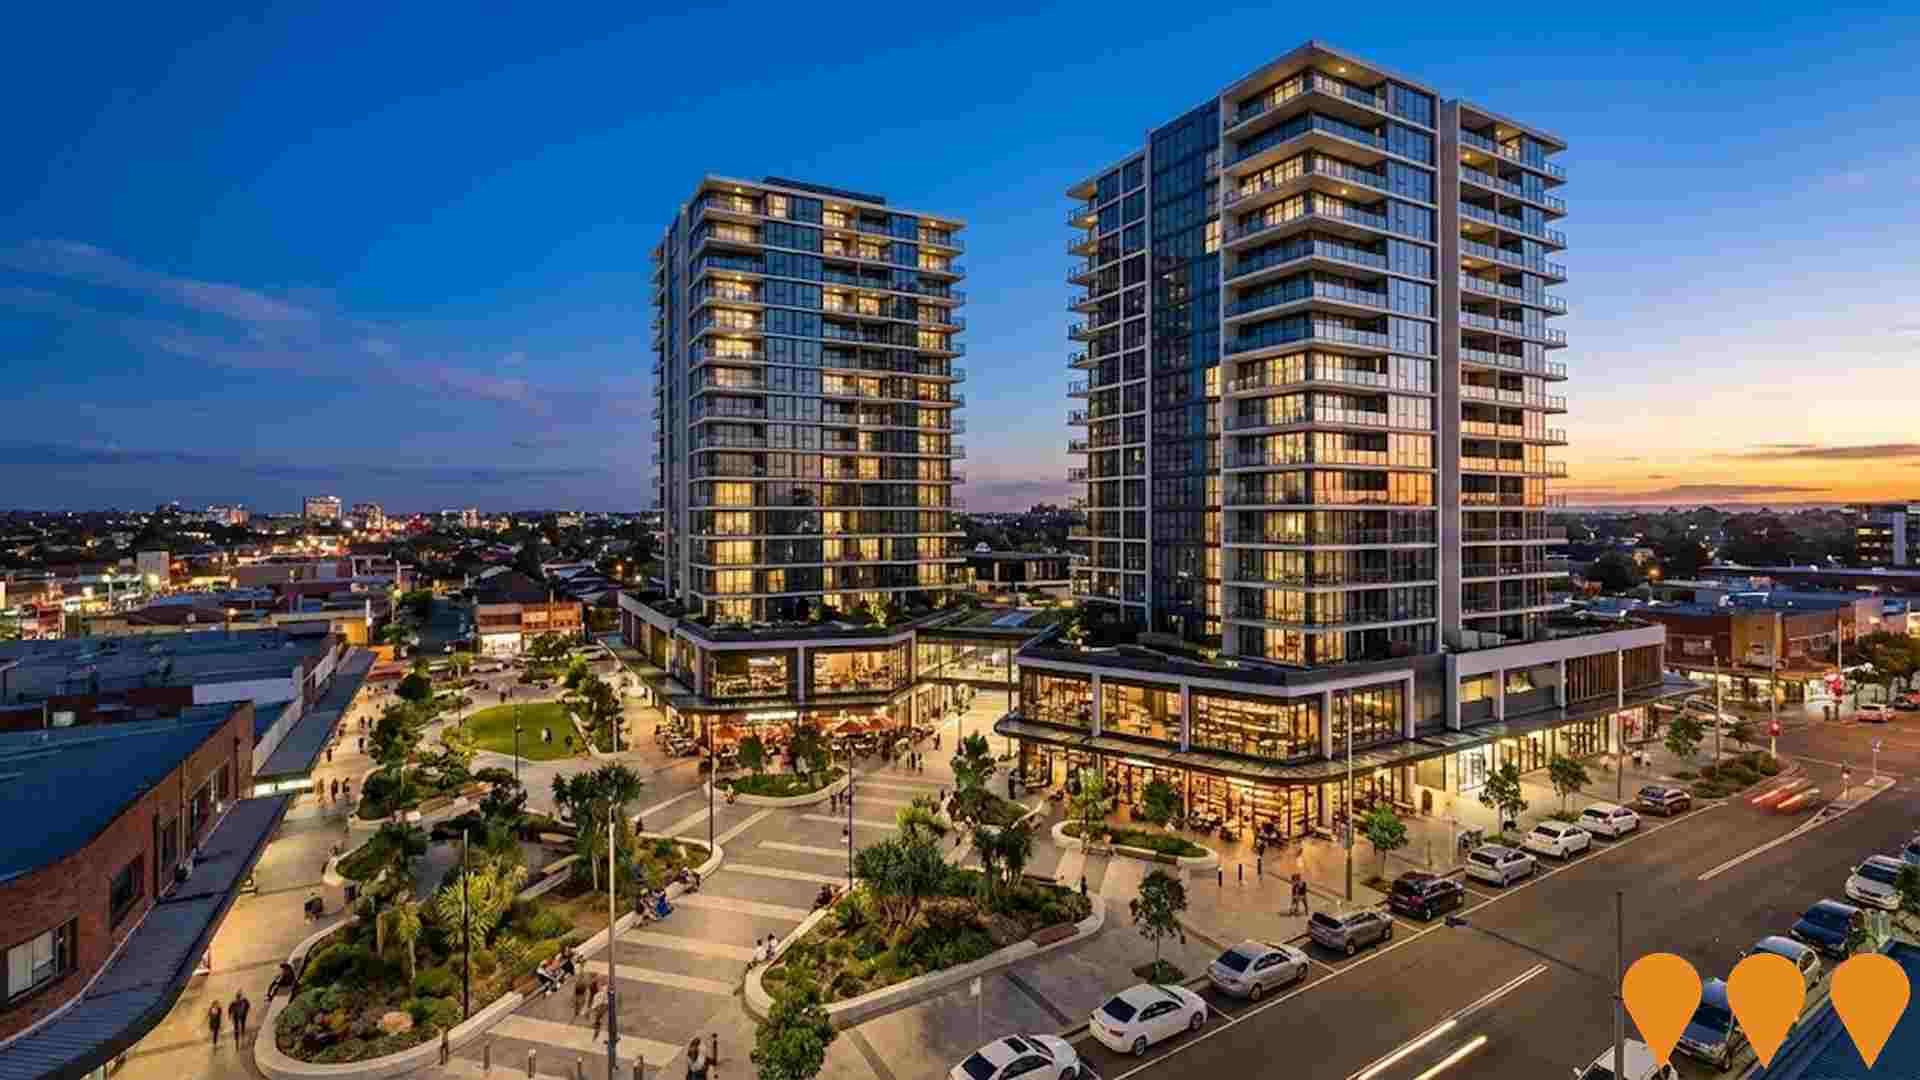
Connecting Granville Centres
A series of pedestrian infrastructure improvements to enhance connectivity and safety in and around the Granville town centre. The project includes upgrades to Good Street and Bridge Street with new paving, improved crossings, and street furniture. It is designed to link key destinations such as the future Granville Town Square, F.S. Garside Park, the M4 underpass, and pathways to the Parramatta CBD. A new 40km/h High Pedestrian Activity Area will also be implemented to improve safety.
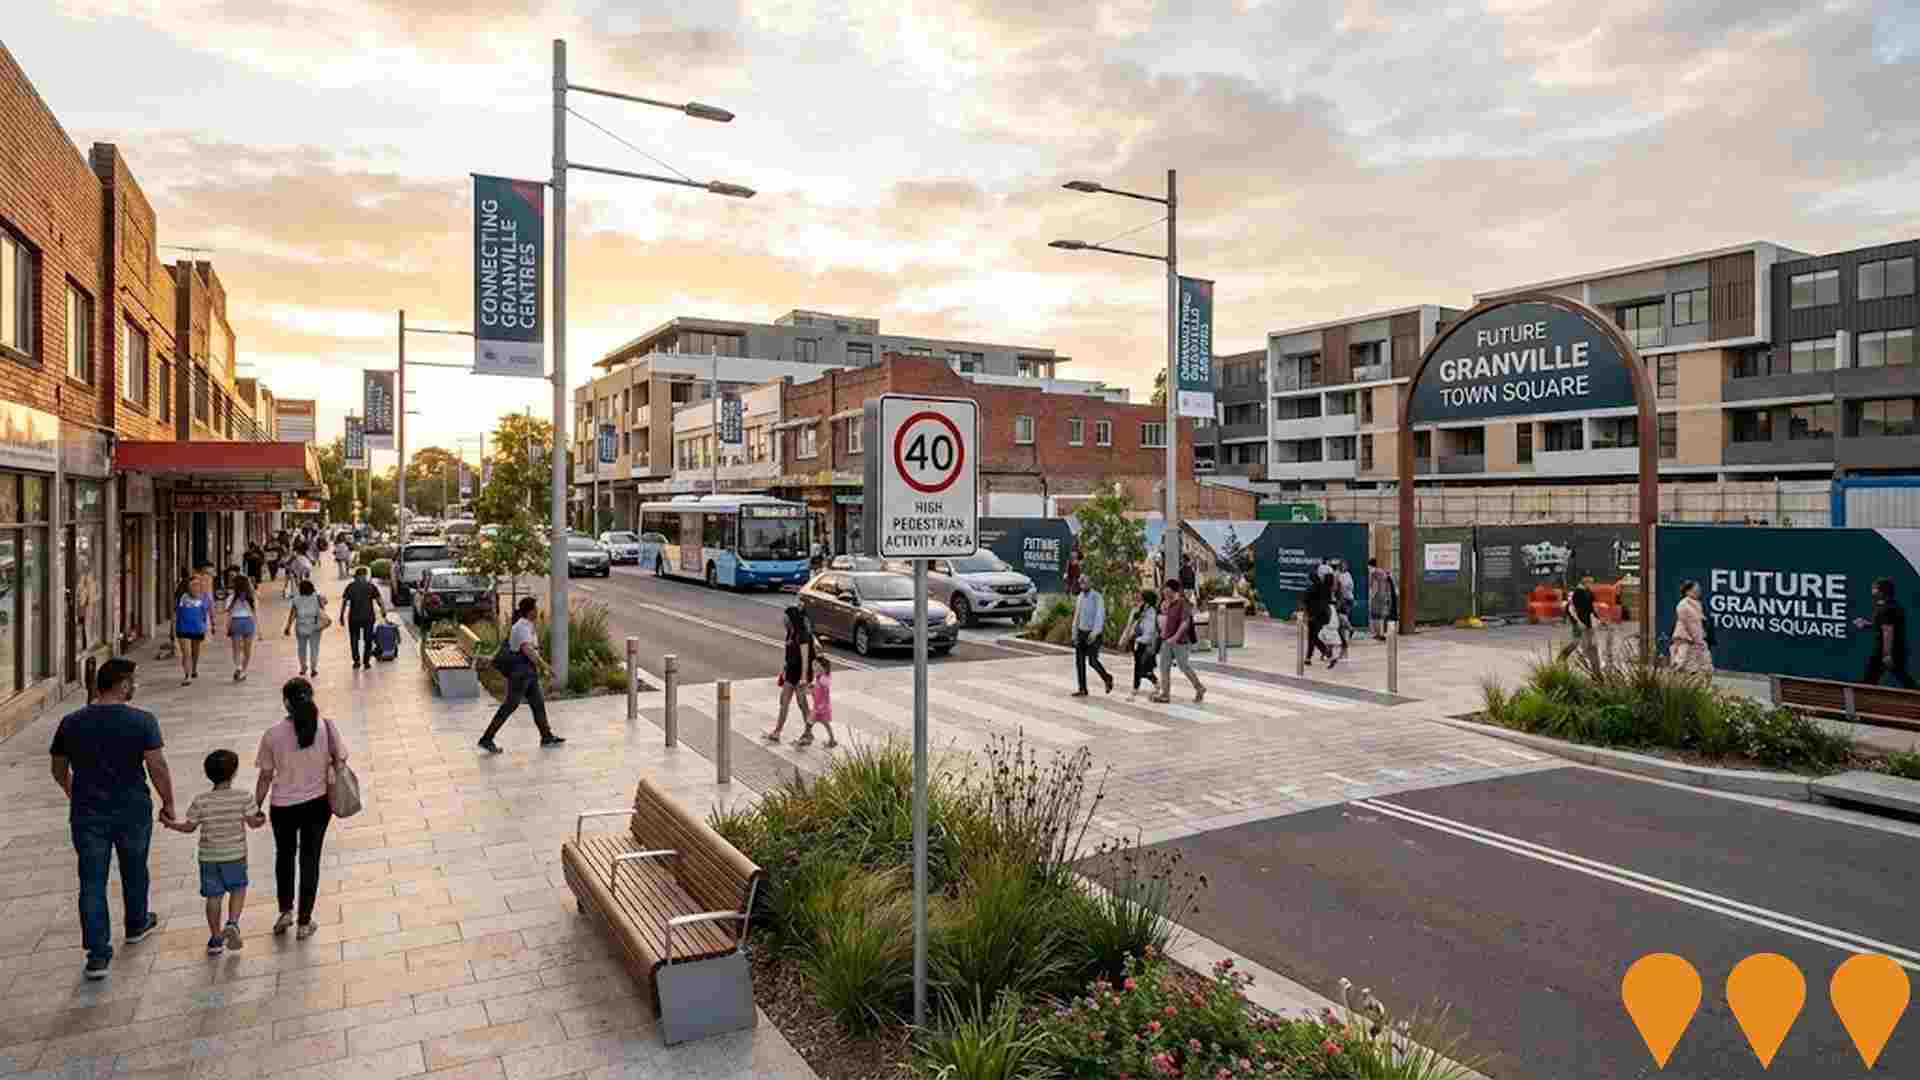
Employment
Employment drivers in Granville - Clyde are experiencing difficulties, placing it among the bottom 20% of areas assessed across Australia
Granville - Clyde has an educated workforce with diverse sector representation. The unemployment rate was 8.0% in the past year, with estimated employment growth of 1.7%.
As of September 2025, 12,312 residents were employed while the unemployment rate was 3.8% higher than Greater Sydney's rate of 4.2%. Workforce participation stood at 49.3%, significantly lower than Greater Sydney's 60.0%. Leading employment industries included health care & social assistance, retail trade, and accommodation & food. The area showed strong specialization in health care & social assistance with an employment share of 1.2 times the regional level.
However, professional & technical services had lower representation at 7.2% compared to the regional average of 11.5%. Over the year to September 2025, employment increased by 1.7%, while labour force rose by 3.5%, leading to an unemployment rate increase of 1.7 percentage points. In contrast, Greater Sydney experienced employment growth of 2.1% and a smaller rise in unemployment. State-level data from 25-Nov-2025 showed NSW employment contracted slightly by 0.03%, with the state unemployment rate at 3.9%. National employment forecasts from May-25 projected national employment to expand by 6.6% over five years and 13.7% over ten years, but growth rates varied significantly between industry sectors. Applying these projections to Granville - Clyde's employment mix suggested local employment should increase by 6.6% over five years and 13.8% over ten years, though this was a simple extrapolation for illustrative purposes and did not account for localized population projections.
Frequently Asked Questions - Employment
Income
Income figures position the area below 75% of locations analysed nationally by AreaSearch
AreaSearch's latest postcode level ATO data for financial year 2022 shows Granville - Clyde SA2 had a median income among taxpayers of $42,851 and an average of $52,154. This is below the national average. Greater Sydney's median income was $56,994 with an average of $80,856. Based on Wage Price Index growth of 12.61% since financial year 2022, current estimates for Granville - Clyde SA2 are approximately $48,255 (median) and $58,731 (average) as of September 2025. According to the 2021 Census, individual incomes lag at the 15th percentile with $629 weekly income, while household income performs better at the 40th percentile. The predominant income cohort spans 33.4% of locals (8,326 people) in the $1,500 - 2,999 category, mirroring regional levels where 30.9% occupy this bracket. Housing affordability pressures are severe with only 78.8% of income remaining, ranking at the 35th percentile.
Frequently Asked Questions - Income
Housing
Granville - Clyde displays a diverse mix of dwelling types, with a higher proportion of rental properties than the broader region
Granville-Clyde's dwelling structure in its latest Census report showed 49.9% houses and 50.1% other dwellings (semi-detached, apartments, 'other' dwellings). This compares to Sydney metro's 62.1% houses and 37.8% other dwellings. Home ownership was at 22.9%, with mortgaged dwellings at 28.2% and rented ones at 48.9%. The median monthly mortgage repayment was $2,000, below Sydney metro's average of $2,167. Median weekly rent was $420, compared to Sydney metro's $400. Nationally, Granville-Clyde's mortgage repayments were higher at $1,863 and rents substantially above the national figure of $375.
Frequently Asked Questions - Housing
Household Composition
Granville - Clyde features high concentrations of group households, with a fairly typical median household size
Family households constitute 71.7% of all households, including 35.7% couples with children, 21.6% couples without children, and 11.7% single parent families. Non-family households comprise the remaining 28.3%, with lone person households at 19.9% and group households making up 8.4%. The median household size is 3.1 people, aligning with the Greater Sydney average.
Frequently Asked Questions - Households
Local Schools & Education
Educational attainment in Granville - Clyde aligns closely with national averages, showing typical qualification patterns and performance metrics
Granville - Clyde Trail Regional Benchmarks: 32.1% of residents aged 15+ have university degrees, compared to the SA4 region's 39.1%. The gap suggests potential for educational development and skill enhancement. Bachelor degrees are most common at 21.3%, followed by postgraduate qualifications (9.4%) and graduate diplomas (1.4%). Trade and technical skills are prominent with 25.4% of residents aged 15+ holding vocational credentials – advanced diplomas (12.2%) and certificates (13.2%).
Educational participation is high at 36.7%, including 9.7% in tertiary education, 9.1% in primary education, and 7.3% pursuing secondary education.
Frequently Asked Questions - Education
Schools Detail
Nearby Services & Amenities
Transport
Transport servicing is high compared to other areas nationally based on assessment of service frequency, route connectivity and accessibility
Granville-Clyde has 130 active public transport stops. These are a mix of train and bus services. There are 39 individual routes operating in total.
Collectively, these routes provide 7,937 weekly passenger trips. Residents have excellent transport accessibility, with an average distance of 124 meters to the nearest stop. The service frequency is high, with an average of 1,133 trips per day across all routes. This equates to approximately 61 weekly trips per individual stop.
Frequently Asked Questions - Transport
Transport Stops Detail
Health
Granville - Clyde's residents boast exceedingly positive health performance metrics with younger cohorts in particular seeing very low prevalence of common health conditions
Health outcomes data shows excellent results across Granville - Clyde, with younger cohorts having a very low prevalence of common health conditions. The rate of private health cover stands at approximately 46% of the total population (~11,517 people), which is lower than the national average of 55.3%.
Diabetes and asthma are the most prevalent medical conditions in the area, affecting 4.9% and 4.5% of residents respectively. A higher proportion of residents, at 81.6%, report being completely clear of medical ailments compared to Greater Sydney's 77.0%. The area has a lower percentage of residents aged 65 and over, at 11.4% (2,841 people), compared to Greater Sydney's 13.9%. Despite this, health outcomes among seniors require more attention than those in the broader population.
Frequently Asked Questions - Health
Cultural Diversity
Granville - Clyde is among the most culturally diverse areas in the country based on AreaSearch assessment of a range of language and cultural background related metrics
Granville-Clyde has a population where 60.8% were born overseas and 75.6% speak a language other than English at home. Christianity is the predominant religion, with 35.7% of people practicing it. Hinduism is significantly higher in Granville-Clyde compared to Greater Sydney, comprising 15.2% versus 5.4%.
The top three ancestry groups are Other (36.2%), Lebanese (14.4%), and Chinese (12.6%). Notably, Filipino (3.3%), Vietnamese (2.1%), and Korean (0.9%) ethnicities have higher representation in Granville-Clyde compared to regional averages.
Frequently Asked Questions - Diversity
Age
Granville - Clyde hosts a very young demographic, ranking in the bottom 10% of areas nationwide
Granville-Clyde has a median age of 31 years, which is lower than the Greater Sydney average of 37 and significantly below the Australian median of 38. Compared to Greater Sydney, Granville-Clyde has a higher proportion of residents aged 25-34 (21.8%), but fewer residents aged 45-54 (9.9%). This concentration of 25-34 year-olds is notably higher than the national average of 14.5%. Between 2021 and present, the proportion of residents aged 35 to 44 has increased from 14.0% to 14.7%, while the proportion of those aged 15 to 24 has decreased from 16.0% to 15.0%. By 2041, demographic modeling projects significant changes in Granville-Clyde's age profile. The 45-54 age cohort is expected to expand by 1,514 people (61%), growing from 2,467 to 3,982 residents.
