Chart Color Schemes
This analysis uses ABS Statistical Areas Level 2 (SA2) boundaries, which can materially differ from Suburbs and Localities (SAL) even when sharing similar names.
SA2 boundaries are defined by the Australian Bureau of Statistics and are designed to represent communities for statistical reporting (e.g., census and ERP).
Suburbs and Localities (SAL) represent commonly-used suburb/locality names (postal-style areas) and may use different geographic boundaries. For comprehensive analysis, consider reviewing both boundary types if available.
est. as @ -- *
ABS ERP | -- people | --
2021 Census | -- people
Sales Activity
Curious about local property values? Filter the chart to assess the volume and appreciation (including resales) trends and regional comparisons, or scroll to the map below view this information at an individual property level.
Find a Recent Sale
Sales Detail
Population
Population growth drivers in Blacktown - West are above average based on AreaSearch's ranking of recent, and medium to long-term trends
Blacktown - West's population was approximately 18,032 as of November 2025. This figure reflects an increase of 891 people since the 2021 Census, which reported a population of 17,141. The change is inferred from the estimated resident population of 17,789 in June 2024 and an additional 255 validated new addresses since the Census date. This results in a population density ratio of 3,853 persons per square kilometer, placing Blacktown - West among the top 10% of national locations assessed by AreaSearch, indicating high demand for land in the area. The growth rate of 5.2% since the 2021 Census exceeded that of the SA3 area (4.1%), making Blacktown - West a growth leader in the region. Overseas migration contributed approximately 80.5% of overall population gains during recent periods, driving primary growth for the area.
AreaSearch is adopting ABS/Geoscience Australia projections for each SA2 area, released in 2024 with 2022 as the base year. For areas not covered by this data, AreaSearch utilises NSW State Government's SA2 level projections, released in 2022 with 2021 as the base year. Growth rates by age group from these aggregations are applied to all areas for years 2032 to 2041. Future population trends project an above median growth for national areas, with Blacktown - West expected to increase by 2,694 persons to 2041 based on the latest annual ERP population numbers, reflecting a total increase of 13.6% over the 17 years.
Frequently Asked Questions - Population
Development
Recent residential development output has been above average within Blacktown - West when compared nationally
Blacktown - West has received approximately 158 dwelling approvals annually over the past five financial years, totalling 794 homes. In FY-26, 33 approvals have been recorded to date. The average population growth per year per dwelling constructed between FY-21 and FY-25 was 0.5 residents. This indicates that new construction is meeting or exceeding demand, providing more housing options and potentially enabling population growth beyond current projections.
The average expected construction cost of new homes in the area is $133,000, which is below regional norms, offering more affordable housing options. In FY-26, $3.6 million worth of commercial approvals have been registered, suggesting limited focus on commercial development. Compared to Greater Sydney, Blacktown - West has 56.0% more building activity per person. This should provide buyers with ample choice, although development activity has moderated in recent periods.
The new building activity consists of 65.0% detached houses and 35.0% townhouses or apartments, indicating an expanding range of medium-density options across various price brackets. With approximately 276 people per dwelling approval, Blacktown - West exhibits characteristics of a low density area. According to the latest AreaSearch quarterly estimate, the area is expected to grow by 2,448 residents by 2041. With current construction levels, housing supply should adequately meet demand, creating favourable conditions for buyers and potentially enabling population growth that exceeds current forecasts.
Frequently Asked Questions - Development
Infrastructure
Blacktown - West has strong levels of nearby infrastructure activity, ranking in the top 30% nationally
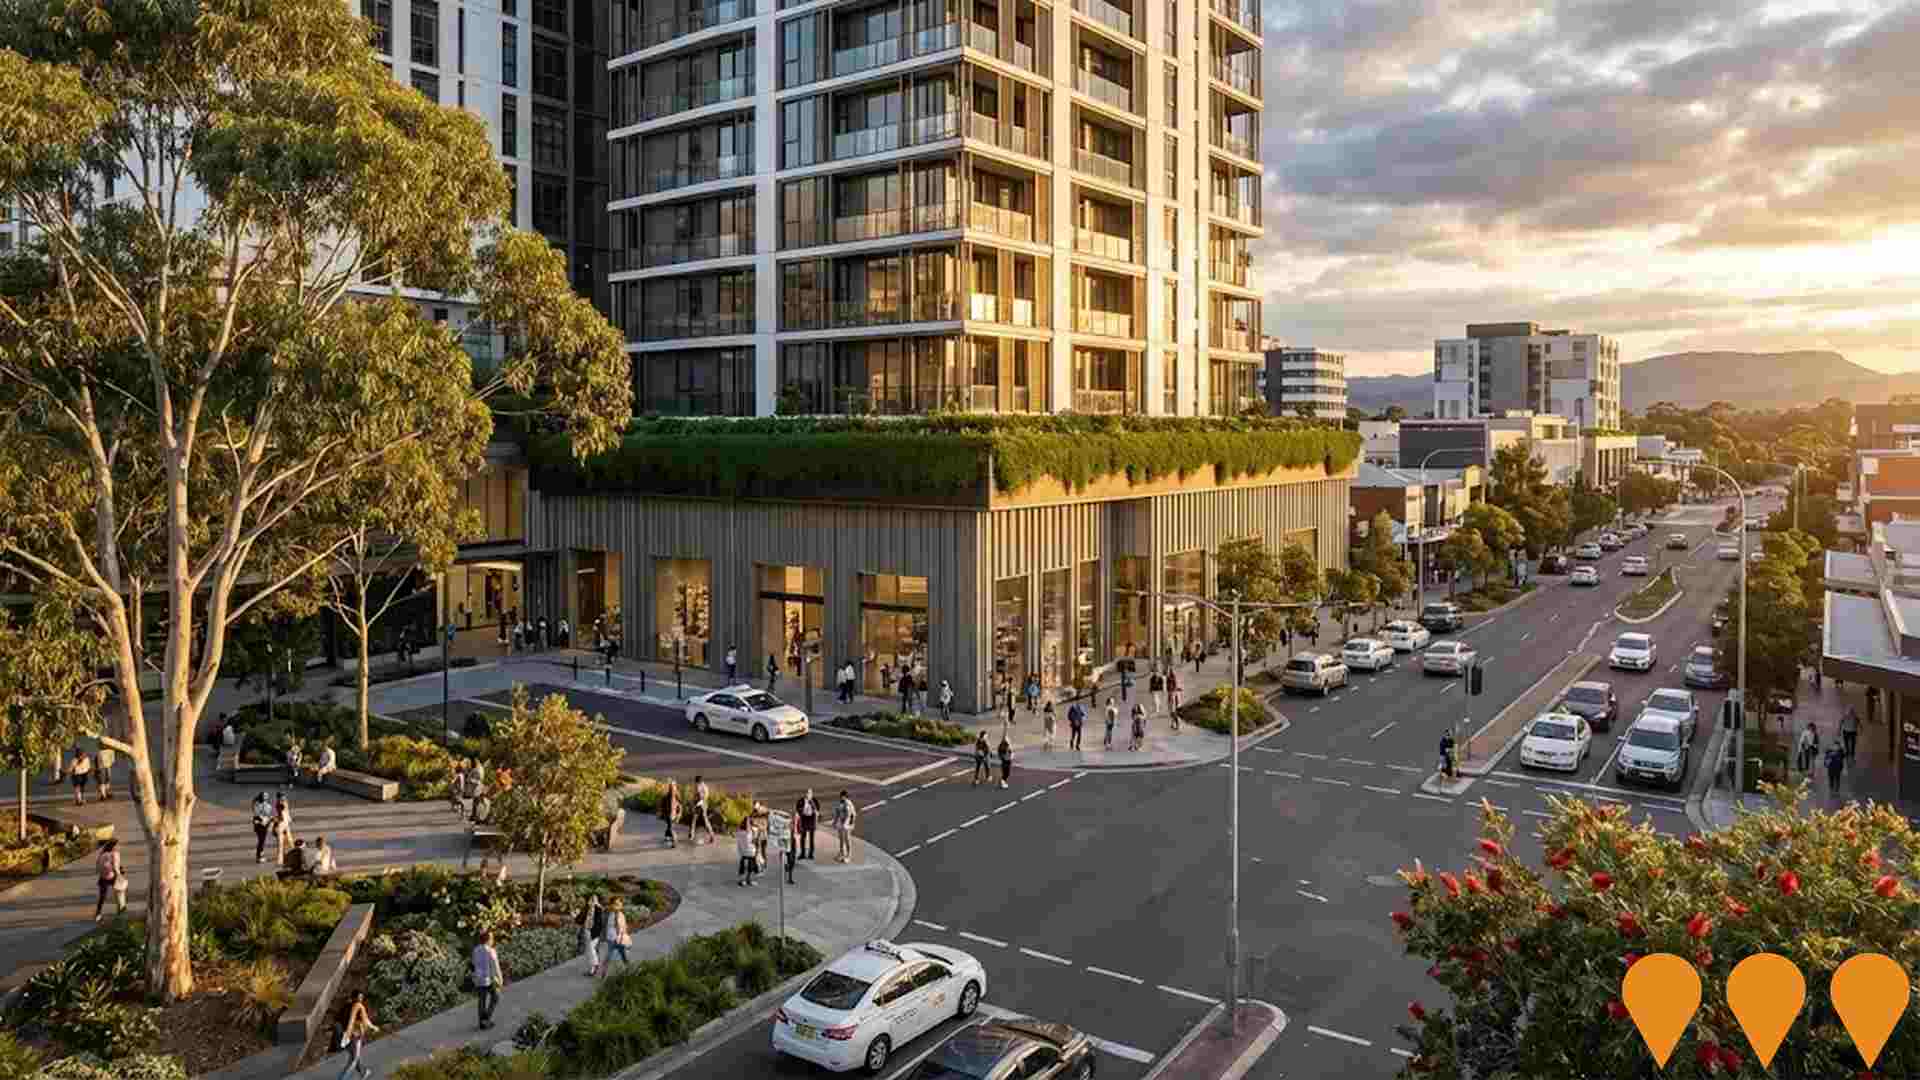
Changes to local infrastructure significantly impact an area's performance. AreaSearch has identified thirteen projects that may affect the area. Notable ones are Blacktown City Council's WestInvest Program, the expansion of Blacktown and Mount Druritt Hospitals Stage 2, St Maurice Village, and Dara Blacktown. The following list details those most relevant.
Professional plan users can use the search below to filter and access additional projects.
INFRASTRUCTURE SEARCH
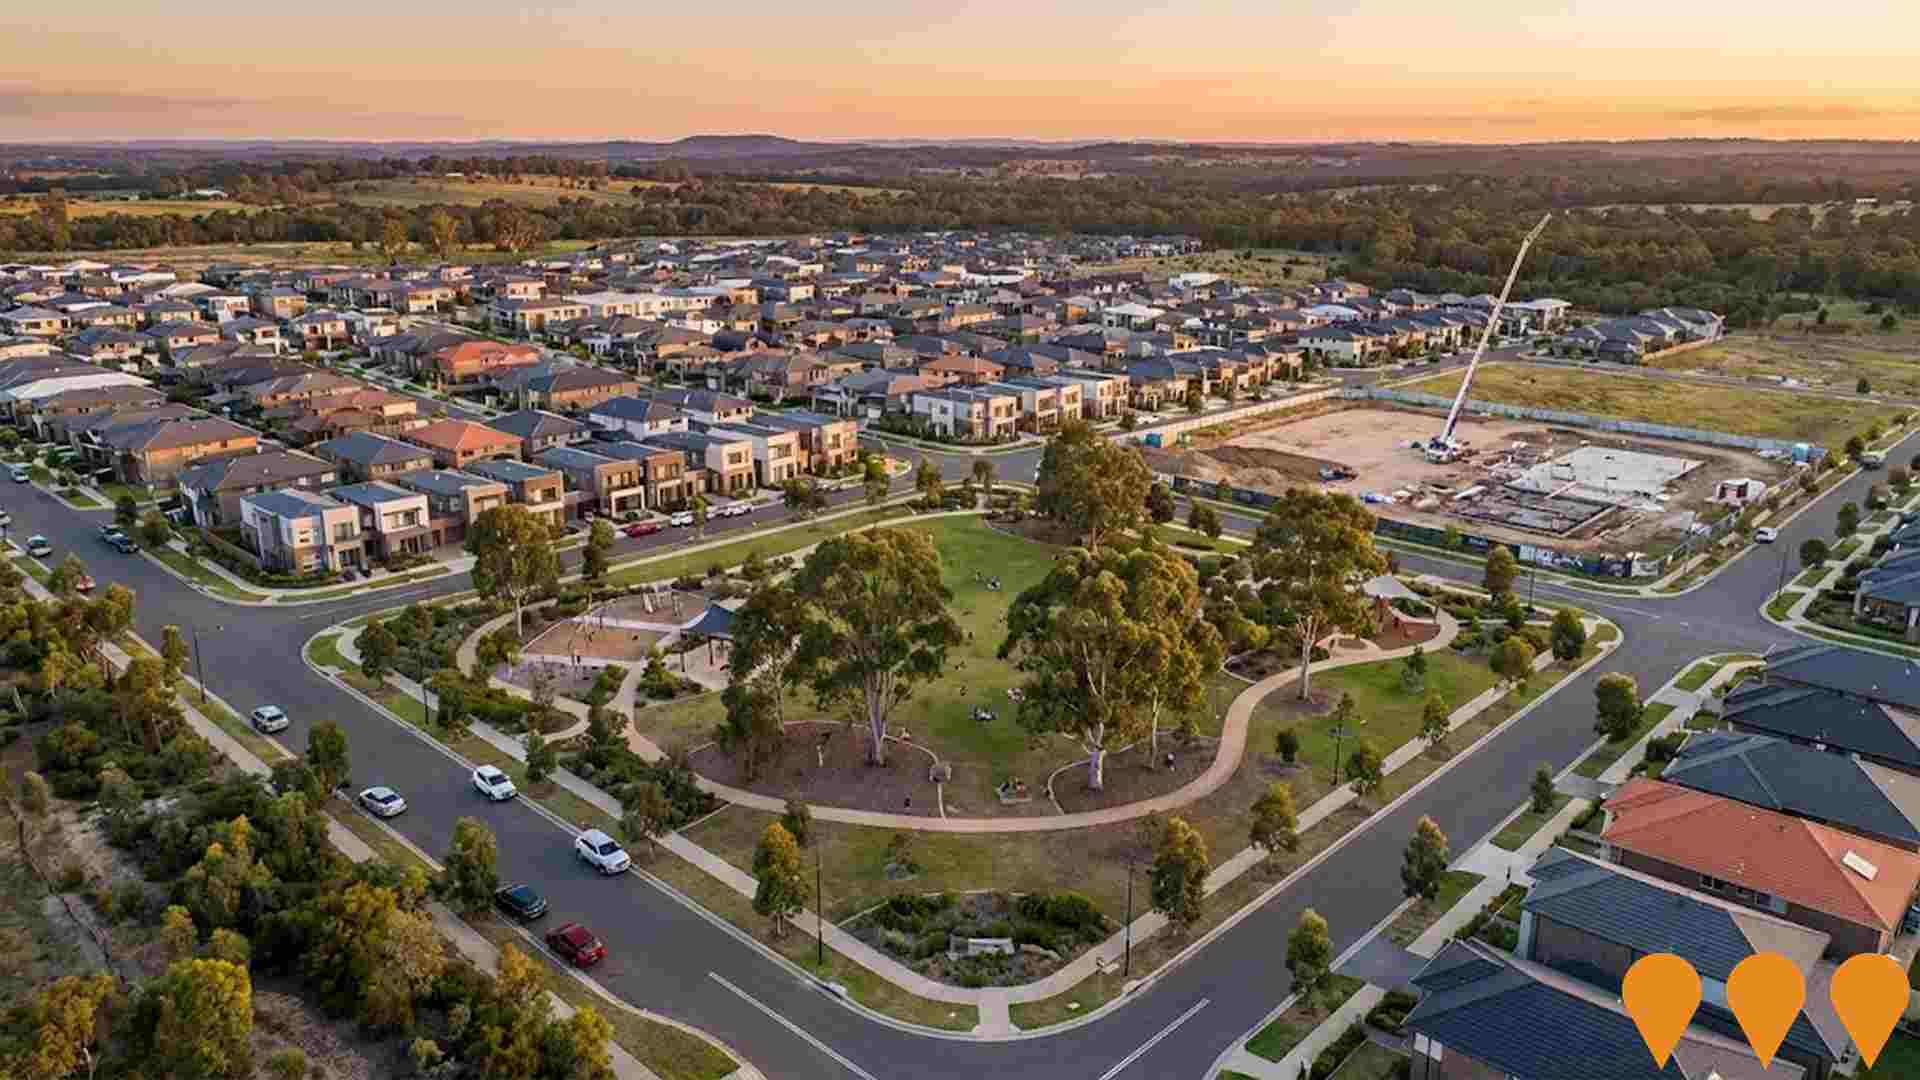
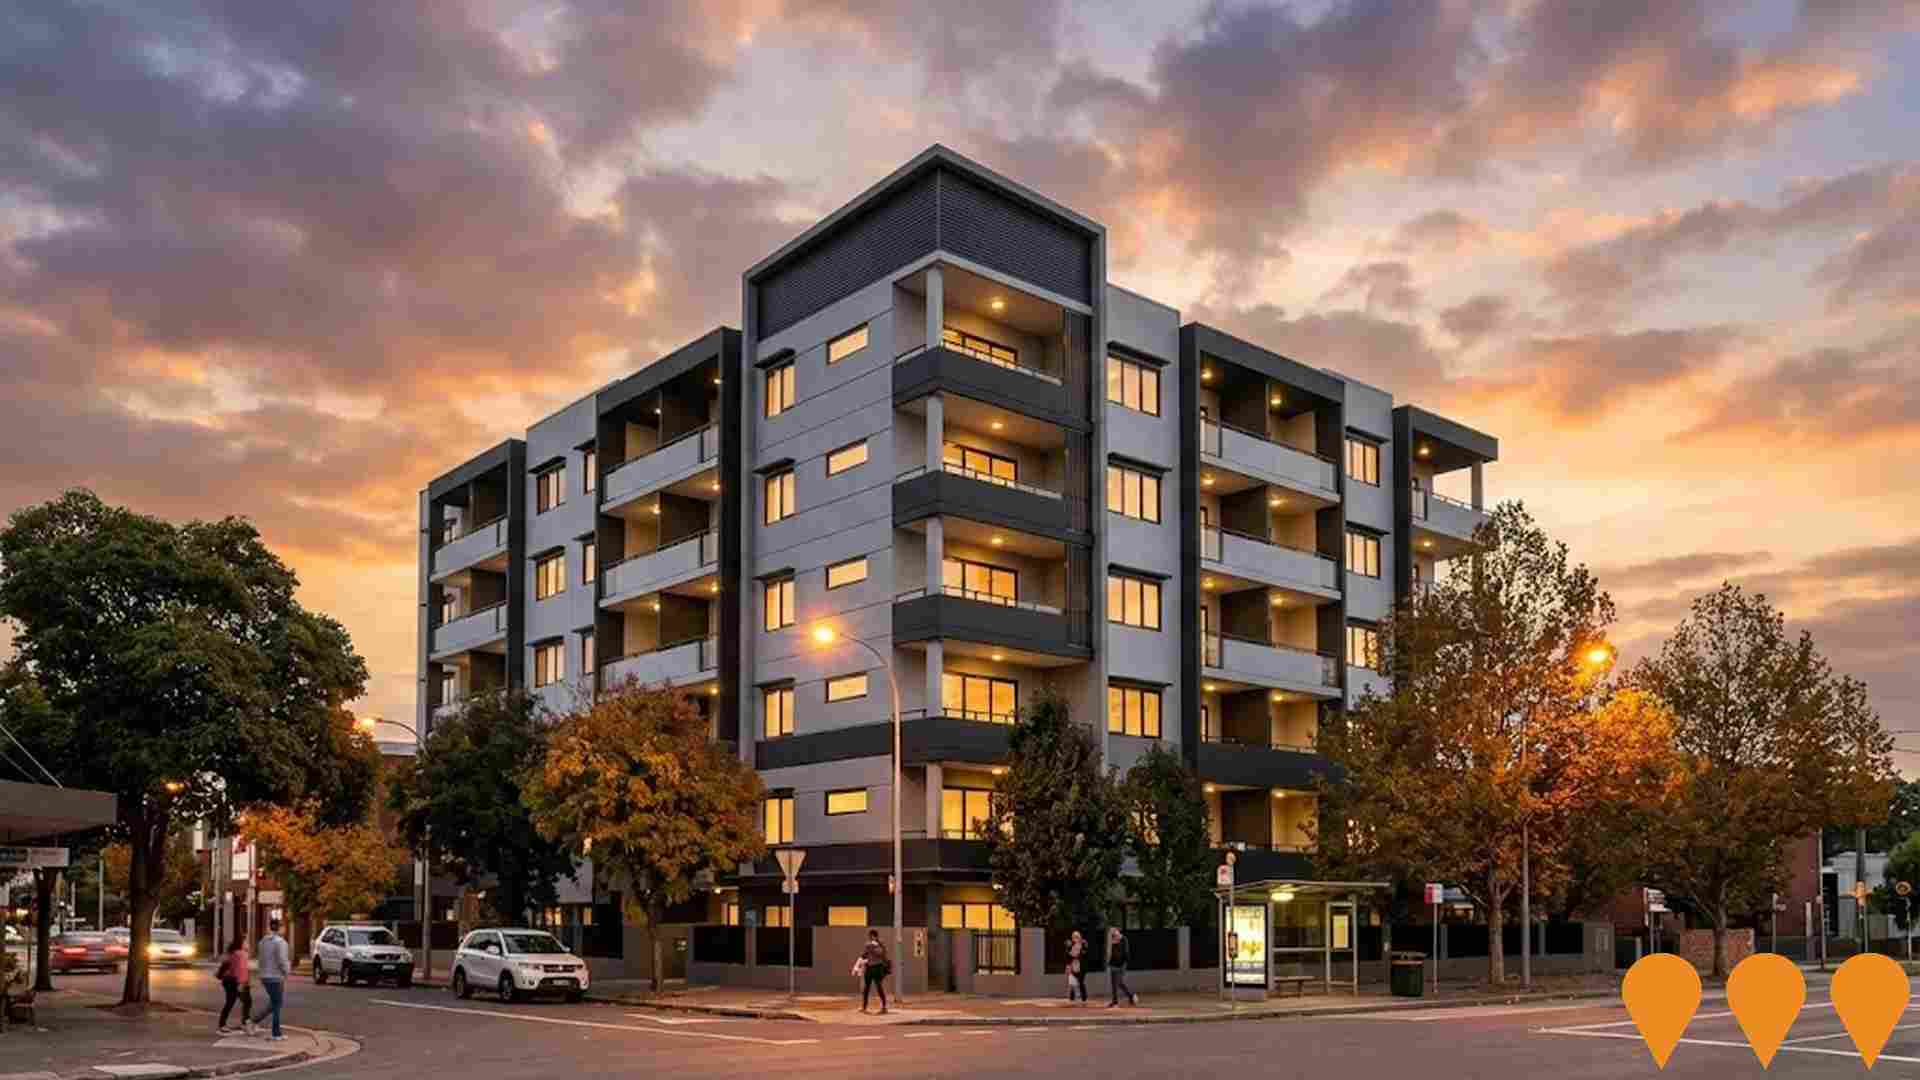
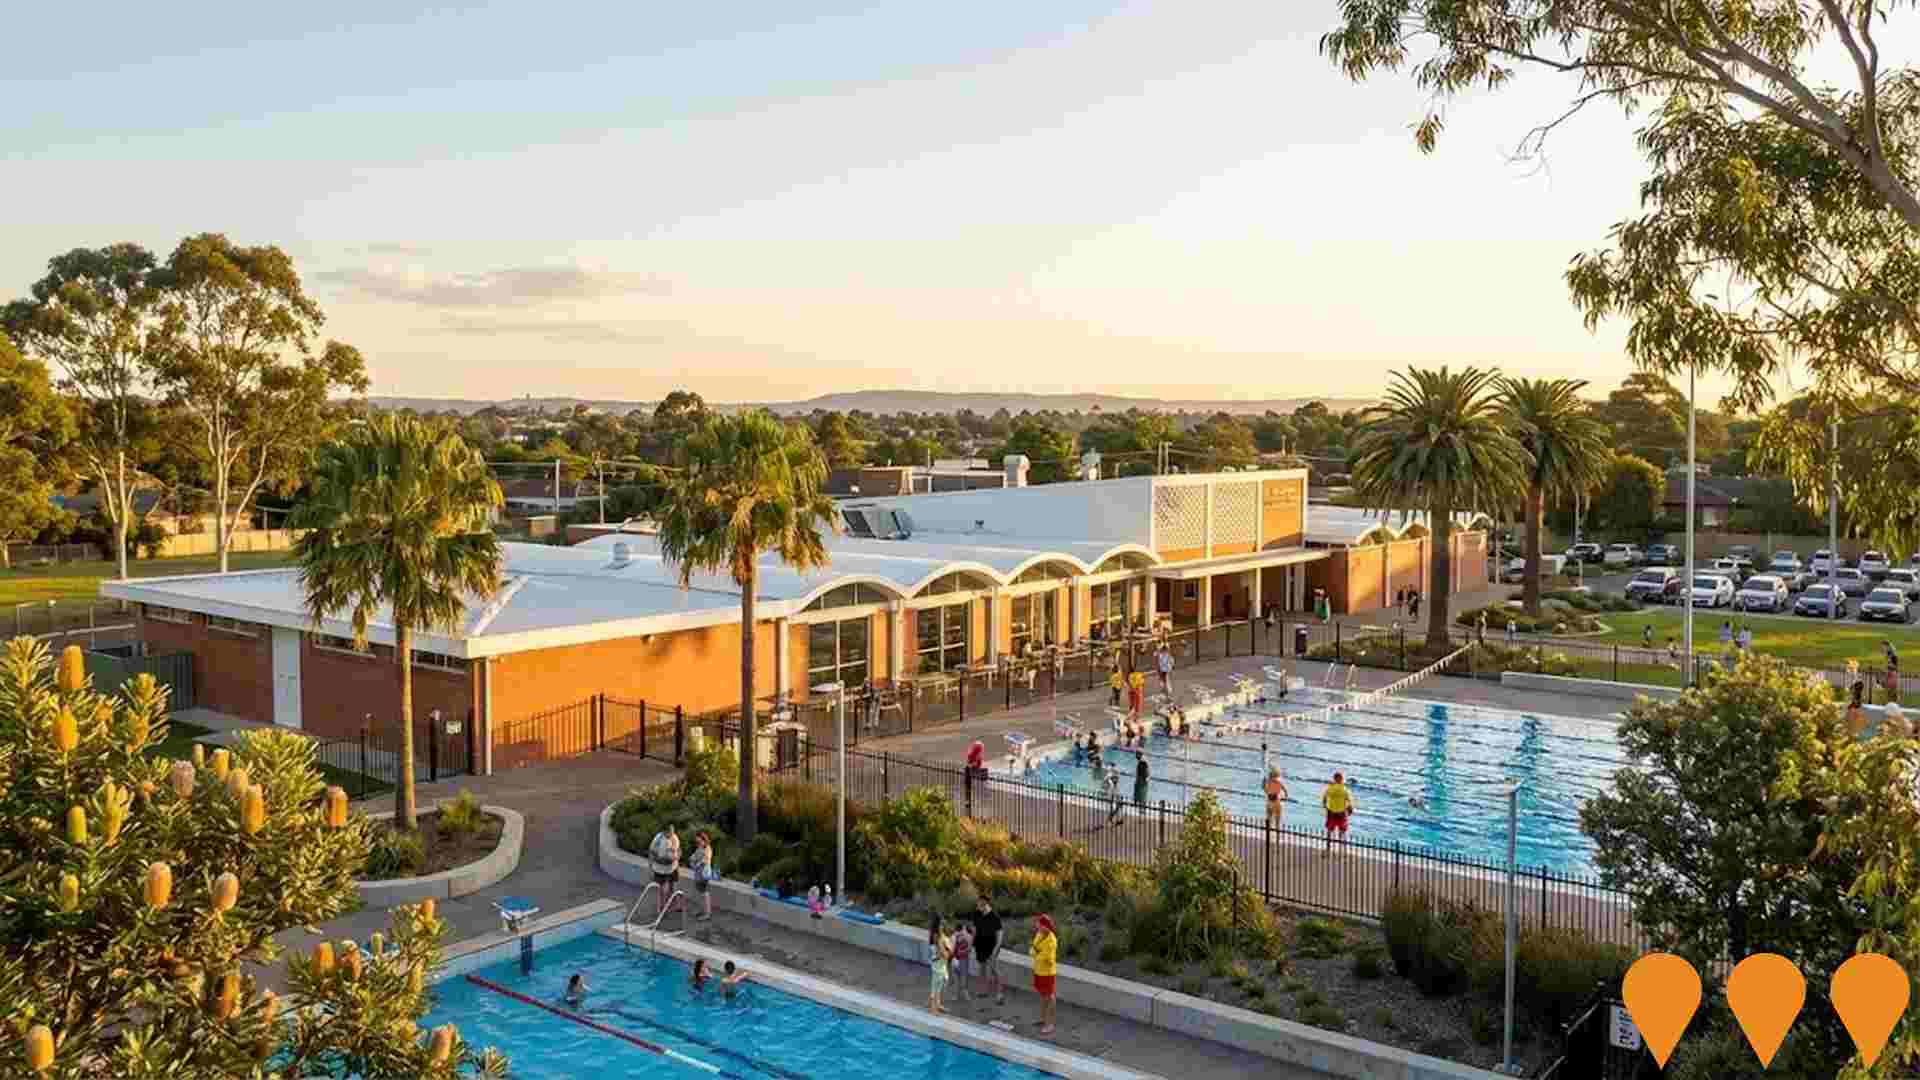
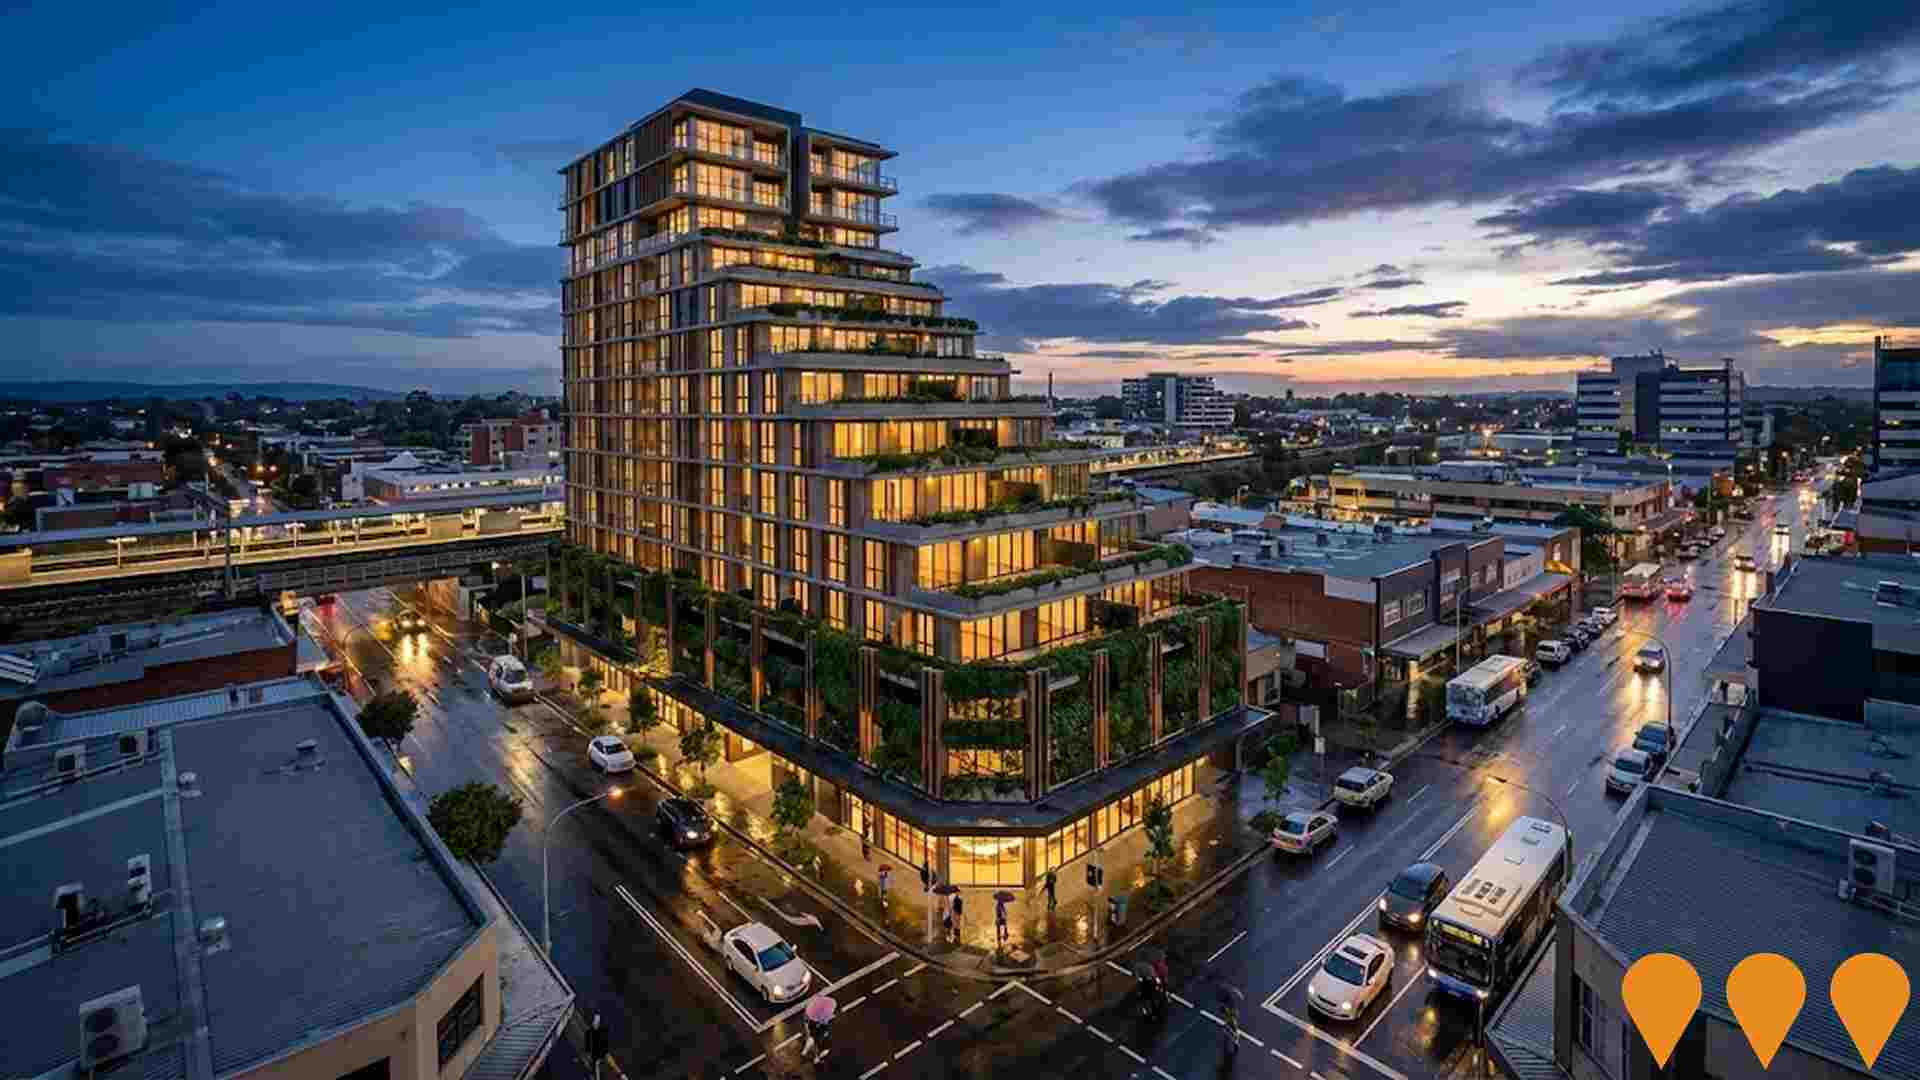
 Denotes AI-based impression for illustrative purposes only, not to be taken as definitive under any circumstances. Please follow links and conduct other investigations from the project's source for actual imagery. Developers and project owners wishing us to use original imagery please Contact Us and we will do so.
Frequently Asked Questions - Infrastructure
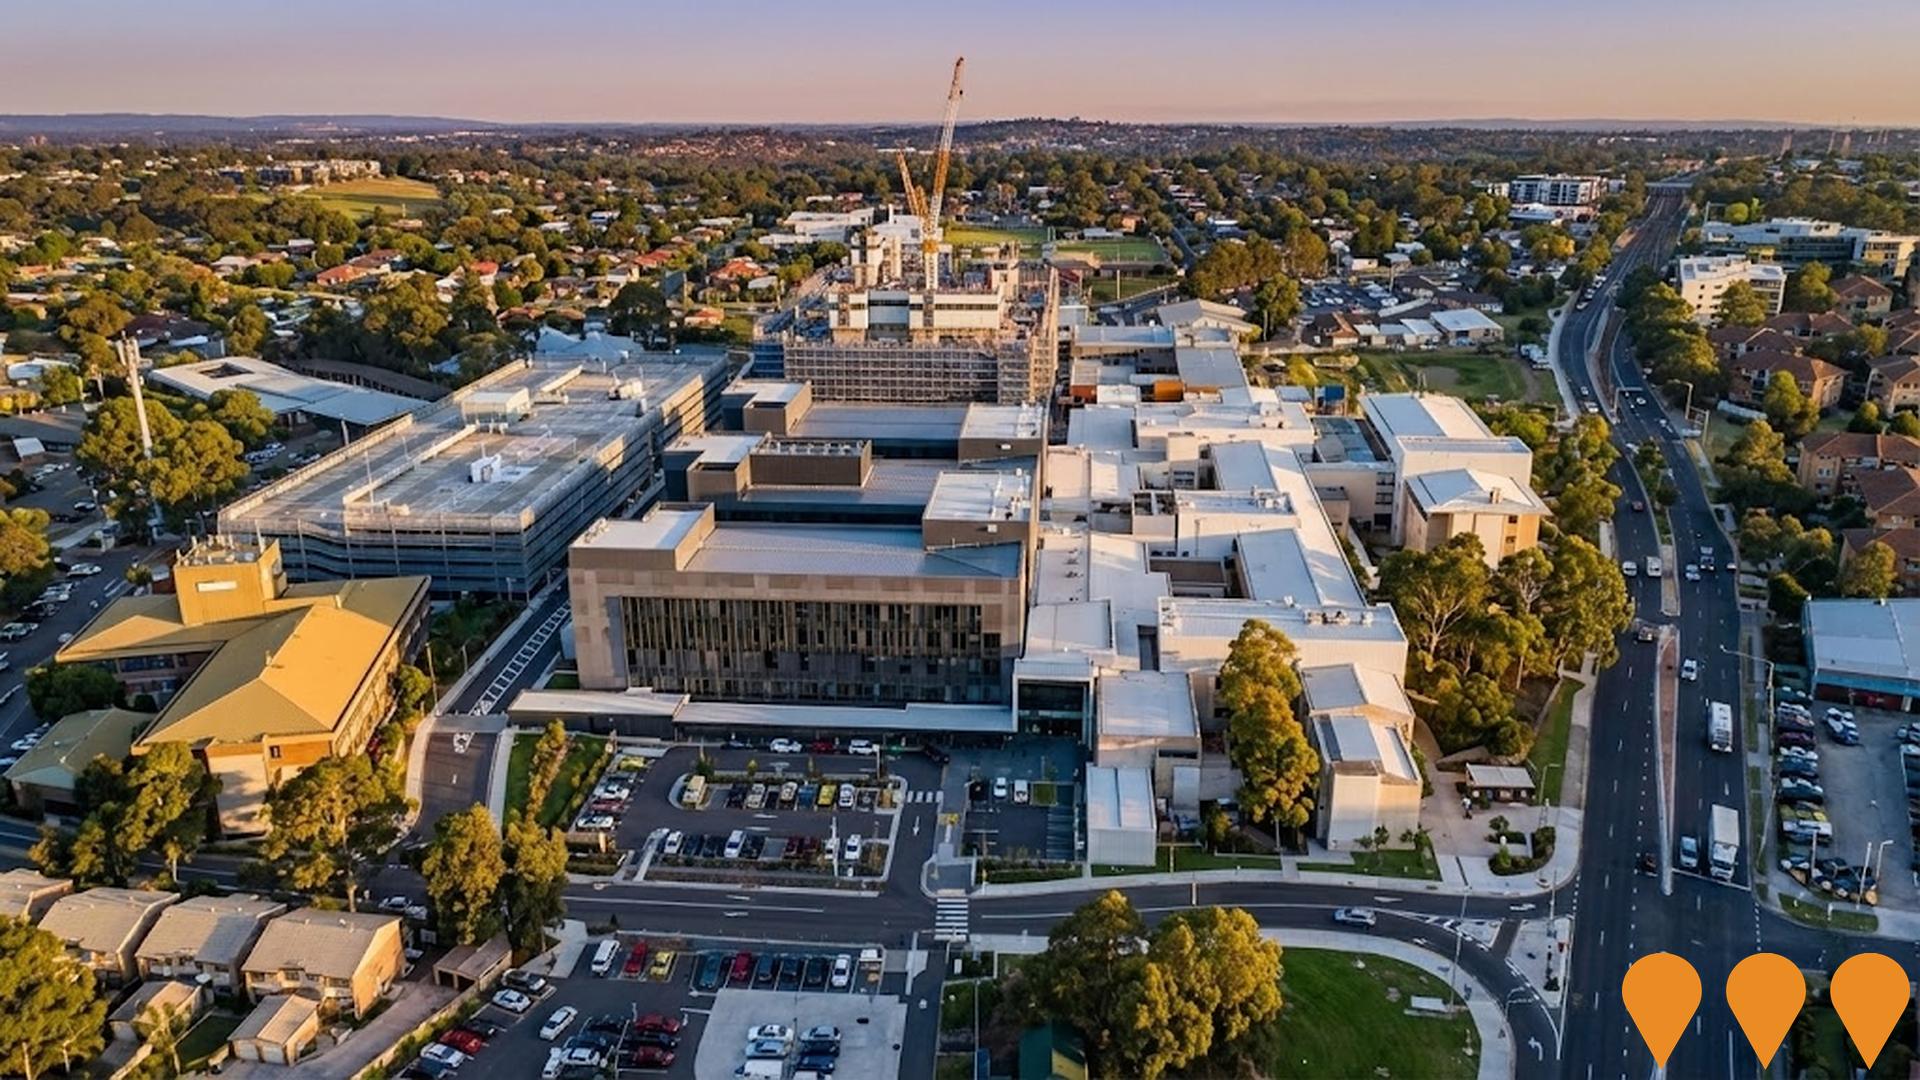
Blacktown and Mount Druitt Hospitals Stage 2 Expansion
NSW Government $120 million Stage 2 expansion delivering 60 additional inpatient beds (30 at Blacktown Hospital and 30 at Mount Druitt Hospital), expanded clinical and non-clinical support spaces, new ambulatory care and outpatient areas, and improved emergency department capacity to meet growing demand in Western Sydney.
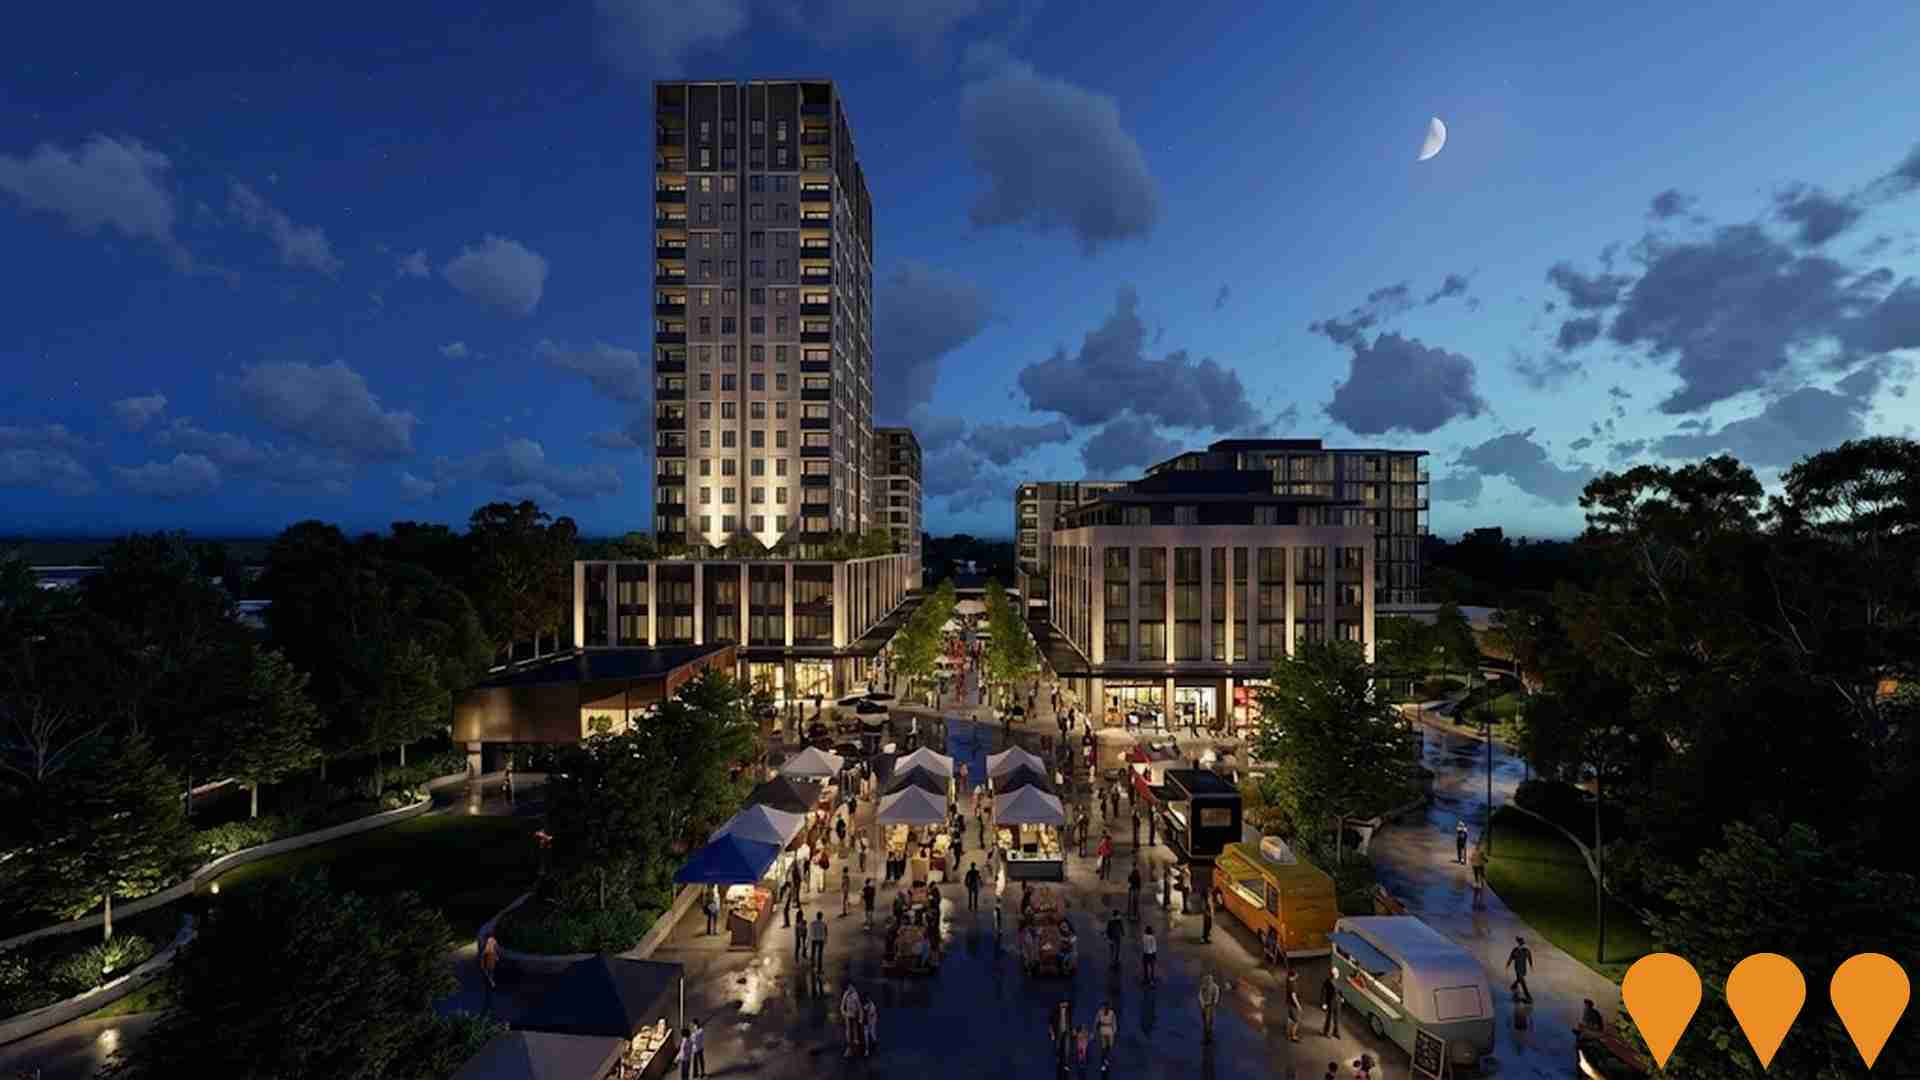
Blacktown Quarter
Walker Corporation's $2+ billion mixed-use urban renewal precinct in Blacktown CBD. Features premium commercial offices, a new private hospital (Blacktown Private Hospital), education and health research facilities, retail and dining precincts, and Sydney's largest new public domain. The masterplan delivers significant civic upgrades, improved connectivity to Blacktown Station, and over 5 hectares of new open space.
Blacktown and Mount Druitt Hospitals Expansion Stage 2
Stage 2 expansion and redevelopment of Blacktown and Mount Druitt Hospitals delivering a new clinical services building at Blacktown Hospital with approximately 200 additional inpatient beds, expanded emergency department, new operating theatres, interventional suites, medical imaging, ambulatory care, and paediatric services. Mount Druitt Hospital receives satellite upgrades including expanded cancer and renal services. Part of a $1.1 billion total investment across both stages (Stage 1 completed 2022).

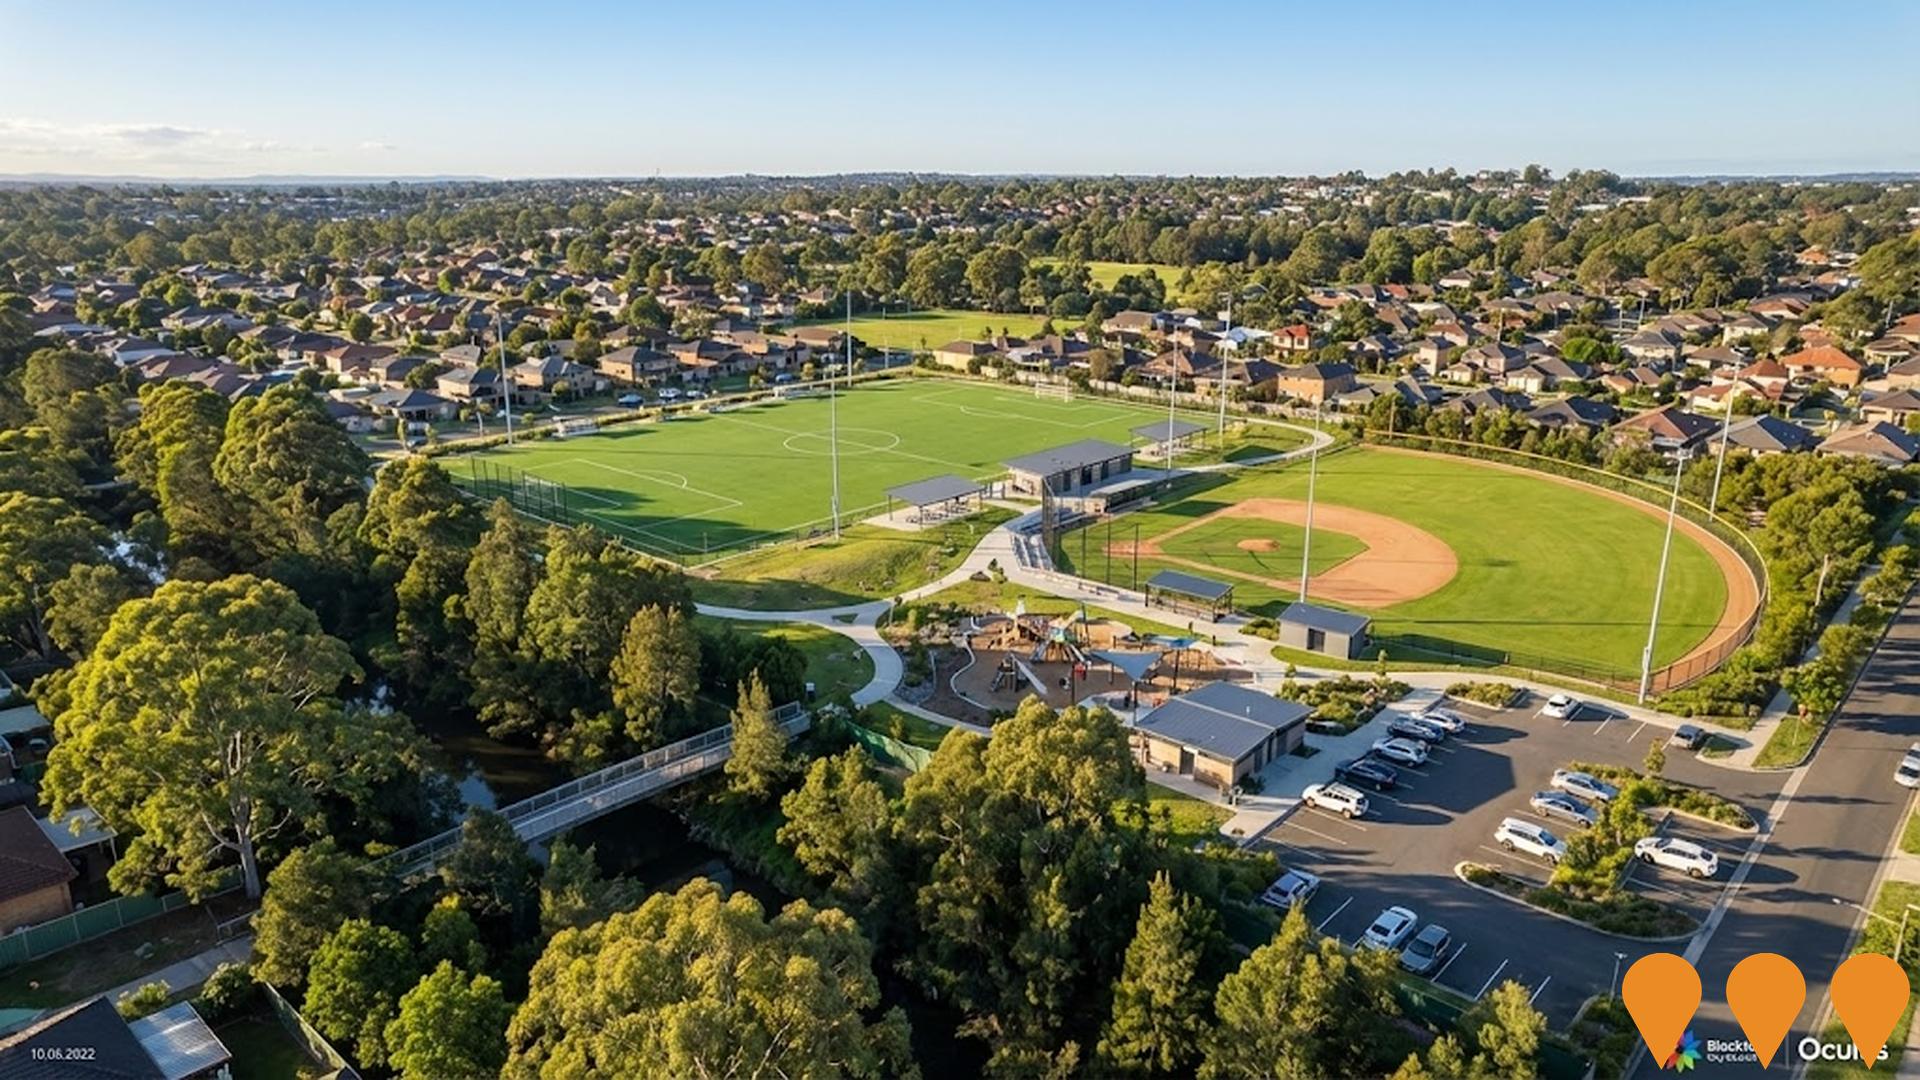
Blacktown City Council WestInvest Program
Blacktown City Council is delivering a $150 million portfolio of community infrastructure projects funded through the NSW Government's WestInvest program. Projects include new and upgraded sports facilities, parks, community centres, libraries, aquatic facilities, cycleways and road upgrades across the entire Blacktown Local Government Area to meet the needs of one of Australia's fastest-growing communities.
Richmond Road Upgrade M7 to Townson Road
Major road upgrade widening 2.2km of Richmond Road to six lanes with new flyover bridge, improving traffic flow for 89,000 daily vehicles.

Warrick Lane Precinct Redevelopment
Completed $76.5 million redevelopment of the Warrick Lane precinct featuring a 482-space four-level underground car park, public plazas, two tree-lined parks, children's play equipment, street furniture, commercial buildings, and Indigenous artworks. The project has transformed Blacktown CBD into a modern metropolitan center with enhanced community amenities and cultural connections to the traditional Darug lands.

Woodcroft Neighbourhood Centre Renewal
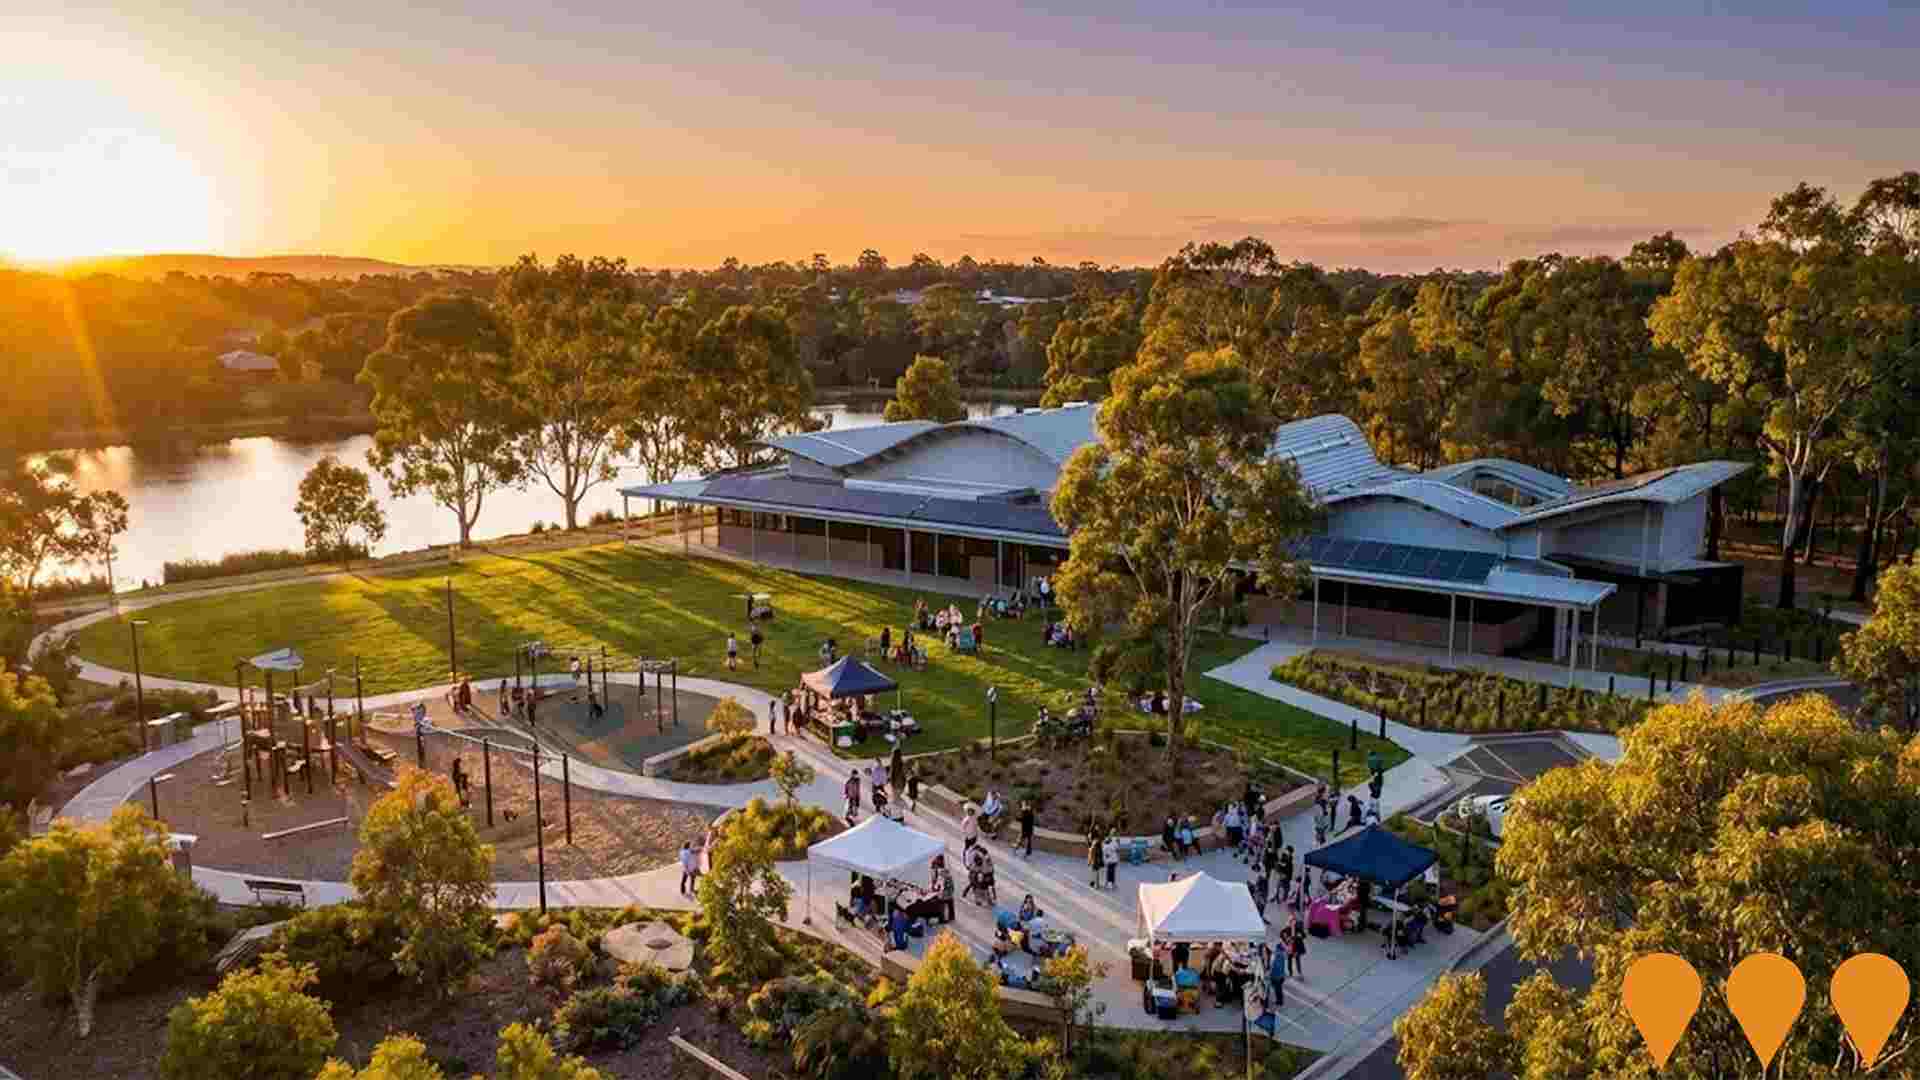
Major upgrade and expansion of the existing Woodcroft Neighbourhood Centre including a new community hall, library expansion, youth space, and improved public domain with new playground and landscaping.
LOGOS Eastern Creek Logistics Estate
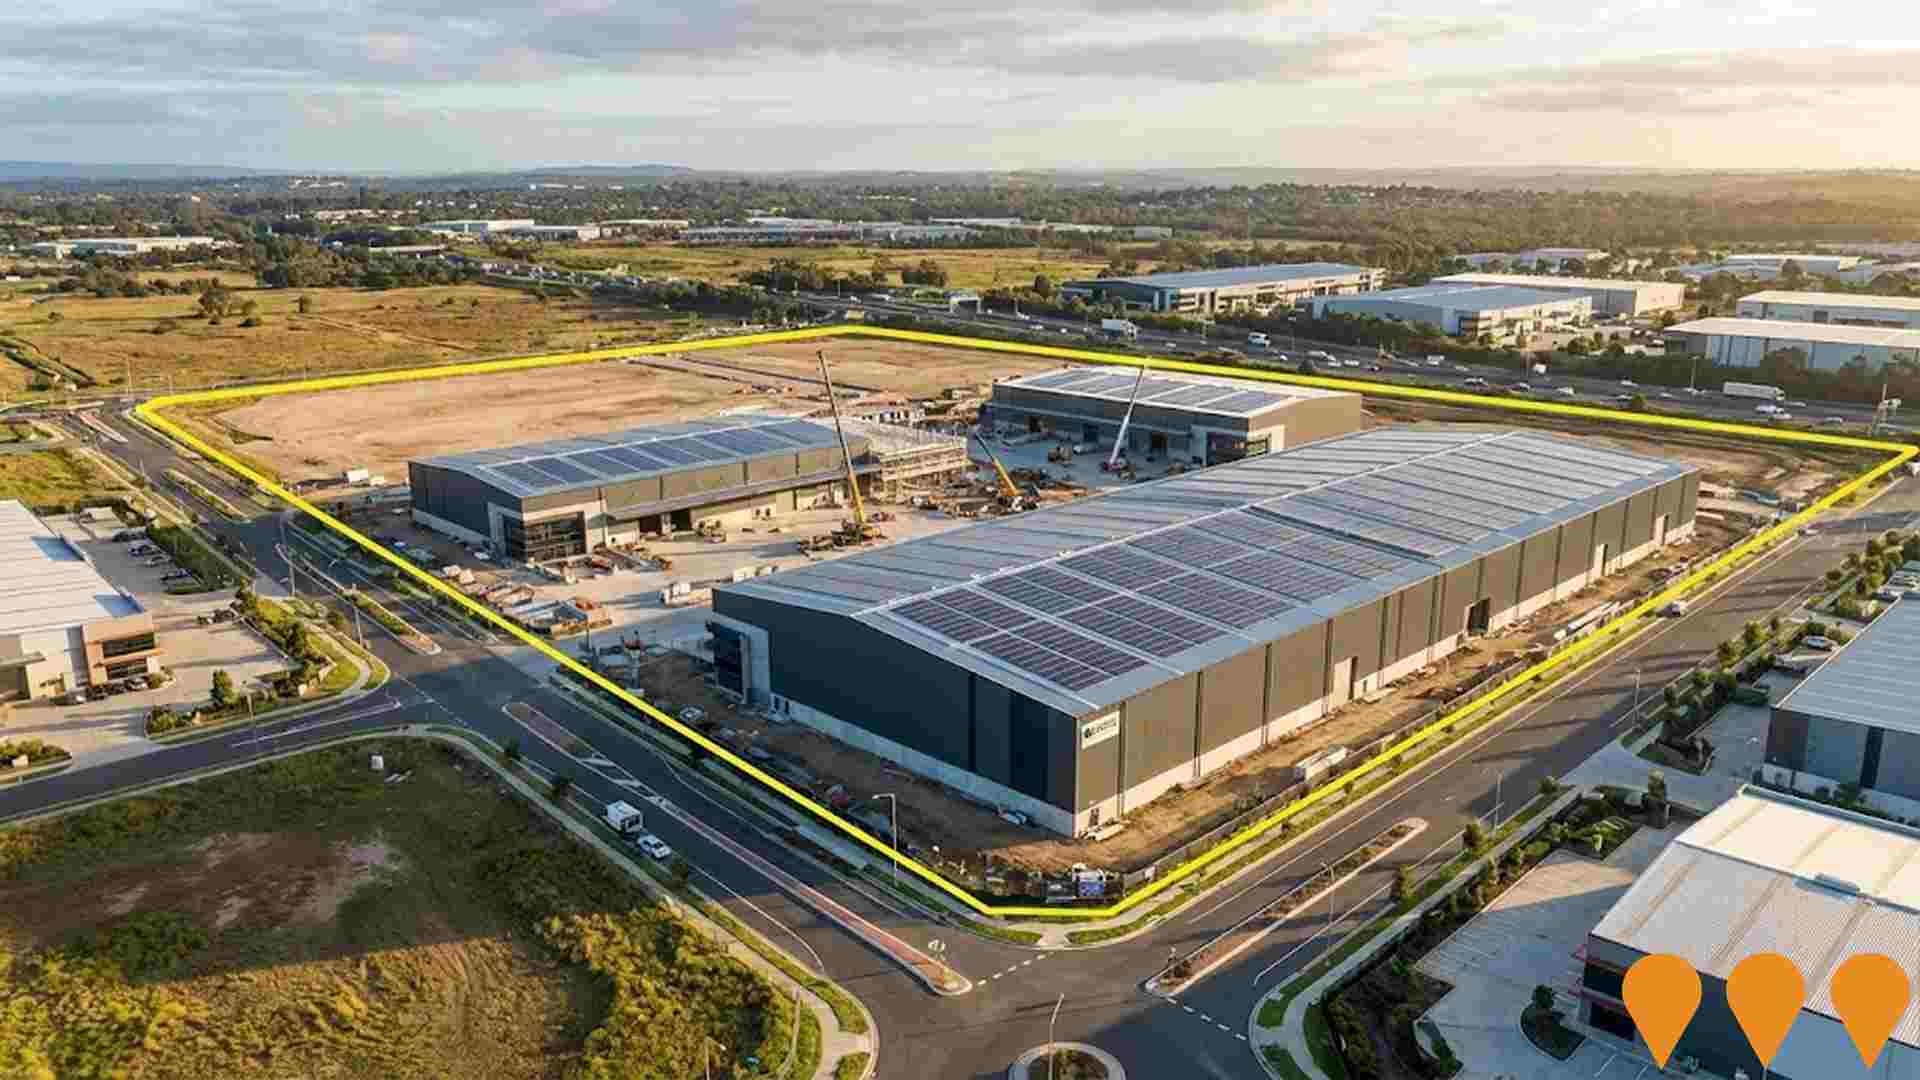
A 26.7 hectare multi-tenant logistics estate on Archbold Road in Eastern Creek, delivering more than 95,000 sqm of modern warehouse and distribution space with strong access to the M4 and M7. The project has progressed with Lot 3 detailed design approval and construction works underway on initial tenancies, aligning with the developer's ESG targets.
Employment
Employment conditions in Blacktown - West remain below the national average according to AreaSearch analysis
Blacktown - West has an unemployment rate of 5.1% as of September 2025, with estimated employment growth of 4.6% over the past year. There are 9,566 residents in work, and the unemployment rate is 0.9% higher than Greater Sydney's rate of 4.2%.
Workforce participation stands at 56.1%, below Greater Sydney's 60.0%. Major employment sectors include health care & social assistance, transport, postal & warehousing, and retail trade. The area shows strong specialization in transport, postal & warehousing (2.1 times the regional level), but lower representation in professional & technical services (6.0% vs regional average of 11.5%). Employment increased by 4.6% over the year to September 2025, while labour force grew by 4.3%, reducing the unemployment rate by 0.3 percentage points.
In comparison, Greater Sydney recorded employment growth of 2.1%. State-level data from 25-Nov shows NSW employment contracted by 0.03% with an unemployment rate of 3.9%. National employment forecasts from May-25 project a 6.6% increase over five years and 13.7% over ten years, but local growth patterns may differ based on industry-specific projections applied to Blacktown - West's employment mix.
Frequently Asked Questions - Employment
Income
Income levels align closely with national averages, indicating typical economic conditions for Australian communities according to AreaSearch analysis
Blacktown-West SA2 had a median taxpayer income of $49,856 and an average of $57,054 in the financial year 2022, according to postcode level ATO data aggregated by AreaSearch. This is lower than national averages, with Greater Sydney's median being $56,994 and average at $80,856. By September 2025, estimates suggest a median income of approximately $56,143 and an average of $64,249, based on Wage Price Index growth of 12.61% since financial year 2022. Household income ranks at the 56th percentile ($1,857 weekly), with personal income at the 38th percentile. The $1,500 - 2,999 earnings band includes 38.8% of the community (6,996 individuals). Housing costs consume 17.8% of income, but disposable income ranks at the 55th percentile. The area's SEIFA income ranking places it in the 4th decile.
Frequently Asked Questions - Income
Housing
Blacktown - West is characterized by a predominantly suburban housing profile, with above-average rates of outright home ownership
Blacktown-West's dwelling structure, as per the latest Census, consisted of 77.6% houses and 22.4% other dwellings (semi-detached, apartments, 'other' dwellings). This compares to Sydney metropolitan areas having 76.8% houses and 23.3% other dwellings. Home ownership in Blacktown-West was at 25.9%, similar to the Sydney metro level. Mortgaged dwellings accounted for 35.7% and rented dwellings made up 38.4%. The median monthly mortgage repayment in Blacktown-West was $2,100, lower than the Sydney metro average of $2,167. The median weekly rent figure was $410, compared to $400 for Sydney metro. Nationally, Blacktown-West's median monthly mortgage repayments were higher at $2,100 against the Australian average of $1,863, while median weekly rents were also higher at $410 compared to the national figure of $375.
Frequently Asked Questions - Housing
Household Composition
Blacktown - West features high concentrations of group households and family households, with a higher-than-average median household size
Family households account for 77.7% of all households, including 41.2% that are couples with children, 21.8% that are couples without children, and 12.8% that are single parent families. Non-family households make up the remaining 22.3%, with lone person households at 18.1% and group households comprising 4.3% of the total. The median household size is 3.0 people, which is larger than the Greater Sydney average of 2.9.
Frequently Asked Questions - Households
Local Schools & Education
Educational attainment in Blacktown - West aligns closely with national averages, showing typical qualification patterns and performance metrics
In Blacktown, as of the latest data available, 29.9% of residents aged 15 and above hold university degrees, compared to Greater Sydney's 38.0%. This indicates potential for educational development. Bachelor degrees are most common at 20.0%, followed by postgraduate qualifications (8.5%) and graduate diplomas (1.4%). Vocational credentials are also prevalent, with 29.5% of residents aged 15 and above holding such qualifications - advanced diplomas being 10.9% and certificates 18.6%.
Educational participation is high, with 32.2% currently enrolled in formal education. This includes 9.6% in primary education, 7.6% in secondary education, and 6.4% pursuing tertiary education.
Frequently Asked Questions - Education
Schools Detail
Nearby Services & Amenities
Transport
Transport servicing is moderate compared to other areas nationally based on assessment of service frequency, route connectivity and accessibility
Blacktown - West has 90 active public transport stops operating, serving a mix of bus routes. These stops are serviced by 28 individual routes, collectively providing 1,729 weekly passenger trips. Transport accessibility is rated excellent, with residents typically located 144 meters from the nearest stop.
Service frequency averages 247 trips per day across all routes, equating to approximately 19 weekly trips per stop.
Frequently Asked Questions - Transport
Transport Stops Detail
Health
The level of general health in Blacktown - West is notably higher than the national average with prevalence of common health conditions low among the general population though higher than the nation's average across older, at risk cohorts
Blacktown West shows better health outcomes than average, with lower prevalence of common conditions in its general population compared to national figures. However, it has higher rates among older, at-risk cohorts.
Private health cover is low, at approximately 48% (around 8,709 people), compared to the national average of 55.3%. The most prevalent medical conditions are arthritis and diabetes, affecting 6.6% and 6.2% of residents respectively. Around 73.4% of residents report no medical ailments, similar to Greater Sydney's 73.6%. The area has a higher proportion of seniors aged 65 and over, at 14.6%, or approximately 2,630 people. Health outcomes among seniors require more attention than those in the broader population.
Frequently Asked Questions - Health
Cultural Diversity
Blacktown - West is among the most culturally diverse areas in the country based on AreaSearch assessment of a range of language and cultural background related metrics
Blacktown-West has a culturally diverse population, with 50.0% born overseas and 53.9% speaking languages other than English at home. Christianity is the predominant religion, accounting for 51.3%. The 'Other' category comprises 7.6%, higher than Greater Sydney's 6.6%.
Ancestry-wise, top groups are Other (24.7%), Australian (15.1%), and English (13.7%). Filipino representation is notably high at 7.1% compared to the regional average of 6.4%. Indian representation stands at 10.2%, slightly below the regional figure of 10.8%. Maltese representation is 2.1%, marginally higher than Greater Sydney's 1.9%.
Frequently Asked Questions - Diversity
Age
Blacktown - West's population is younger than the national pattern
Blacktown - West has a median age of 35 years, which is slightly younger than Greater Sydney's 37 years and somewhat younger than the national average of 38 years. The 0-4 age group comprises 6.8%, compared to Greater Sydney. The 35-44 cohort stands at 14.4%. Between 2021 and present, the 65-74 age group has increased from 6.9% to 7.6%. By 2041, significant demographic shifts are forecasted for Blacktown - West. The 75-84 age cohort is projected to rise by 580 people (70%), from 827 to 1,408. Notably, the combined 65+ age groups will account for 52% of total population growth, reflecting the area's aging demographic trend. Conversely, both 0-4 and 35-44 age groups are projected to decrease in number.
