Chart Color Schemes
This analysis uses ABS Statistical Areas Level 2 (SA2) boundaries, which can materially differ from Suburbs and Localities (SAL) even when sharing similar names.
SA2 boundaries are defined by the Australian Bureau of Statistics and are designed to represent communities for statistical reporting (e.g., census and ERP).
Suburbs and Localities (SAL) represent commonly-used suburb/locality names (postal-style areas) and may use different geographic boundaries. For comprehensive analysis, consider reviewing both boundary types if available.
est. as @ -- *
ABS ERP | -- people | --
2021 Census | -- people
Sales Activity
Curious about local property values? Filter the chart to assess the volume and appreciation (including resales) trends and regional comparisons, or scroll to the map below view this information at an individual property level.
Find a Recent Sale
Sales Detail
Population
Derby - West Kimberley has shown very soft population growth performance across periods assessed by AreaSearch
Derby-West Kimberley's population was around 8,524 as of November 2025. This showed an increase of 1,479 people, a rise of 21.0%, since the 2021 Census which reported a population of 7,045. The change was inferred from ABS's estimated resident population of 8,516 in June 2024 and three validated new addresses since the Census date. This resulted in a density ratio of 0.10 persons per square kilometer. Derby-West Kimberley's growth exceeded the national average of 8.9% during this period, making it a growth leader in the region. Natural growth contributed approximately 52.3% of overall population gains recently.
AreaSearch adopted ABS/Geoscience Australia projections for each SA2 area released in 2024 with a base year of 2022. For areas not covered and post-2032 estimations, AreaSearch used ABS's latest Greater Capital Region projections released in 2023 based on 2022 data. Future population projections indicate above median growth for regional areas nationally, with the area expected to increase by 1,105 persons to 2041, reflecting a gain of 12.9% over the 17 years.
Frequently Asked Questions - Population
Development
Residential development activity is lower than average in Derby - West Kimberley according to AreaSearch's national comparison of local real estate markets
Derby-West Kimberley averaged around 9 new dwelling approvals annually between FY21 and FY25, with a total of 48 homes approved during this period. No new dwellings have been approved in FY26 so far. On average, 4.8 new residents arrived per year for each dwelling constructed over the past five financial years.
This has led to significant demand exceeding supply, typically resulting in price growth and increased buyer competition. New dwellings are developed at an average cost of $685,000, indicating a focus on the premium market segment with higher-end properties. In FY26, there have been $9.9 million in commercial approvals, demonstrating moderate levels of commercial development. Compared to the rest of WA, Derby-West Kimberley has significantly less development activity, 60.0% below the regional average per person. This scarcity of new properties typically strengthens demand and prices for existing properties.
However, development activity has picked up in recent periods. The area also falls under the national average for development activity, suggesting its established nature and potential planning limitations. Recent building activity consists entirely of detached houses, preserving the area's low density nature. This focus on detached housing attracts space-seeking buyers. As of now, there are an estimated 652 people in the area per dwelling approval, reflecting its quiet, low activity development environment. According to the latest AreaSearch quarterly estimate, Derby-West Kimberley is projected to add 1,097 residents by 2041. At current development rates, housing supply may struggle to match population growth, potentially heightening buyer competition and supporting price increases.
Frequently Asked Questions - Development
Infrastructure
Derby - West Kimberley has emerging levels of nearby infrastructure activity, ranking in the 38thth percentile nationally
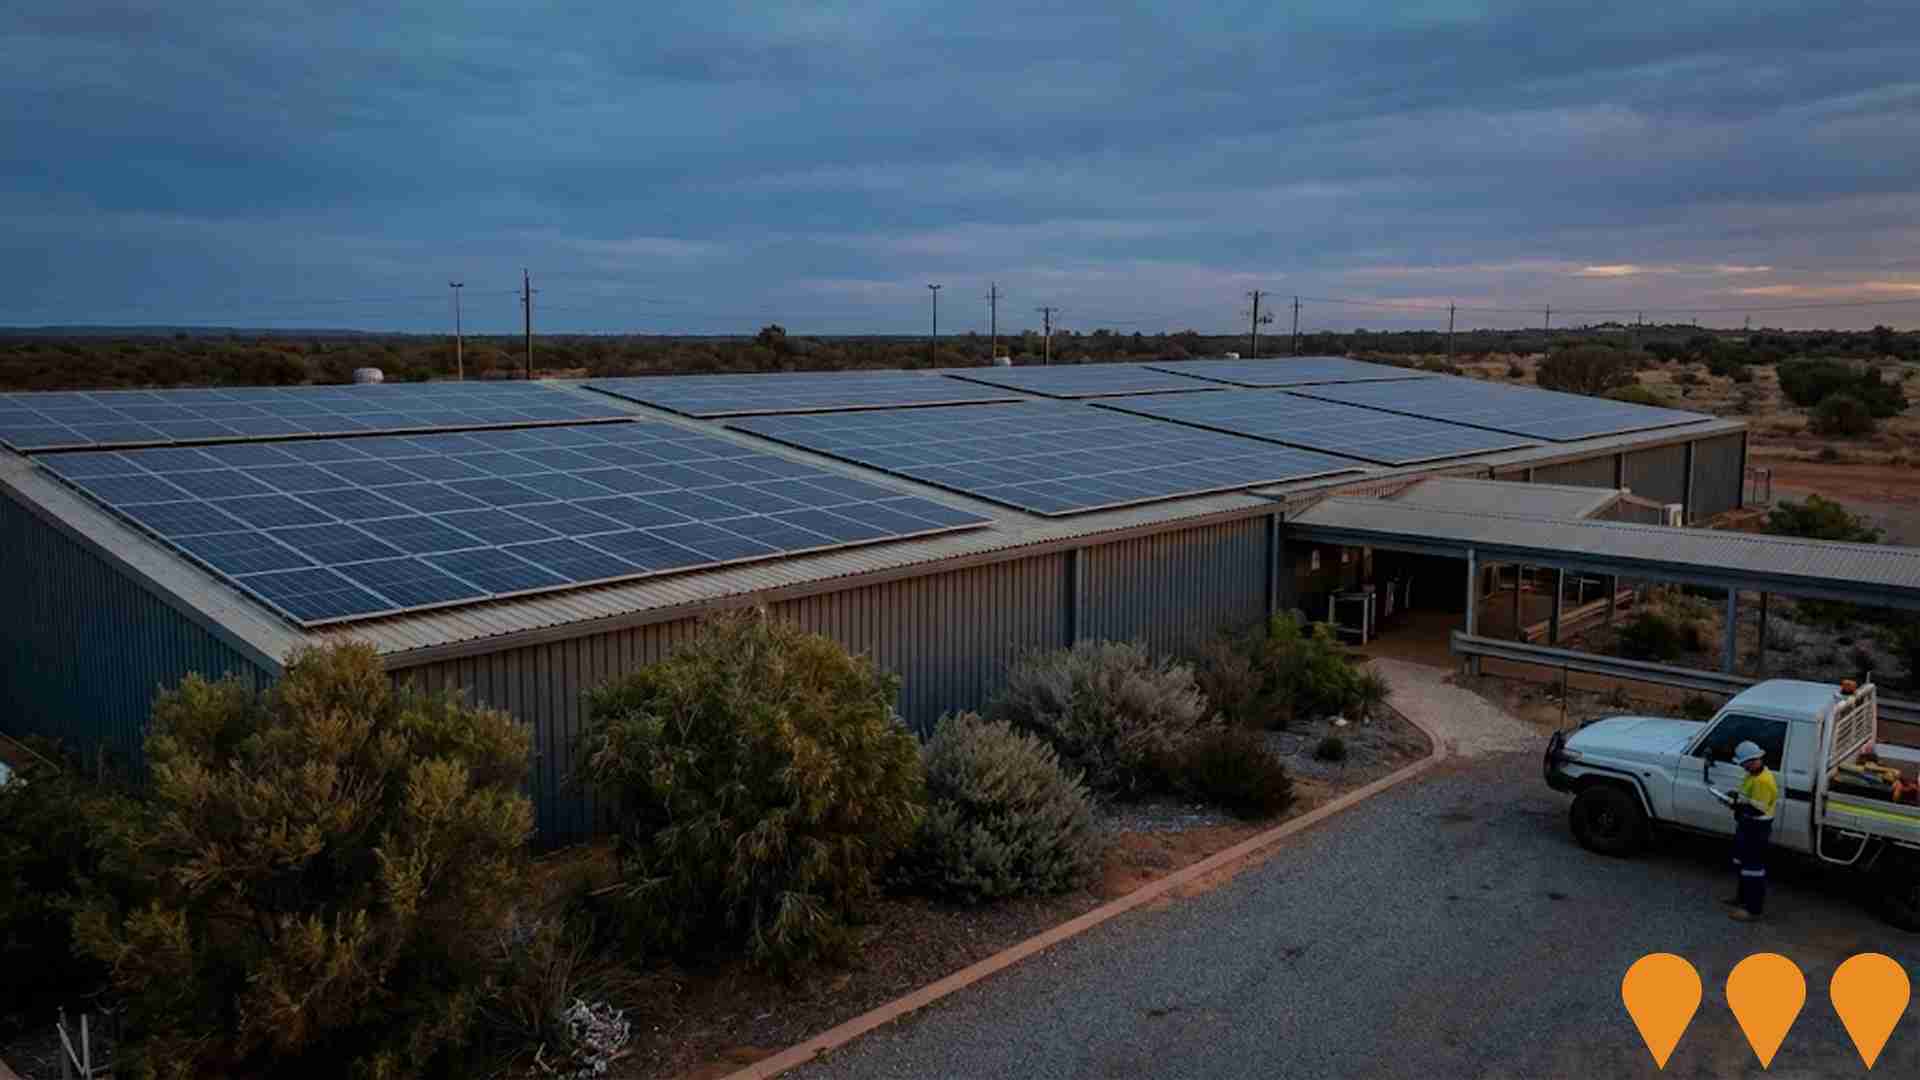
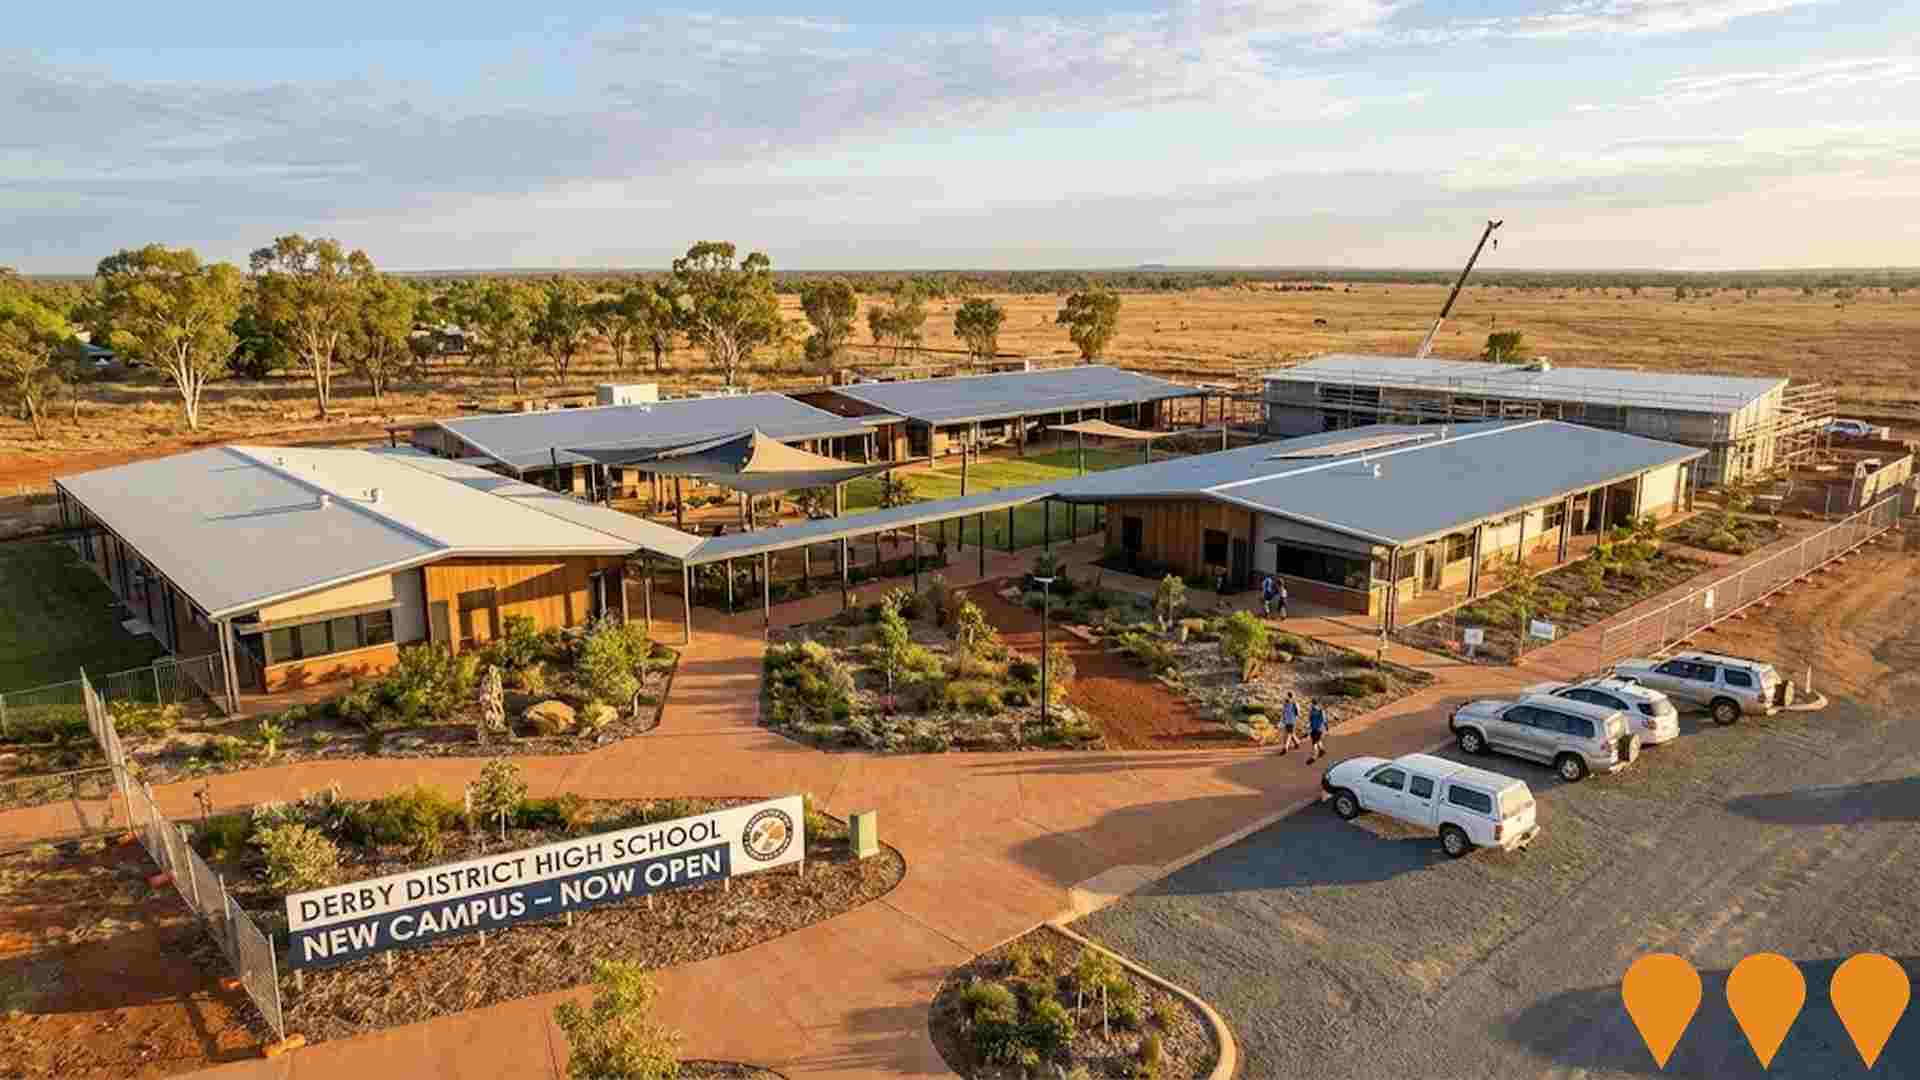
Changes to local infrastructure significantly influence an area's performance. AreaSearch has identified 14 projects likely to impact the area. Key projects include RAAF Curtin Redevelopment Project, Derby Light Industrial Estate, Derby Future Energy System, and Derby District High School Redevelopment. The following list details those most relevant:.
Professional plan users can use the search below to filter and access additional projects.
INFRASTRUCTURE SEARCH
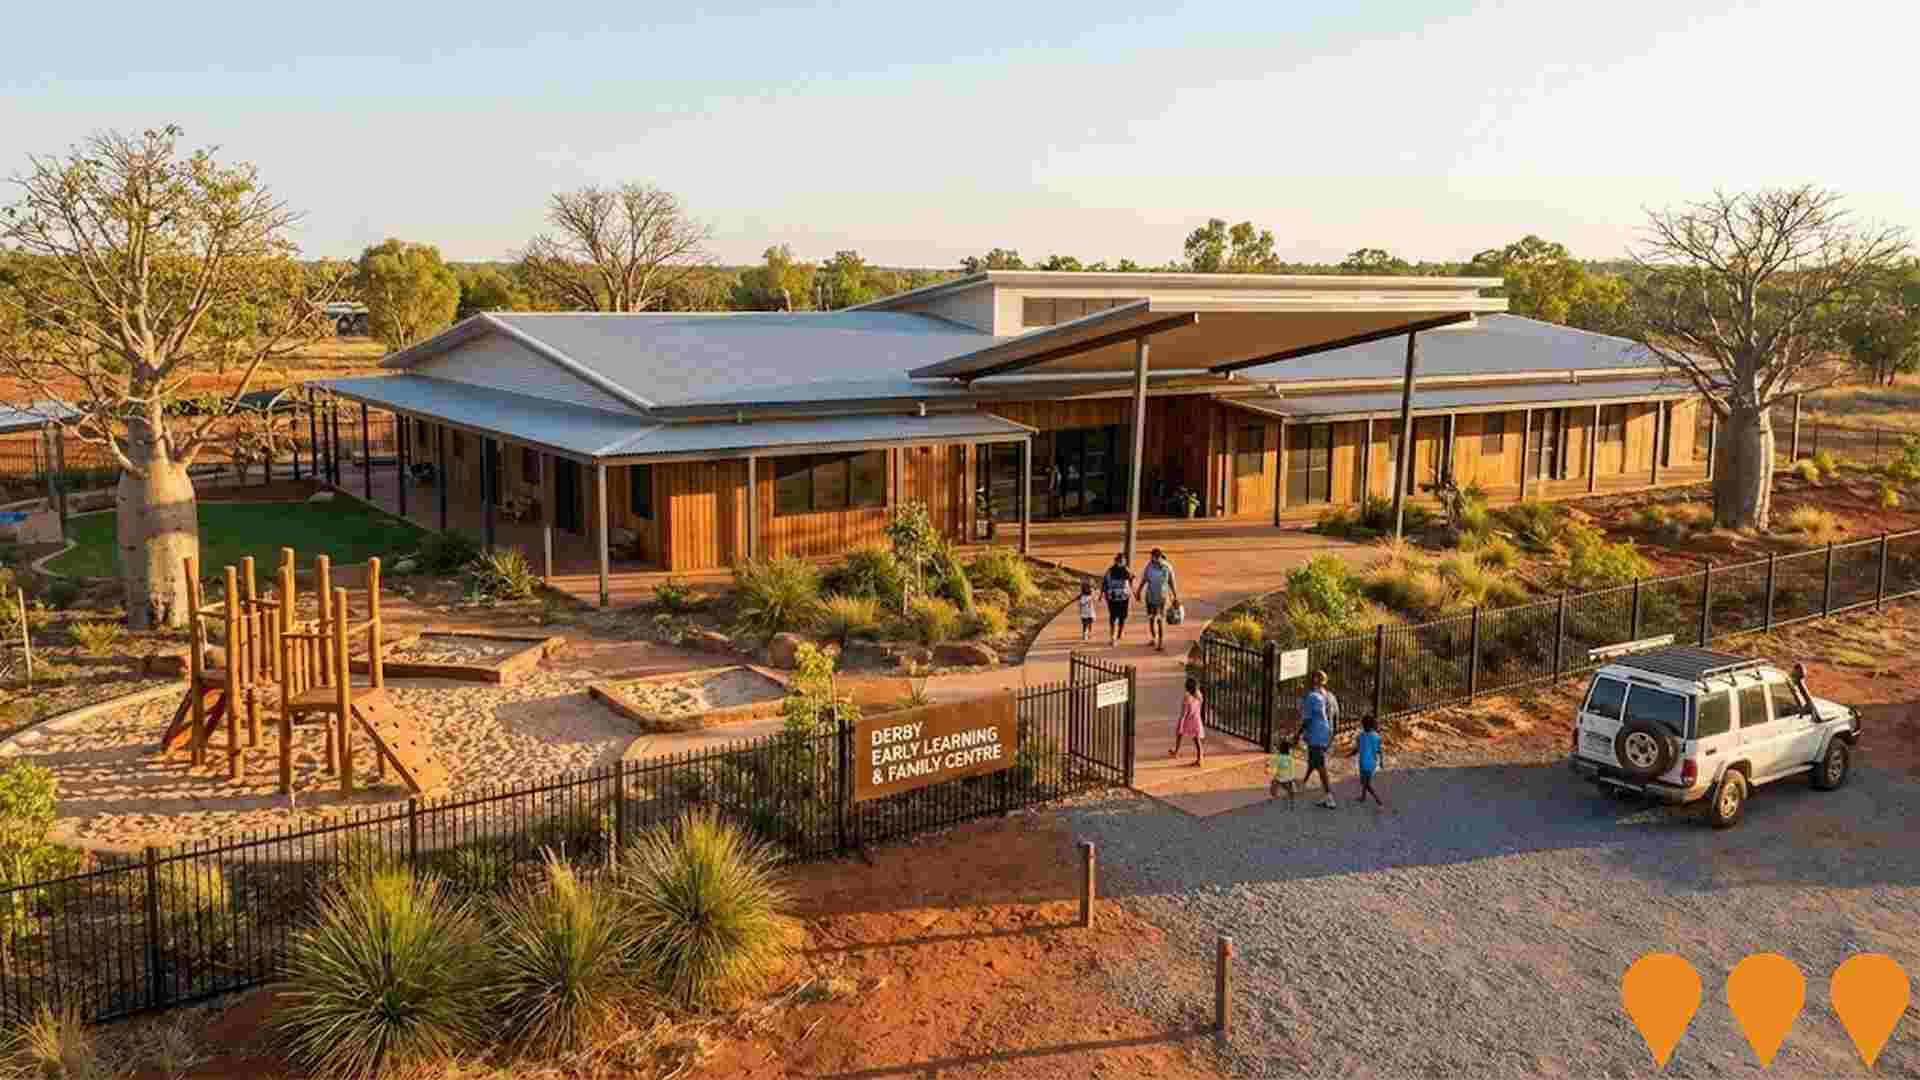
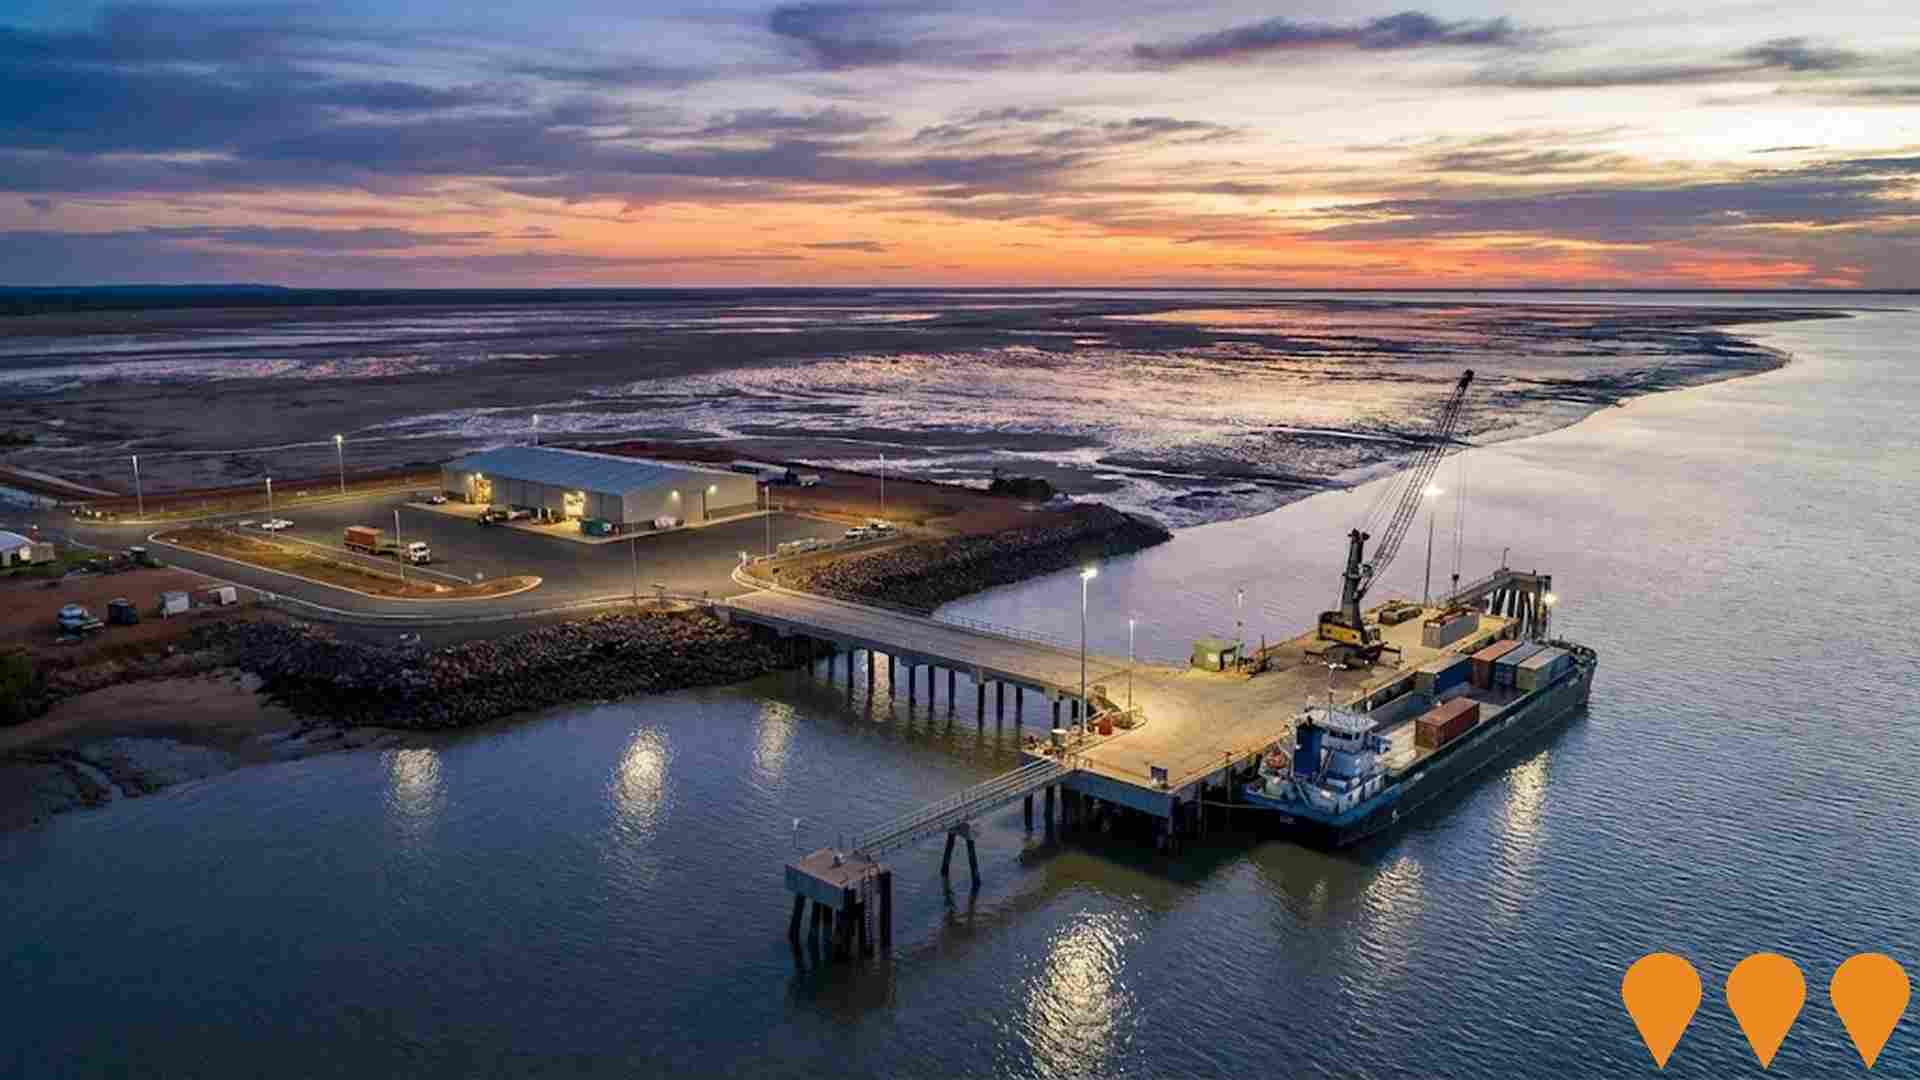
 Denotes AI-based impression for illustrative purposes only, not to be taken as definitive under any circumstances. Please follow links and conduct other investigations from the project's source for actual imagery. Developers and project owners wishing us to use original imagery please Contact Us and we will do so.
Frequently Asked Questions - Infrastructure
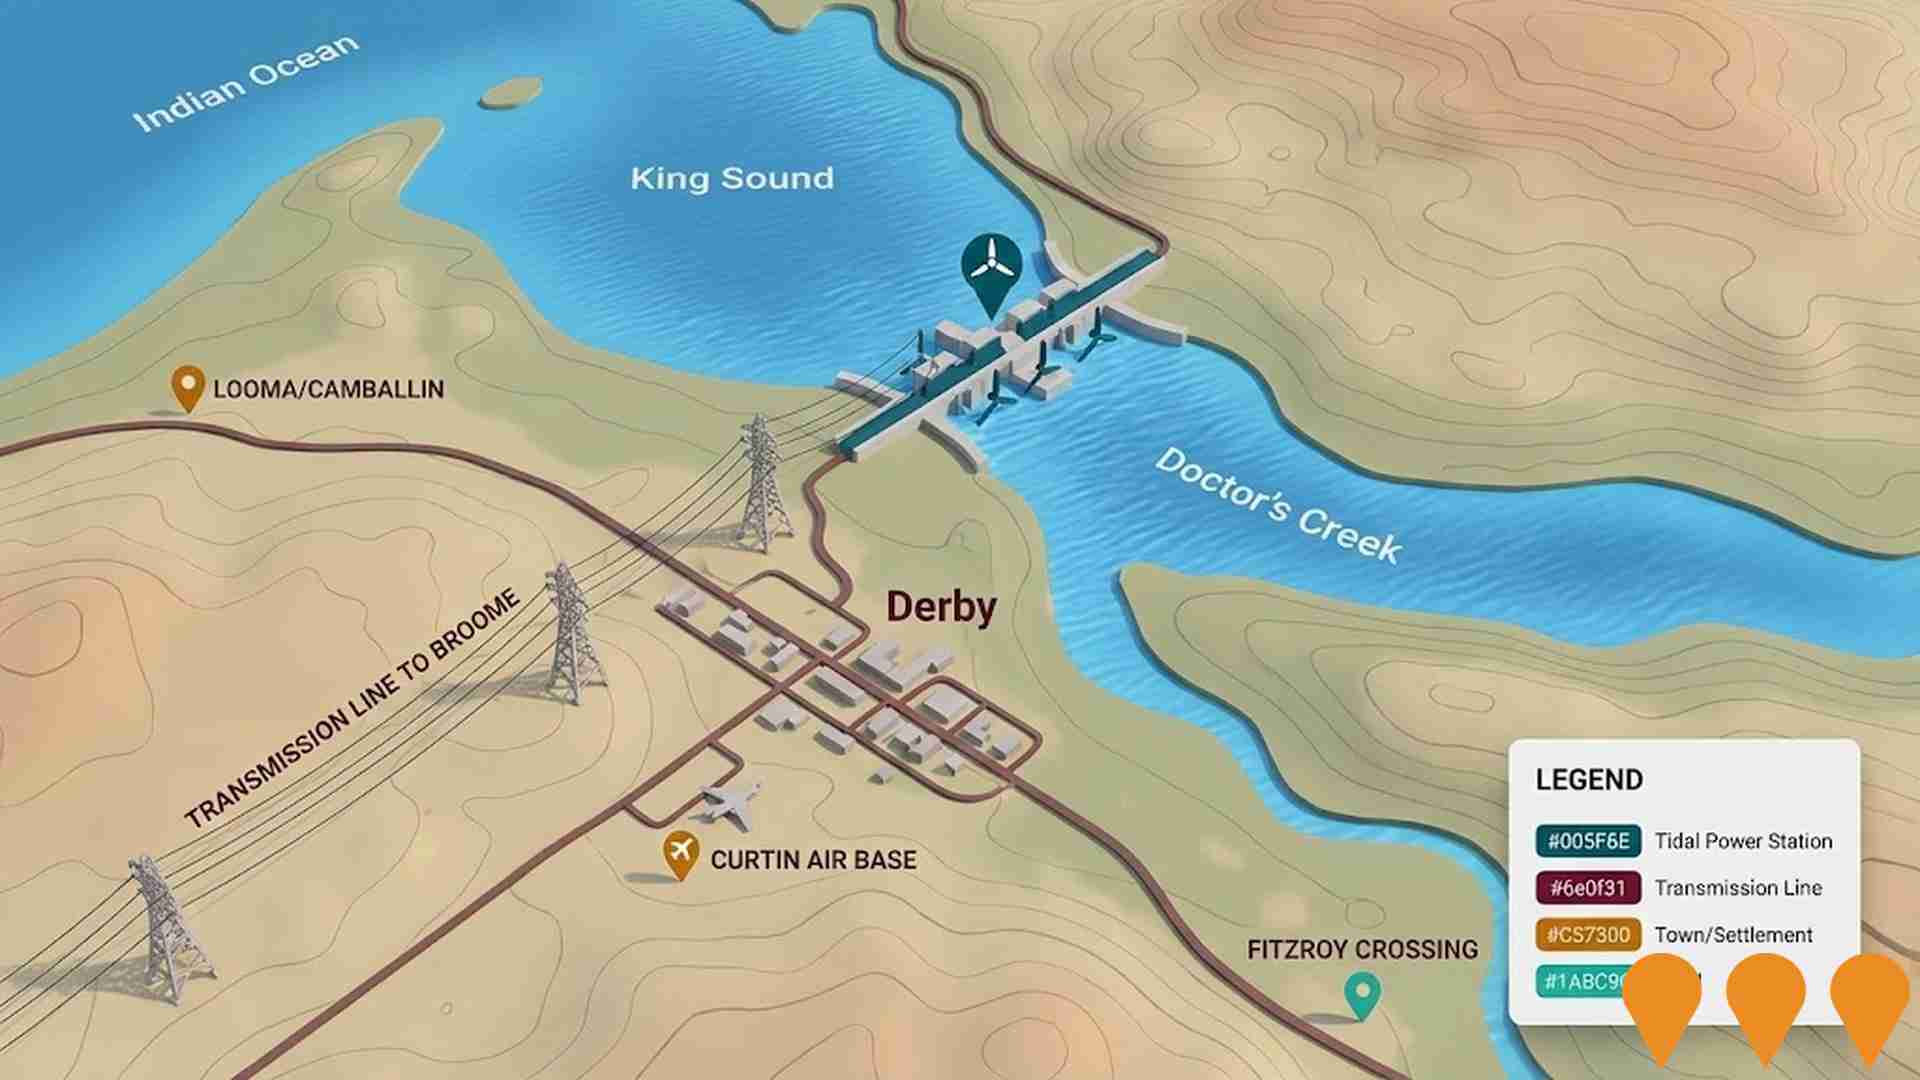
Derby Tidal Power Project
Construction and operation of a tidal power station across the mouth of Doctor's Creek to generate electricity, with transmission to major West Kimberley centres. EPA environmental approval (Ministerial Statement 941) was issued on 22 July 2013; however, subsequent reporting in 2023 indicated the project was unlikely to proceed due to prolonged delays and lack of federal support.
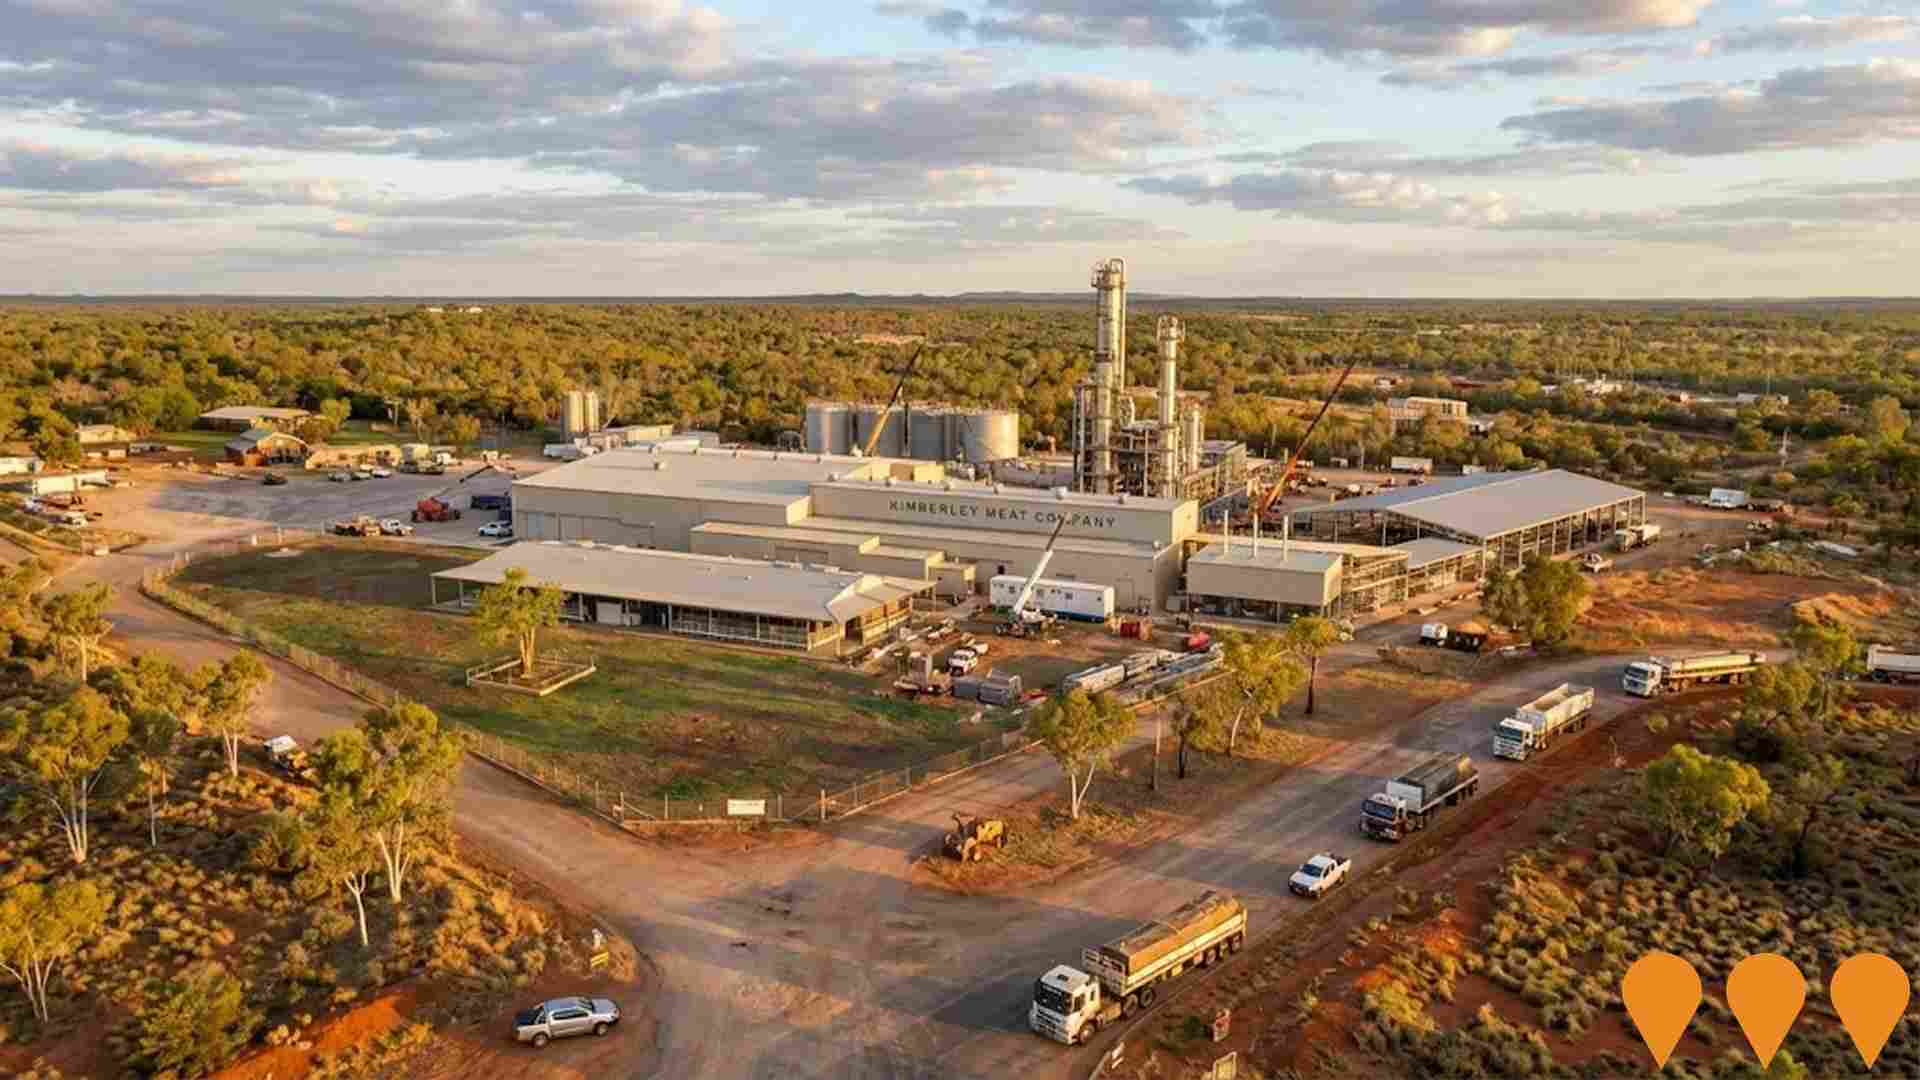
Derby Fertilizer and Petrochemical Complex
Proposed large scale ammonia, methanol, urea and complex fertilizer complex near Derby, including an on site power station. The proponent cites FEED/BEDP activities underway and MOUs for gas supply and offtake. Phase 1 targets 3,500 tpd liquid ammonia, 5,000 tpd methanol and 4,000 tpd urea; a later phase would add NPK/MAP/DAP production.
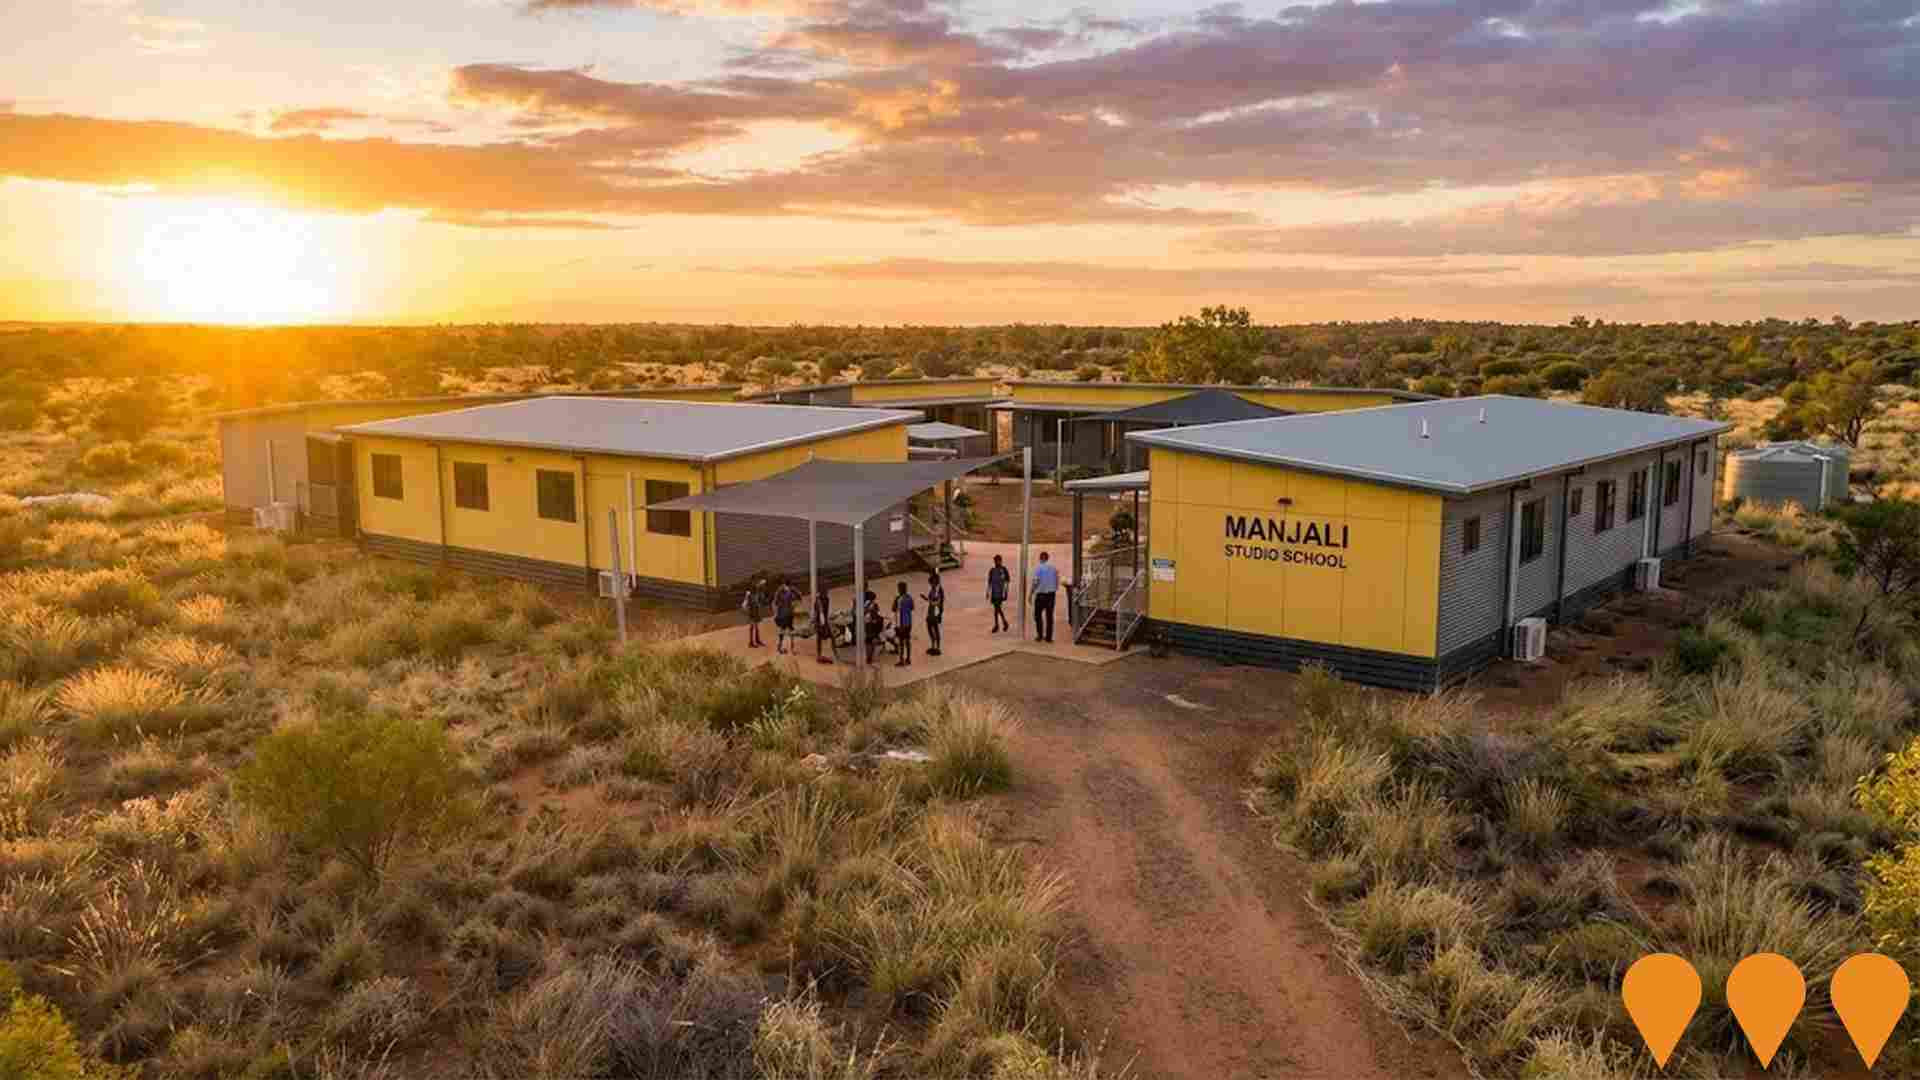
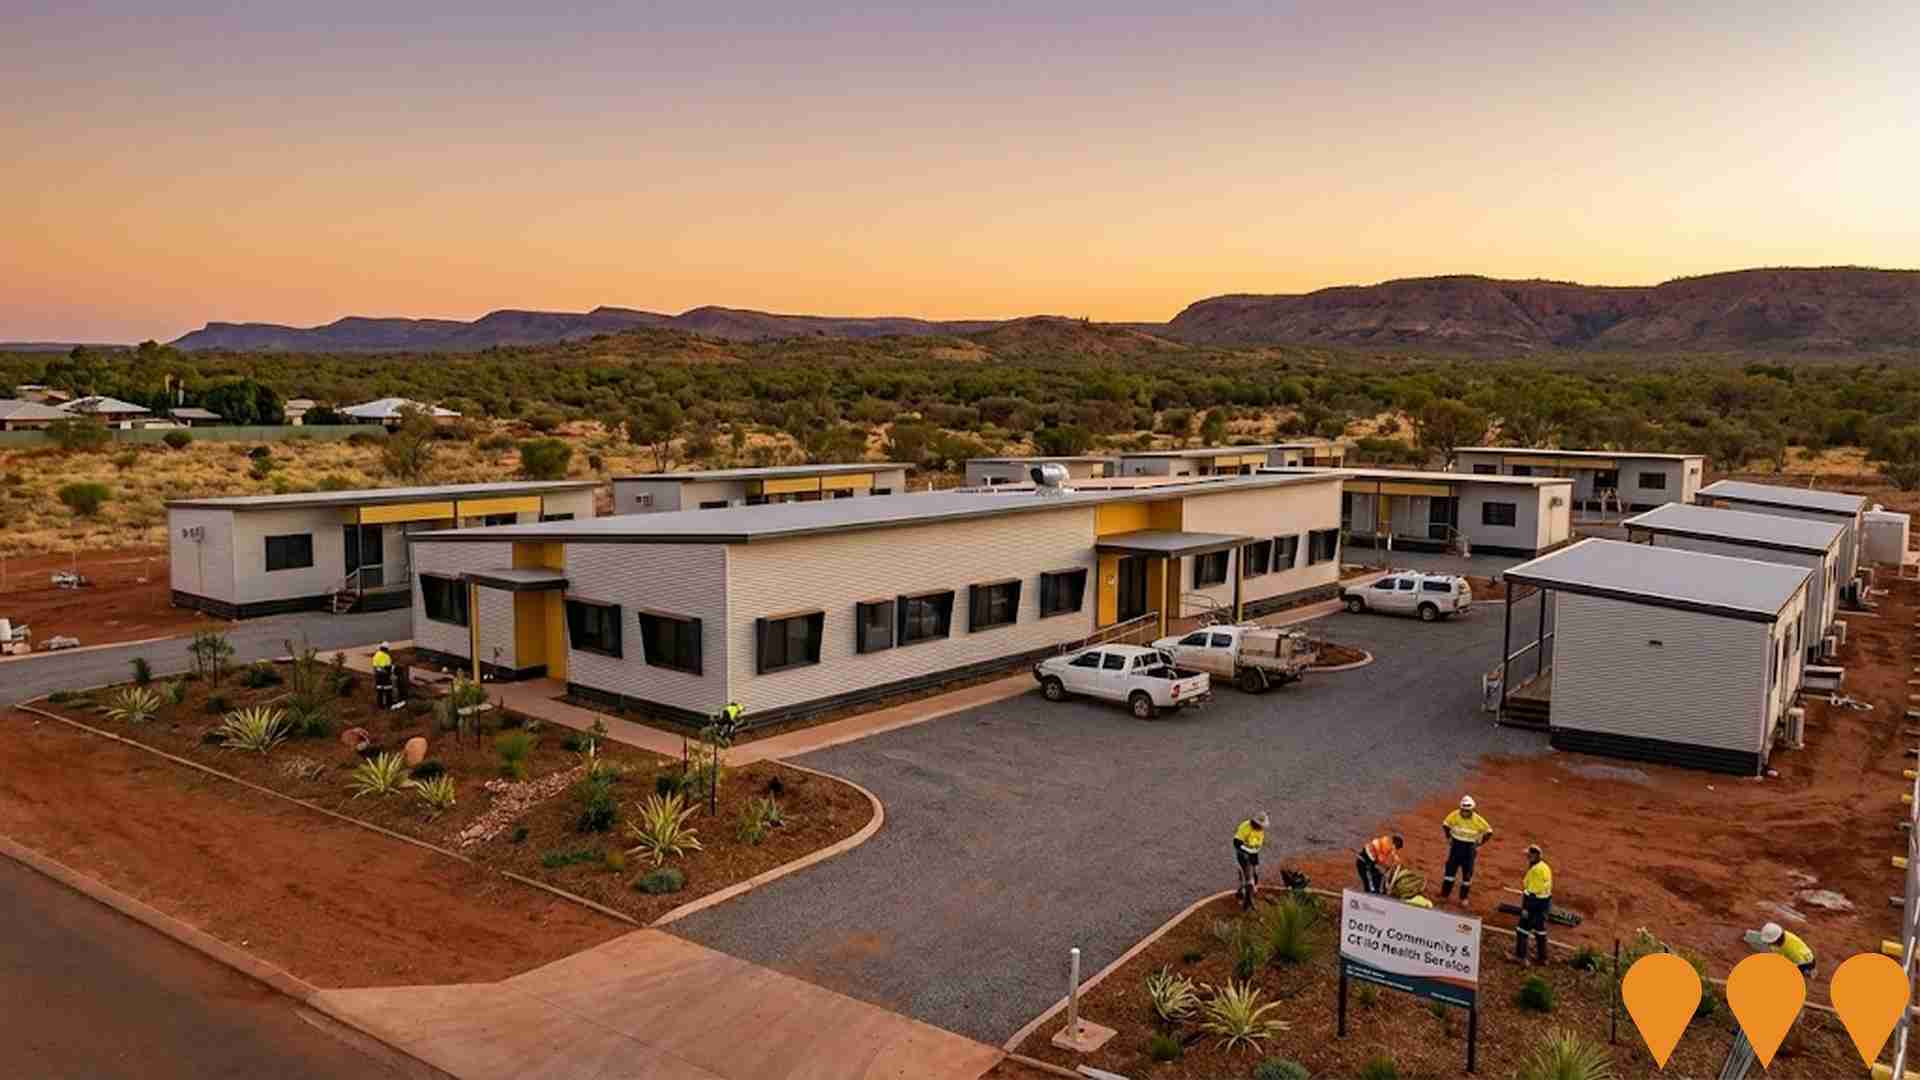
Design and Construct Modular Staff Accommodation, Derby
Procurement activity by WA Country Health Service to deliver modular staff housing in Derby, including design, documentation, fabrication and associated forward works (site preparation, earthworks, electrical and plumbing).
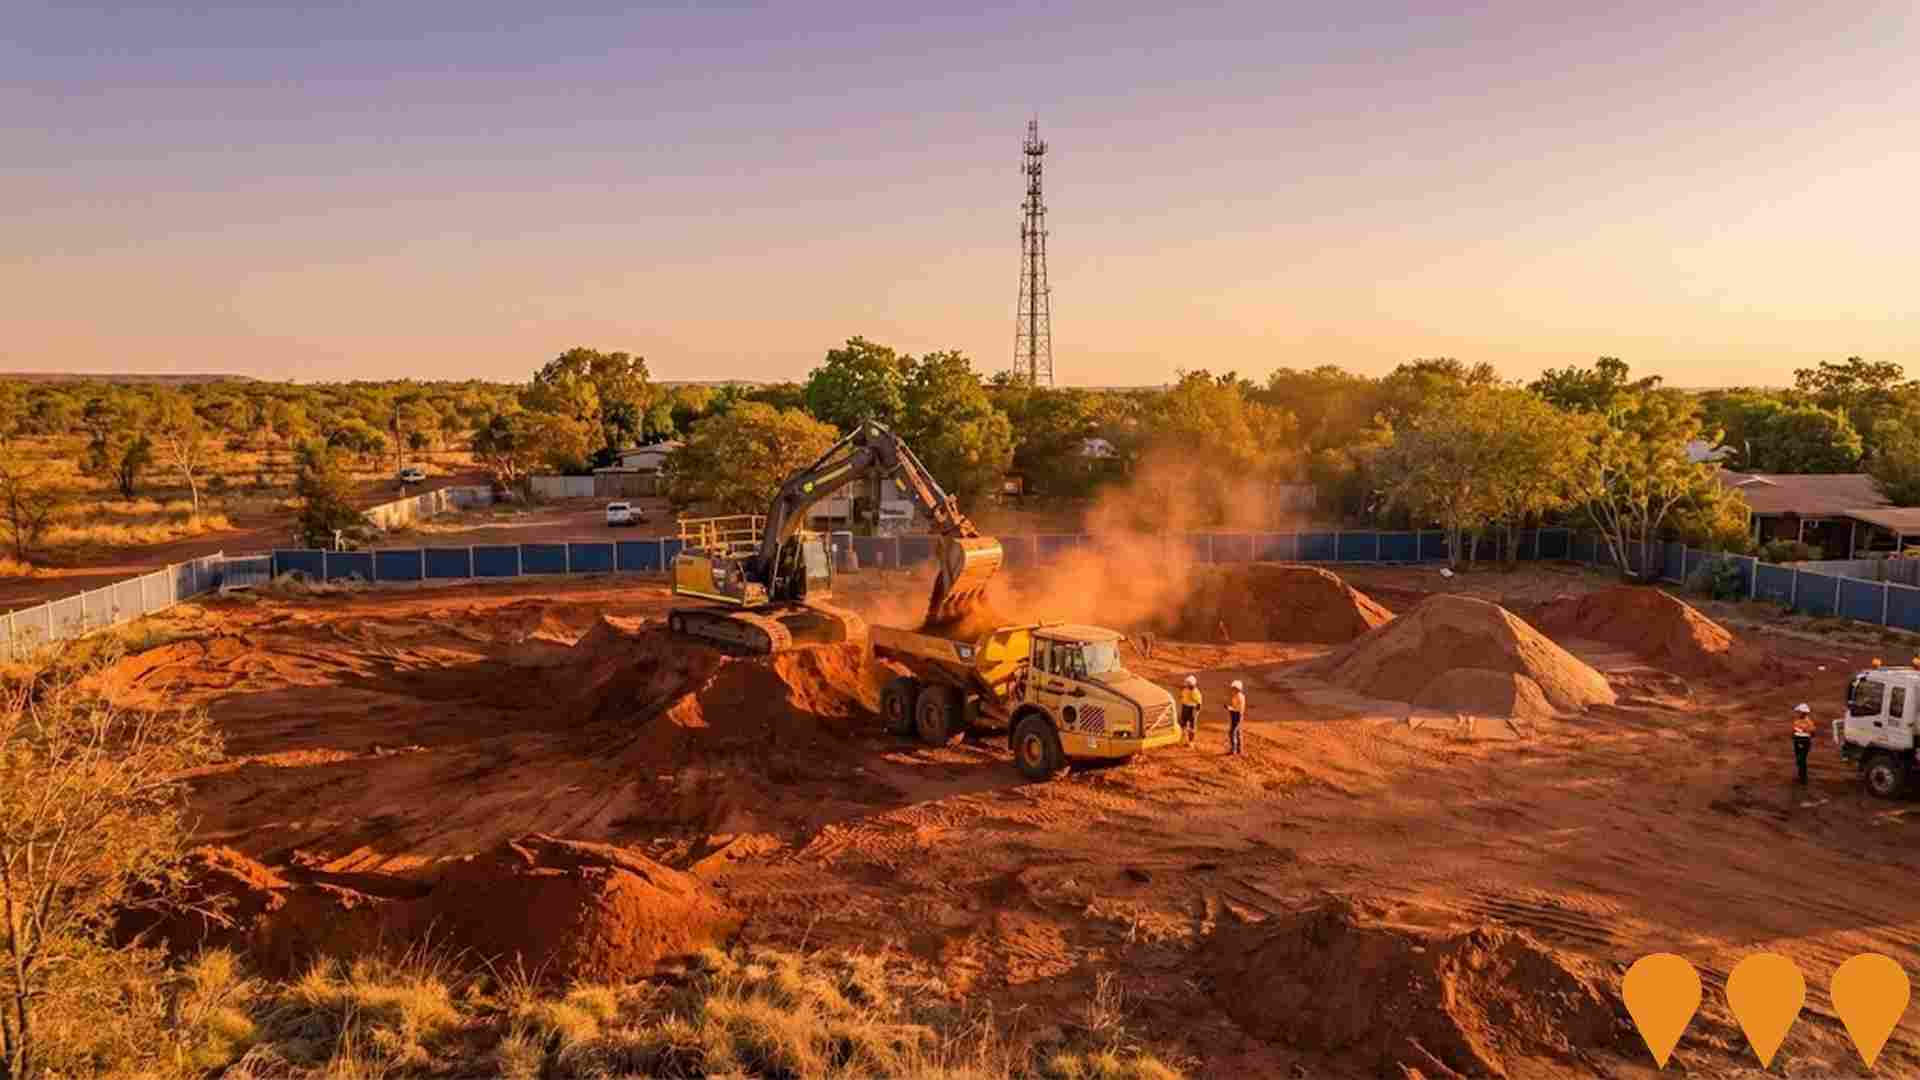
Derby East Construction Sands Project
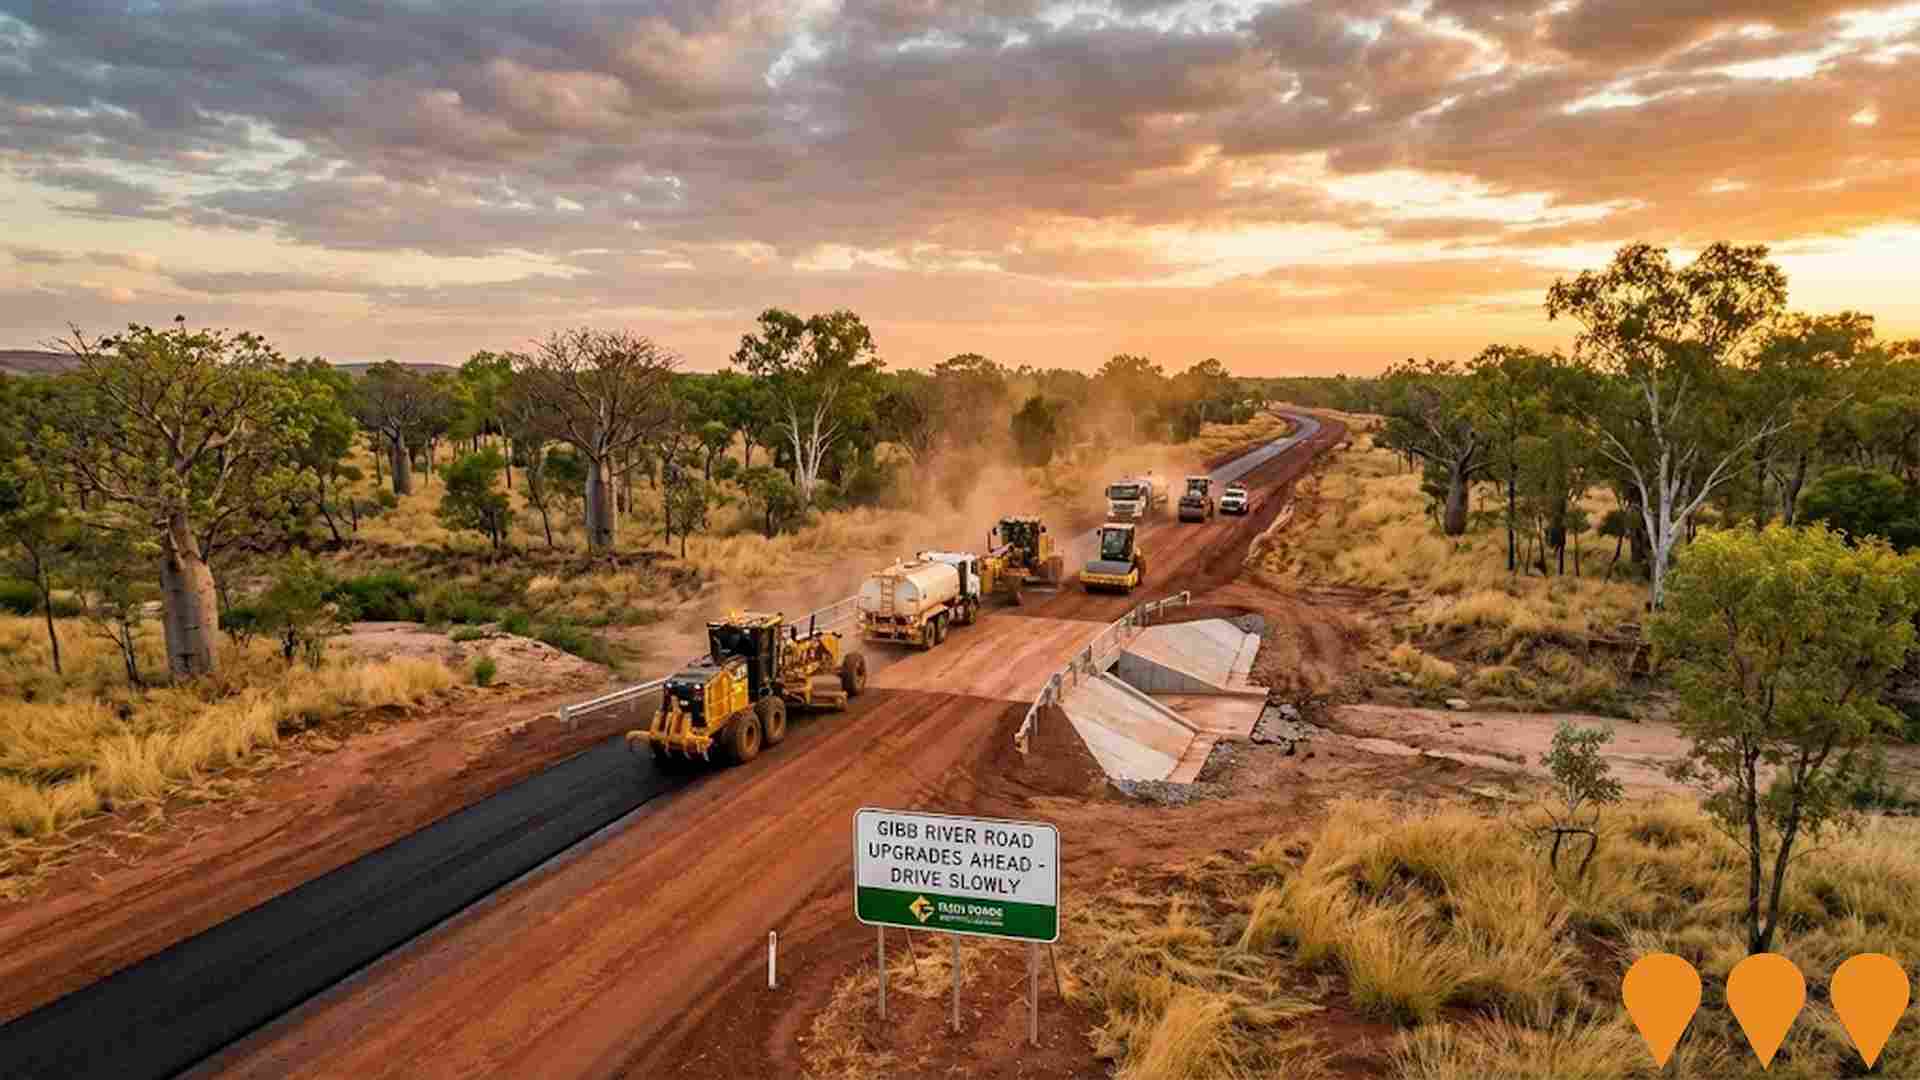
Macro Metals Limited and WA Limestone completed the acquisition of the Derby East Construction Sands Project in July 2025. The project comprises granted exploration licences located about 24 km east of the Port of Derby, accessed via the Derby-Gibb River Road. The partners are progressing planning and market engagement for potential export of construction sand to Southeast Asia (including Singapore) subject to approvals.
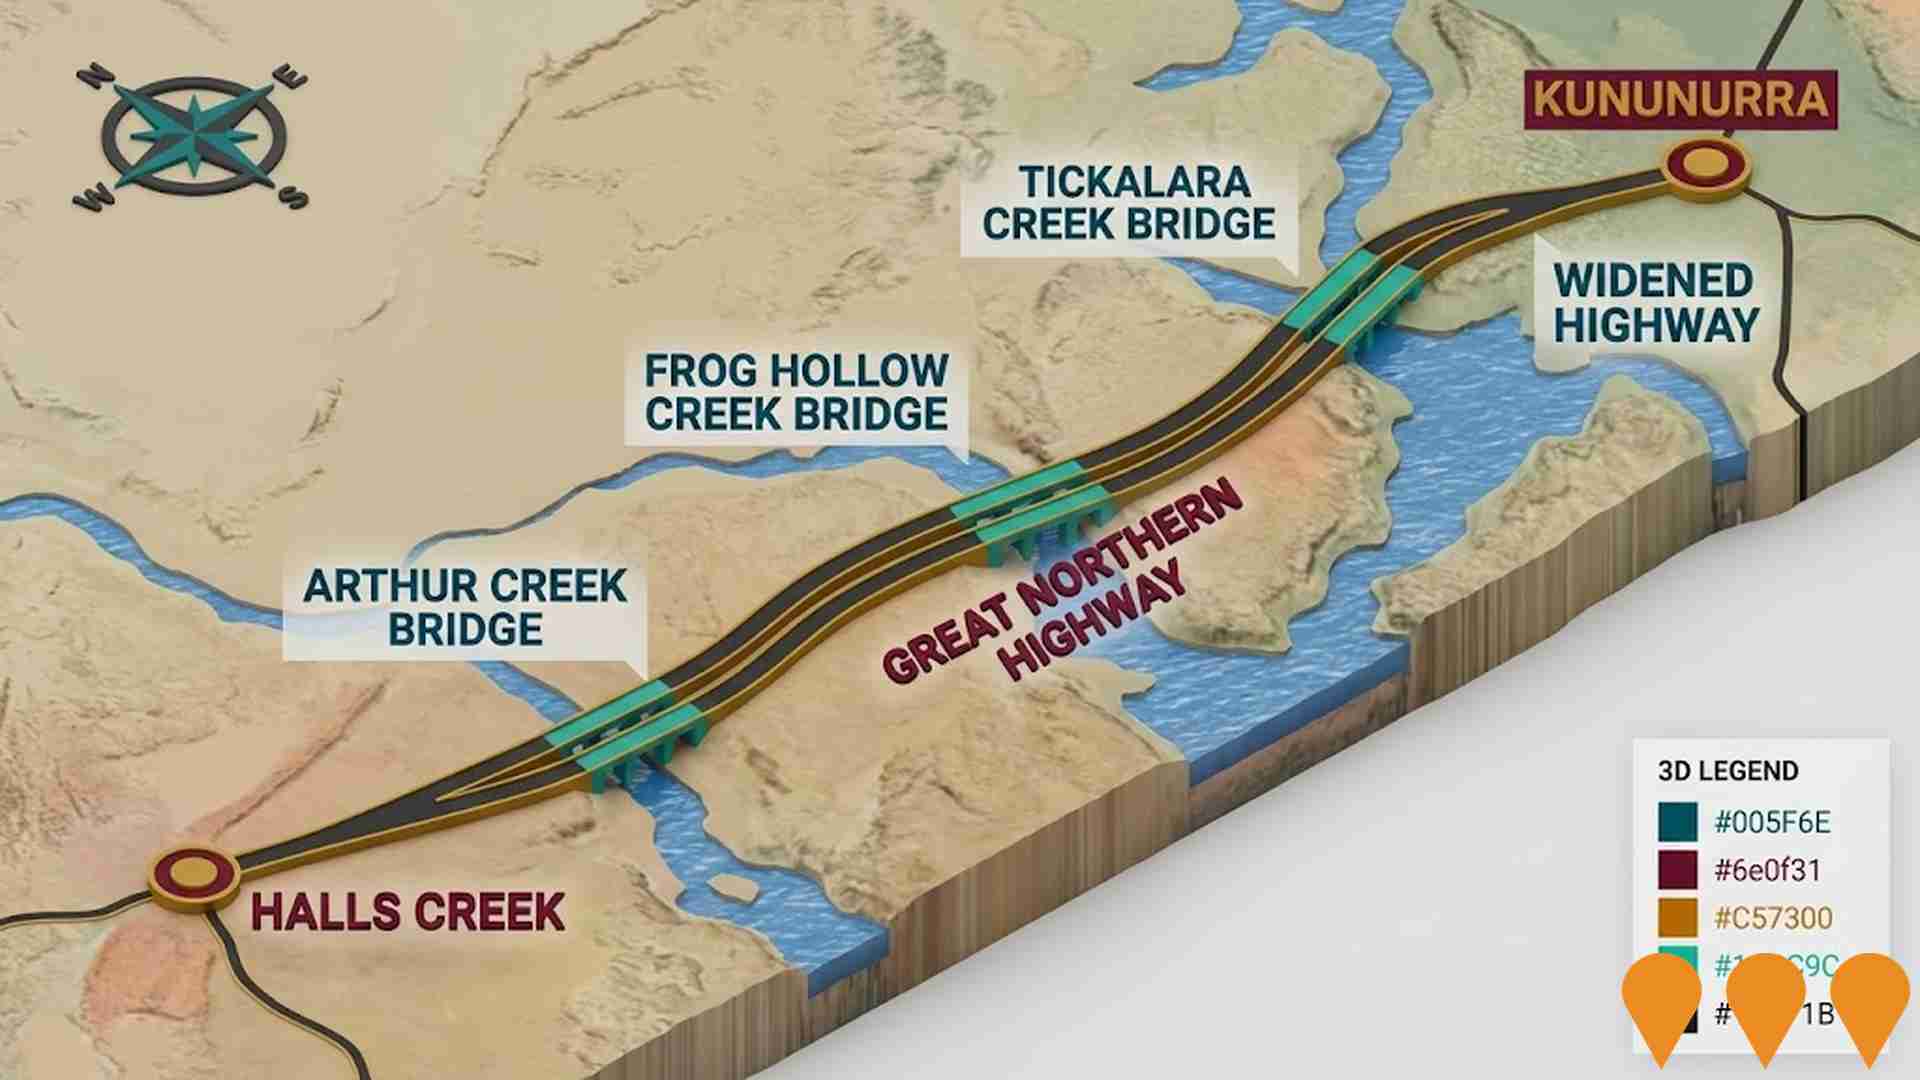
Halls Creek to Kununurra Bridges
Upgrade of the Great Northern Highway in the Kimberley to replace three single lane bridges at Arthur Creek, Frog Hollow Creek and Tickalara Creek with new dual lane structures and to widen about 26 km of highway between Halls Creek and Kununurra. The works improve safety and traffic flow, reduce the risk of head on crashes and cut delays caused by stopping at single lane crossings. The new bridges are designed for a 100 year flood event, improving flood resilience and reliability for freight, local communities and tourists. Tickalara Creek and Frog Hollow Creek bridges were completed and opened to traffic in 2024, with the Arthur Creek bridge delivered under the same package, and the project is now reported as complete.
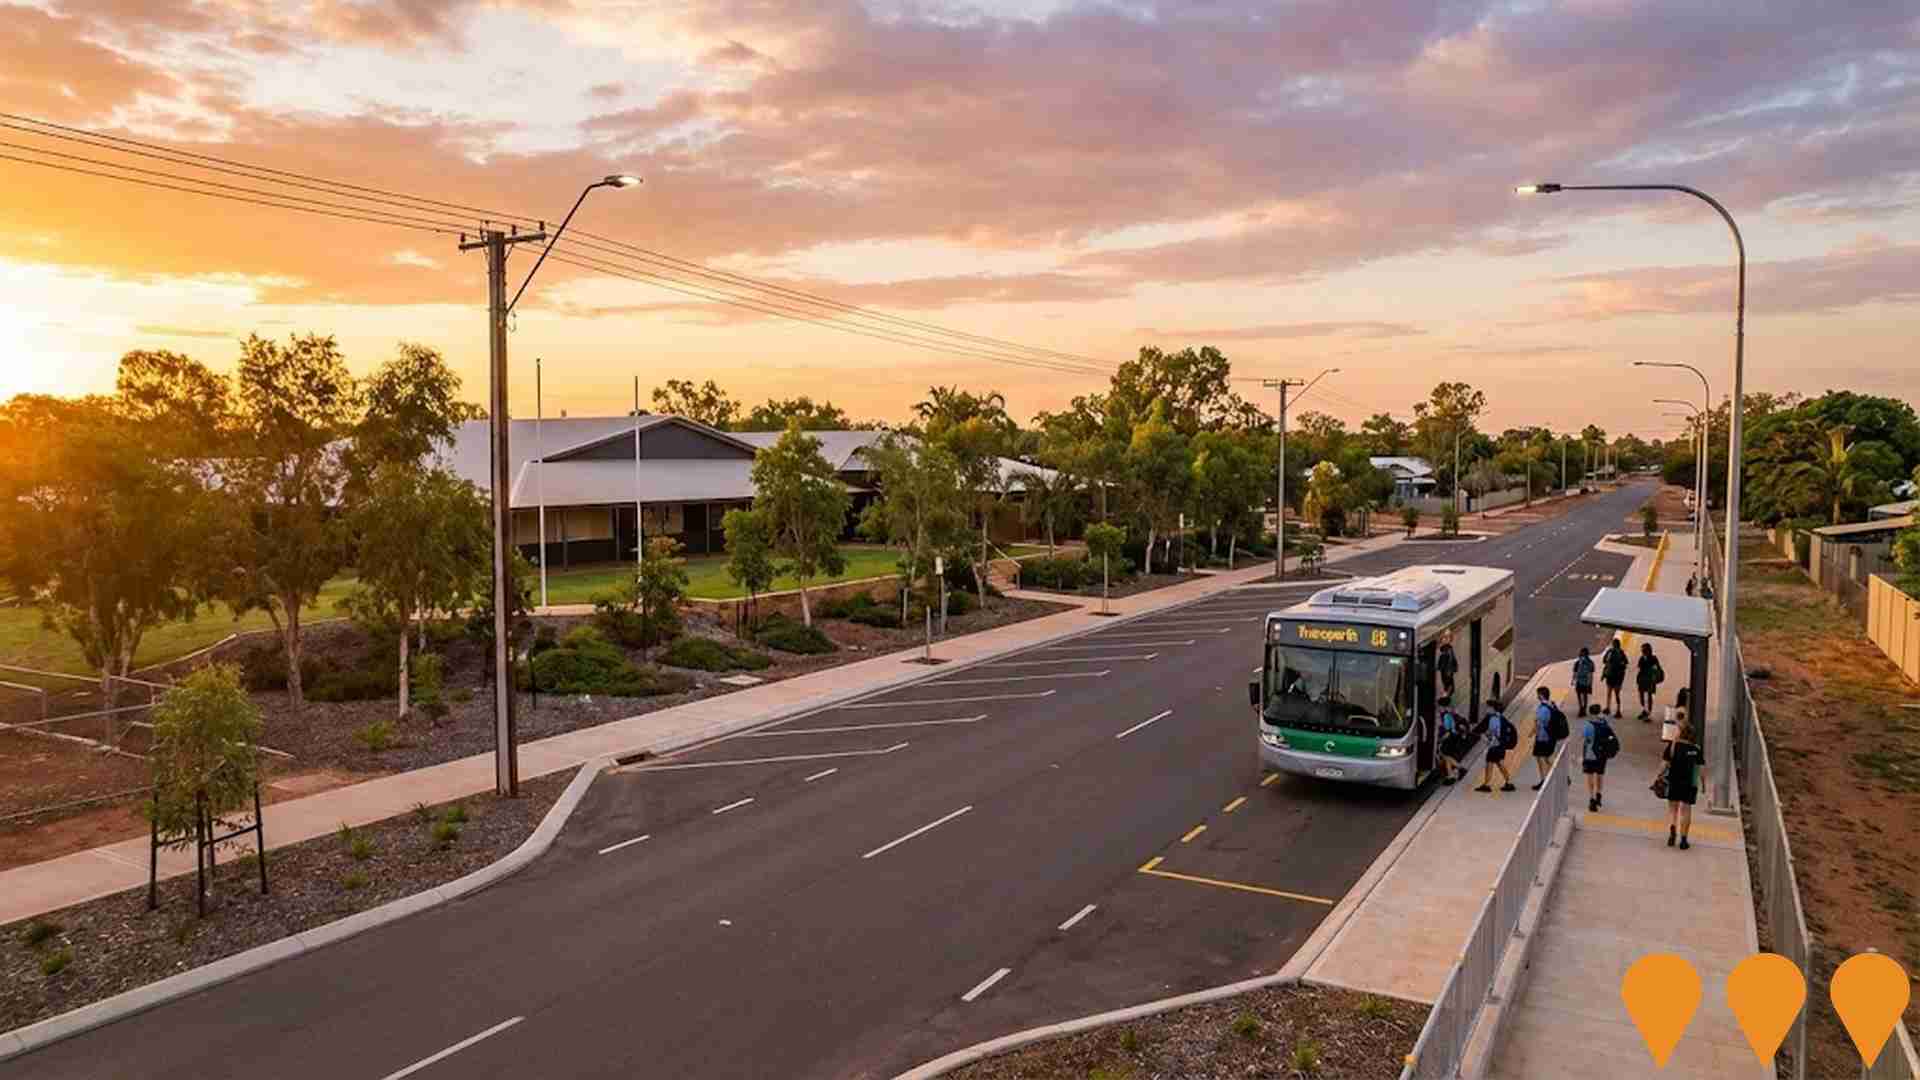
Fairbairn Street Upgrade
Shire of Derby/West Kimberley upgrade to improve safety and access near Derby District High School, coordinated with Derby Bus Services. State Black Spot funding is supporting detailed design in 2025/26 with construction allocation in 2026/27. Works include sealing and widening, formal parking and bus bays, new pedestrian path, kerbing and lighting focused on school frontage and bus operations.
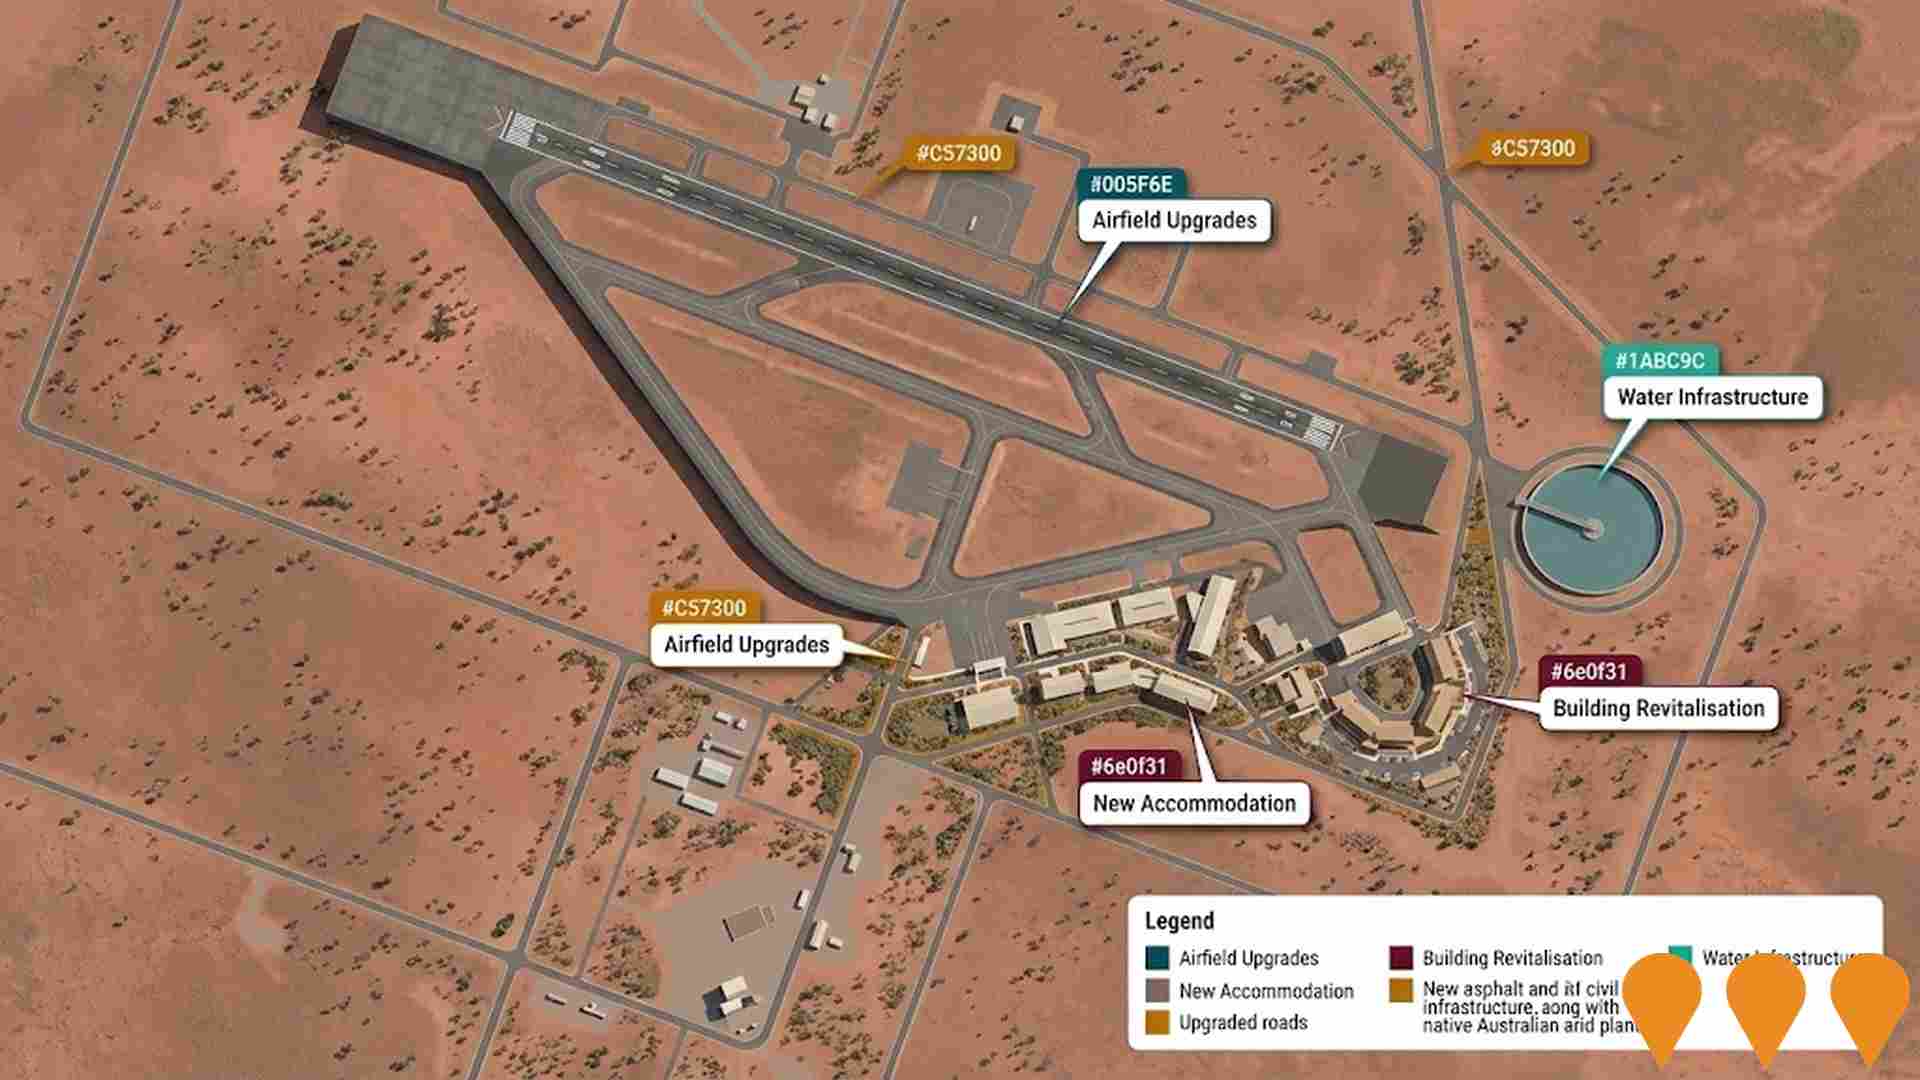
RAAF Curtin Redevelopment Project
A major redevelopment of the Royal Australian Air Force (RAAF) Base Curtin to deliver refurbished and improved facilities and infrastructure. The works will include civil and road upgrades, electrical system works, water infrastructure, building revitalisation, communications upgrades, airfield upgrades, landscaping and new accommodation.
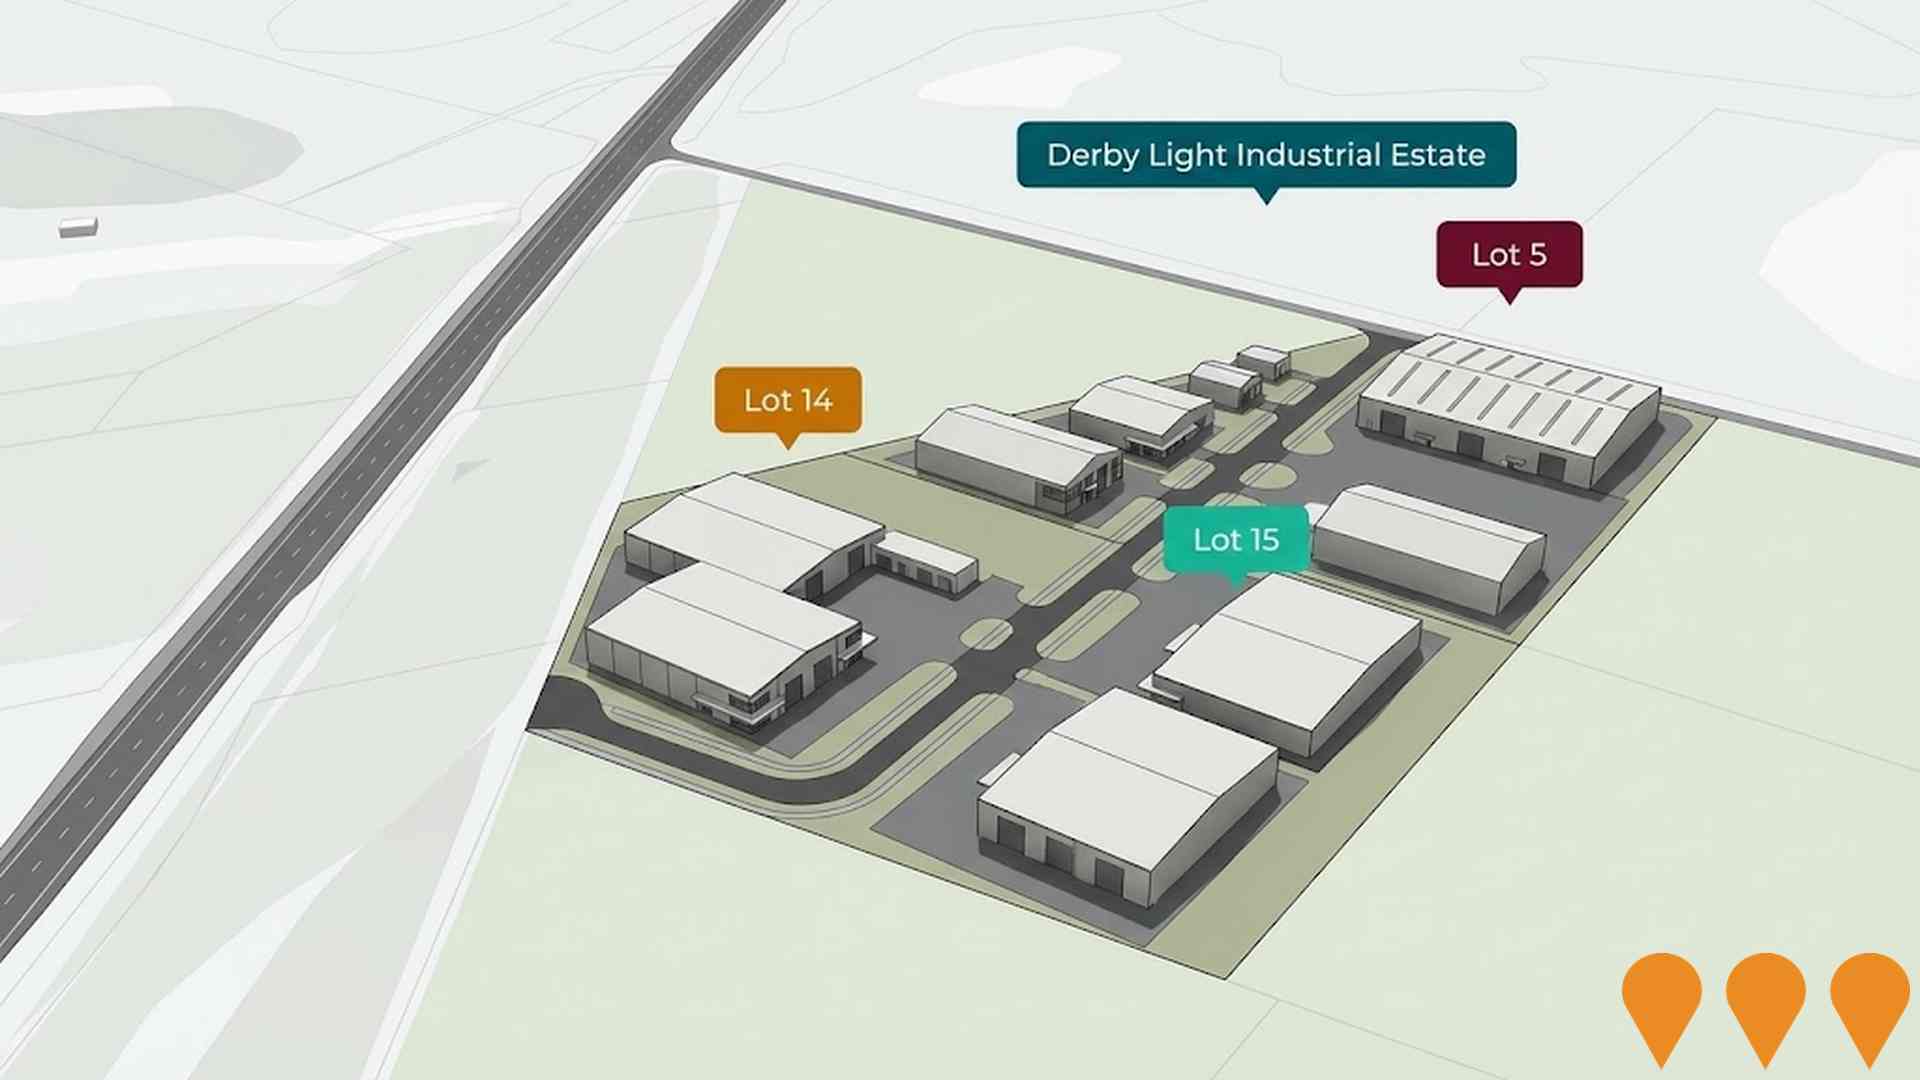
Derby Light Industrial Estate
A planned light industrial estate by DevelopmentWA, strategically located off the Derby Highway to meet the growing demand for industrial land in the area.
Employment
Employment conditions in Derby - West Kimberley face significant challenges, ranking among the bottom 10% of areas assessed nationally
Derby-West Kimberley has a balanced workforce with white and blue collar jobs. Key sectors include education & training, health care & social assistance, public administration & safety.
Unemployment rate was 23.0% in September 2025. Employment industries show notable concentration in education & training at 2.5 times the regional average, but mining is lower at 2.8%. Only 39.0% of residents participate in the workforce compared to Rest of WA's 59.4%. Over a year to September 2025, labour force levels increased by 0.9%, while employment declined by 3.5%, causing unemployment to rise by 3.5 percentage points.
National employment forecasts from May-25 suggest Derby-West Kimberley's employment should increase by 6.5% over five years and 13.7% over ten years, based on industry-specific projections.
Frequently Asked Questions - Employment
Income
Income levels sit below national averages according to AreaSearch assessment
Derby-West Kimberley SA2 had a median taxpayer income of $52,354 and an average income of $61,246 in financial year 2022, according to AreaSearch's aggregation of ATO data. This is lower than the Rest of WA's figures of $57,323 and $71,163 respectively. By September 2025, estimates based on a 14.2% Wage Price Index growth since financial year 2022 would be approximately $59,788 (median) and $69,943 (average). The 2021 Census data shows household income ranked at the 22nd percentile ($1,327 weekly), with personal income at the 2nd percentile. In terms of income distribution, 30.4% of locals (2,591 people) fall within the $1,500 - $2,999 category, similar to the broader area where 31.1% occupy this bracket. Housing costs allow for retention of 91.6%, but disposable income is below average at the 32nd percentile.
Frequently Asked Questions - Income
Housing
Derby - West Kimberley is characterized by a predominantly suburban housing profile, with a higher proportion of rental properties than the broader region
Derby-West Kimberley's dwelling structures, as per the latest Census, consisted of 88.1% houses and 11.9% other dwellings (semi-detached, apartments, 'other' dwellings), compared to Non-Metro WA's 79.3% houses and 20.7% other dwellings. Home ownership in Derby-West Kimberley stood at 10.3%, with mortgaged dwellings at 7.8% and rented ones at 81.9%. The median monthly mortgage repayment was $1,629, below Non-Metro WA's average of $2,167. The median weekly rent in the area was $100, compared to Non-Metro WA's $200 and the national average of $375. Nationally, Derby-West Kimberley's mortgage repayments were significantly lower than the Australian average of $1,863.
Frequently Asked Questions - Housing
Household Composition
Derby - West Kimberley features high concentrations of lone person households, with a fairly typical median household size
Family households constitute 67.7% of all households, including 26.0% couples with children, 21.2% couples without children, and 16.5% single parent families. Non-family households comprise the remaining 32.3%, with lone person households at 30.2% and group households at 2.3%. The median household size is 2.8 people, which aligns with the average for the Rest of WA.
Frequently Asked Questions - Households
Local Schools & Education
Derby - West Kimberley faces educational challenges, with performance metrics placing it in the bottom quartile of areas assessed nationally
The area's university qualification rate is 16.2%, significantly lower than Australia's average of 30.4%. Bachelor degrees are the most common at 11.1%, followed by postgraduate qualifications (3.0%) and graduate diplomas (2.1%). Vocational credentials are prevalent, with 32.5% of residents aged 15+ holding them, including advanced diplomas (6.3%) and certificates (26.2%). Educational participation is high, with 36.3% of residents currently enrolled in formal education, including 19.2% in primary, 9.6% in secondary, and 1.8% in tertiary education.
Educational participation is notably high, with 36.3% of residents currently enrolled in formal education. This includes 19.2% in primary education, 9.6% in secondary education, and 1.8% pursuing tertiary education.
Frequently Asked Questions - Education
Schools Detail
Nearby Services & Amenities
Transport
No public transport data available for this catchment area.
Frequently Asked Questions - Transport
Transport Stops Detail
Health
Derby - West Kimberley's residents boast exceedingly positive health performance metrics with very low prevalence of common health conditions across all age groups
Health outcomes data shows outstanding results across Derby-West Kimberley. The prevalence of common health conditions is very low across all age groups.
Approximately 51% of the total population (~4,313 people) has private health cover, compared to 53.4% across the rest of WA. Diabetes and asthma are the most common medical conditions in the area, impacting 6.5 and 4.4% of residents respectively. 80.2% of residents declare themselves completely clear of medical ailments, compared to 79.9% across the rest of WA. The area has 8.7% of residents aged 65 and over (744 people), which is higher than the 7.4% in the rest of WA. Health outcomes among seniors are particularly strong, broadly in line with the general population's health profile.
Frequently Asked Questions - Health
Cultural Diversity
In terms of cultural diversity, Derby - West Kimberley records figures broadly comparable to the national average, as found in AreaSearch's assessment of a number of language and cultural background related metrics
Derby-West Kimberley has a cultural diversity above average, with 8.6% of its population born overseas and 43.1% speaking a language other than English at home. Christianity is the main religion in Derby-West Kimberley, comprising 54.8% of its population. Notably, the 'Other' category makes up 2.2%, higher than the Rest of WA's average of 1.5%.
In terms of ancestry, Australian Aboriginal is the top group at 56.7%, substantially higher than the regional average of 33.7%. Australian and English groups are notably lower compared to regional averages: Australian at 13.0% (regional average 19.7%) and English at 11.7% (regional average 19.1%). Maori is overrepresented at 0.9% (regional average 0.5%), while Samoan remains similar at 0.1%.
Frequently Asked Questions - Diversity
Age
Derby - West Kimberley hosts a very young demographic, ranking in the bottom 10% of areas nationwide
Derby-West Kimberley's median age is 31 years, which is considerably lower than the Rest of WA average of 40 years, and also younger than Australia's median age of 38 years. Compared to the Rest of WA, Derby-West Kimberley has a higher concentration of residents aged 25-34 (20.3%), but fewer residents aged 65-74 (6.2%). This 25-34 concentration is well above the national average of 14.5%. Between the 2021 Census and the present, the 25 to 34 age group has grown from 18.0% to 20.3%, while the 35 to 44 cohort increased from 13.5% to 14.5%. Conversely, the 55 to 64 cohort has declined from 11.0% to 9.8%. Population forecasts for 2041 indicate substantial demographic changes for Derby-West Kimberley. The 25 to 34 age group is projected to grow by 38%, adding 653 residents to reach a total of 2,383. In contrast, population declines are projected for the 5 to 14 and 15 to 24 age groups.
