Chart Color Schemes
This analysis uses ABS Statistical Areas Level 2 (SA2) boundaries, which can materially differ from Suburbs and Localities (SAL) even when sharing similar names.
SA2 boundaries are defined by the Australian Bureau of Statistics and are designed to represent communities for statistical reporting (e.g., census and ERP).
Suburbs and Localities (SAL) represent commonly-used suburb/locality names (postal-style areas) and may use different geographic boundaries. For comprehensive analysis, consider reviewing both boundary types if available.
est. as @ -- *
ABS ERP | -- people | --
2021 Census | -- people
Sales Activity
Curious about local property values? Filter the chart to assess the volume and appreciation (including resales) trends and regional comparisons, or scroll to the map below view this information at an individual property level.
Find a Recent Sale
Sales Detail
Population
An assessment of population growth drivers in Roebuck reveals an overall ranking slightly below national averages considering recent, and medium term trends
Roebuck's population was approximately 2,674 as of November 2025. This figure reflects an increase of 364 people from the 2021 Census, which reported a population of 2,310. The change is inferred from ABS estimates: Roebuck had an estimated resident population of 2,629 in June 2024 and gained 15 validated new addresses since the Census date. This results in a population density ratio of approximately 0.00 persons per square kilometer. Roebuck's growth rate of 15.8% since the 2021 census exceeded both national (8.9%) and non-metro averages, indicating strong growth in the region. Natural growth contributed about 53.2% of overall population gains during recent periods.
AreaSearch uses ABS/Geoscience Australia projections for each SA2 area released in 2024 with a base year of 2022. For areas not covered by this data and post-2032 estimates, AreaSearch utilises growth rates by age cohort provided by the ABS in its latest Greater Capital Region projections (released in 2023, based on 2022 data). Considering projected demographic shifts, Australian non-metropolitan areas are expected to have above median population growth. By 2041, Roebuck is projected to increase by 346 persons from the latest annual ERP population numbers, reflecting a total gain of 11.3% over the 17-year period.
Frequently Asked Questions - Population
Development
Residential development activity is lower than average in Roebuck according to AreaSearch's national comparison of local real estate markets
Roebuck has recorded approximately five residential properties granted approval annually. Over the past five financial years, from FY-21 to FY-25, 29 homes were approved, with a further nine approved so far in FY-26. On average, over these five years, 4.3 new residents arrived per dwelling constructed.
This indicates that supply is significantly lagging demand, leading to heightened buyer competition and pricing pressures. The average expected construction cost value of new dwellings is $482,000, suggesting developers are targeting the premium market segment with higher-end properties. In FY-26, $6.3 million in commercial development approvals have been recorded, reflecting the area's residential character. Compared to the Rest of WA, Roebuck shows approximately 75% of the construction activity per person, placing it among the 27th percentile of areas assessed nationally.
This results in relatively constrained buyer choice, supporting interest in existing properties. Recent development has consisted entirely of detached houses, preserving the area's low density nature and attracting space-seeking buyers. The estimated population count is 655 people per dwelling approval, reflecting its quiet, low activity development environment. Future projections estimate Roebuck will add 301 residents by 2041, with development keeping pace with projected growth, though increasing competition may arise as the population expands.
Frequently Asked Questions - Development
Infrastructure
Roebuck has emerging levels of nearby infrastructure activity, ranking in the 30thth percentile nationally
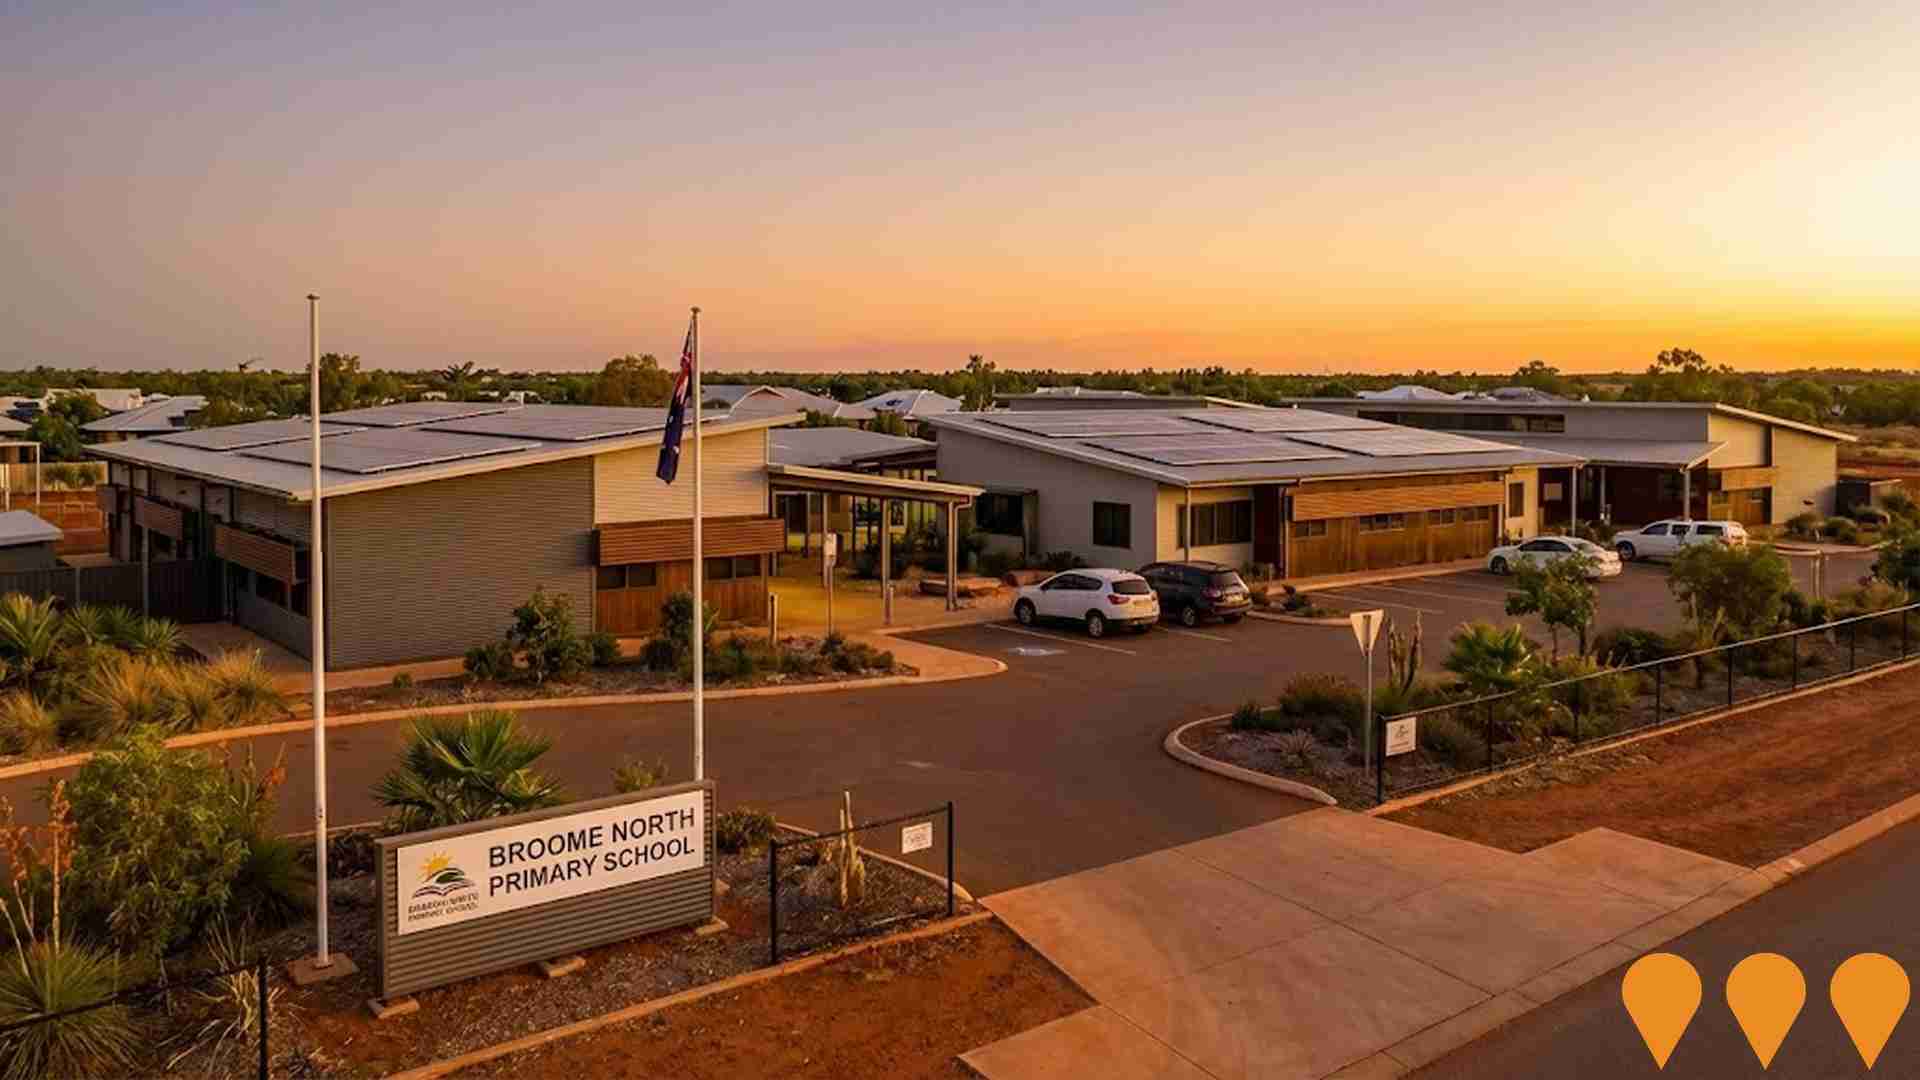
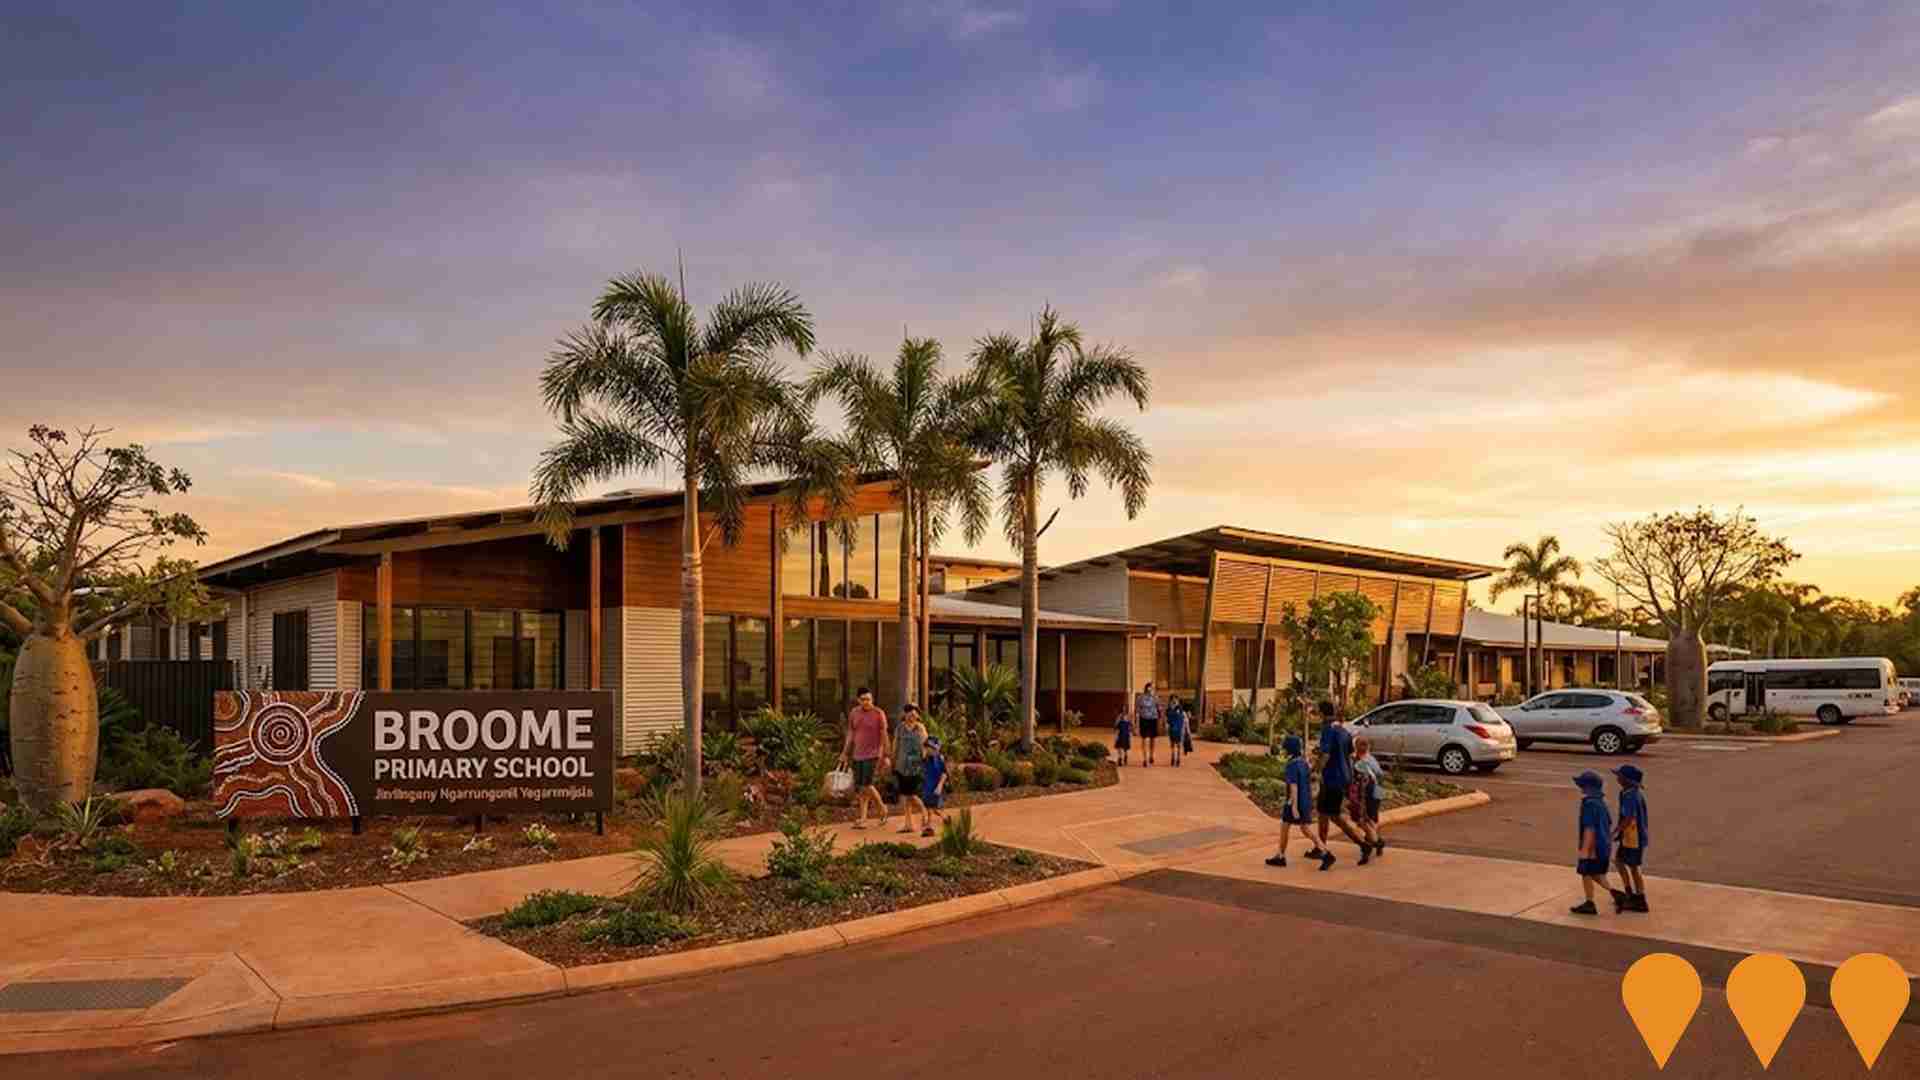
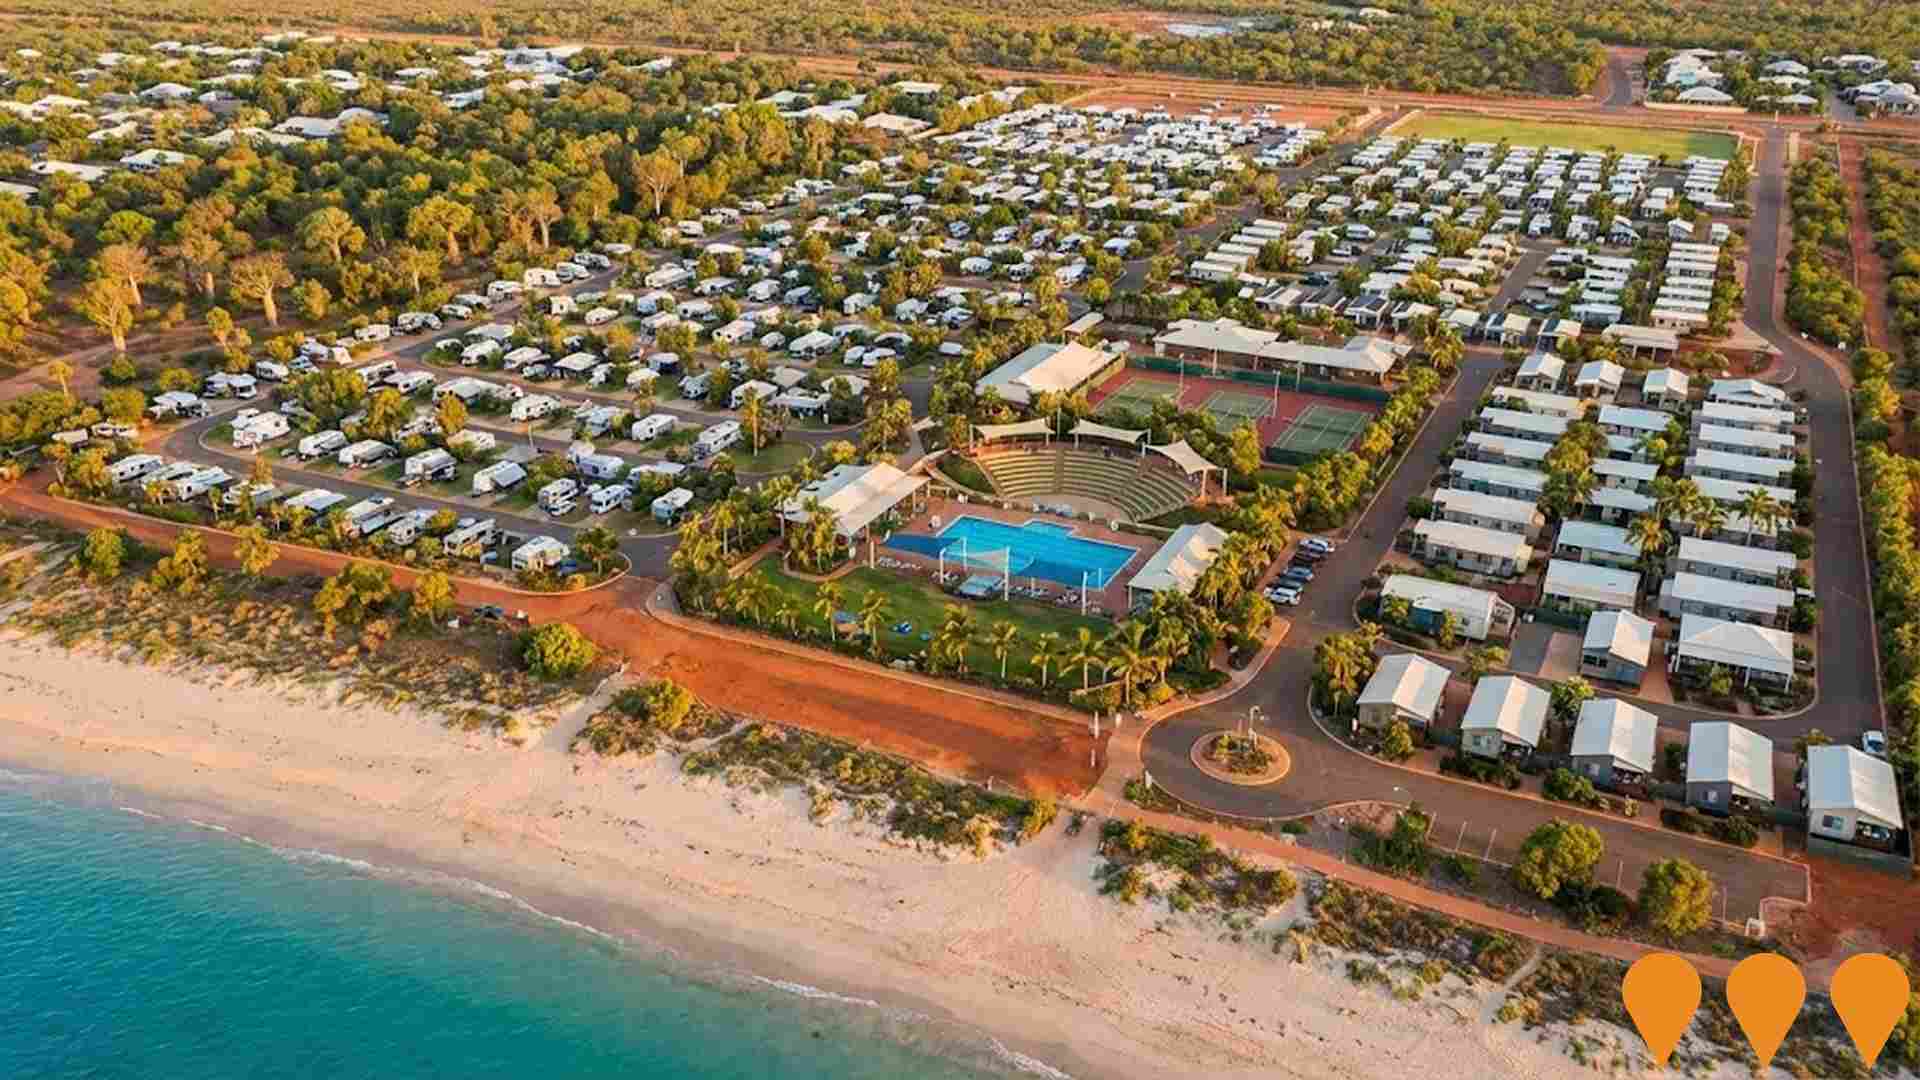
Changes to local infrastructure significantly impact an area's performance. AreaSearch identified 24 projects likely affecting the region. Notable initiatives include Blue Haze Light Industrial Precinct, Broome North - Waranyjarri Estate, Broome North Primary School, Sanctuary Road Caravan Park, and Key Worker And Over 55S Village. The following list details those most relevant.
Professional plan users can use the search below to filter and access additional projects.
INFRASTRUCTURE SEARCH
 Denotes AI-based impression for illustrative purposes only, not to be taken as definitive under any circumstances. Please follow links and conduct other investigations from the project's source for actual imagery. Developers and project owners wishing us to use original imagery please Contact Us and we will do so.
Frequently Asked Questions - Infrastructure
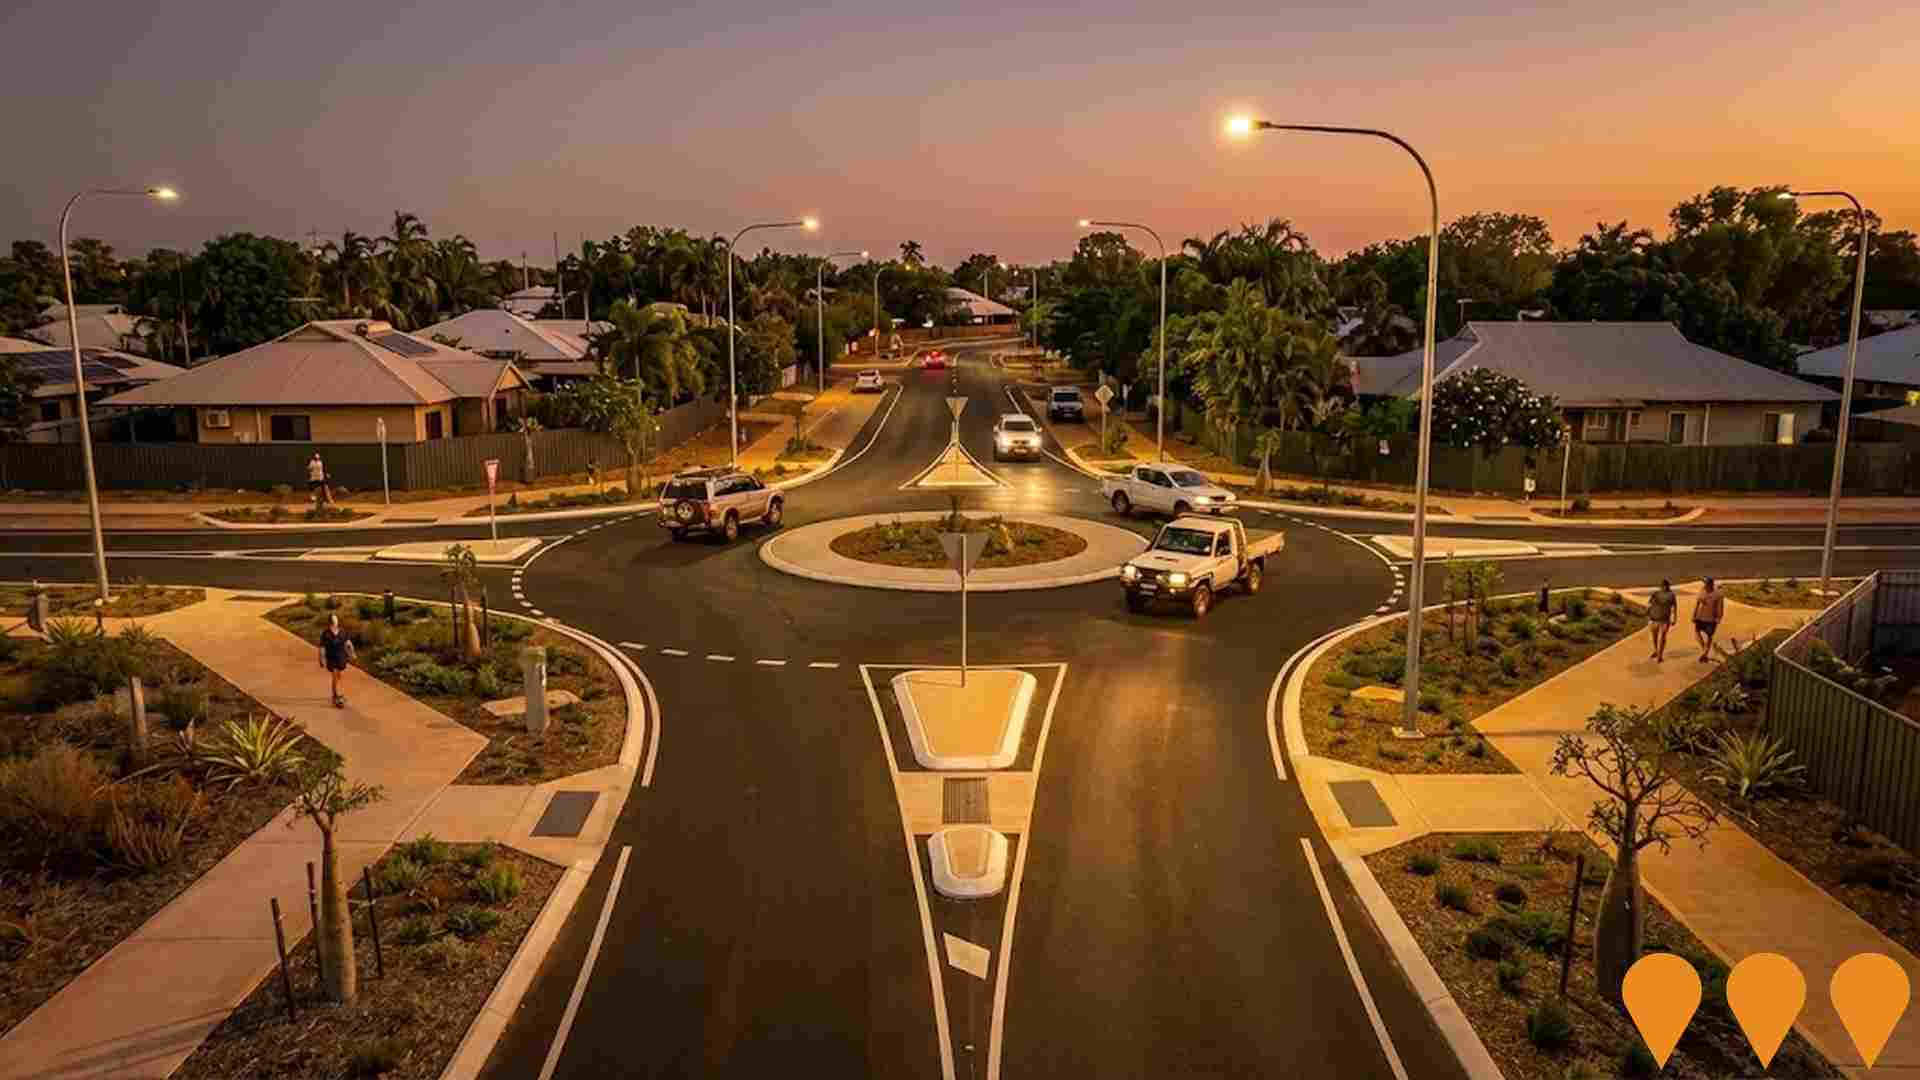
Chinatown Revitalisation Project
A comprehensive urban renewal initiative transforming Broome's historic Chinatown precinct into a vibrant tourism, business, retail, and entertainment destination. The project delivered streetscape enhancements to Carnarvon Street, Dampier Terrace, Short Street, and Napier Terrace, including public realm improvements, public art installations, shade structures, outdoor dining areas, enhanced lighting, event spaces, improved pedestrian access, and cultural interpretation. Stage 1 was completed in September 2019, with Stage 2 officially opened in November 2021. The revitalisation preserves Chinatown's rich multicultural heritage while creating climate-responsive public spaces that celebrate Traditional Owners and diverse cultural groups.
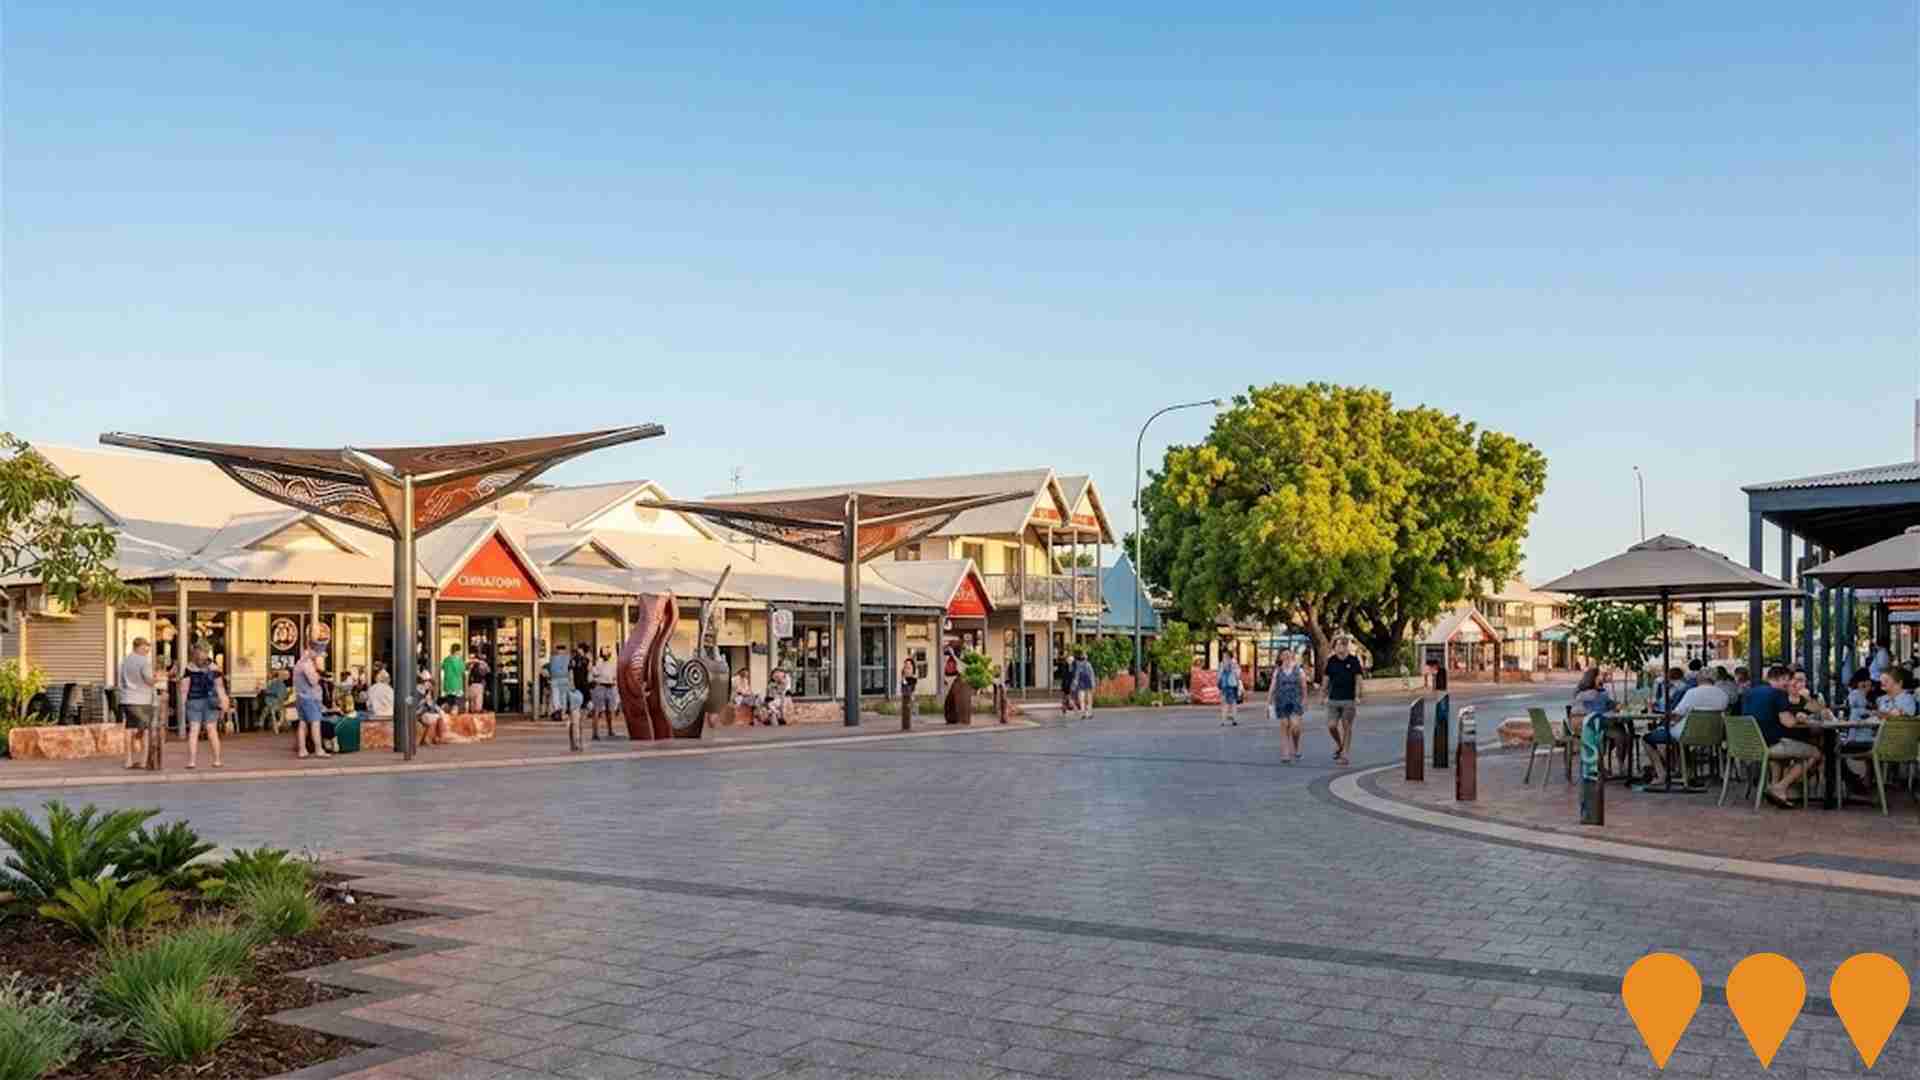
Broome North - Waranyjarri Estate
Waranyjarri Estate is the first residential neighborhood in the 700 hectare Broome North master planned community, planned to deliver up to 4,800 new homes for about 13,000 residents. It is Western Australias only EnviroDevelopment and Waterwise accredited regional housing project, with climate smart design, high speed fibre internet, parks, bushland corridors and a direct link to Cable Beach via the Tanami Drive extension. Current stages 11 to 13 are delivering new residential lots, including social and key worker housing, alongside a new 103 place childcare centre at the corner of Yako Mall and Shingoro Street.
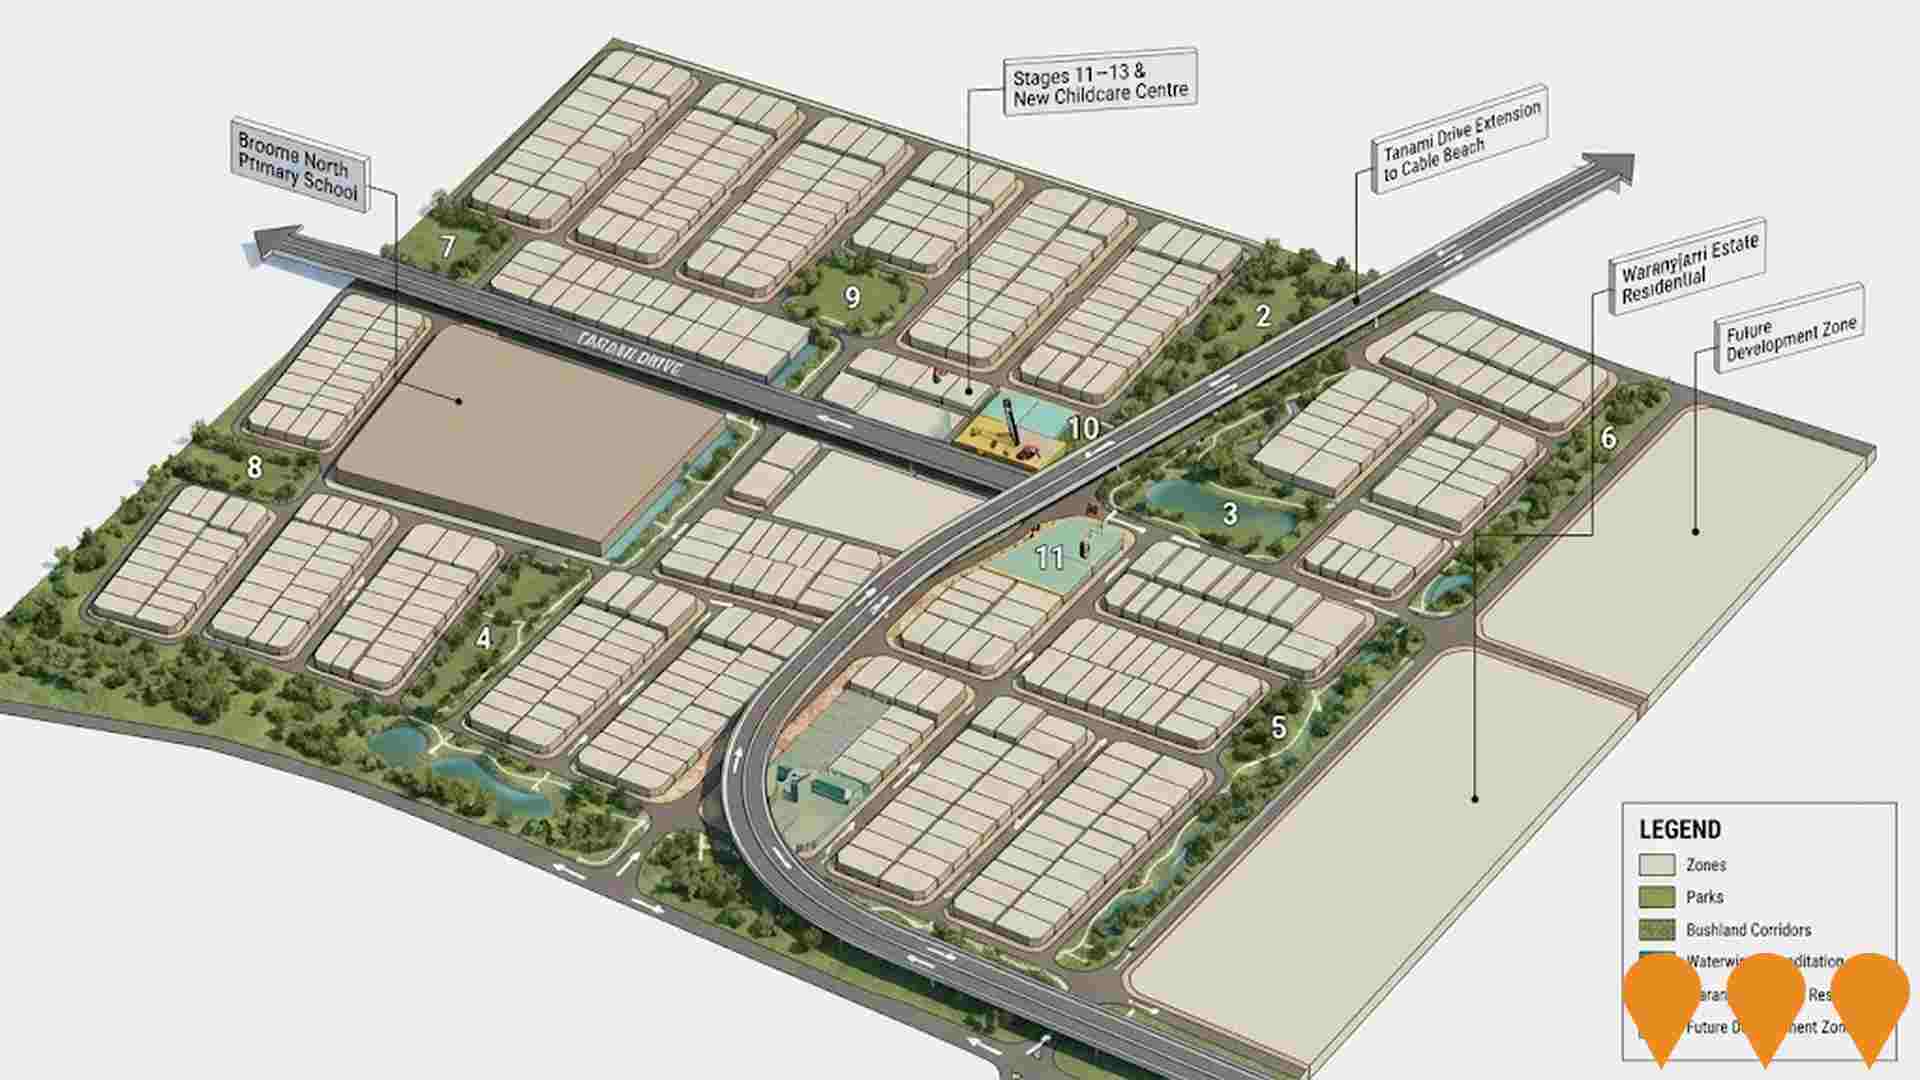
Broome Health Campus Redevelopment
Eight-year phased construction completed March 2016. $8.6 million major upgrade of Emergency Department expanding to 15 acute bays, new operating theatres, consulting rooms, public dental surgery, refurbished maternity unit, and new Acute Psychiatric Unit - first of its kind in Western Australia's north.
Broome Boating Facility
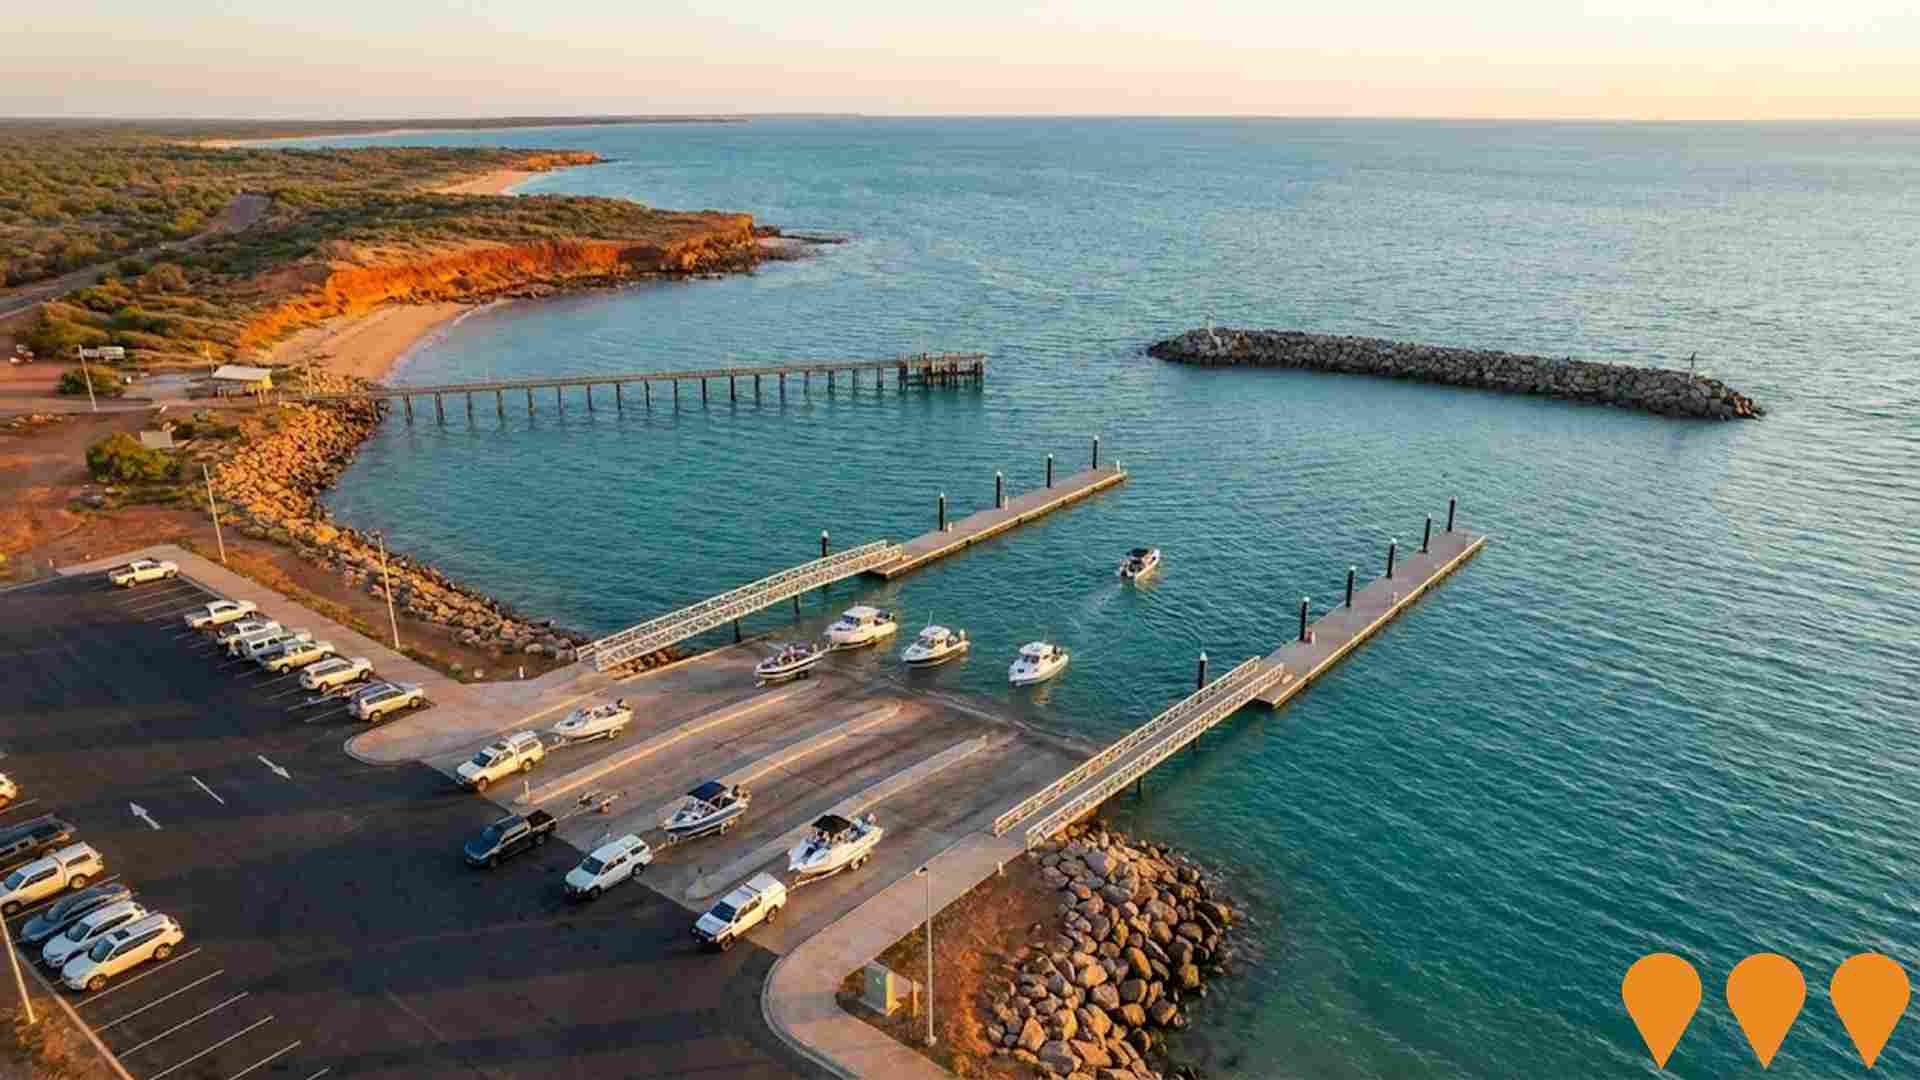
Proposed construction of a safe and accessible boating facility at the existing boat ramp site at Entrance Point, Broome. The project, led by the Department of Transport, is designed to address safety and access issues due to large tides, strong currents, waves, and wind. The design includes a four-lane boat ramp, two finger jetties, two groynes, an offshore breakwater, and associated public amenity infrastructure. The approvals process is currently on hold due to new heritage considerations raised during public submissions in 2021, and the proponent continues to engage with Traditional Owners to refine the concept.
Walmanyjun Cable Beach Foreshore Redevelopment
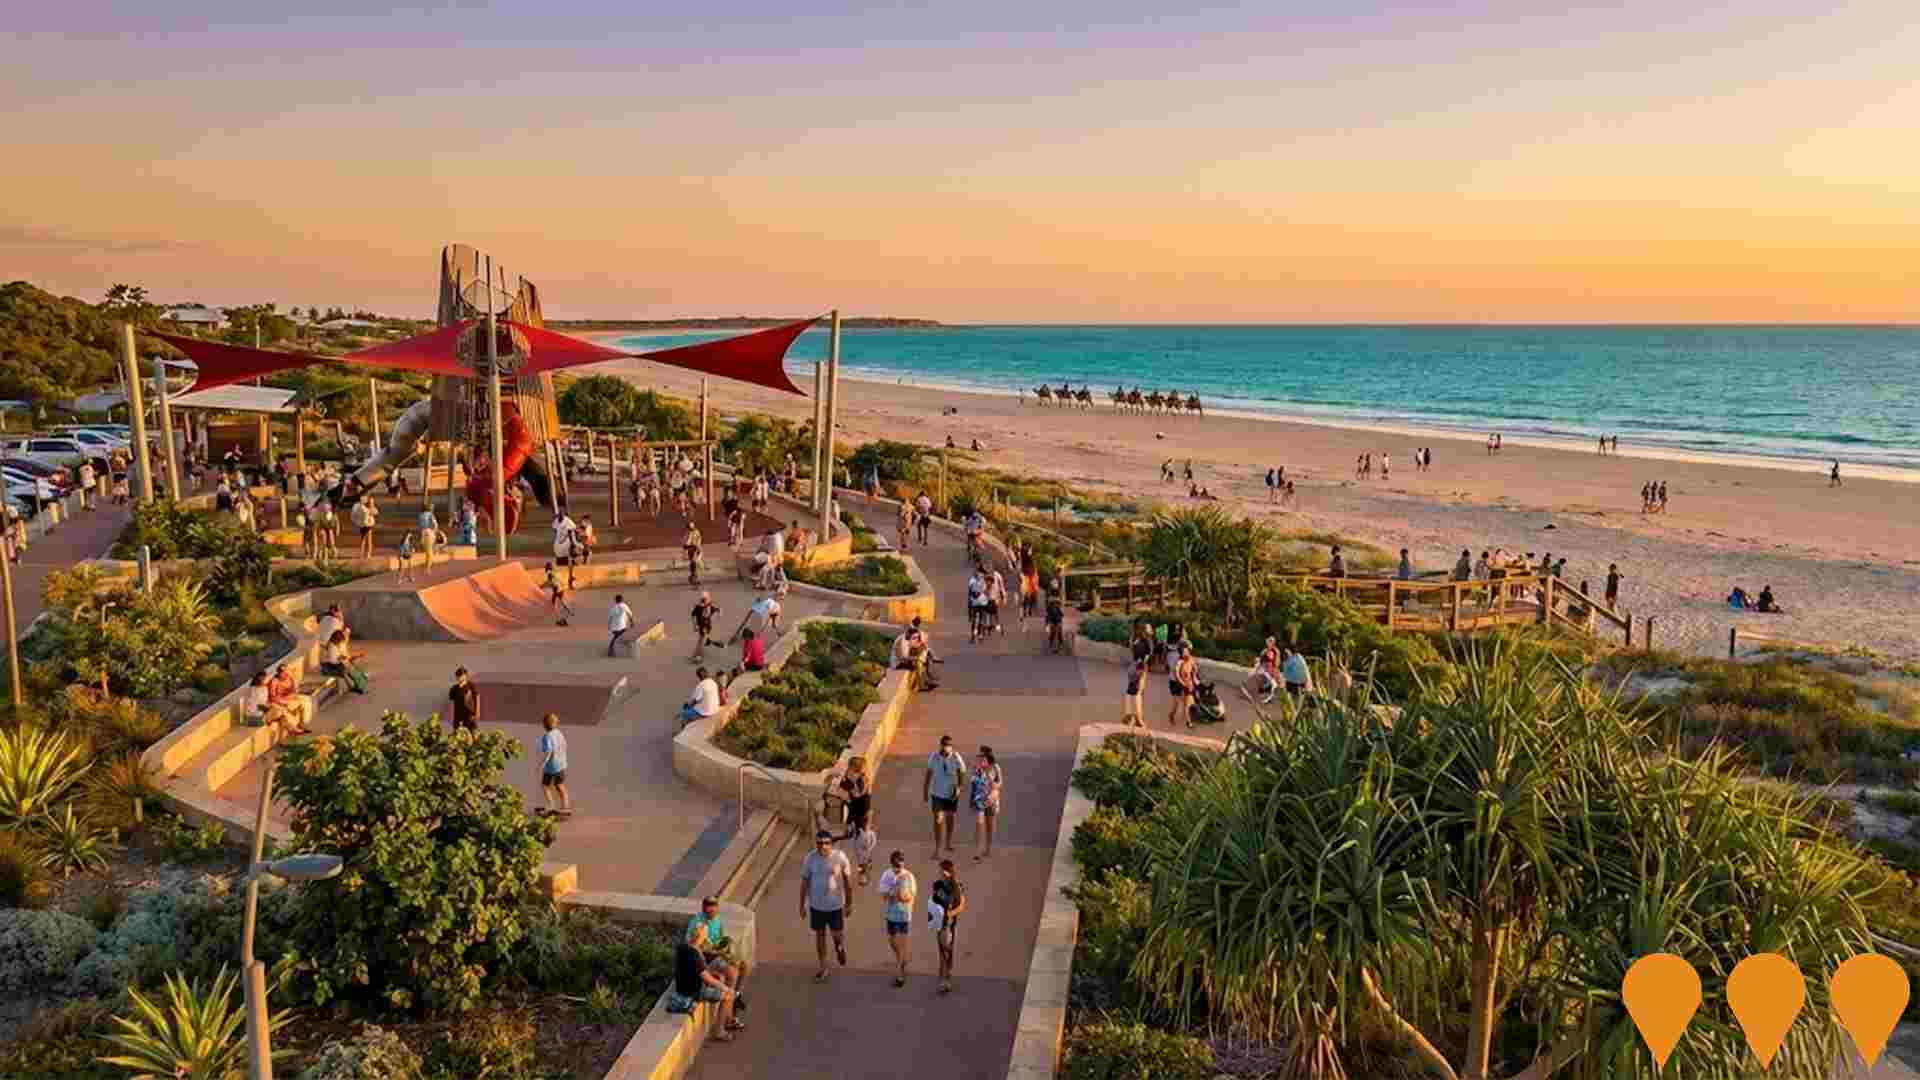
Once-in-a-generation transformation of the iconic Walmanyjun Cable Beach foreshore into a world-class waterfront precinct. Stage 1 (Southern Precinct) completed in May 2025 and officially opened in June 2025, delivering dune restoration, new beach access stairs/ramps, youth space with basketball court and skate park, upgraded car park, promenade, and improved drainage. Stage 2 (Northern and Central Precincts) underway since June 2025, including community plaza, water splash park, inclusive playground, amphitheatre, enhanced event spaces, additional beach access, coastal protection, and shaded amenities. Completion targeted for mid-late 2026.
Kimberley Marine Support Base
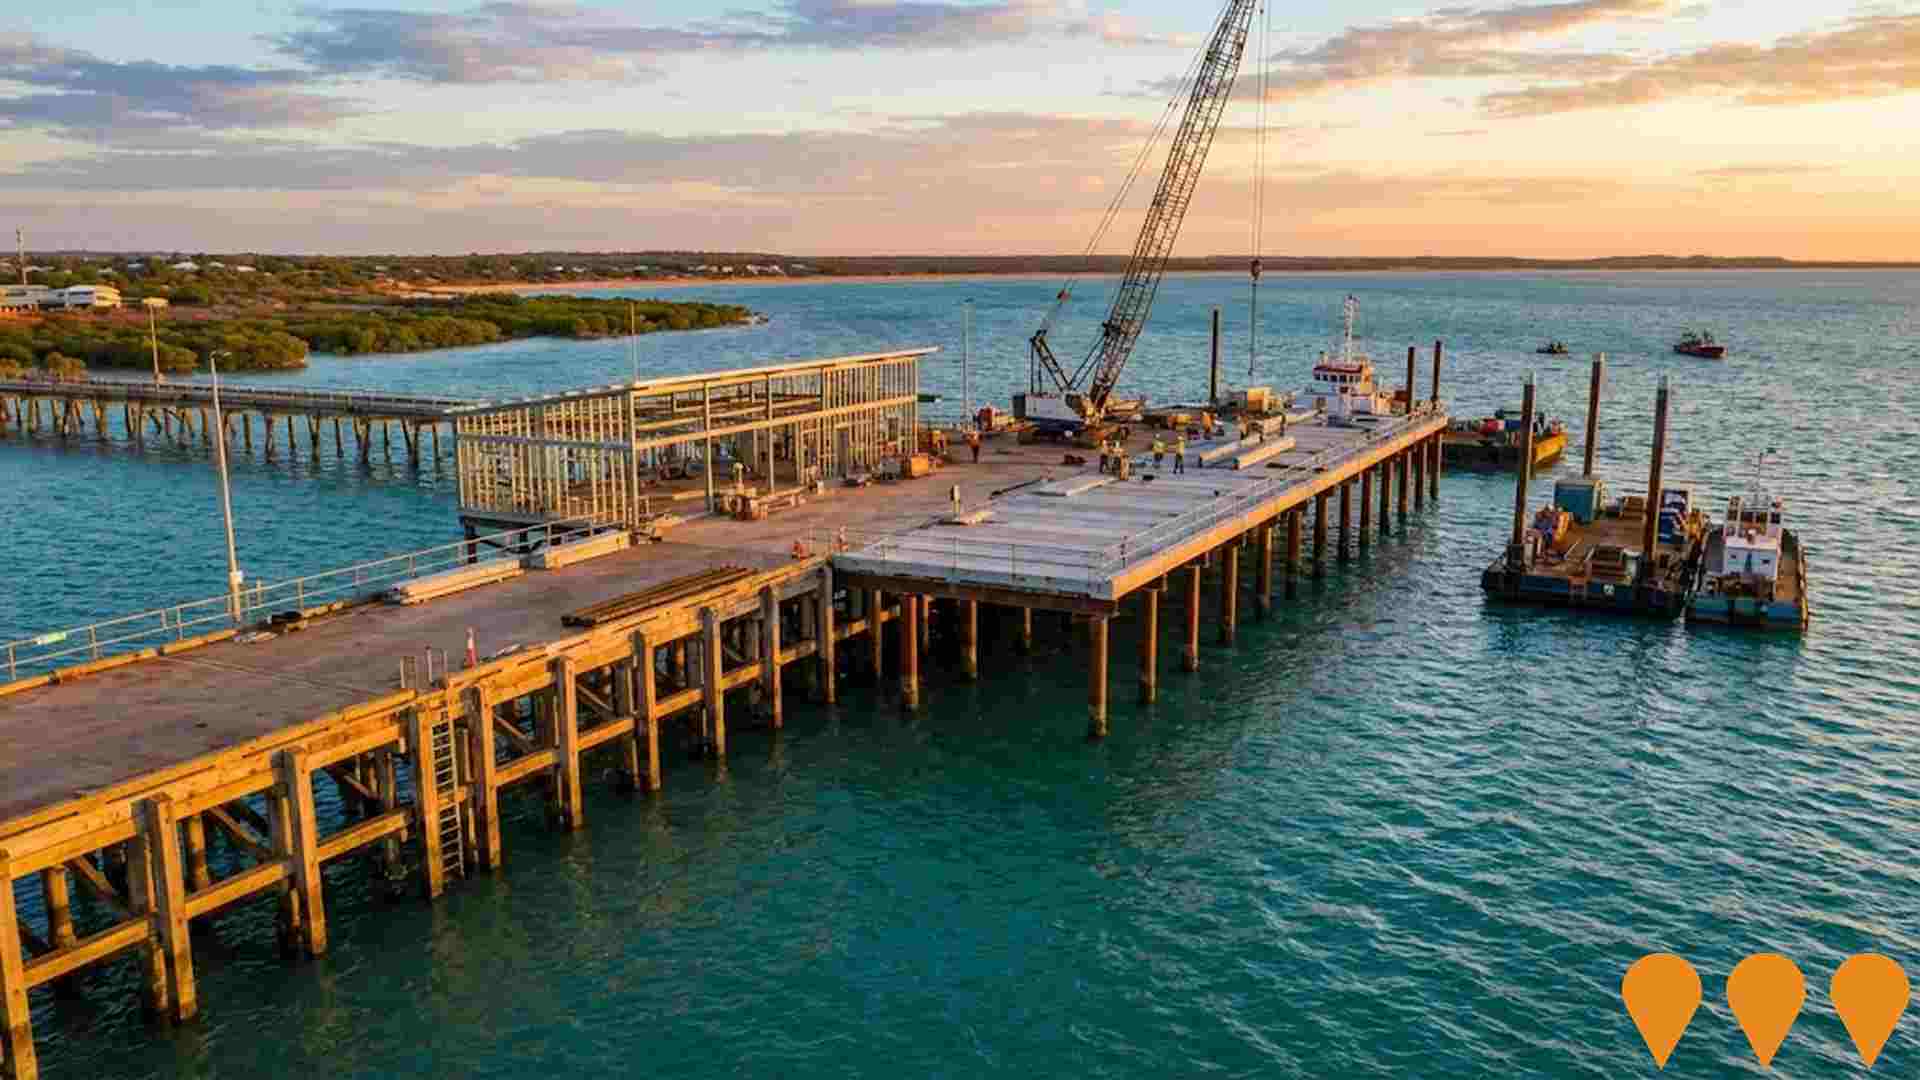
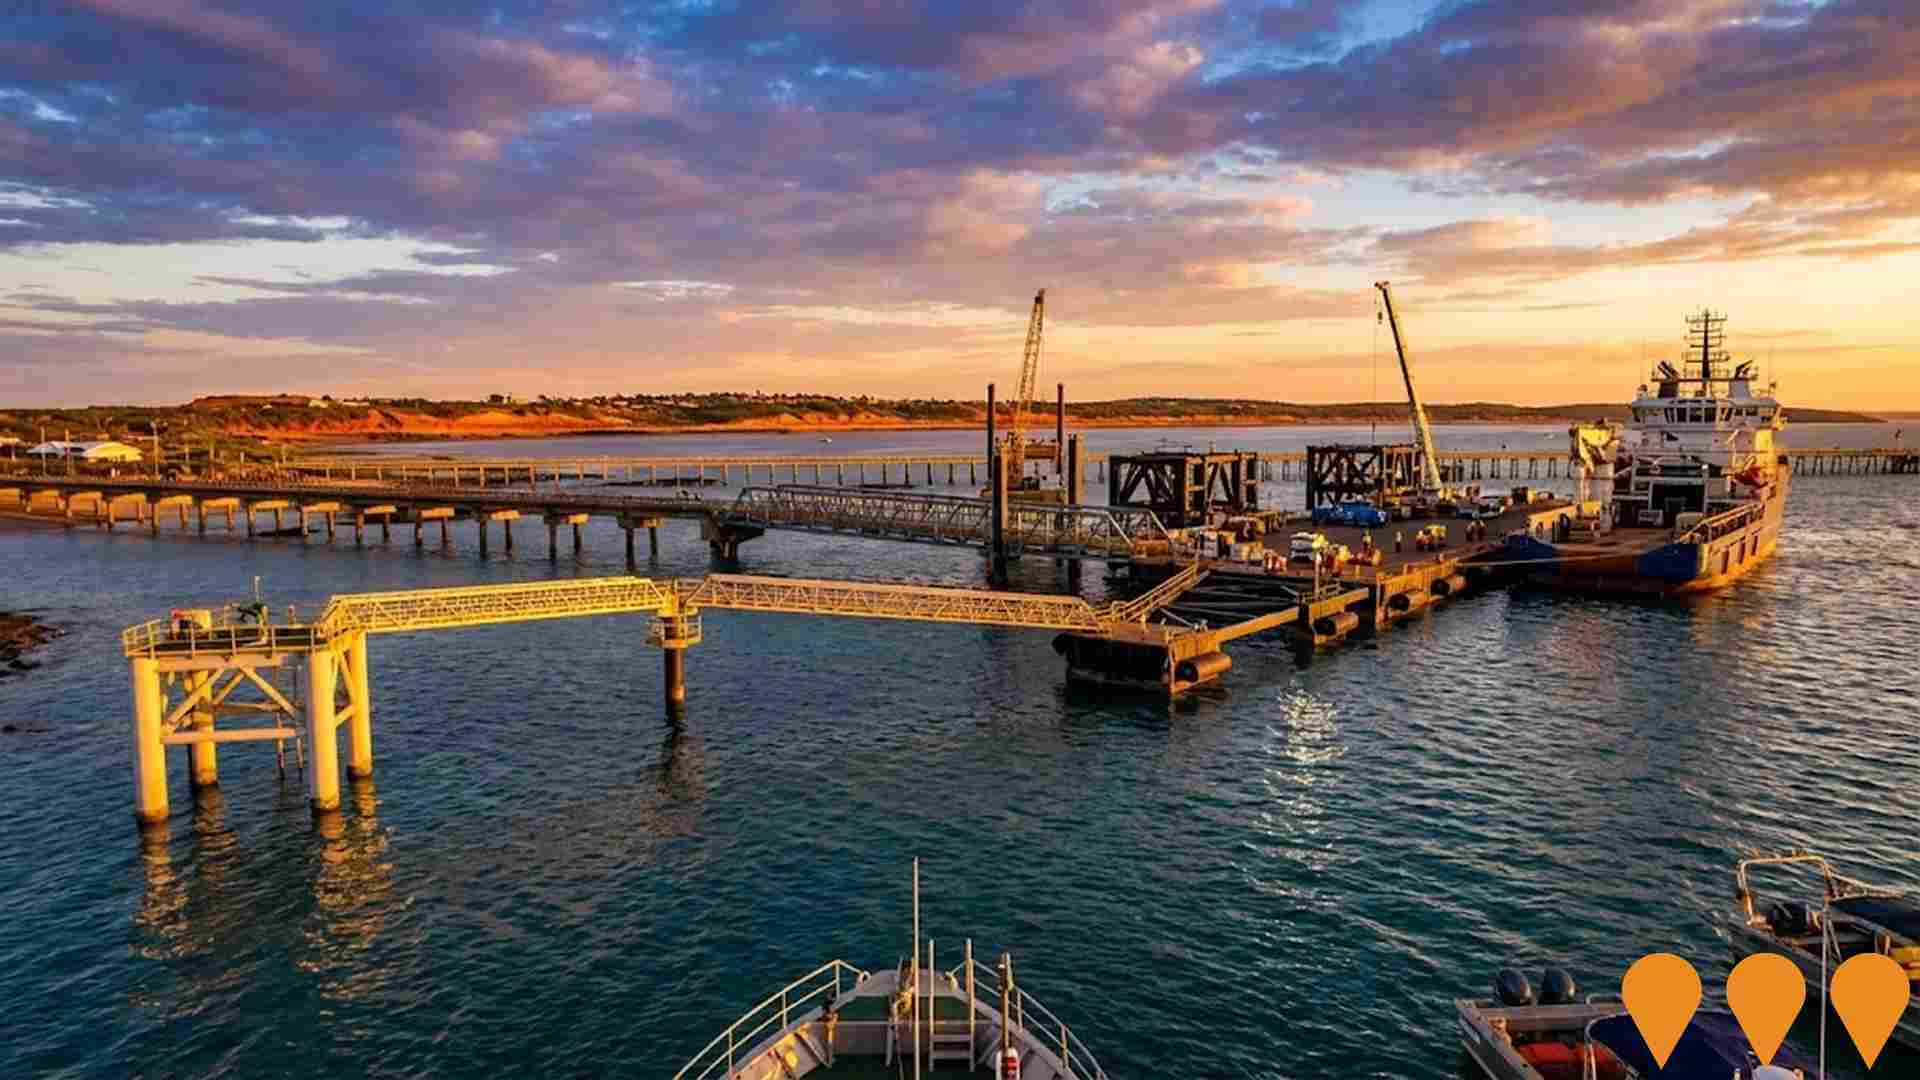
Development of a modern marine logistics facility with a floating wharf connected to a fixed causeway, designed for 24/7 tide-independent operations at the Port of Broome. The facility is expected to service industries including agriculture, general cargo, tourism (cruise ships), and roll-on roll-off cargo, supporting over 500 permanent jobs in Broome and more than 1,500 state-wide. The facility was officially launched on September 12, 2025.
Yinajalan Ngarrungunil Health and Wellbeing Campus
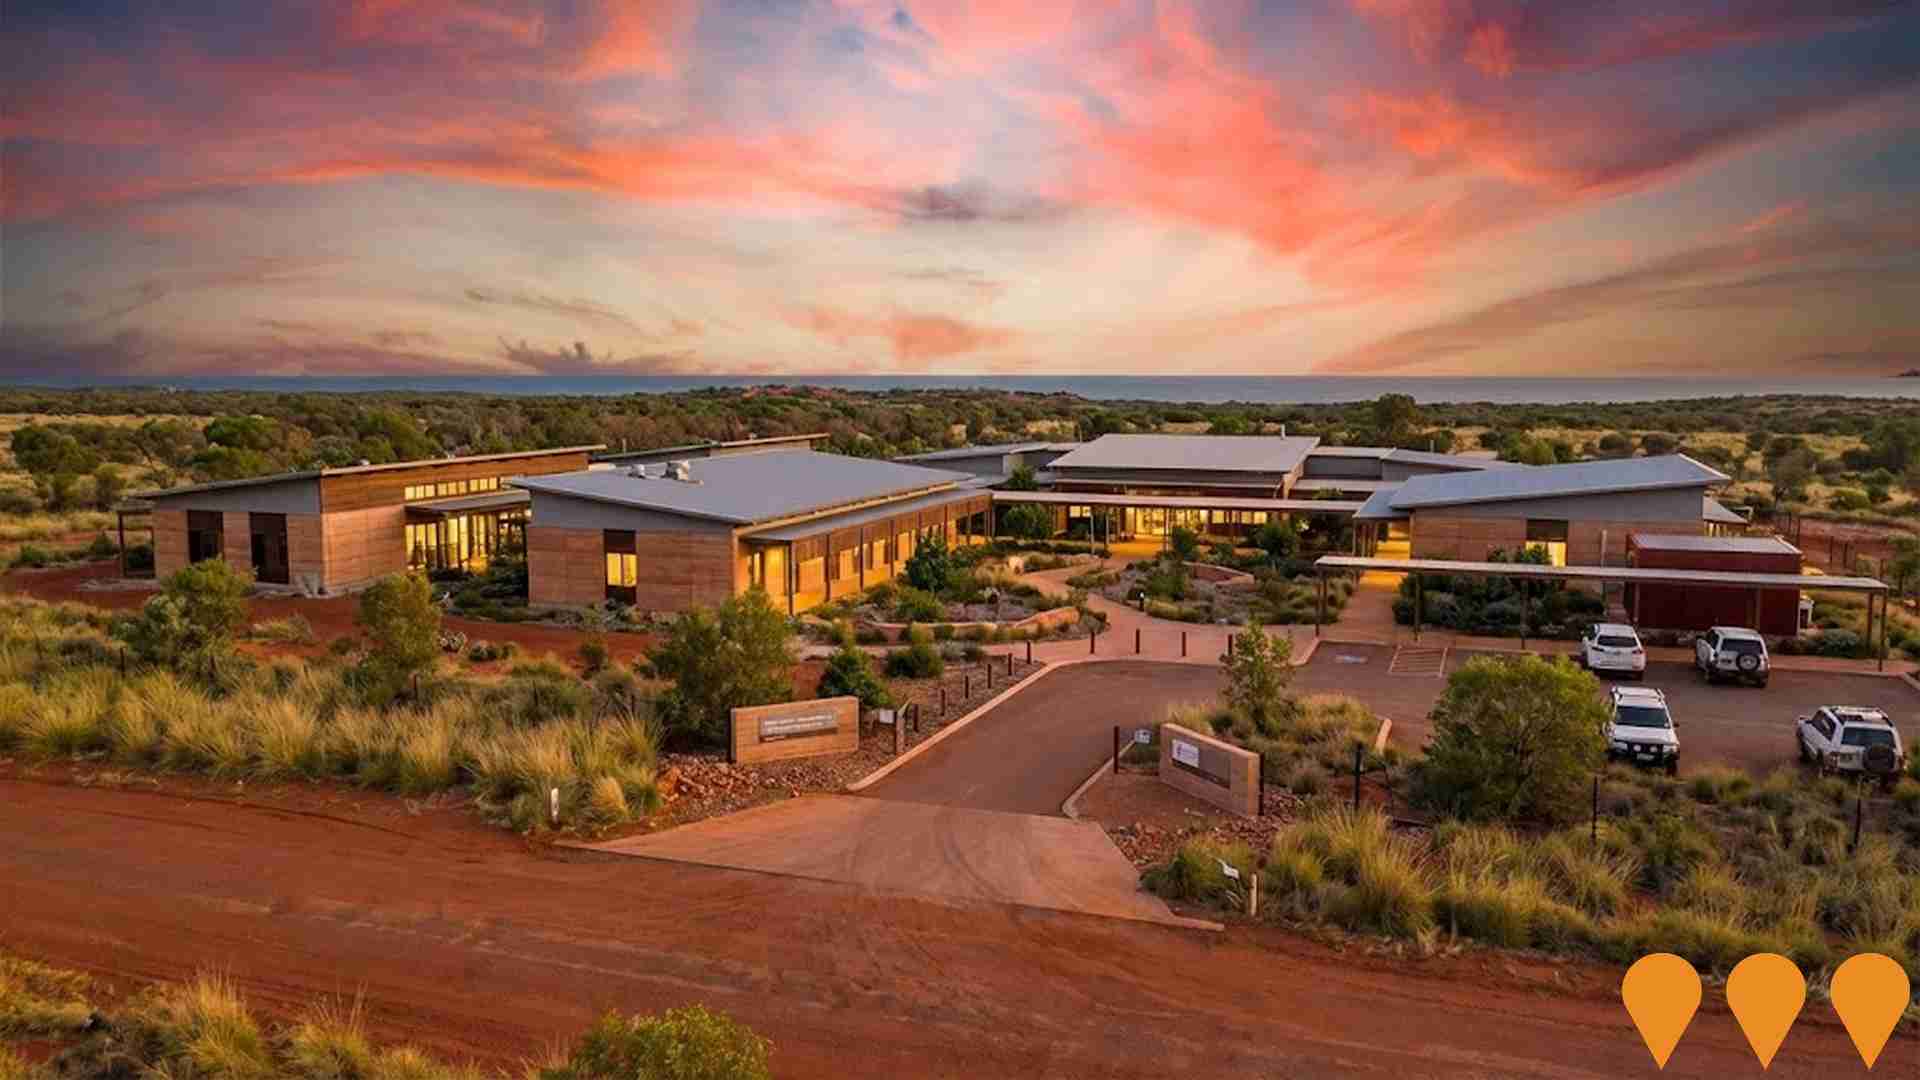
Australian-first health and wellbeing campus focusing on culturally appropriate care for Broome community. $8 million State Recovery Plan funding for subdivision consultancy and civil works. Combines holistic range of facilities including short stay accommodation, renal facilities, and other health tenancies on Yawuru-owned land.
Broome Recreation & Aquatic Centre Redevelopment
Redevelopment of the Broome Recreation & Aquatic Centre (BRAC) into a modern, integrated health, sport and recreation hub. Includes new gym and functional training area, air-conditioned indoor playground (ages 1-6), upgraded creche, gender-neutral change rooms with family facilities, multi-purpose room, additional squash court with viewing area, upgraded cafe, accessible reception foyer, and new administration offices. Refurbishment of existing dry facilities to complement the aquatic area. Estimated cost $22.3 million.

Employment
Employment conditions in Roebuck face significant challenges, ranking among the bottom 10% of areas assessed nationally
Roebuck has a diverse workforce with representation across white and blue collar jobs, particularly in essential services sectors. The unemployment rate was 16.7% as of September 2025.
There were 845 residents employed at this time, with an unemployment rate 13.5 percentage points higher than the Rest of WA's rate of 3.3%. Workforce participation in Roebuck is lower at 47.0%, compared to the Rest of WA's 59.4%. The leading employment industries among Roebuck residents are education & training, agriculture, forestry & fishing, and accommodation & food. The area has a strong specialization in education & training, with an employment share twice that of the regional level.
Conversely, mining is under-represented, with only 3.1% of Roebuck's workforce compared to 11.7% in Rest of WA. Analysis of SALM and ABS data from September 2024 to September 2025 shows a labour force increase of 0.8% in Roebuck, accompanied by a 3.4% employment decline, leading to a rise in unemployment rate by 3.6 percentage points. In contrast, Rest of WA saw employment growth of 1.4% and labour force growth of 1.2%, with a slight drop in unemployment rate. Jobs and Skills Australia's national employment forecasts from May-25 indicate potential future demand within Roebuck. National employment is projected to grow by 6.6% over five years and 13.7% over ten years, but growth rates vary significantly between industry sectors. Applying these projections to Roebuck's employment mix suggests local employment should increase by 5.5% over five years and 12.0% over ten years.
Frequently Asked Questions - Employment
Income
Income levels align closely with national averages, indicating typical economic conditions for Australian communities according to AreaSearch analysis
According to AreaSearch's aggregation of latest postcode level ATO data released for financial year ending June 2022, Roebuck SA2 had a median income among taxpayers of $63,024 with the average level standing at $72,612. This was well above national averages of $57,323 and $71,163 for Rest of WA respectively. Based on Wage Price Index growth of 14.2% from financial year ending June 2022 to September 2025, estimated incomes would be approximately $71,973 (median) and $82,923 (average). Census data shows household, family and personal incomes in Roebuck fall between the 2nd and 9th percentiles nationally. Income brackets indicate that 27.1% of locals (724 people) predominantly earn within the $800 - 1,499 category, unlike regional trends where 31.1% fall within the $1,500 - 2,999 range. Housing costs are modest with 89.4% of income retained, resulting in total disposable income ranking at just the 15th percentile nationally.
Frequently Asked Questions - Income
Housing
Roebuck is characterized by a predominantly suburban housing profile, with above-average rates of outright home ownership
Roebuck's dwelling structure, as per the latest Census, consisted of 85.7% houses and 14.3% other dwellings (semi-detached, apartments, 'other' dwellings). In comparison, Non-Metro WA had 79.3% houses and 20.7% other dwellings. Home ownership in Roebuck was 16.8%, with mortgaged dwellings at 9.5% and rented ones at 73.7%. The median monthly mortgage repayment was $2,167, matching Non-Metro WA's average. The median weekly rent figure was $100, compared to Non-Metro WA's $200. Nationally, Roebuck's mortgage repayments were higher at $2,167 versus Australia's average of $1,863, while rents were lower at $100 compared to the national figure of $375.
Frequently Asked Questions - Housing
Household Composition
Roebuck has a typical household mix, with a higher-than-average median household size
Family households account for 73.0% of all households, including 29.8% couples with children, 19.4% couples without children, and 20.6% single parent families. Non-family households constitute the remaining 27.0%, with lone person households at 24.5% and group households comprising 2.7%. The median household size is 3.0 people, which is larger than the Rest of WA average of 2.8.
Frequently Asked Questions - Households
Local Schools & Education
Roebuck faces educational challenges, with performance metrics placing it in the bottom quartile of areas assessed nationally
The area has lower university qualification rates than the Australian average, with 15.9% compared to 30.4%. Bachelor degrees are the most common at 11.5%, followed by postgraduate qualifications (2.6%) and graduate diplomas (1.8%). Vocational credentials are held by 31.7% of residents aged 15+, with advanced diplomas at 7.6% and certificates at 24.1%. Educational participation is high, with 32.0% currently enrolled in formal education, including 17.7% in primary, 8.9% in secondary, and 1.2% in tertiary education.
Educational participation is notably high, with 32.0% of residents currently enrolled in formal education. This includes 17.7% in primary education, 8.9% in secondary education, and 1.2% pursuing tertiary education.
Frequently Asked Questions - Education
Schools Detail
Nearby Services & Amenities
Transport
No public transport data available for this catchment area.
Frequently Asked Questions - Transport
Transport Stops Detail
Health
Roebuck's residents boast exceedingly positive health performance metrics with very low prevalence of common health conditions across all age groups
Roebuck shows excellent health outcomes with low prevalence of common conditions across all ages. Private health cover is high at approximately 56% (~1,497 people), compared to Rest of WA's 53.4%.
Asthma and diabetes are most common, affecting 4.1% and 3.9%, respectively. 82.5% report no medical ailments, compared to Rest of WA's 79.9%. Seniors aged 65+ comprise 7.6% (203 people), with health outcomes broadly matching the general population profile.
Frequently Asked Questions - Health
Cultural Diversity
Roebuck ranks below the Australian average when compared to other local markets across a number of language and cultural background related metrics
Roebuck's population was found to be less diverse culturally, with 85.4% being citizens, 90.7% born in Australia, and 76.5% speaking English only at home. Christianity was the predominant religion in Roebuck, comprising 64.4%, compared to the regional average of 48.7%. The top three ancestry groups were Australian Aboriginal (54.6%), English (13.5%), and Australian (12.6%).
Notably, Spanish (0.7%) was overrepresented compared to the region's 0.3%, while New Zealand (0.6%) and French (0.4%) had similar or slightly lower representation than the regional averages of 0.6% and 0.5% respectively.
Frequently Asked Questions - Diversity
Age
Roebuck hosts a very young demographic, ranking in the bottom 10% of areas nationwide
Roebuck's median age is 30, which is younger than Rest of WA's figure of 40 and Australia's national average of 38 years. Compared to Rest of WA, Roebuck has a higher proportion of residents aged 25-34 (18.3%) but fewer residents aged 75-84 (0.5%). Between the 2021 Census and now, the population aged 35-44 has grown from 12.9% to 15.2%, while the 25-34 cohort increased from 16.7% to 18.3%. Conversely, the 75-84 age group declined from 2.3% to 0.5% and the 45-54 group dropped from 12.1% to 10.8%. Population forecasts for 2041 suggest substantial demographic changes in Roebuck. The 25-34 cohort is projected to grow by 33%, adding 162 residents to reach a total of 653. Meanwhile, both the 65-74 and 85+ age groups are expected to see reduced numbers.
