Chart Color Schemes
est. as @ -- *
ABS ERP | -- people | --
2021 Census | -- people
Sales Activity
Curious about local property values? Filter the chart to assess the volume and appreciation (including resales) trends and regional comparisons, or scroll to the map below view this information at an individual property level.
Find a Recent Sale
Sales Detail
Population
Population growth drivers in South Hedland are strong compared to national averages based on AreaSearch's ranking of recent, and medium to long-term trends
South Hedland's population was around 12,730 as of Aug 2025. This reflected an increase of 1,684 people since the 2021 Census, which reported a population of 11,046. The change was inferred from ABS estimates of 12,655 in June 2024 and 27 validated new addresses since the Census date. This resulted in a density ratio of 571 persons per square kilometer. South Hedland's growth of 15.2% since the 2021 census exceeded the national average of 8.6%. Natural growth contributed approximately 56.8% to overall population gains recently, with all migration drivers also positive factors.
AreaSearch adopted ABS/Geoscience Australia projections for each SA2 area released in 2024 based on 2022 data. For areas not covered by this data and post-2032 estimates, AreaSearch used ABS Greater Capital Region projections released in 2023 based on 2022 data. By 2041, South Hedland's population is projected to increase by 1,526 persons, an increase of 11.4% over the 17 years.
Frequently Asked Questions - Population
Development
Recent residential development output has been above average within South Hedland when compared nationally
South Hedland has granted approximately 26 residential properties approval per year. Between FY-21 and FY-25, a total of 131 homes were approved, with an additional one approved so far in FY-26. On average, for every home built over the past five financial years, there have been around 14.2 new residents.
This has led to demand outpacing supply, potentially putting upward pressure on prices and increasing competition among buyers. The average construction value of new properties is $599,000, which is higher than regional norms, reflecting quality-focused development. This financial year, South Hedland has recorded $39.3 million in commercial development approvals, indicating strong commercial development momentum. Compared to the Rest of WA, South Hedland has 84.0% more construction activity per person, offering greater choice for buyers. However, this level is lower than nationally, suggesting market maturity and possible development constraints.
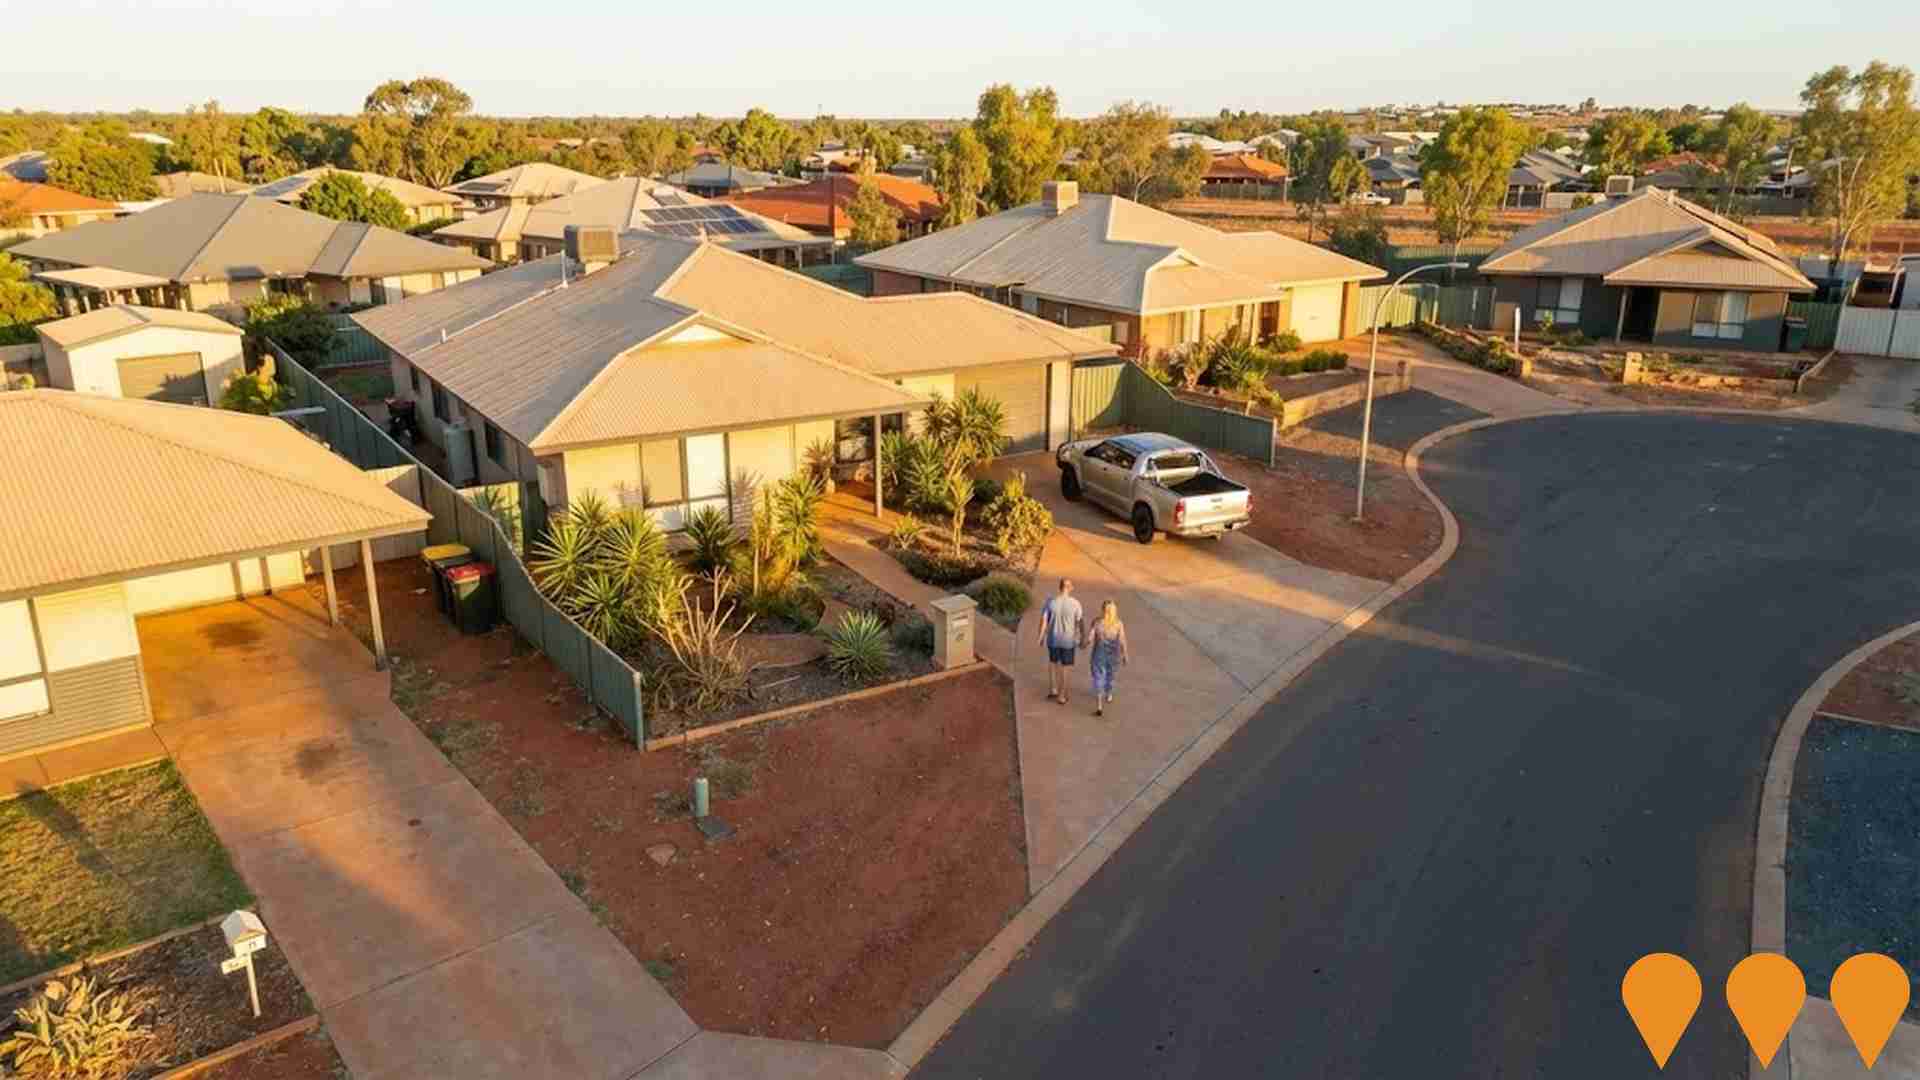
All recent development in South Hedland has been comprised of detached dwellings, maintaining the area's traditional low density character with a focus on family homes appealing to those seeking space. This trend favours detached housing more than current patterns suggest (72.0% at Census), indicating robust demand for family homes despite increasing density pressures. The estimated count of 392 people in the area per dwelling approval reflects its quiet, low activity development environment. Looking ahead, South Hedland is projected to grow by 1,451 residents through to 2041. Development is keeping pace with this projected growth, though buyers may face increasing competition as the population expands.
Frequently Asked Questions - Development
Infrastructure
South Hedland has emerging levels of nearby infrastructure activity, ranking in the 26thth percentile nationally
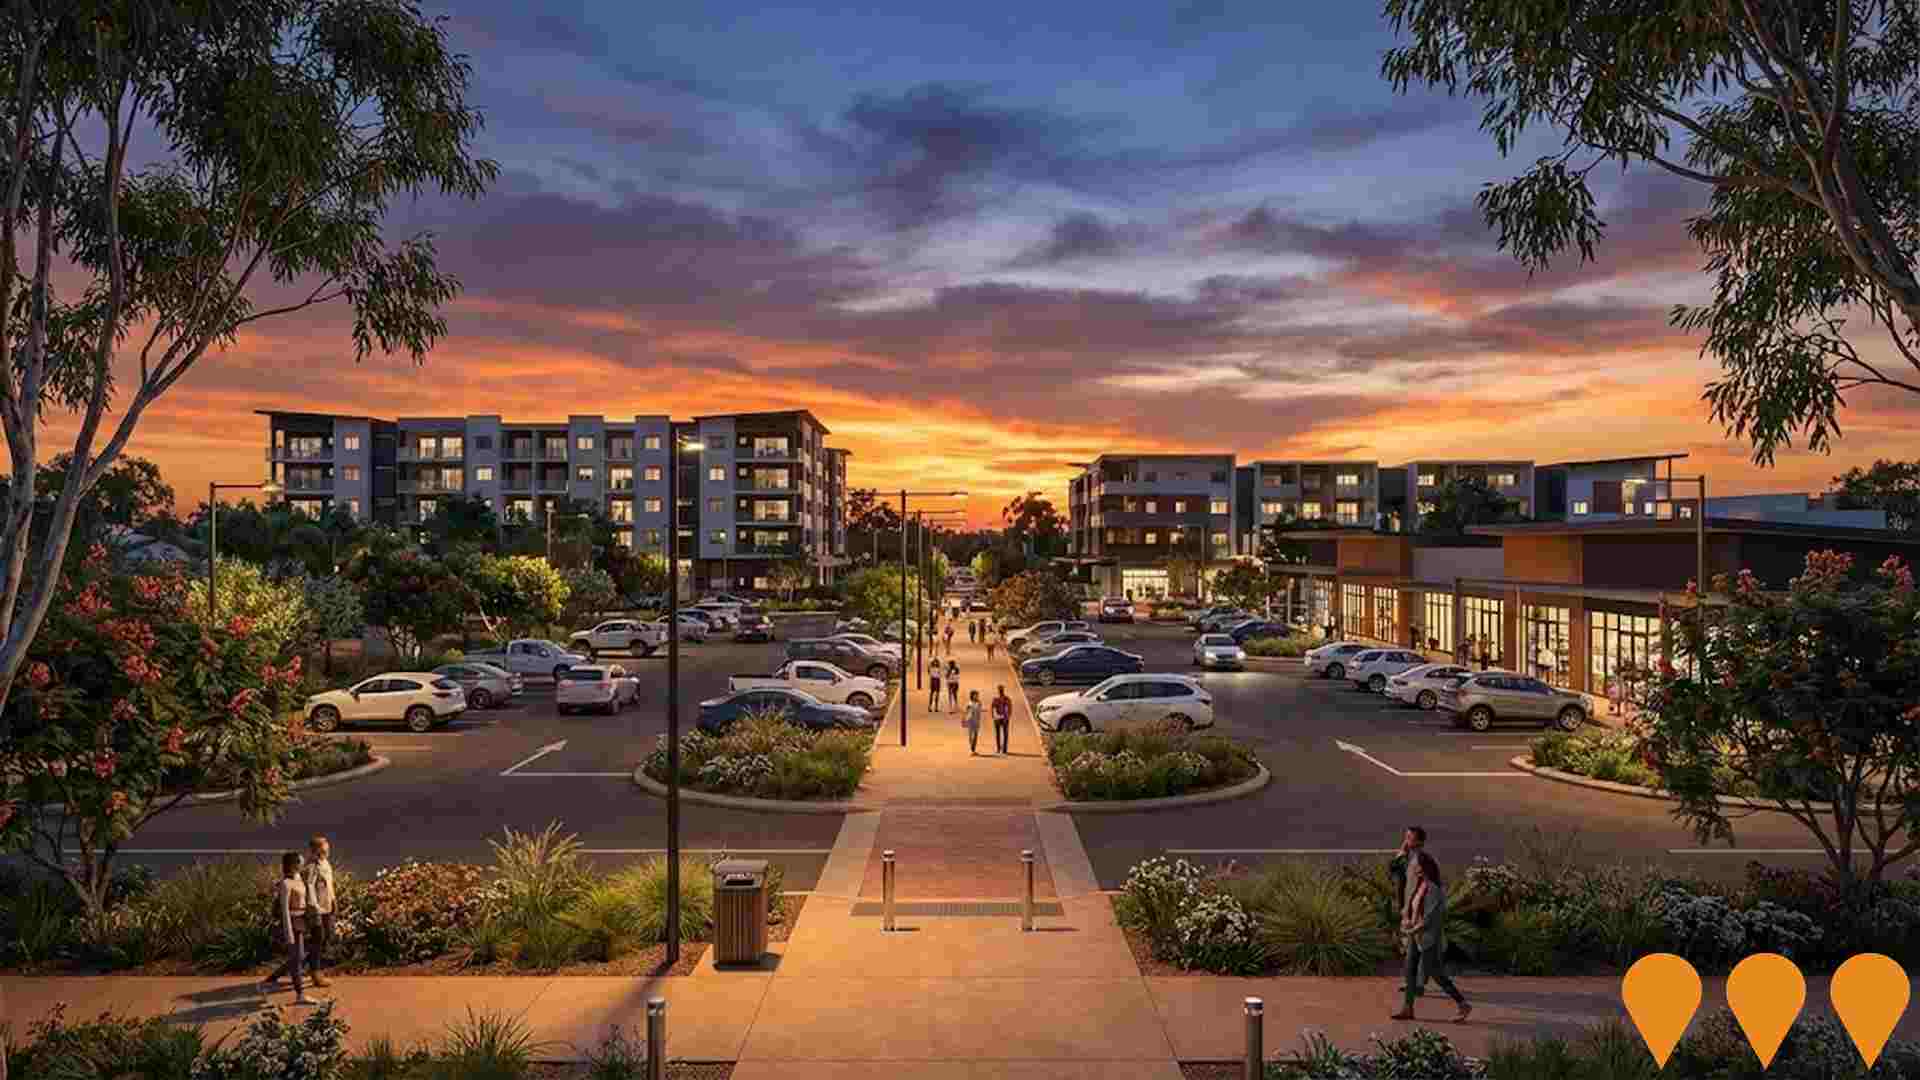
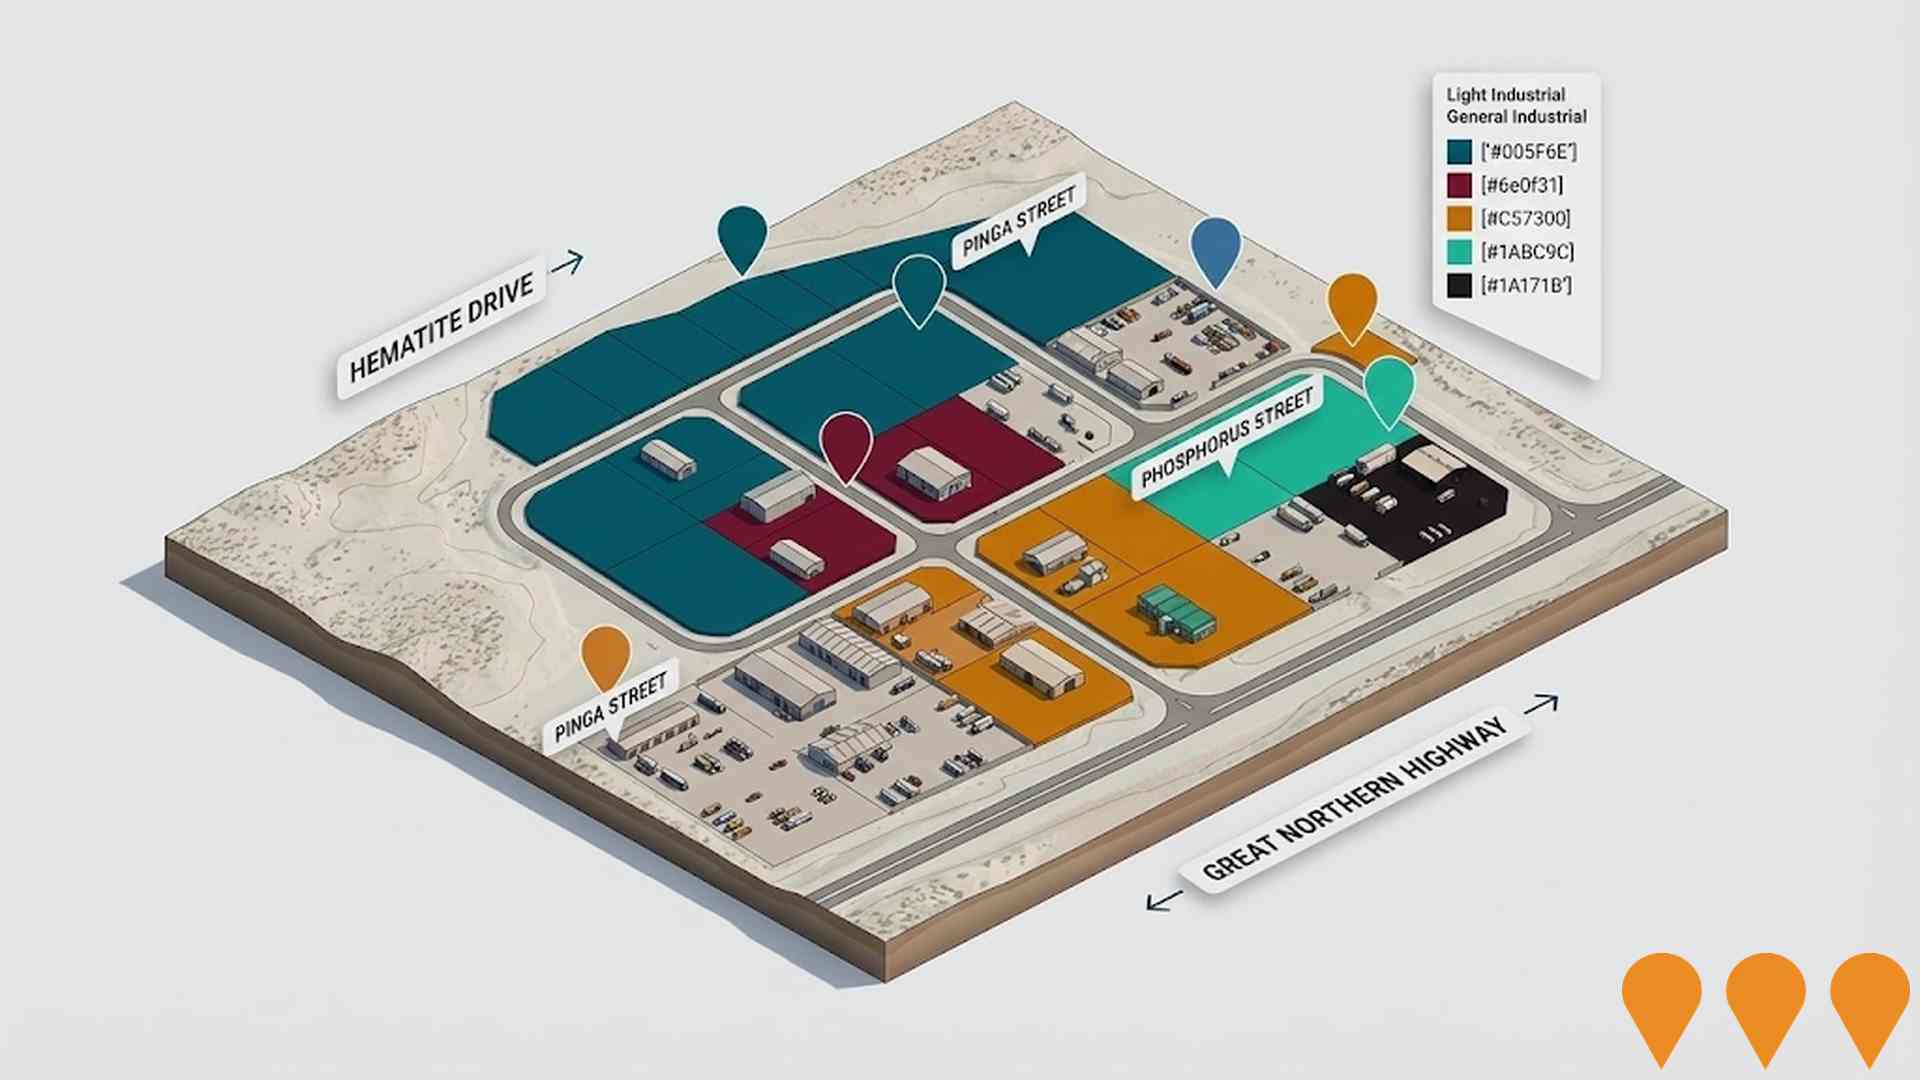
Changes to local infrastructure significantly impact an area's performance. AreaSearch has identified 13 projects likely affecting the region. Notable initiatives include the South Hedland Integrated Sports Hub, South Hedland Tourist Development and Workforce Accommodation Village, South Hedland Town Centre Revitalisation, and South Hedland Service Worker Housing. The following list details those most relevant.
Professional plan users can use the search below to filter and access additional projects.
INFRASTRUCTURE SEARCH
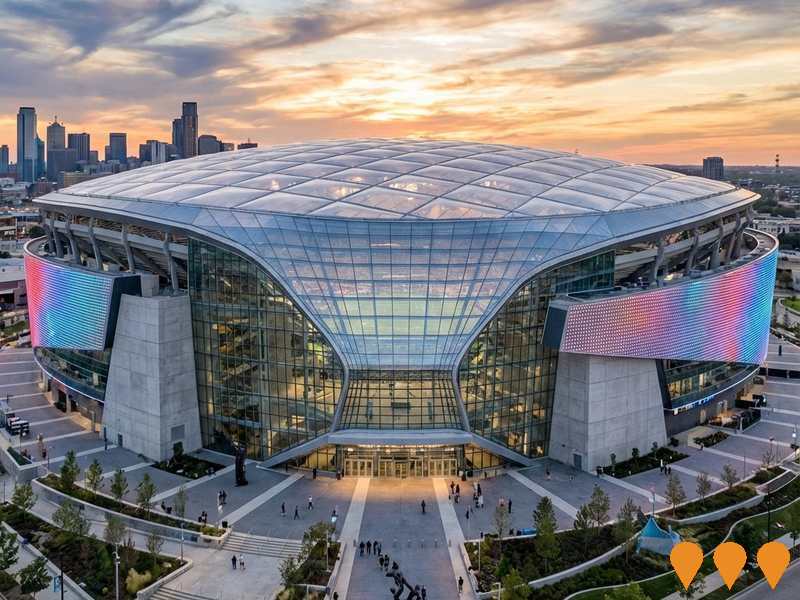
 Denotes AI-based impression for illustrative purposes only, not to be taken as definitive under any circumstances. Please follow links and conduct other investigations from the project's source for actual imagery. Developers and project owners wishing us to use original imagery please Contact Us and we will do so.
Frequently Asked Questions - Infrastructure
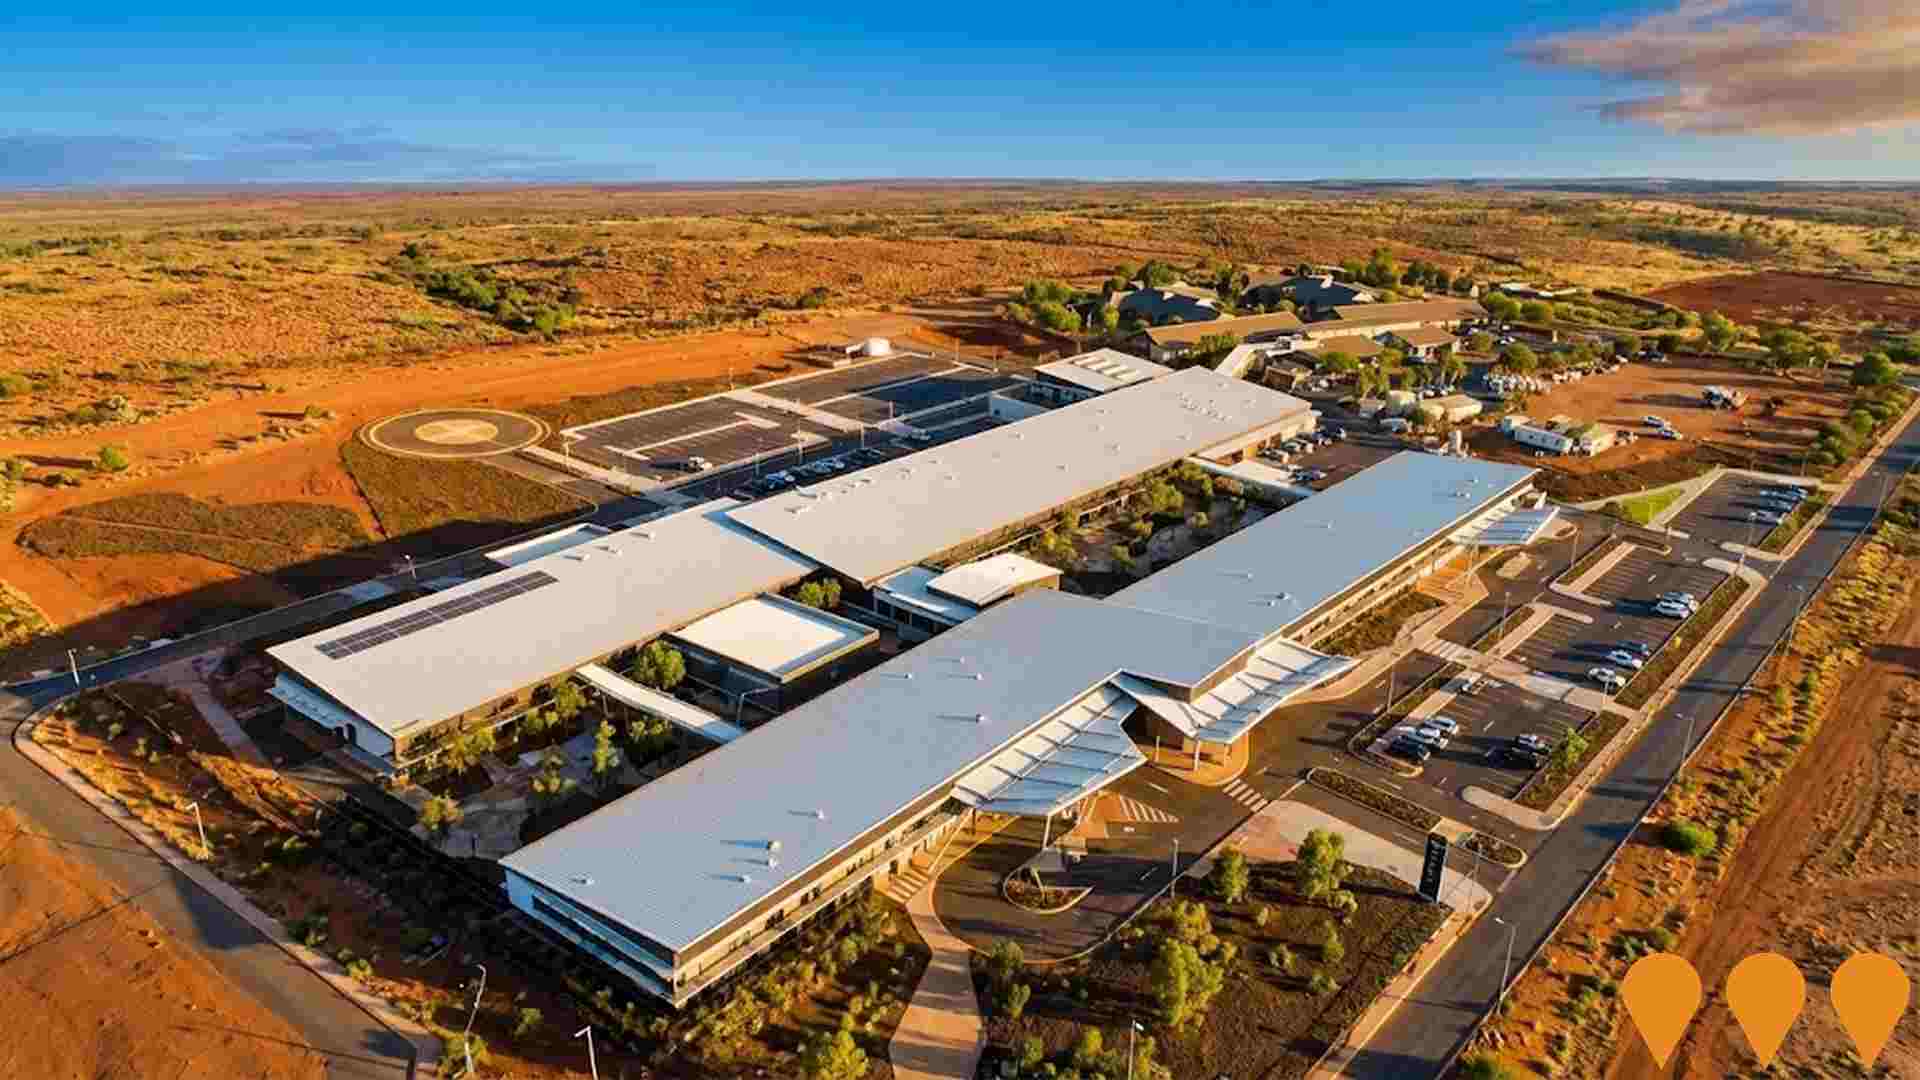
Hedland Health Campus
Modern 12,000sqm single-level health campus on Colebatch Way providing comprehensive inpatient and outpatient services. Features ambulatory care wing, renal dialysis, consultation facilities, medical imaging, pathology services, and allied health services for the Pilbara region.
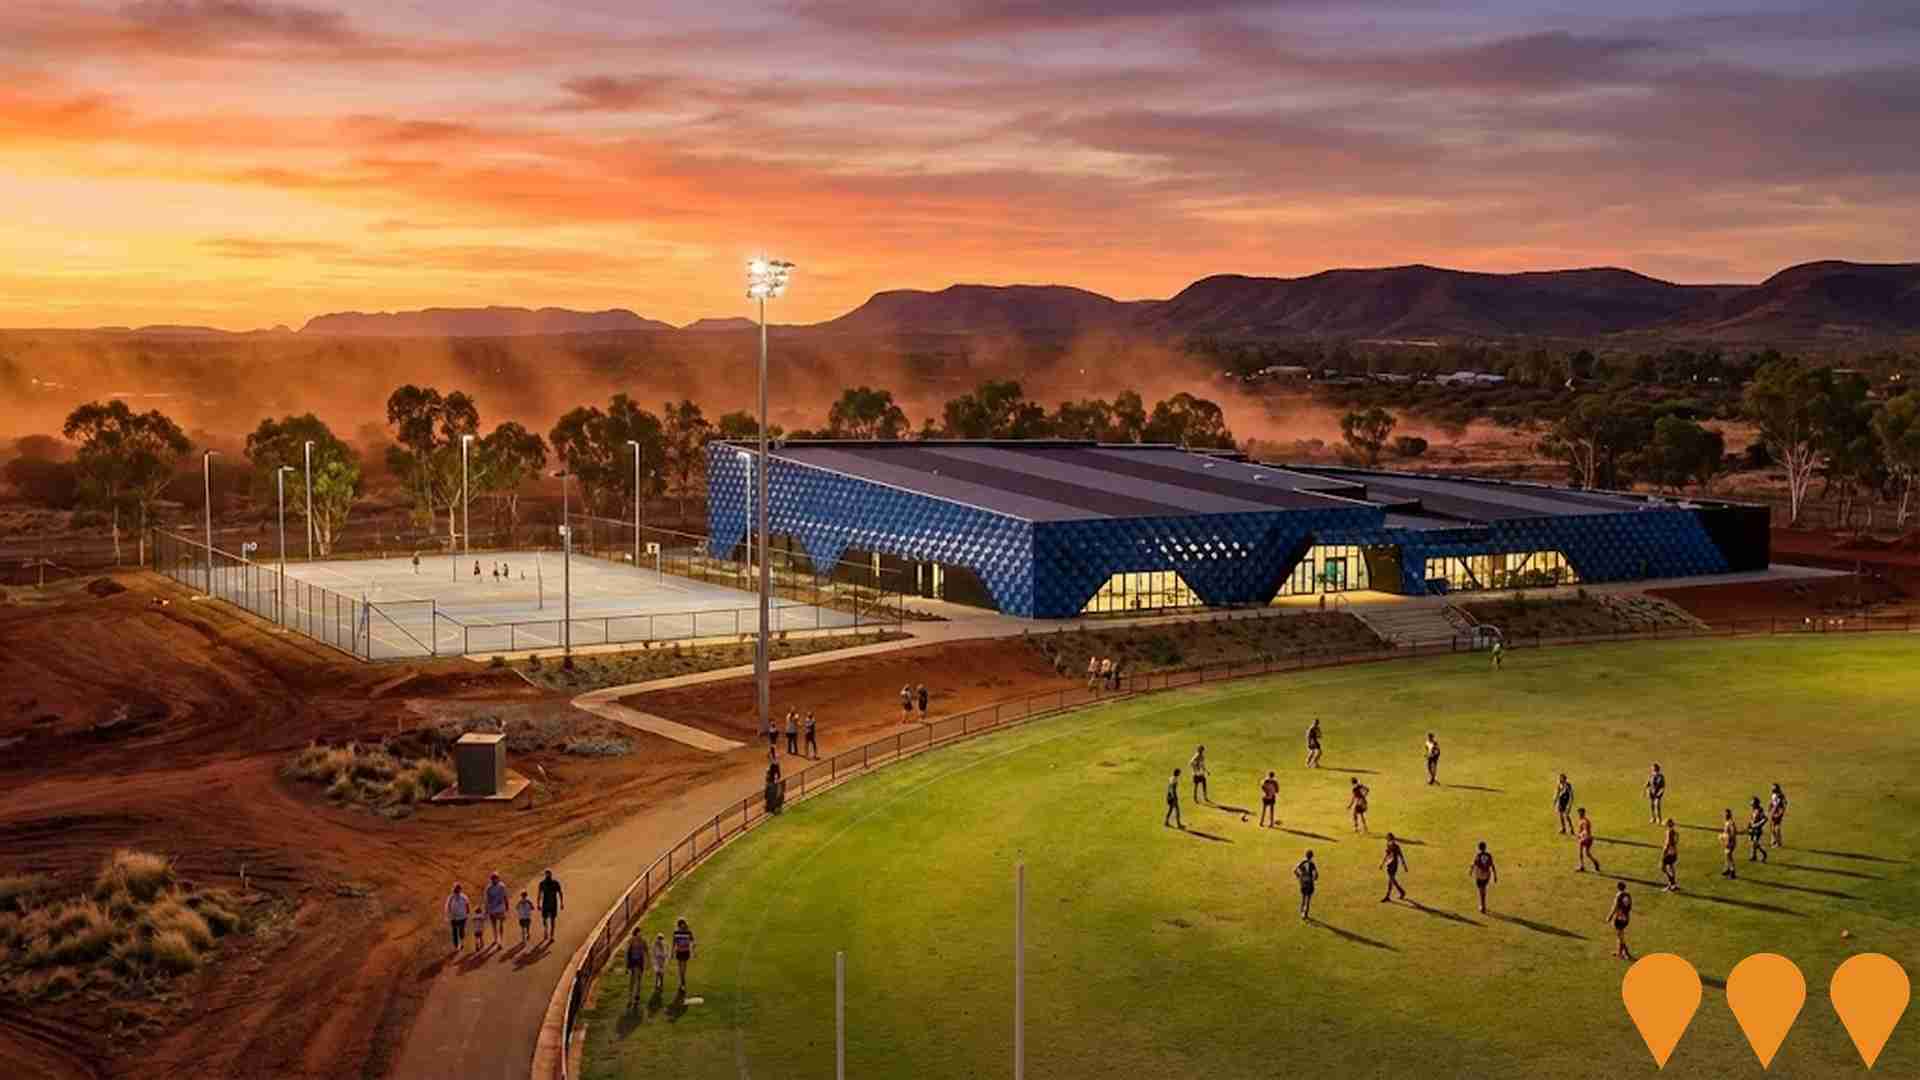
South Hedland Integrated Sports Hub
A $200+ million staged redevelopment delivering a regional aquatic centre, refurbished Wanangkura Stadium, new indoor sports hall, multi-use pavilion, diamond sports fields, covered outdoor courts, upgraded sports fields and extensive parking. Forms the core sporting component of the broader South Hedland Sports and Arts Precinct, addressing critical community recreation needs in the growing Pilbara region.
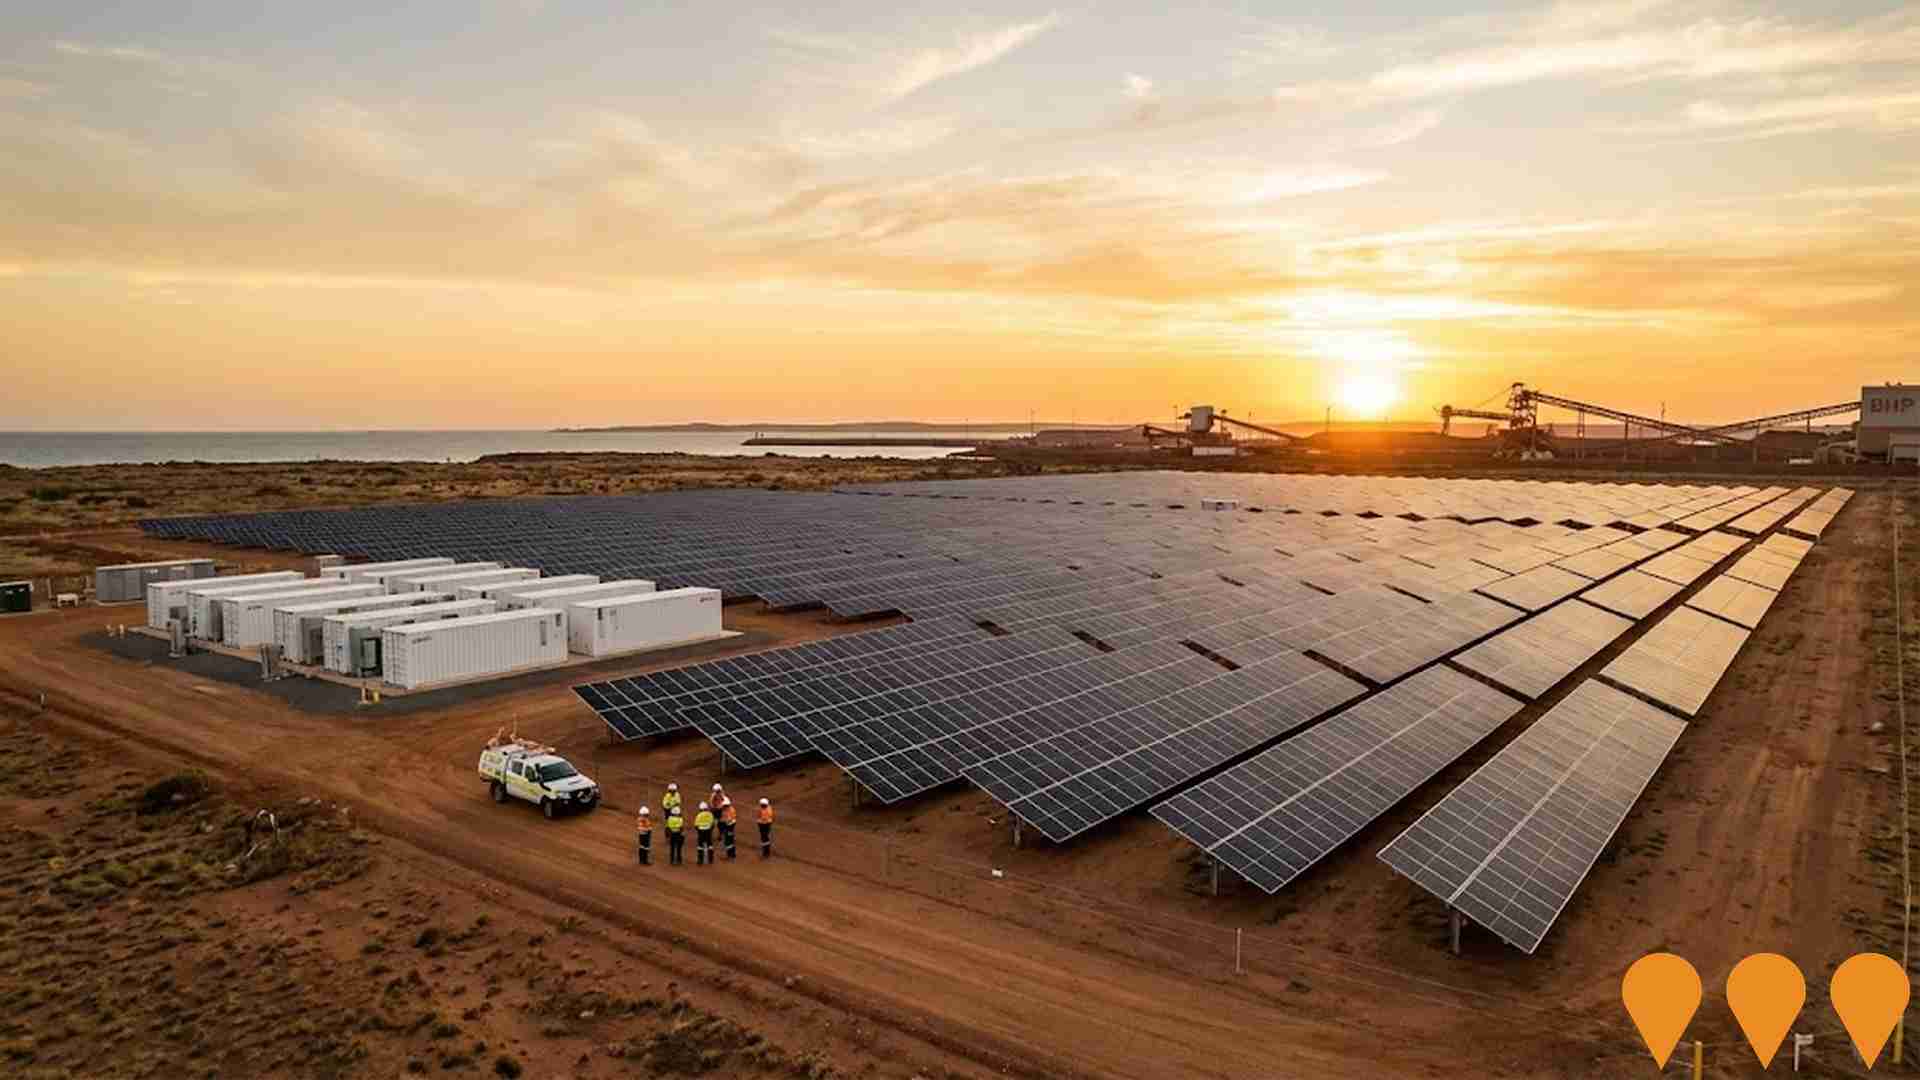
Port Hedland Solar and Battery Project
Australia's first cyclone-resistant coastal solar farm featuring a 45MW solar photovoltaic facility and 35MW/36.7MWh battery energy storage system designed to withstand sustained wind speeds of 288 km/h. The project supplies renewable energy to BHP's iron ore port facilities, expected to halve emissions and provide up to 100% of daytime energy requirements.
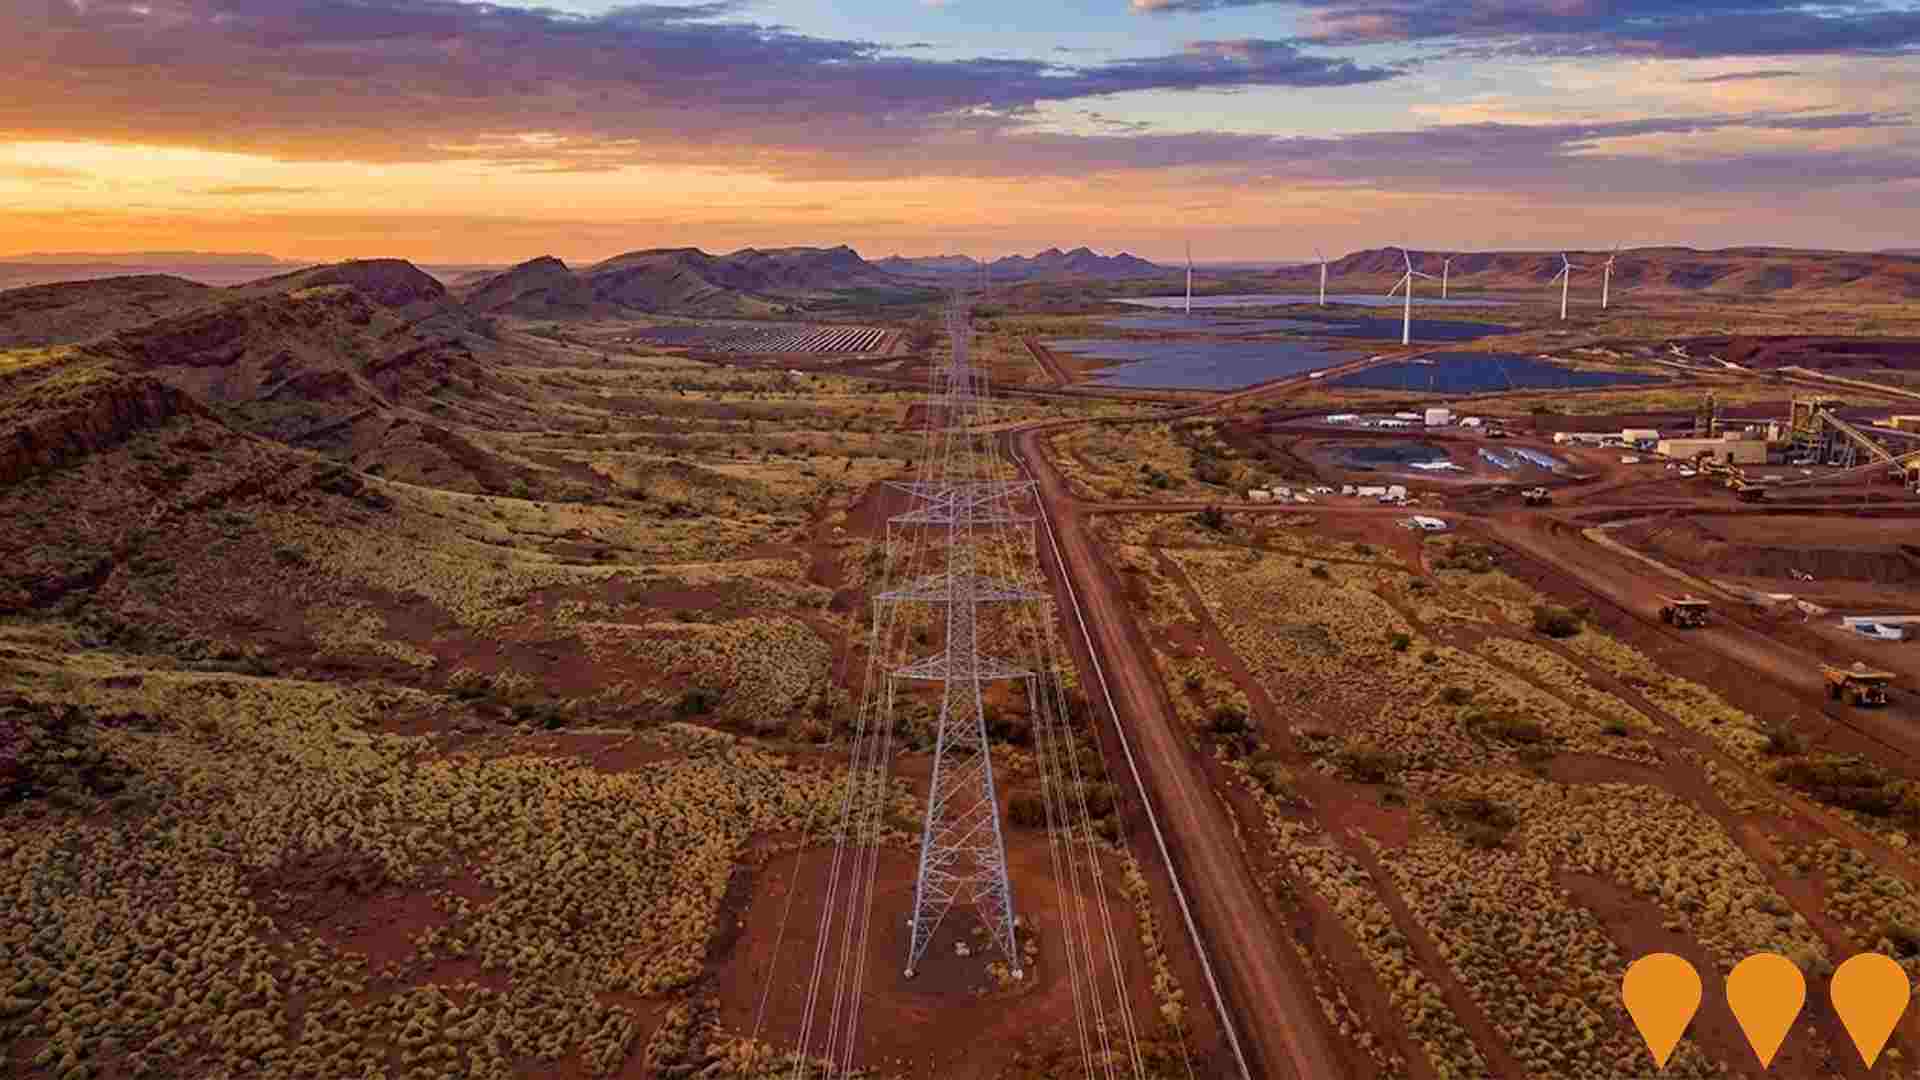
Hamersley Range Corridor
A designated priority common-use transmission infrastructure corridor in the Pilbara, Western Australia, connecting the Boodarie Strategic Industrial Area (SIA) and Port Hedland with the eastern edge of the Hamersley Range. It is a critical component of the Pilbara Energy Transition (PET) Plan, designed to support iron ore and lithium mining, and unlock high-quality wind and solar renewable generation for industrial decarbonisation. APA Group has been awarded Priority Project status for this corridor.
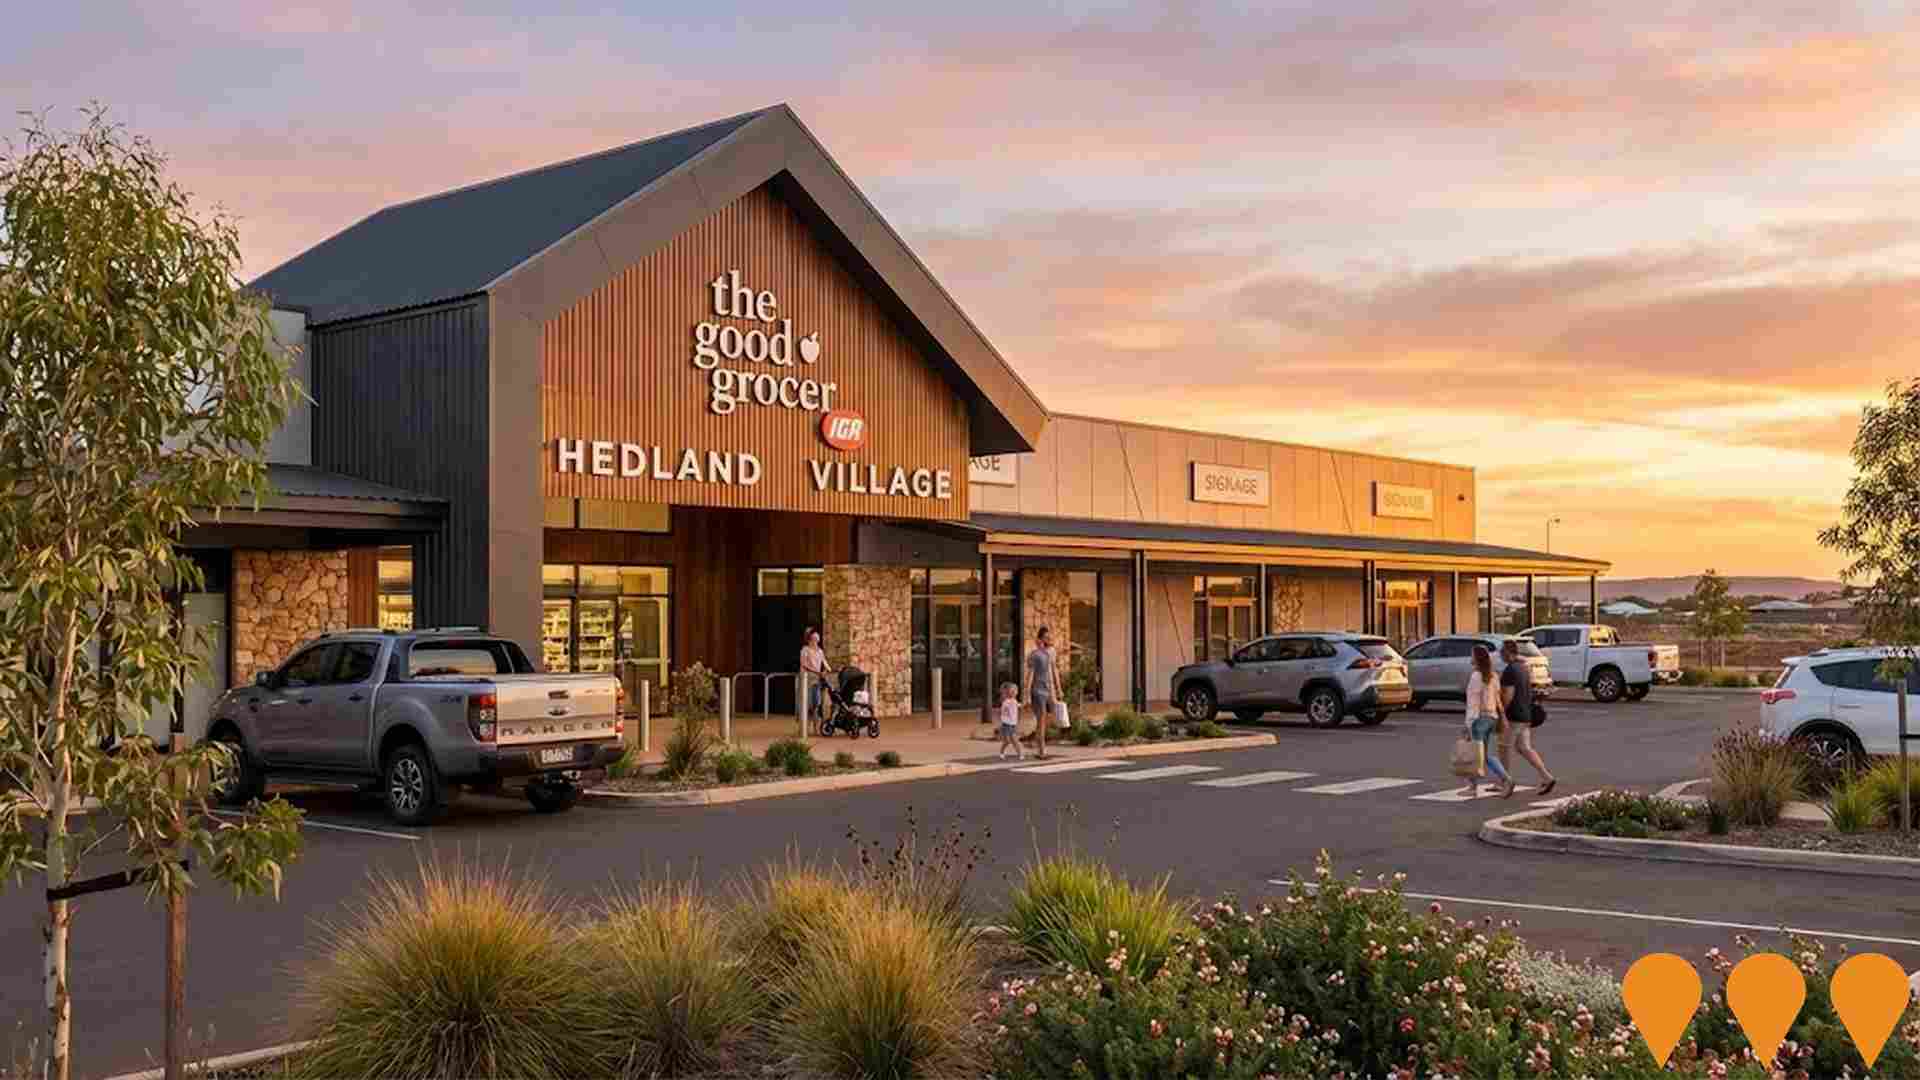
Hedland Village Shopping Centre
A new neighbourhood shopping village on a 1.7 hectare site, anchored by a 1500 sqm The Good Grocer IGA supermarket with about 3500 sqm of additional lettable area. The centre will include a fuel and convenience store, pharmacy, a 130 place childcare centre, fast food outlets such as Hungry Jacks and Subway, a tavern and restaurant, and six additional retail shops. It will provide covered walkways and around 223 parking spaces on Hamilton Road, opposite Wanangkura Stadium and next to Hedland Senior High School, and is planned to open in 2026.
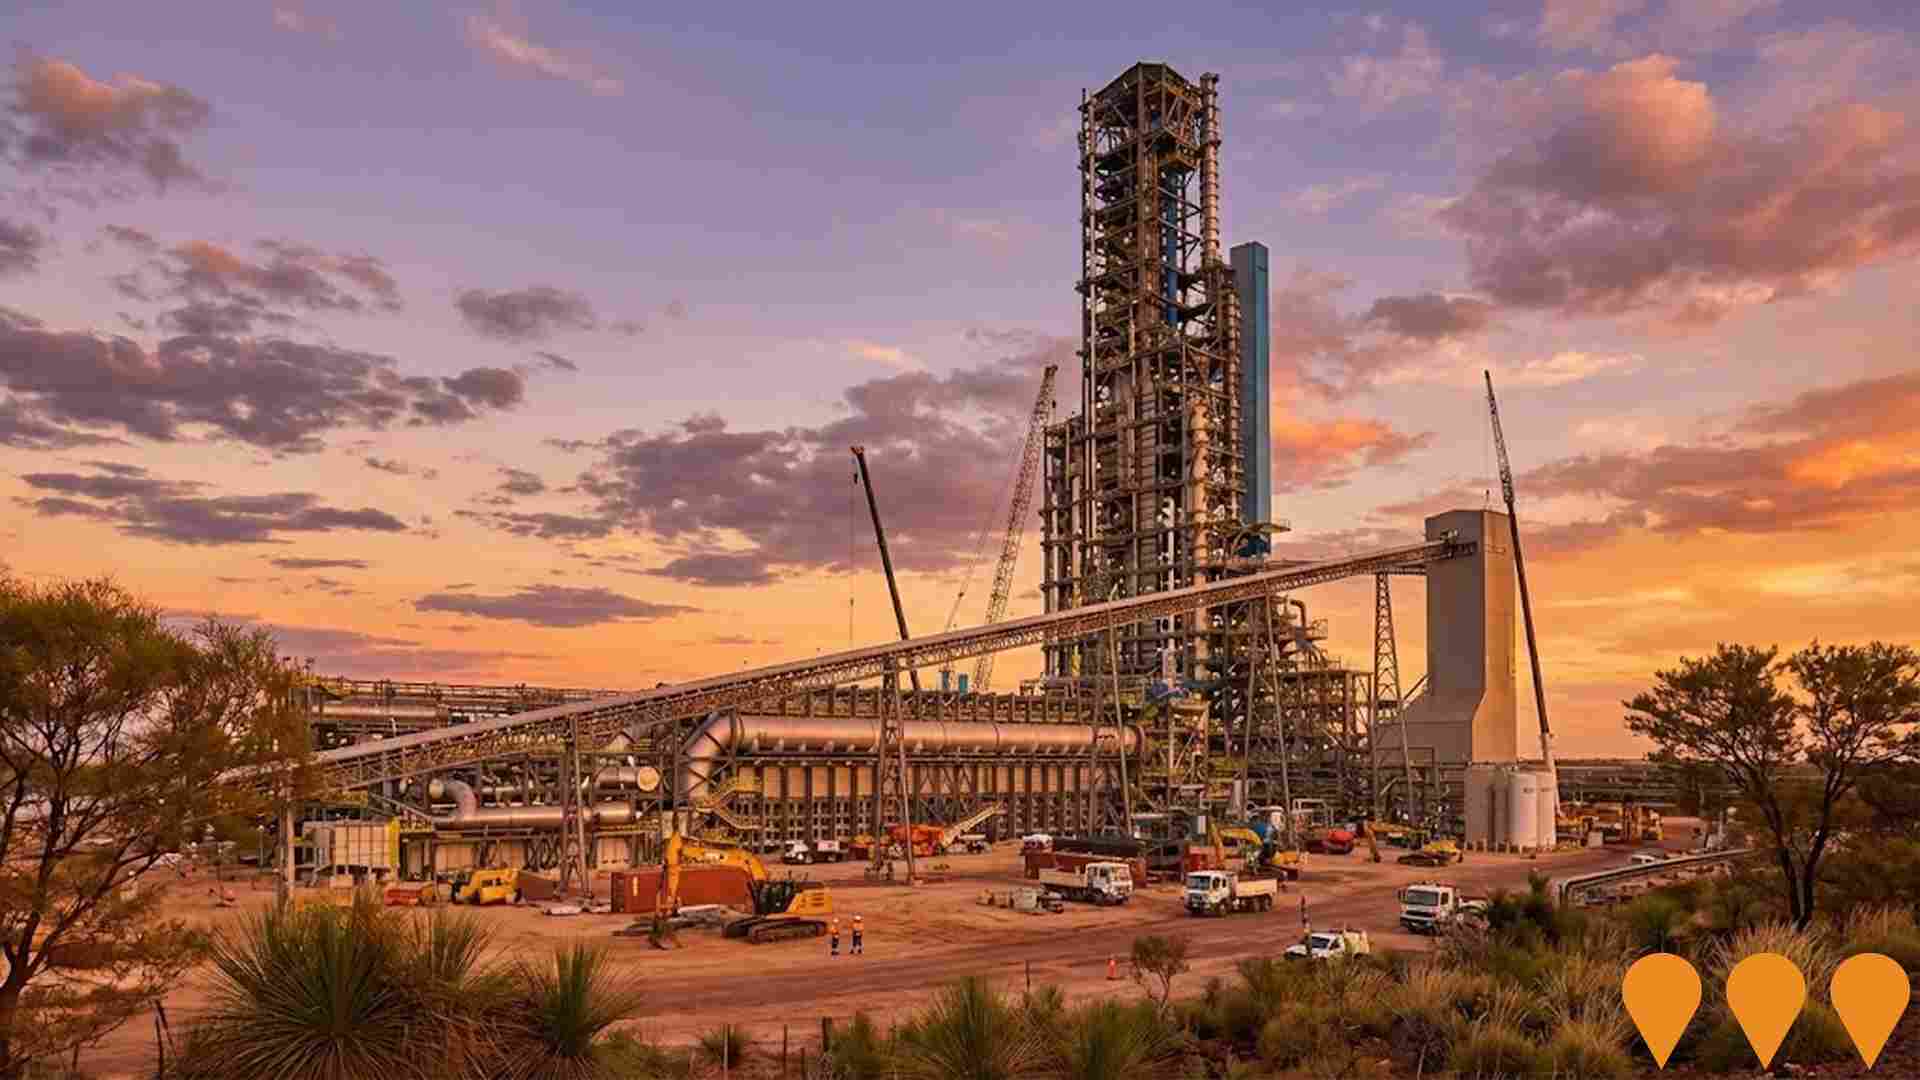
Port Hedland Iron Project - Stage 1
A downstream iron ore processing facility that will produce approximately 2 million tonnes per annum (Mtpa) of Hot Briquetted Iron (HBI) and 0.7 Mtpa of iron ore pellets for export. The $4 billion project aims to decarbonise the steel manufacturing supply chain. It will initially use natural gas, with a planned transition to 100% renewable hydrogen and power by 2049/2050. The proposal has received environmental approval from the WA EPA, subject to conditions. Construction is expected to take around 2.5 years.
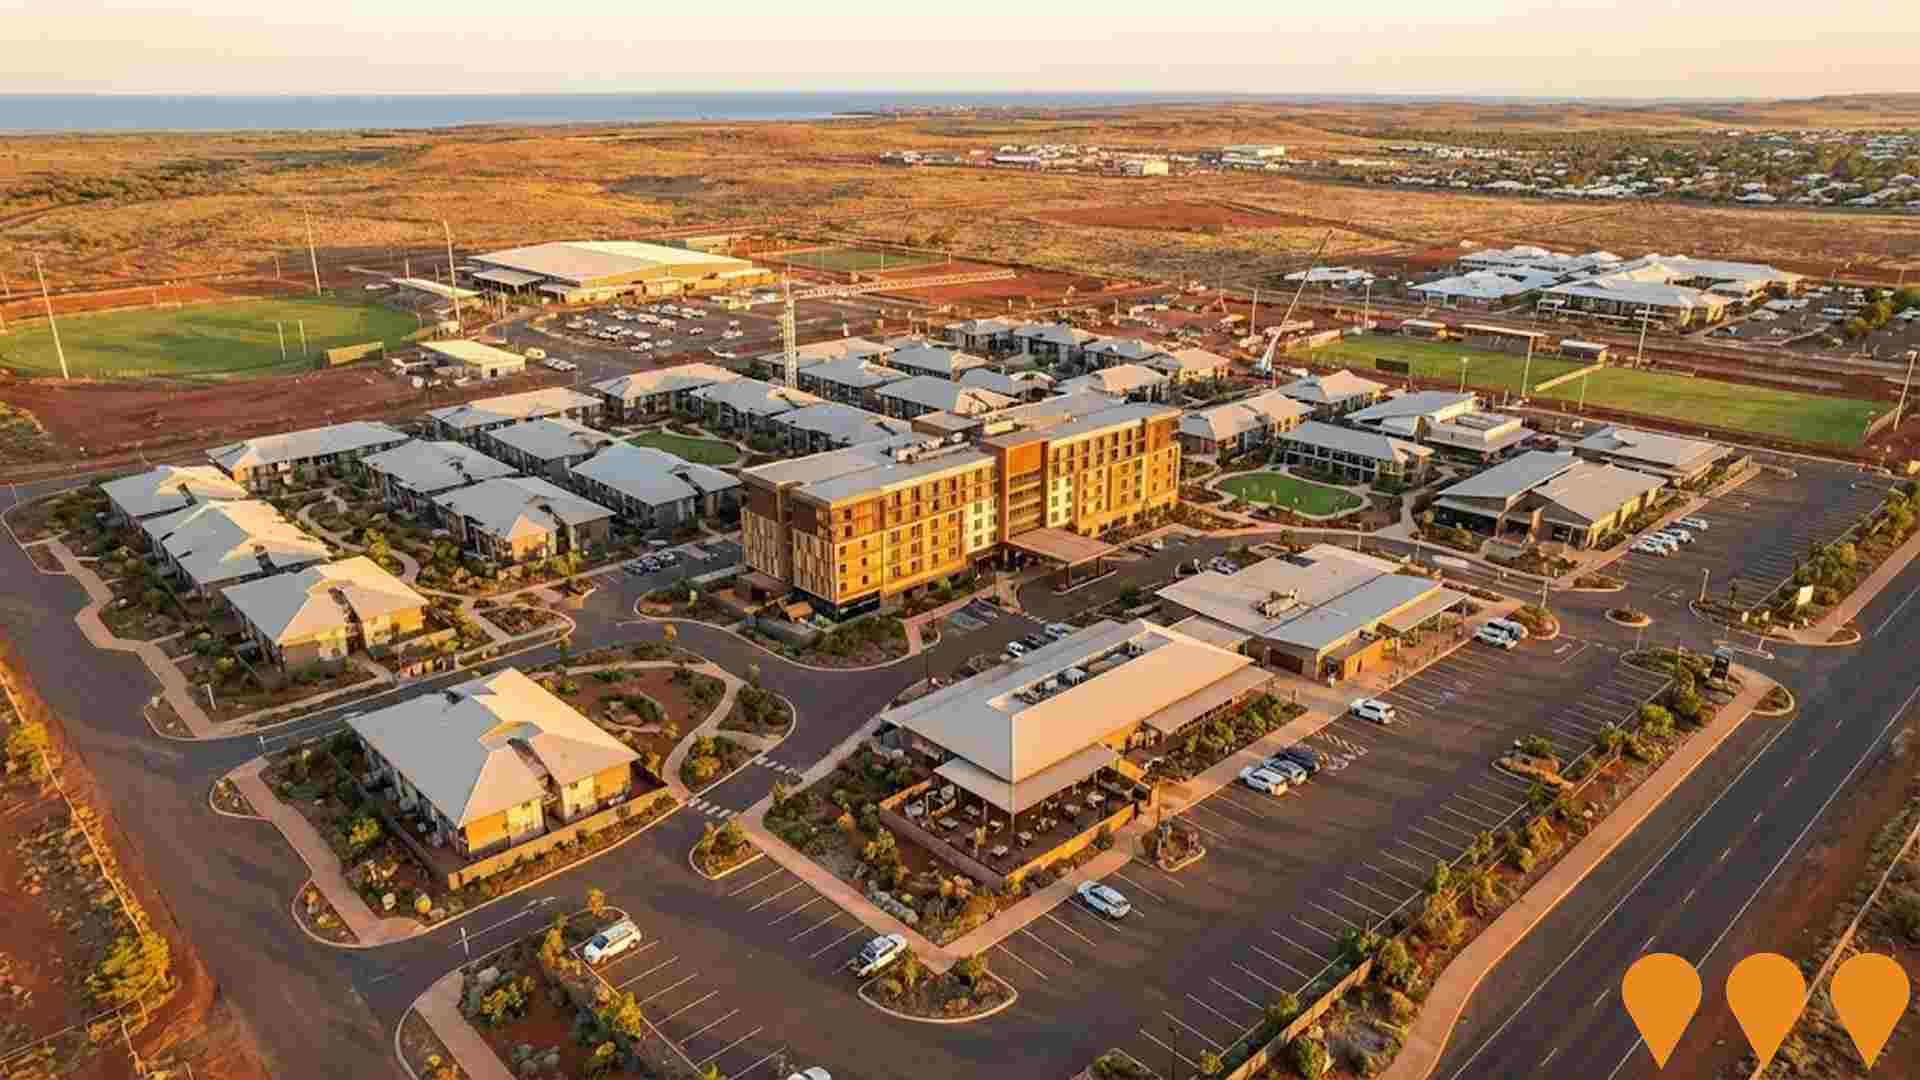
South Hedland Tourist Development and Workforce Accommodation Village
A development proposal on a 10-hectare parcel of land including up to 1311 rooms comprised of a tourist-style, six-storey building with 36 double-storey accommodation blocks. The development includes retail and community facilities such as cafe and restaurant, retail shops, tavern, outdoor gymnasium, outdoor cricket facility, wellness centre, indoor gym, business centre, offices, and 442 light vehicle parking bays plus six bus parking bays. Located adjacent to the South Hedland Integrated Sports Hub.
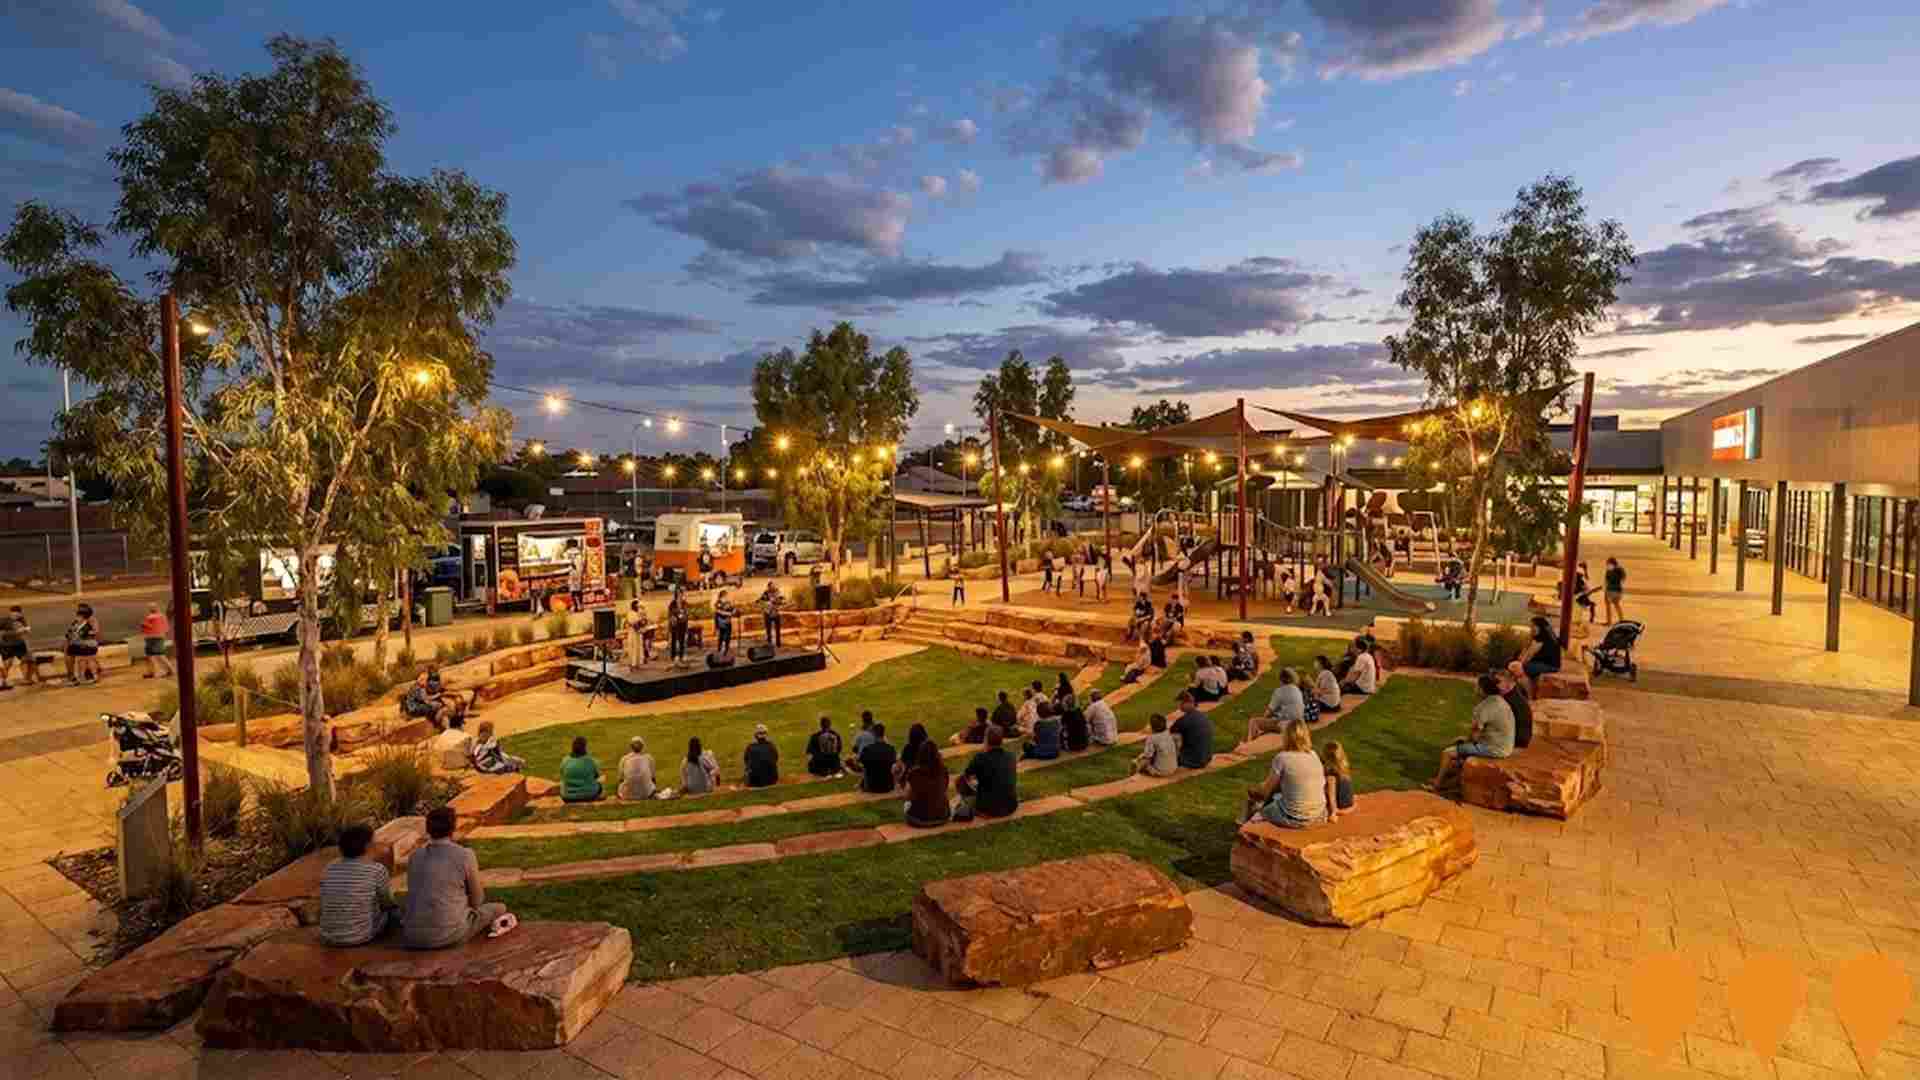
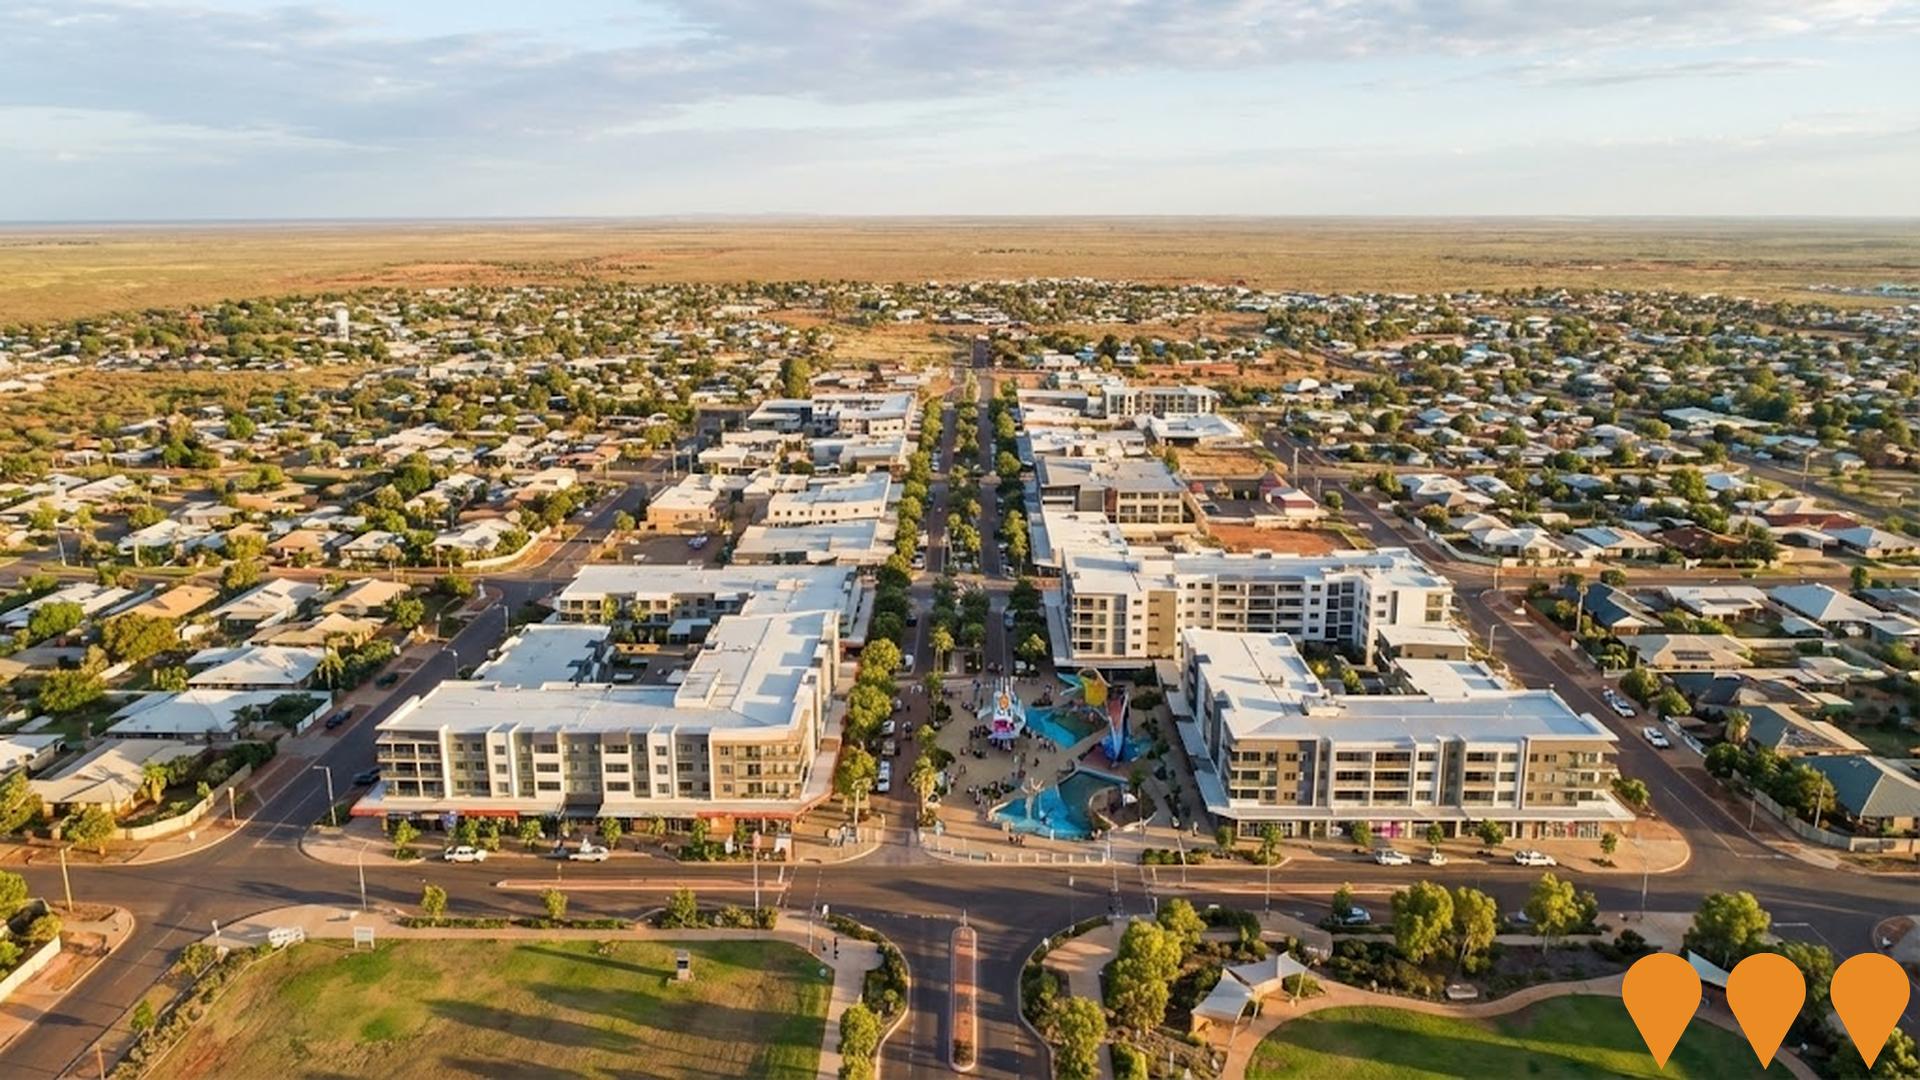
South Hedland Town Centre Revitalisation
Comprehensive revitalisation of South Hedland's Town Centre featuring a new main street, vibrant Town Square, public open spaces, road realignment, landscape treatments, underground services, and medium-to-high density mixed-use development opportunities. The project transforms the town centre into a modern hub designed for people, business, and investment.
Employment
The employment landscape in South Hedland shows performance that lags behind national averages across key labour market indicators
South Hedland's workforce as of June 2025 comprises 6850 residents with an unemployment rate of 4.0%. This is 0.9% higher than the Rest of WA's rate of 3.2%, and its workforce participation stands at 66.7%, compared to the Rest of WA's 59.4%.
The dominant employment sectors are mining, transport, postal & warehousing, and health care & social assistance. Mining is particularly strong, with an employment share 2.3 times the regional level, while agriculture, forestry & fishing is under-represented at 0.1% compared to Rest of WA's 9.3%. The labour force decreased by 2.5% in South Hedland during the year to June 2025, alongside a 2.9% employment decline, resulting in an unemployment rate rise of 0.4 percentage points. This contrasts with Rest of WA where employment rose by 1.1%, the labour force grew by 0.5%, and unemployment fell by 0.6 percentage points.
National employment forecasts from Jobs and Skills Australia (May 2025) project growth rates varying between industry sectors, suggesting local growth in South Hedland could be approximately 5.0% over five years and 11.6% over ten years.
Frequently Asked Questions - Employment
Income
The economic profile demonstrates exceptional strength, placing the area among the top 10% nationally based on comprehensive AreaSearch income analysis
AreaSearch's latest postcode level ATO data for financial year 2022 shows South Hedland's median income among taxpayers is $83,222, with an average of $95,715. This places it in the top percentile nationally. The median and average incomes in Rest of WA are $57,323 and $71,163 respectively. Based on Wage Price Index growth of 14.2% since financial year 2022, current estimates for South Hedland's median income would be approximately $95,040 and average $109,307 as of September 2025. Census data reveals household, family and personal incomes in South Hedland rank highly nationally, between the 92nd and 97th percentiles. The $1,500 - 2,999 income bracket dominates with 36.3% of residents (4,620 people), similar to regional levels where this cohort represents 31.1%. A substantial presence of higher earners is evident, with 43.0% exceeding $3,000 weekly. After housing costs, residents retain 90.8% of income, reflecting strong purchasing power. The area's SEIFA income ranking places it in the 4th decile.
Frequently Asked Questions - Income
Housing
South Hedland is characterized by a predominantly suburban housing profile, with ownership patterns similar to the broader region
South Hedland's dwelling structure, as per the latest Census, had 71.8% houses and 28.3% other dwellings (semi-detached, apartments, 'other' dwellings). Non-Metro WA had 76.2% houses and 23.7% other dwellings. Home ownership in South Hedland was 7.4%, with mortgaged dwellings at 20.4% and rented ones at 72.2%. The median monthly mortgage repayment was $1,387, lower than Non-Metro WA's average of $1,480. Median weekly rent in South Hedland was $240, compared to Non-Metro WA's $180. Nationally, South Hedland's mortgage repayments were significantly lower at $1,387 versus Australia's average of $1,863, and rents were substantially below the national figure of $375.
Frequently Asked Questions - Housing
Household Composition
South Hedland has a typical household mix, with a fairly typical median household size
Family households account for 71.4% of all households, including 35.2% couples with children, 23.0% couples without children, and 11.8% single parent families. Non-family households constitute the remaining 28.6%, with lone person households at 25.2% and group households making up 3.5%. The median household size is 2.7 people, which aligns with the average for the Rest of WA.
Frequently Asked Questions - Households
Local Schools & Education
South Hedland faces educational challenges, with performance metrics placing it in the bottom quartile of areas assessed nationally
The area's university qualification rate is 14.9%, significantly lower than Australia's average of 30.4%. Bachelor degrees are most common at 11.1%, followed by postgraduate qualifications (2.0%) and graduate diplomas (1.8%). Vocational credentials are prevalent, with 48.6% of residents aged 15+ holding them - advanced diplomas account for 9.7% and certificates for 38.9%. Educational participation is high at 37.9%, including 16.9% in primary, 10.3% in secondary, and 2.3% in tertiary education.
South Hedland's five schools have a combined enrollment of 2,388 students. The area has four primary and one secondary school serving distinct age groups. School capacity exceeds typical residential needs at 18.8 places per 100 residents compared to the regional average of 15.4, indicating that South Hedland serves as an educational hub for the broader region.
Frequently Asked Questions - Education
Schools Detail
Nearby Services & Amenities
Transport
Transport servicing is low compared to other areas nationally based on assessment of service frequency, route connectivity and accessibility
Transport analysis shows 80 active stops in South Hedland, with a mix of buses operating. Three routes service these stops, offering 183 weekly passenger trips in total. Residents enjoy excellent transport accessibility, with an average distance of 186 meters to the nearest stop.
Service frequency averages 26 trips daily across all routes, equating to about two weekly trips per stop.
Frequently Asked Questions - Transport
Transport Stops Detail
Health
South Hedland's residents boast exceedingly positive health performance metrics with common health conditions somewhat prevalent across both younger and older age cohorts
South Hedland shows excellent health outcomes with common conditions prevalent in both younger and older age groups. Approximately 69% of South Hedland's total population of 8,821 have private health cover, significantly higher than the national average of 55.3%.
Asthma and mental health issues are the most common medical conditions, affecting 7.2% and 5.2% of residents respectively. Around 79.4% of South Hedland residents report no medical ailments, slightly lower than the Rest of WA's 80.7%. The area has 3.8%, or 483 people, aged 65 and over. Health outcomes for seniors require more attention compared to the broader population.
Frequently Asked Questions - Health
Cultural Diversity
South Hedland was found to be more culturally diverse than the vast majority of local markets in Australia, upon assessment of a range of language and cultural background related metrics
South Hedland's population showed high cultural diversity, with 24.8% born overseas and 19.0% speaking languages other than English at home. Christianity was the predominant religion, accounting for 39.5%. Islam's representation stood at 4.7%, higher than the Rest of WA's 2.9%.
The top three ancestry groups were Australian (22.5%), English (21.5%), and Australian Aboriginal (16.6%). Notable differences included Maori, overrepresented at 2.8% compared to regional levels, Filipino at 3.2%, and New Zealand at 1.2%.
Frequently Asked Questions - Diversity
Age
South Hedland hosts a very young demographic, ranking in the bottom 10% of areas nationwide
South Hedland's median age of 32 years is significantly younger than Rest of WA's 40 years and considerably younger than Australia's national average of 38 years. The age group of 25-34 years has a strong representation in South Hedland at 20.6%, compared to Rest of WA, while the 65-74 age cohort is less prevalent at 3.0%. This concentration of the 25-34 age group is well above the national average of 14.5%. Between 2021 and the present, the population aged 35 to 44 years has grown from 17.0% to 18.5%, while the 5 to 14 age cohort has declined from 16.0% to 14.4%. Population forecasts for South Hedland in the year 2041 indicate substantial demographic changes. The 25-34 age group is projected to increase significantly, with an addition of 679 people (26%), bringing the total to 3,307 from the current figure of 2,627. Conversely, population declines are projected for the 75-84 and 5-14 age cohorts.
