Chart Color Schemes
est. as @ -- *
ABS ERP | -- people | --
2021 Census | -- people
Sales Activity
Curious about local property values? Filter the chart to assess the volume and appreciation (including resales) trends and regional comparisons, or scroll to the map below view this information at an individual property level.
Find a Recent Sale
Sales Detail
Population
Ashburton is positioned among the lower quartile of areas assessed nationally for population growth based on AreaSearch's assessment of recent, and medium term trends
Ashburton's population was 7,391 as of the 2021 Census. By Nov 2025, it had grown to around 8,144, an increase of 753 people (10.2%). This growth is inferred from ABS data showing an estimated resident population of 8,179 in June 2024 and address validation since the Census date. The population density was approximately 0.10 persons per square kilometer as of Nov 2025. Ashburton's growth rate exceeded the national average (8.9%) during this period. Natural growth contributed about 58.8% to overall population gains recently.
AreaSearch uses ABS/Geoscience Australia projections for each SA2 area, released in 2024 with a base year of 2022. For areas not covered by this data and post-2032 estimates, AreaSearch utilises growth rates by age cohort provided by the ABS in its Greater Capital Region projections (released in 2023, based on 2022 data). Based on these projections, Ashburton's population is expected to increase by 647 persons to reach 8,811 by 2041, reflecting an 8.4% total increase over the 17-year period.
Frequently Asked Questions - Population
Development
The level of residential development activity in Ashburton is very low in comparison to the average area assessed nationally by AreaSearch
Ashburton has averaged approximately 15 new dwelling approvals annually over the past five financial years, totalling 75 homes. As of FY26 so far, 2 approvals have been recorded. The population has fallen during this period, yet development activity has been adequate relative to the population decline, which is positive for buyers. New homes are being built at an average expected construction cost value of $461,000, indicating a focus on the premium market with high-end developments.
In FY26, $194.9 million in commercial development approvals have been recorded, suggesting robust local business investment. Compared to Rest of WA, Ashburton shows roughly half the construction activity per person and places among the 33rd percentile nationally, resulting in relatively constrained buyer choice that supports interest in existing dwellings. This is also under the national average, indicating the area's established nature and potential planning limitations. New development consists of 85.0% standalone homes and 15.0% townhouses or apartments, maintaining Ashburton's traditional low density character with a focus on family homes appealing to those seeking space.
The estimated count of 510 people in the area per dwelling approval reflects its quiet, low activity development environment. Future projections show Ashburton adding 682 residents by 2041. Based on current development patterns, new housing supply should readily meet demand, offering good conditions for buyers and potentially facilitating population growth beyond current projections.
Frequently Asked Questions - Development
Infrastructure
Ashburton has emerging levels of nearby infrastructure activity, ranking in the 23rdth percentile nationally
Changes to local infrastructure significantly influence an area's performance. AreaSearch has identified 30 projects likely impacting the region. Notable ones are Brockman Syncline 1 Iron Ore Project, Solomon Iron Ore Project Expansion, Tom Price Pump Track, and Tom Price Hospital Redevelopment. The following list details those most relevant.
Professional plan users can use the search below to filter and access additional projects.
INFRASTRUCTURE SEARCH
 Denotes AI-based impression for illustrative purposes only, not to be taken as definitive under any circumstances. Please follow links and conduct other investigations from the project's source for actual imagery. Developers and project owners wishing us to use original imagery please Contact Us and we will do so.
Frequently Asked Questions - Infrastructure
Tom Price Hospital Redevelopment
Redevelopment of Tom Price Hospital in partnership between WA Country Health Service and Rio Tinto. The new hospital includes a modern emergency department, four-bed inpatient ward, dental and pathology services, consult rooms, and contemporary ambulatory care facilities. Bundled tender with Paraburdoo Hospital awarded to Cooper & Oxley in November 2024 under Early Contractor Involvement. Site establishment and forward works commenced late 2024 with main construction well underway in 2025.

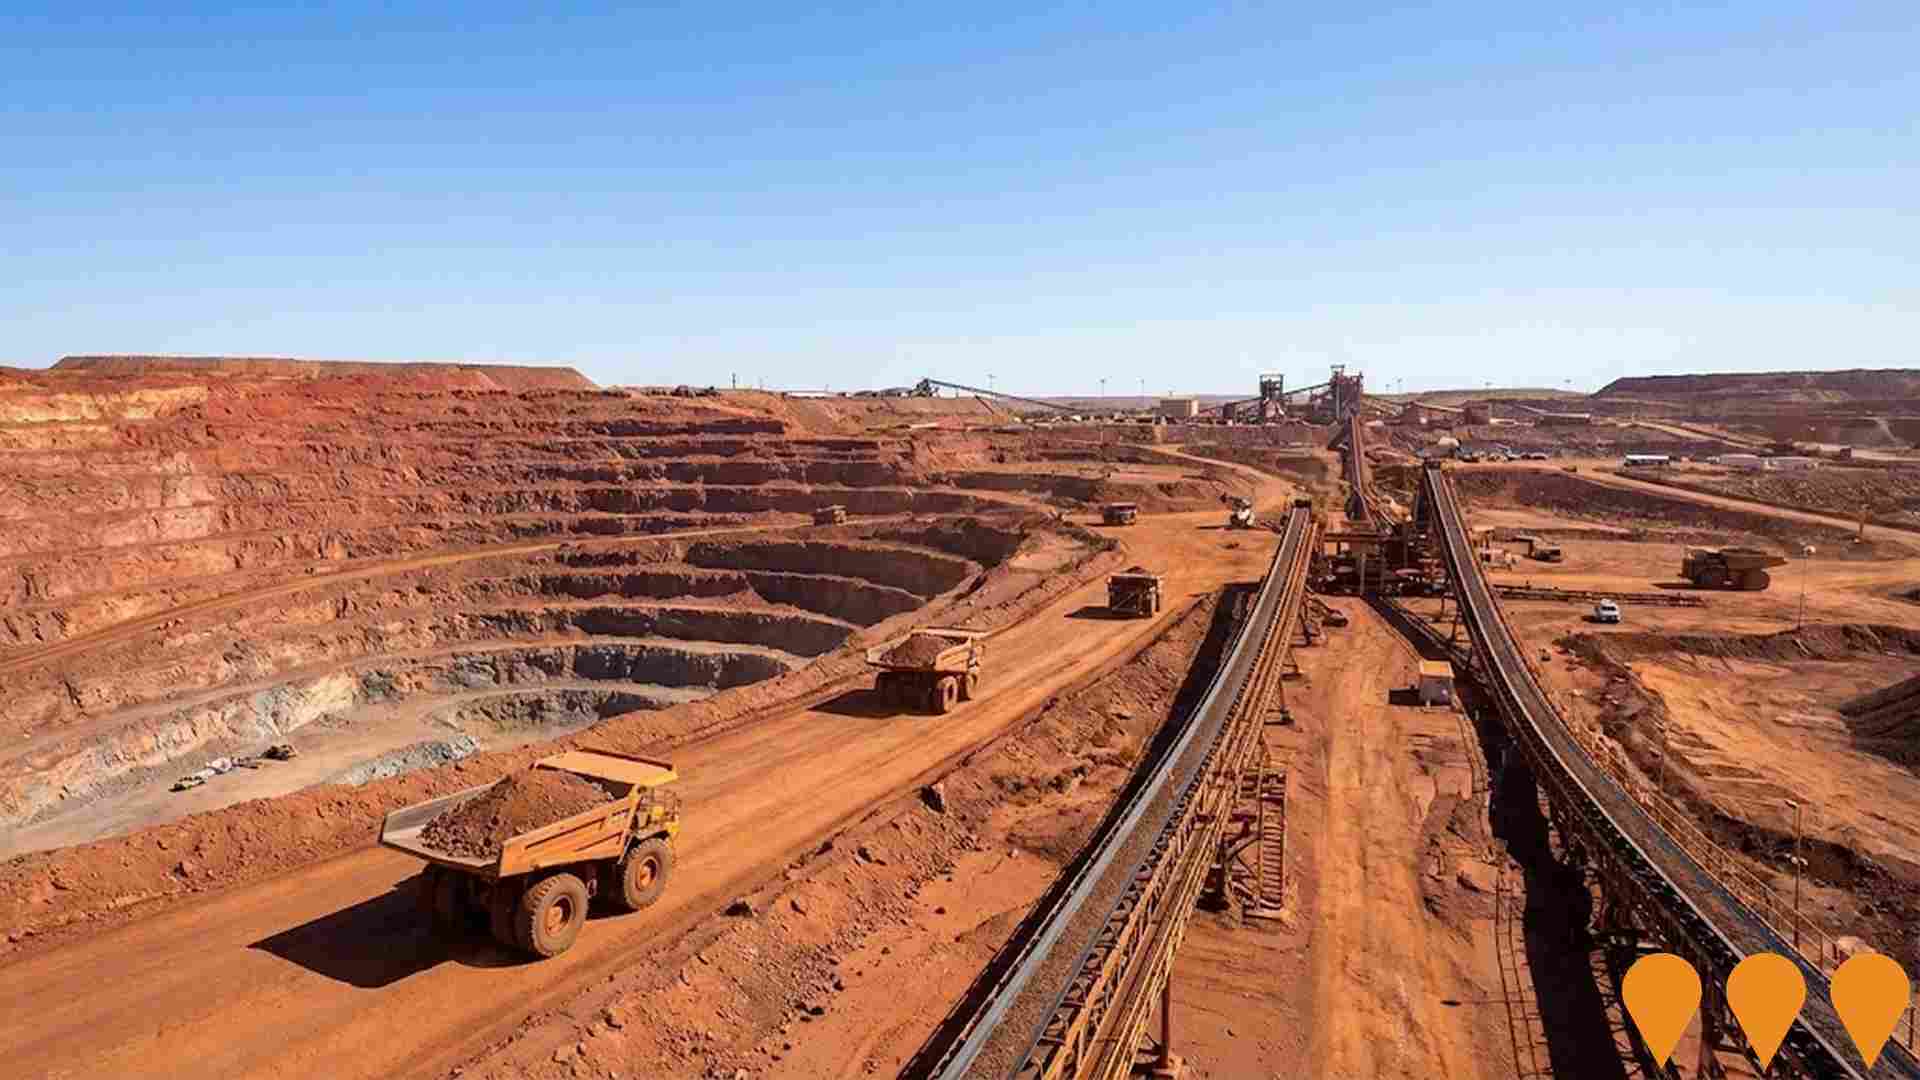
Brockman Syncline 1 Iron Ore Project
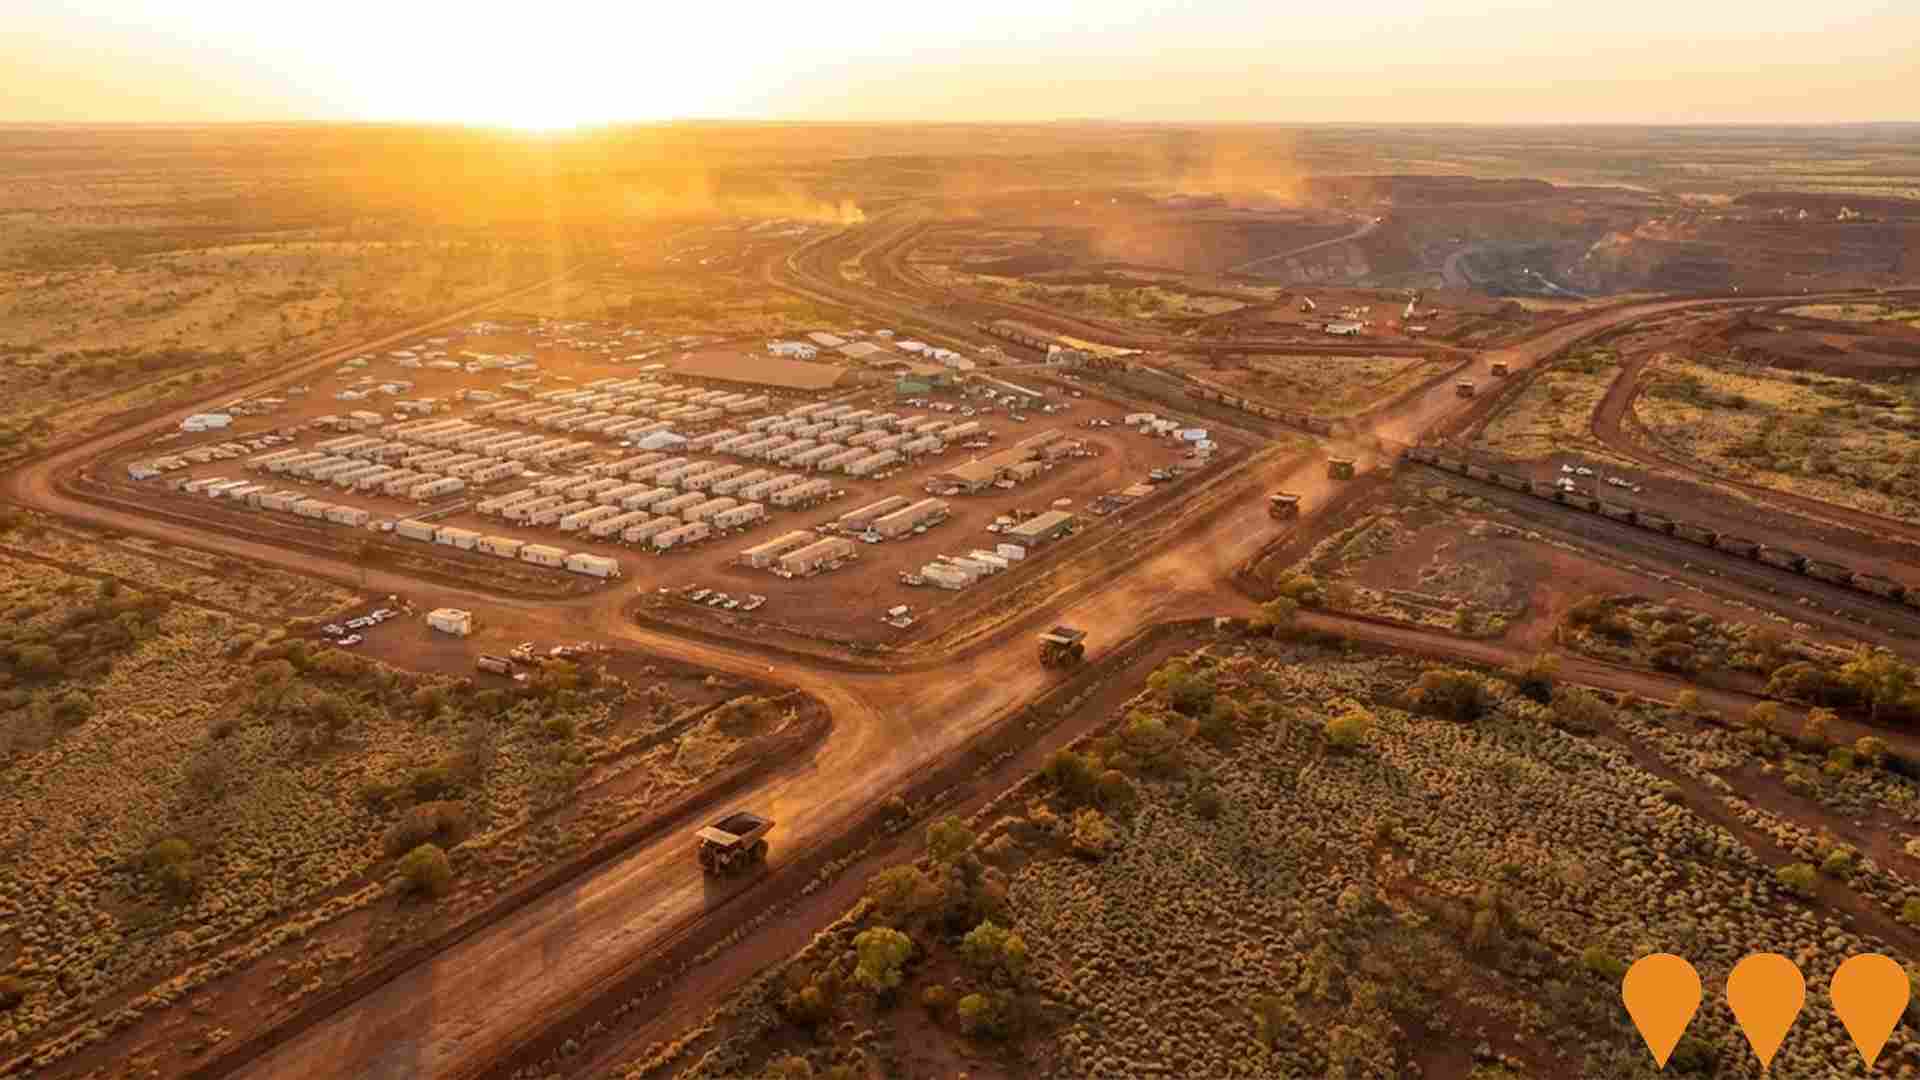
Development of a new iron ore satellite mine at Brockman Syncline 1 to sustain production from Rio Tinto's Greater Brockman hub. The project will deliver up to 34 million tonnes per annum of iron ore and extend the life of existing processing facilities at Nammuldi and Brockman 4. Approved in 2025 with a US$1.8 billion (A$2.8 billion) investment.
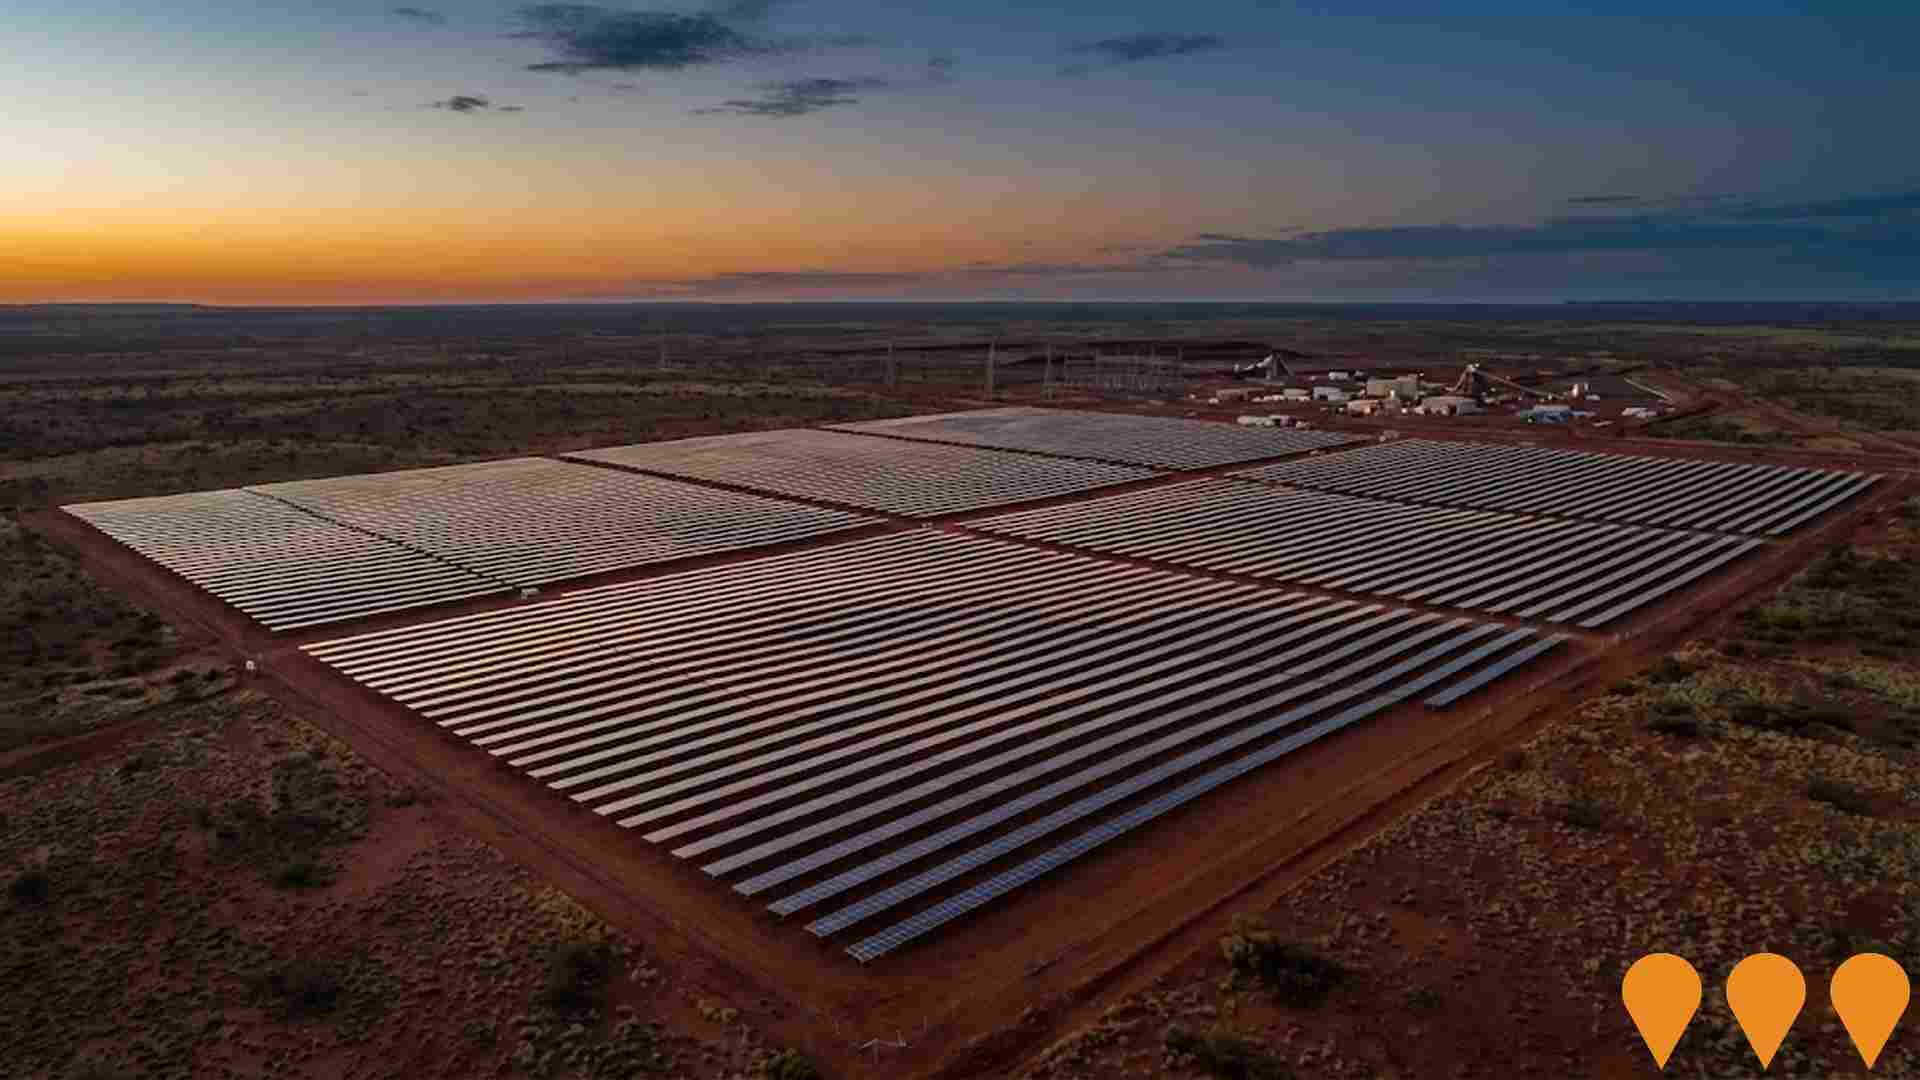
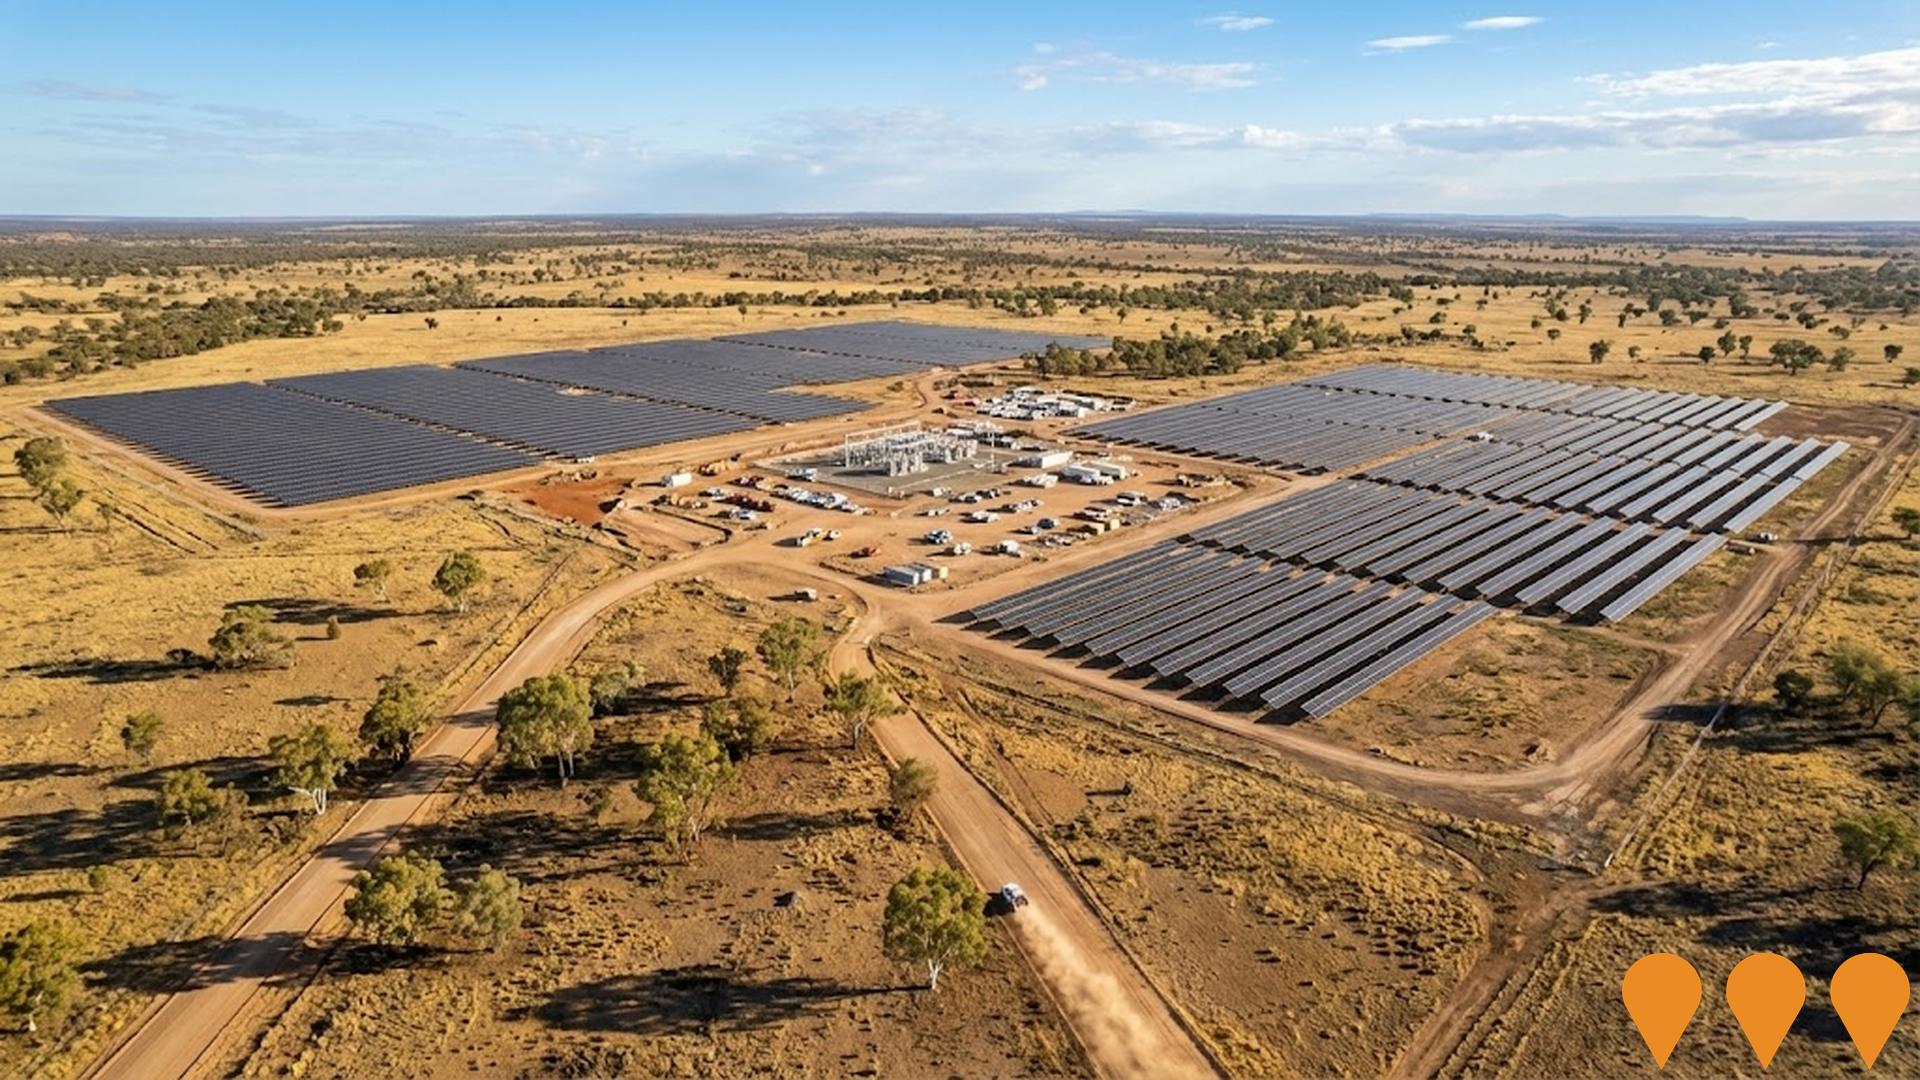
Jinbi Solar Project
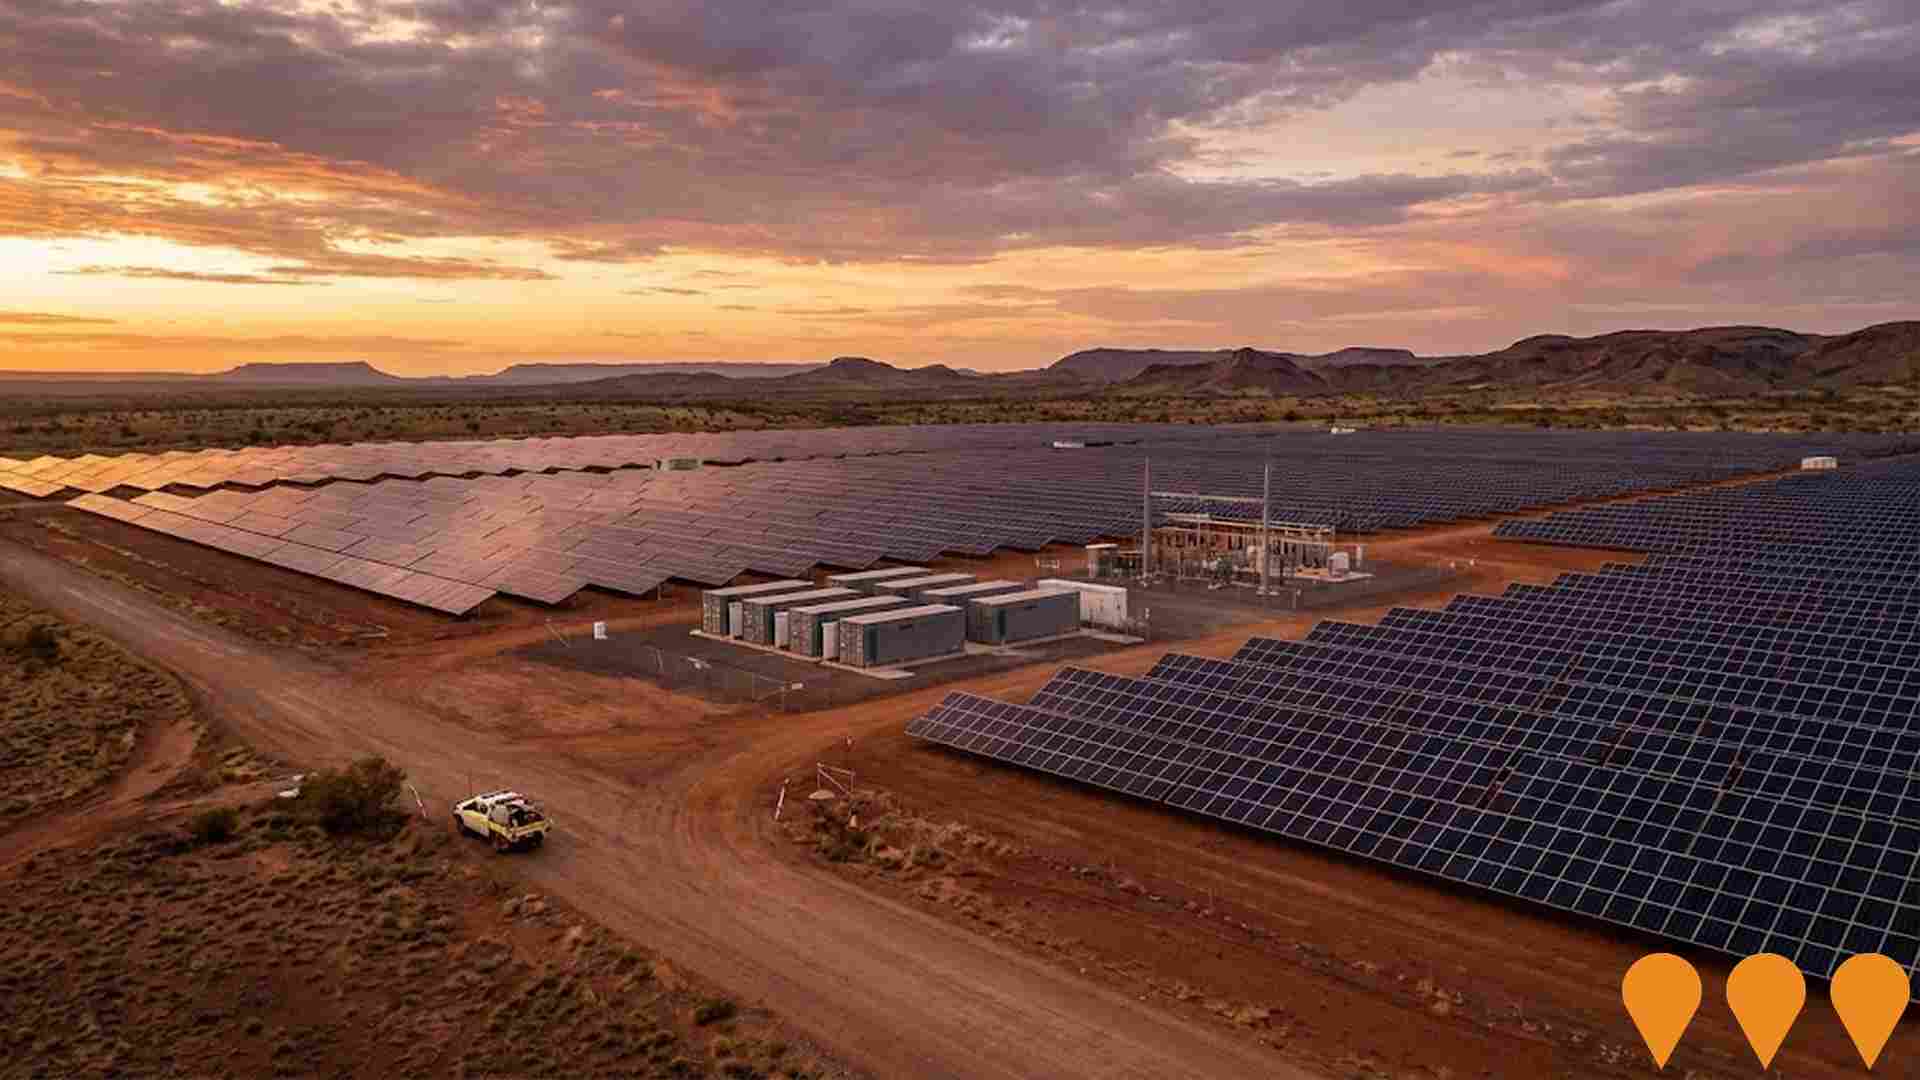
150 MW solar photovoltaic power station with single-axis tracking panels, fully owned and led by the Yindjibarndi people through Yindjibarndi Energy Corporation. First stage of a planned multi-gigawatt renewable energy hub to supply clean power to Pilbara industry, including Rio Tinto operations, while delivering significant economic benefits to Traditional Owners.
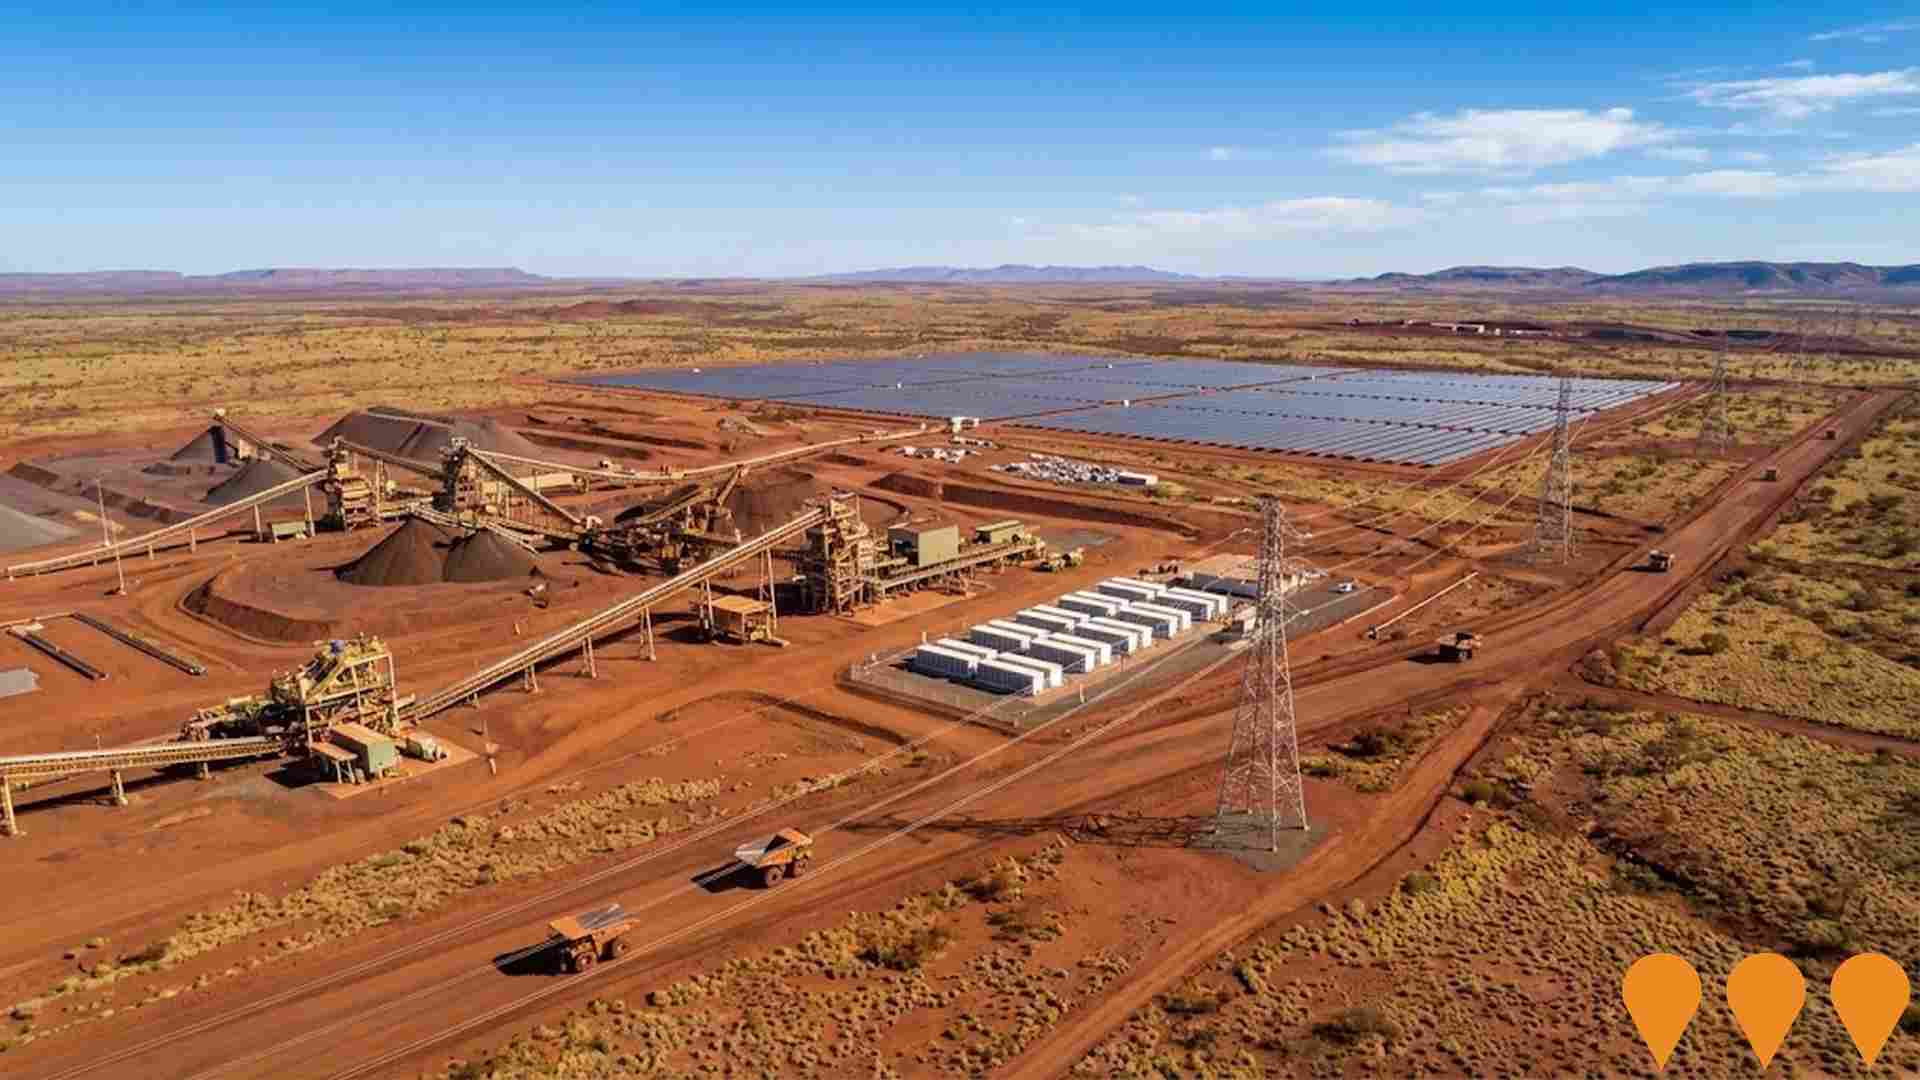
Fortescue Decarbonisation Plan
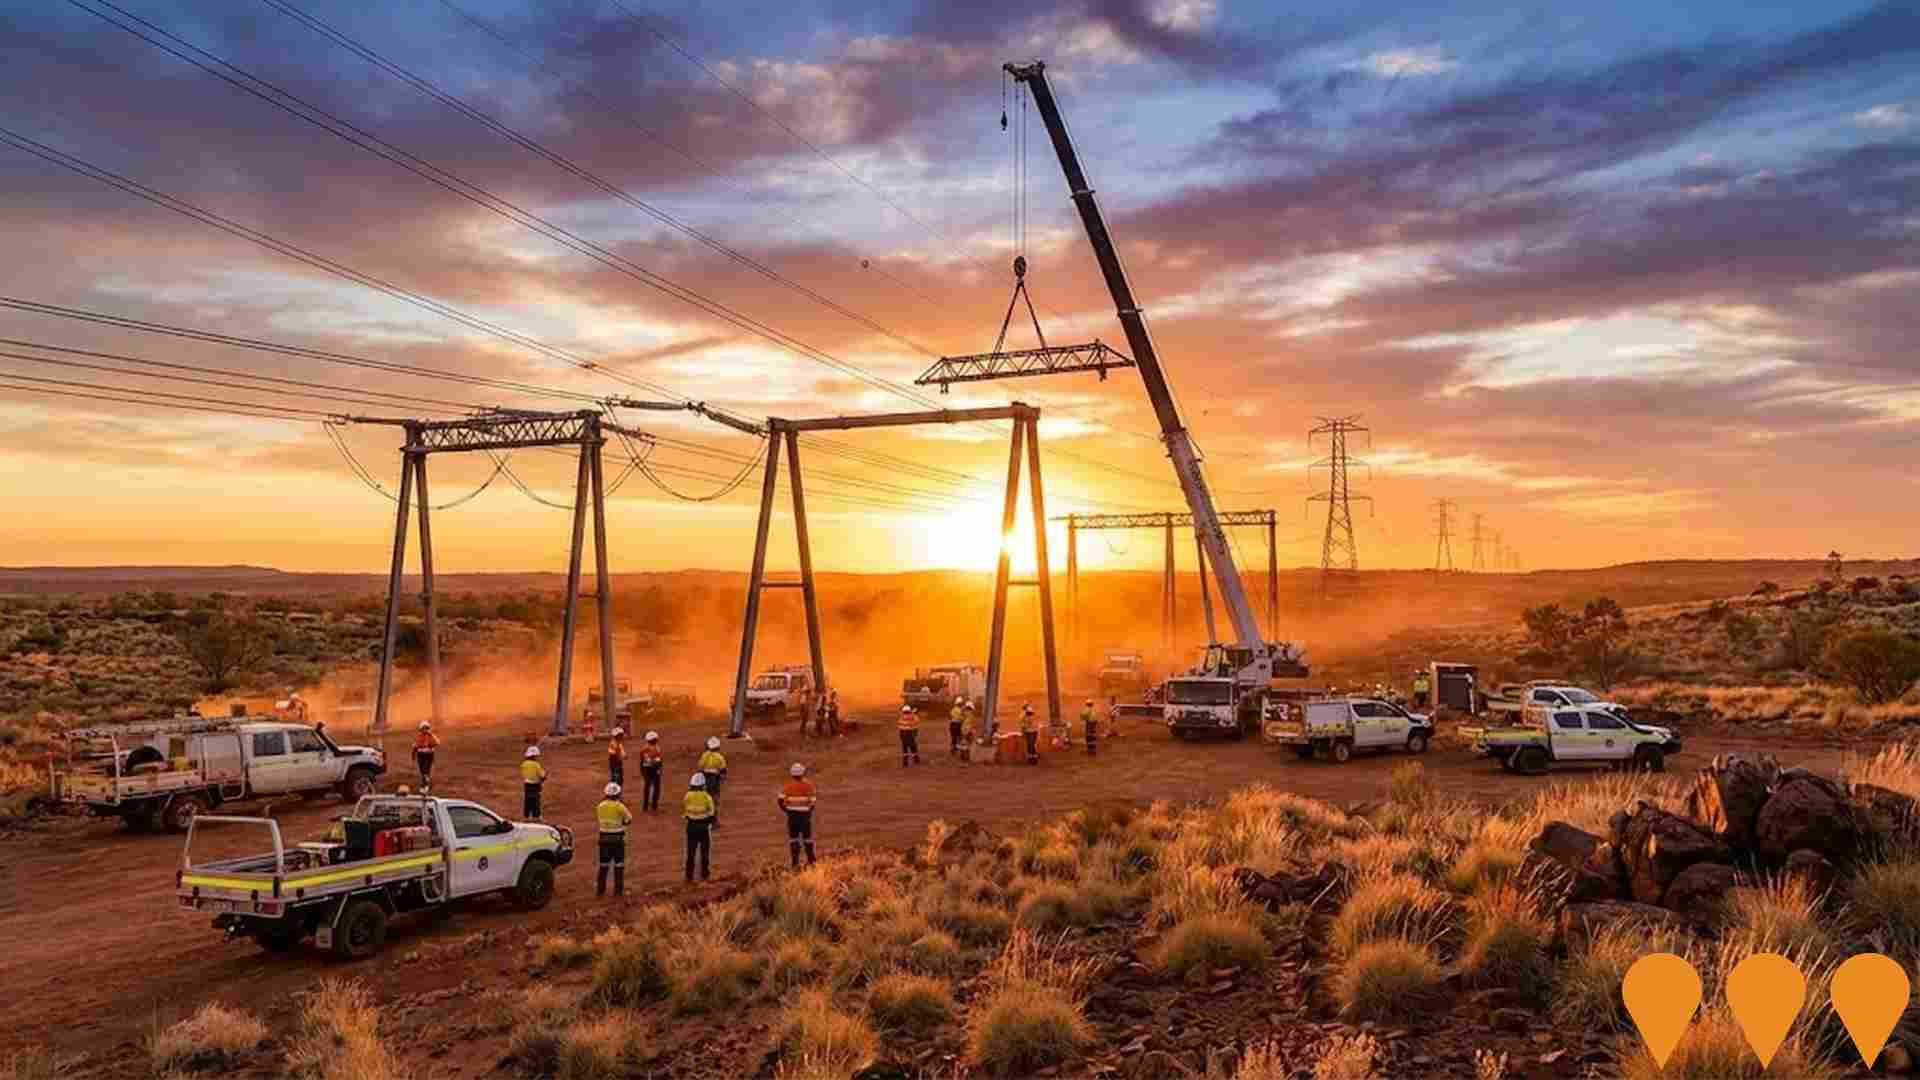
Fortescue's Pilbara Decarbonisation Plan is a long term program to eliminate fossil fuel use and achieve Real Zero scope 1 and 2 emissions across its Australian iron ore operations by 2030. The company has committed about US$6.2 billion (around A$9.5 billion) to deploy 2 to 3 GW of new wind and solar generation, large scale battery storage and an integrated 220 kV transmission network linking mine, rail and port sites across the Pilbara. Current works include a 190 MW solar farm at Cloudbreak, which is more than one third through construction and forms part of the Pilbara Solar Innovation Hub, together with multiple 220 kV transmission line packages connecting sites such as Solomon, Eliwana, Cloudbreak and Christmas Creek. Construction ramped up from 2024 and is expected to continue in stages through to 2030 as the renewable grid and electrified mining fleet are progressively delivered.
Madigan at Baynton West
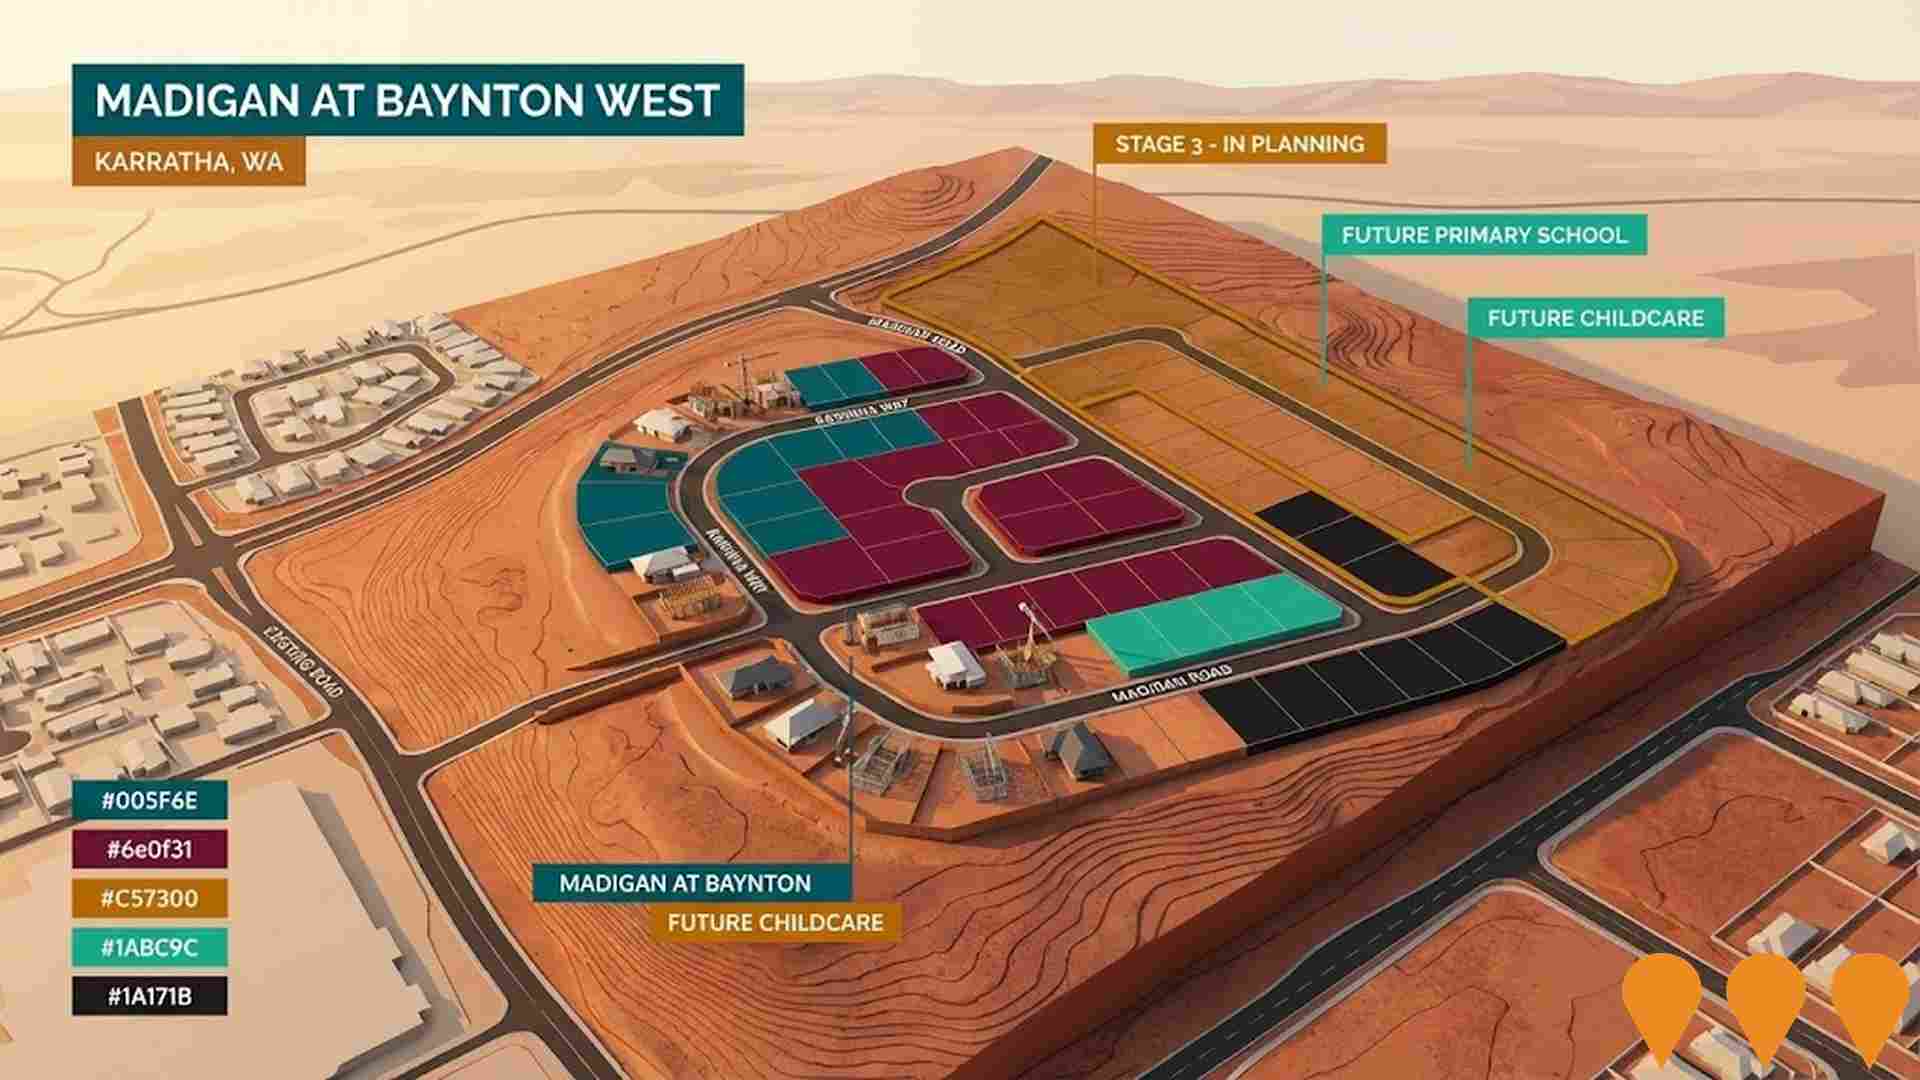
Madigan at Baynton West is Karratha's newest residential community offering modern affordable living in the popular suburb of Baynton. The masterplanned estate features residential lots ranging from 342sqm to 585sqm, positioned close to Baynton West Primary School, community centre, shops, and recreational facilities. Perdaman acquired 85 lots to build approximately 100 homes for workers of the 7 billion dollar Karratha Urea Project, with construction commenced in late 2024 and expected completion by June 2027. Stage 3 is in planning to deliver an additional 400 lots, plus land for a childcare centre and new primary school. The development emphasizes climate-responsive design principles and aims to create a vibrant, family-oriented community with modern amenities and landscaped public open spaces.
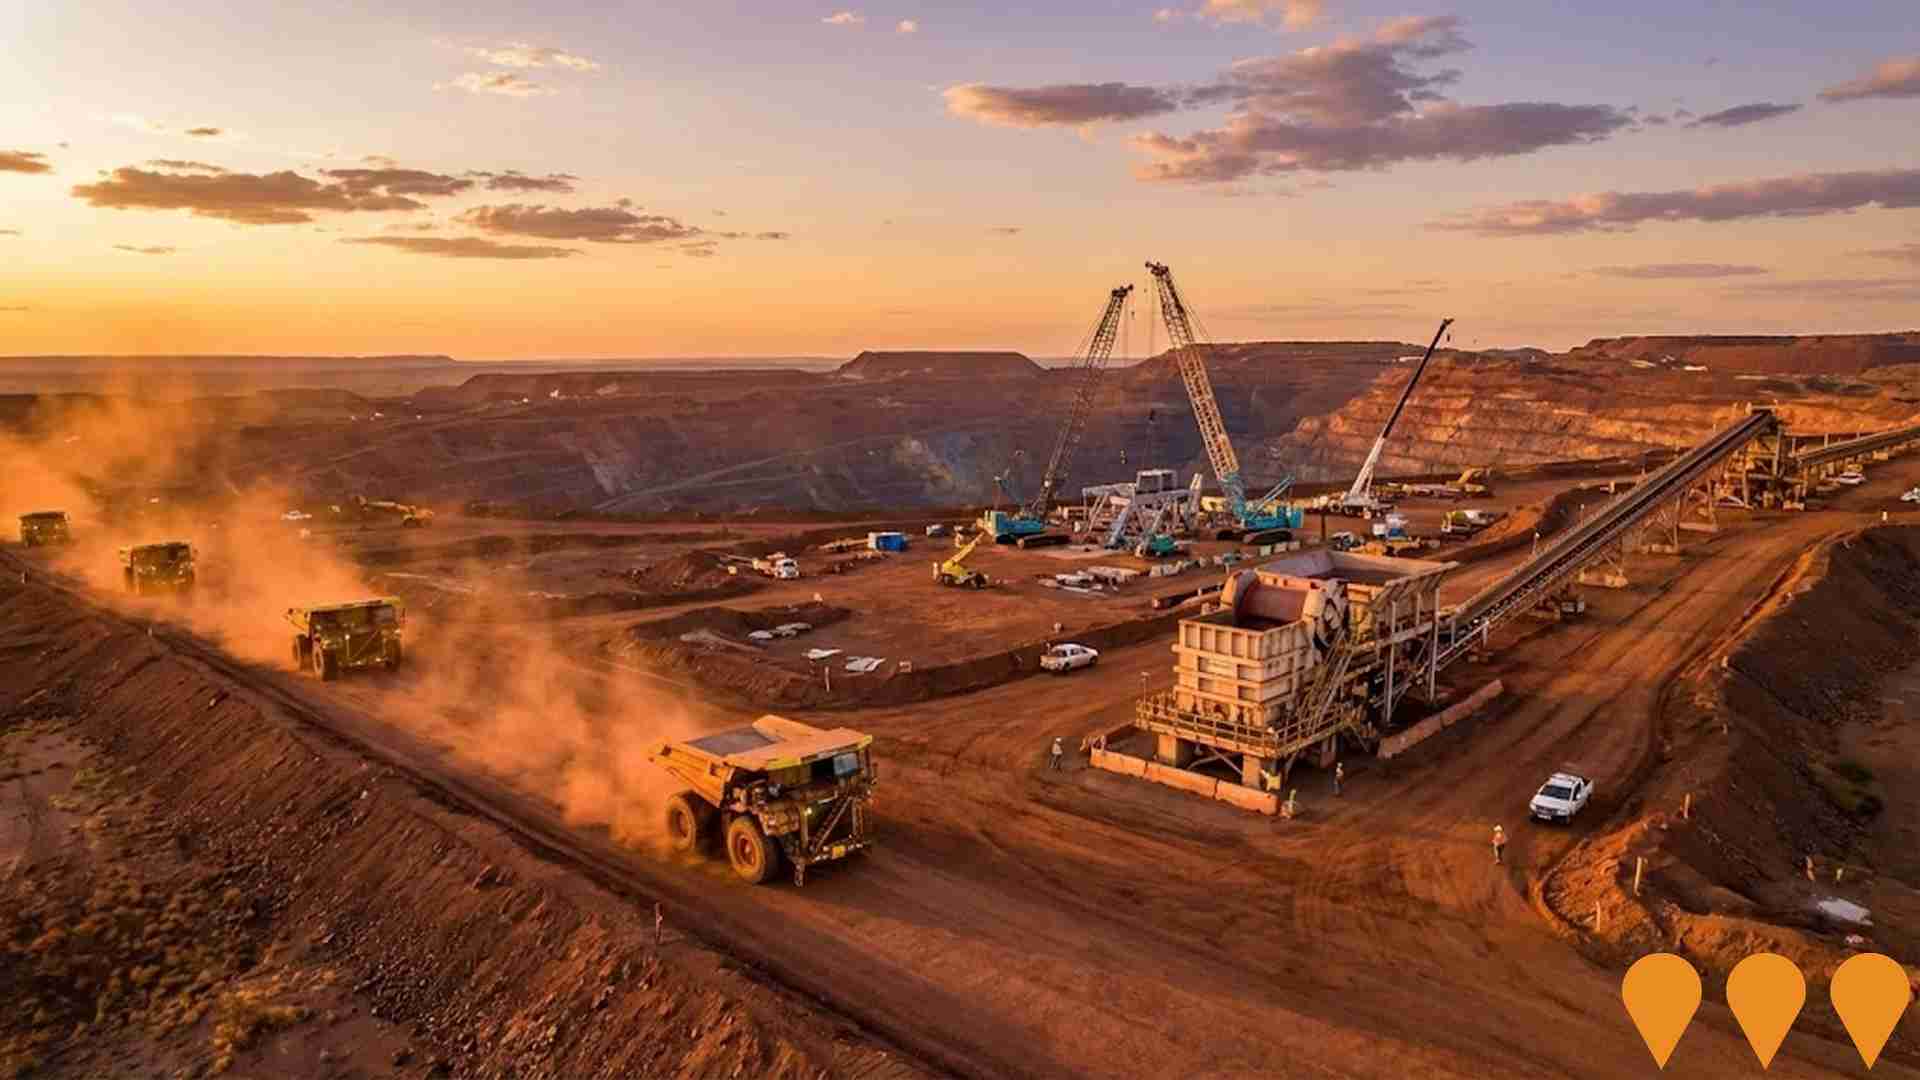
Greater Tom Price Operations Sustaining Capital
Ongoing sustaining capital program by Rio Tinto to maintain and enhance output across the Greater Tom Price hub (Tom Price and Western Turner Syncline satellites). Works typically include opening new pits, replacement and upgrade of mining fleets, autonomy rollouts, and fixed plant renewals (e.g., crusher and overland conveyor delivered with WTS2). WTS2 achieved first ore in 2021, and sustaining works continue to keep hub capacity in line with Pilbara plans.
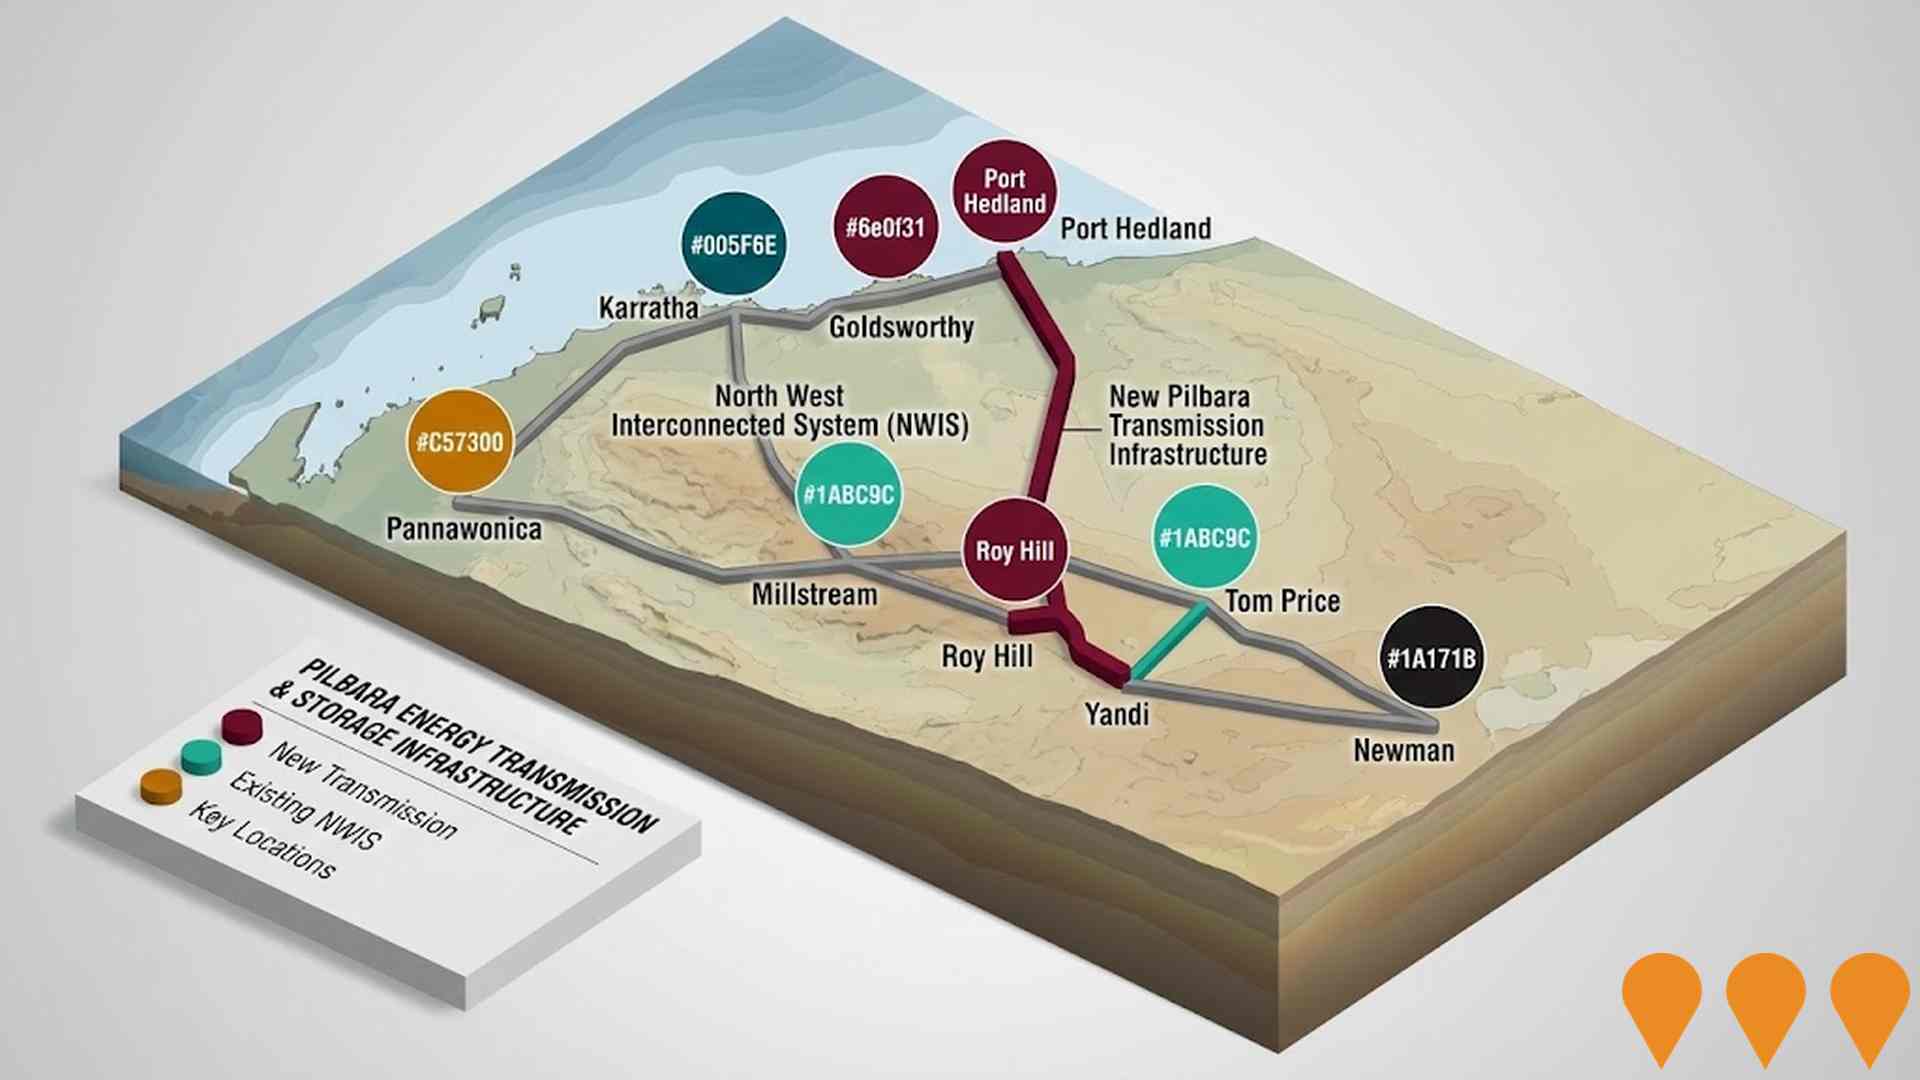
Pilbara Energy Transmission and Storage Infrastructure
State-led program to develop common-use transmission and storage infrastructure across the Pilbara to connect renewable generation to demand centers, lower energy costs and emissions, and support emerging industries including green hydrogen. Early work includes Burrup Common User Transmission Infrastructure linking Maitland SIA to Burrup, and planning for the Pilbara Green Link and other priority corridors under the Pilbara Energy Transition Plan.
Tom Price Residential Development
Shire of Ashburton program to increase and improve housing in Tom Price to support local workforce and community needs. Guided by the Community Lifestyle and Infrastructure Plan (CLIP), recent actions include tenders for new residences (2022) and staff housing refurbishments (2024). The broader housing program remains in planning while sites and delivery pathways are advanced with the Shire.
Employment
Employment conditions in Ashburton rank among the top 10% of areas assessed nationally
Ashburton WA has a skilled workforce with strong manufacturing and industrial sectors. Its unemployment rate was 1.0% as of June 2025.
In this month, 4992 residents were employed while the unemployment rate was 2.2% lower than Rest of WA's rate of 3.2%. Workforce participation in Ashburton was 68.9%, compared to Rest of WA's 59.4%. Leading employment industries among residents include mining, construction, and education & training. The area has a notable concentration in mining with employment levels at 4.3 times the regional average.
Conversely, agriculture, forestry & fishing is under-represented, with only 1.6% of Ashburton's workforce compared to 9.3% in Rest of WA. There were 1.9 workers for every resident as per the Census, indicating it functions as an employment hub hosting more jobs than residents and attracting workers from surrounding areas. Between June 2024 and June 2025, the labour force decreased by 2.8% while employment declined by 2.8%, keeping the unemployment rate relatively stable. In contrast, Rest of WA saw employment grow by 1.1%, labour force expand by 0.5%, and unemployment fall by 0.6 percentage points. Jobs and Skills Australia's national employment forecasts from May 2025 project national employment growth of 6.6% over five years and 13.7% over ten years, with varying growth rates between industry sectors. Applying these projections to Ashburton's employment mix suggests local growth of approximately 4.2% over five years and 10.4% over ten years.
Frequently Asked Questions - Employment
Income
The economic profile demonstrates exceptional strength, placing the area among the top 10% nationally based on comprehensive AreaSearch income analysis
Ashburton's income level is among the top percentile nationally according to ATO data aggregated by AreaSearch for financial year 2022. Ashburton's median income among taxpayers is $105,876 and average income stands at $103,645. This compares to Rest of WA's figures of $57,323 and $71,163 respectively. Based on Wage Price Index growth of 14.2% since financial year 2022, current estimates would be approximately $120,910 (median) and $118,363 (average) as of September 2025. Census data reveals household, family and personal incomes all rank highly in Ashburton, between the 96th and 100th percentiles nationally. Distribution data shows the $1,500 - 2,999 earnings band captures 35.4% of the community (2,882 individuals), mirroring regional levels where 31.1% occupy this bracket. Higher earners represent a substantial presence with 49.3% exceeding $3,000 weekly. After housing costs, residents retain 98.2% of income. The area's SEIFA income ranking places it in the 4th decile.
Frequently Asked Questions - Income
Housing
Ashburton is characterized by a predominantly suburban housing profile, with above-average rates of outright home ownership
Ashburton's dwelling structures, as per the latest Census, consisted of 88.4% houses and 11.6% other dwellings (semi-detached, apartments, 'other' dwellings), compared to Non-Metro WA's 81.0% houses and 19.0% other dwellings. Home ownership in Ashburton stood at 8.4%, with mortgaged dwellings at 3.2% and rented ones at 88.4%. The median monthly mortgage repayment was $1,613, lower than Non-Metro WA's average of $1,700. Weekly rent in Ashburton was $48, significantly lower than Non-Metro WA's figure of $220. Nationally, Ashburton's mortgage repayments were lower at $1,613 compared to the Australian average of $1,863, and rents were substantially lower at $48 compared to the national figure of $375.
Frequently Asked Questions - Housing
Household Composition
Ashburton has a typical household mix, with a lower-than-average median household size
Family households account for 73.8% of all households, including 39.6% couples with children, 26.1% couples without children, and 7.0% single parent families. Non-family households constitute the remaining 26.2%, with lone person households at 24.2% and group households comprising 2.0% of the total. The median household size is 2.7 people, which is smaller than the Rest of WA average of 2.8.
Frequently Asked Questions - Households
Local Schools & Education
Ashburton faces educational challenges, with performance metrics placing it in the bottom quartile of areas assessed nationally
Ashburton has lower university qualification rates (16.9%) compared to the Australian average of 30.4%. This presents both challenges and opportunities for targeted educational initiatives. Bachelor degrees are most common at 12.7%, followed by postgraduate qualifications (2.4%) and graduate diplomas (1.8%). Vocational credentials are prevalent, with 54.1% of residents aged 15+ holding them, including advanced diplomas (10.1%) and certificates (44.0%).
Educational participation is high at 37.2%, comprising primary education (19.5%), secondary education (7.1%), and tertiary education (2.5%). Ashburton has a network of 7 schools educating approximately 1,370 students, including 3 primary, 1 secondary, and 3 K-12 schools.
Frequently Asked Questions - Education
Schools Detail
Nearby Services & Amenities
Transport
No public transport data available for this catchment area.
Frequently Asked Questions - Transport
Transport Stops Detail
Health
Ashburton's residents boast exceedingly positive health performance metrics with very low prevalence of common health conditions across all age groups
Ashburton's health outcomes show excellent results with very low prevalence of common health conditions across all age groups. Approximately 73% of Ashburton's total population of 5,912 have private health cover, significantly higher than the national average of 55.3%.
The most prevalent medical conditions in the area are asthma and mental health issues, affecting 6.7% and 5.4% of residents respectively. A majority, 81.2%, report being completely free of medical ailments, comparable to the Rest of WA's 81.3%. Ashburton has a senior population of 3.0%, comprising 245 individuals. While health outcomes among seniors are strong, they require more attention than those in the broader population.
Frequently Asked Questions - Health
Cultural Diversity
The level of cultural diversity witnessed in Ashburton was found to be above average when compared nationally for a number of language and cultural background related metrics
Ashburton's cultural diversity was above average, with 23.4% of its population born overseas and 13.6% speaking a language other than English at home. Christianity was the predominant religion in Ashburton, comprising 35.9% of the population. Notably, the 'Other' religious category comprised 1.8% of Ashburton's population compared to 1.1% across Rest of WA.
In terms of ancestry, Australians made up 27.9%, English 26.2%, and Australian Aboriginal 8.3%. Significant differences were observed in Maori representation at 2.8% (vs regional 2.0%), New Zealand at 1.3% (vs 1.3%), and Samoan at 0.3% (vs 0.2%).
Frequently Asked Questions - Diversity
Age
Ashburton hosts a young demographic, positioning it in the bottom quartile nationwide
Ashburton's median age is 33 years, which is lower than the Rest of WA average of 40 years and substantially under the Australian median of 38 years. Compared to the Rest of WA, Ashburton has a higher concentration of residents aged 35-44 (22.9%), but fewer residents aged 65-74 (2.7%). This concentration of 35-44 year-olds is well above the national average of 14.2%. Between the 2021 Census and the current time, the proportion of residents aged 35 to 44 has grown from 20.2% to 22.9%, while those aged 25 to 34 increased from 20.4% to 21.7%. Conversely, the proportion of residents aged 15 to 24 has declined from 8.6% to 7.5%. Demographic modeling suggests that Ashburton's age profile will evolve significantly by 2041. The 25 to 34 cohort is projected to show strong growth of 24%, adding 415 residents to reach a total of 2,183. In contrast, both the 75 to 84 and 65 to 74 age groups are expected to see reduced numbers.
