Chart Color Schemes
est. as @ -- *
ABS ERP | -- people | --
2021 Census | -- people
Sales Activity
Curious about local property values? Filter the chart to assess the volume and appreciation (including resales) trends and regional comparisons, or scroll to the map below view this information at an individual property level.
Find a Recent Sale
Sales Detail
Population
East Pilbara is positioned among the lower quartile of areas assessed nationally for population growth based on AreaSearch's assessment of recent, and medium term trends
East Pilbara's population was around 6,253 as of Nov 2025. This reflected an increase of 343 people since the 2021 Census, which reported a population of 5,910 people. The change was inferred from the estimated resident population of 6,256 from the ABS as of June 2024 and address validation since the Census date. This level of population equated to a density ratio of 0.00 persons per square kilometer. Population growth for the area was primarily driven by overseas migration during recent periods.
AreaSearch adopted ABS/Geoscience Australia projections for each SA2 area, released in 2024 with 2022 as the base year. For areas not covered and post-2032 estimates, AreaSearch utilized ABS growth rates by age cohort from its Greater Capital Region projections (released in 2023, based on 2022 data). Considering projected demographic shifts, an above median population growth was projected nationally for regional areas, with East Pilbara expected to grow by 1,082 persons to 2041 based on the latest population numbers, reflecting a 17.4% increase over the 17 years.
Frequently Asked Questions - Population
Development
The level of residential development activity in East Pilbara is very low in comparison to the average area assessed nationally by AreaSearch
East Pilbara has seen limited development activity over the past five years, with an average of 3 approvals per year totalling 17. This low level of development is characteristic of rural areas where housing needs are specific and not driven by broad market demand. Notably, the small number of approvals can significantly impact annual growth and relativity statistics.
Compared to the rest of WA and national averages, East Pilbara has shown significantly less construction activity. All new constructions in the area have been detached houses, catering to families seeking a rural lifestyle. With an estimated 836 people per dwelling approval, East Pilbara's development environment is quiet and low-activity. Future projections indicate that by 2041, East Pilbara will add 1,085 residents.
If current development rates continue, housing supply may not keep pace with population growth, potentially increasing competition among buyers and supporting stronger price growth.
Frequently Asked Questions - Development
Infrastructure
East Pilbara has emerging levels of nearby infrastructure activity, ranking in the 39thth percentile nationally
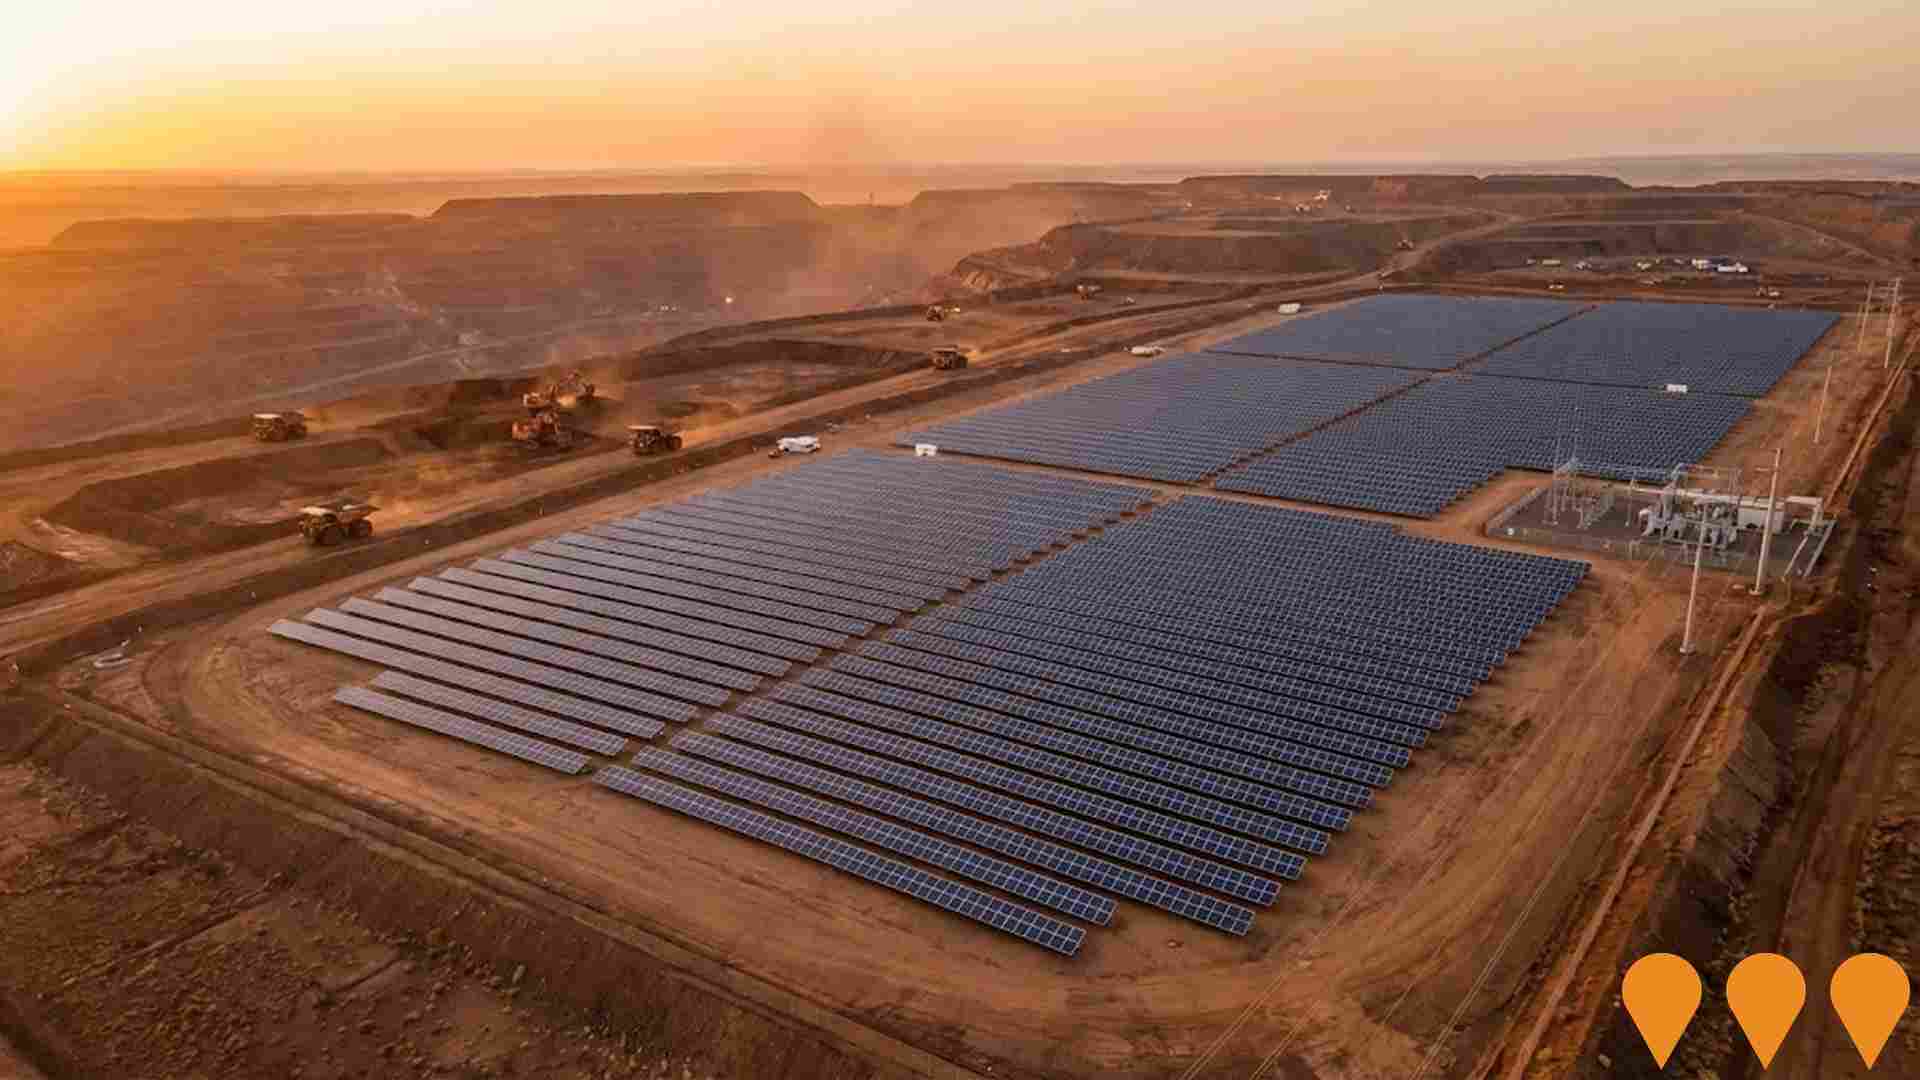
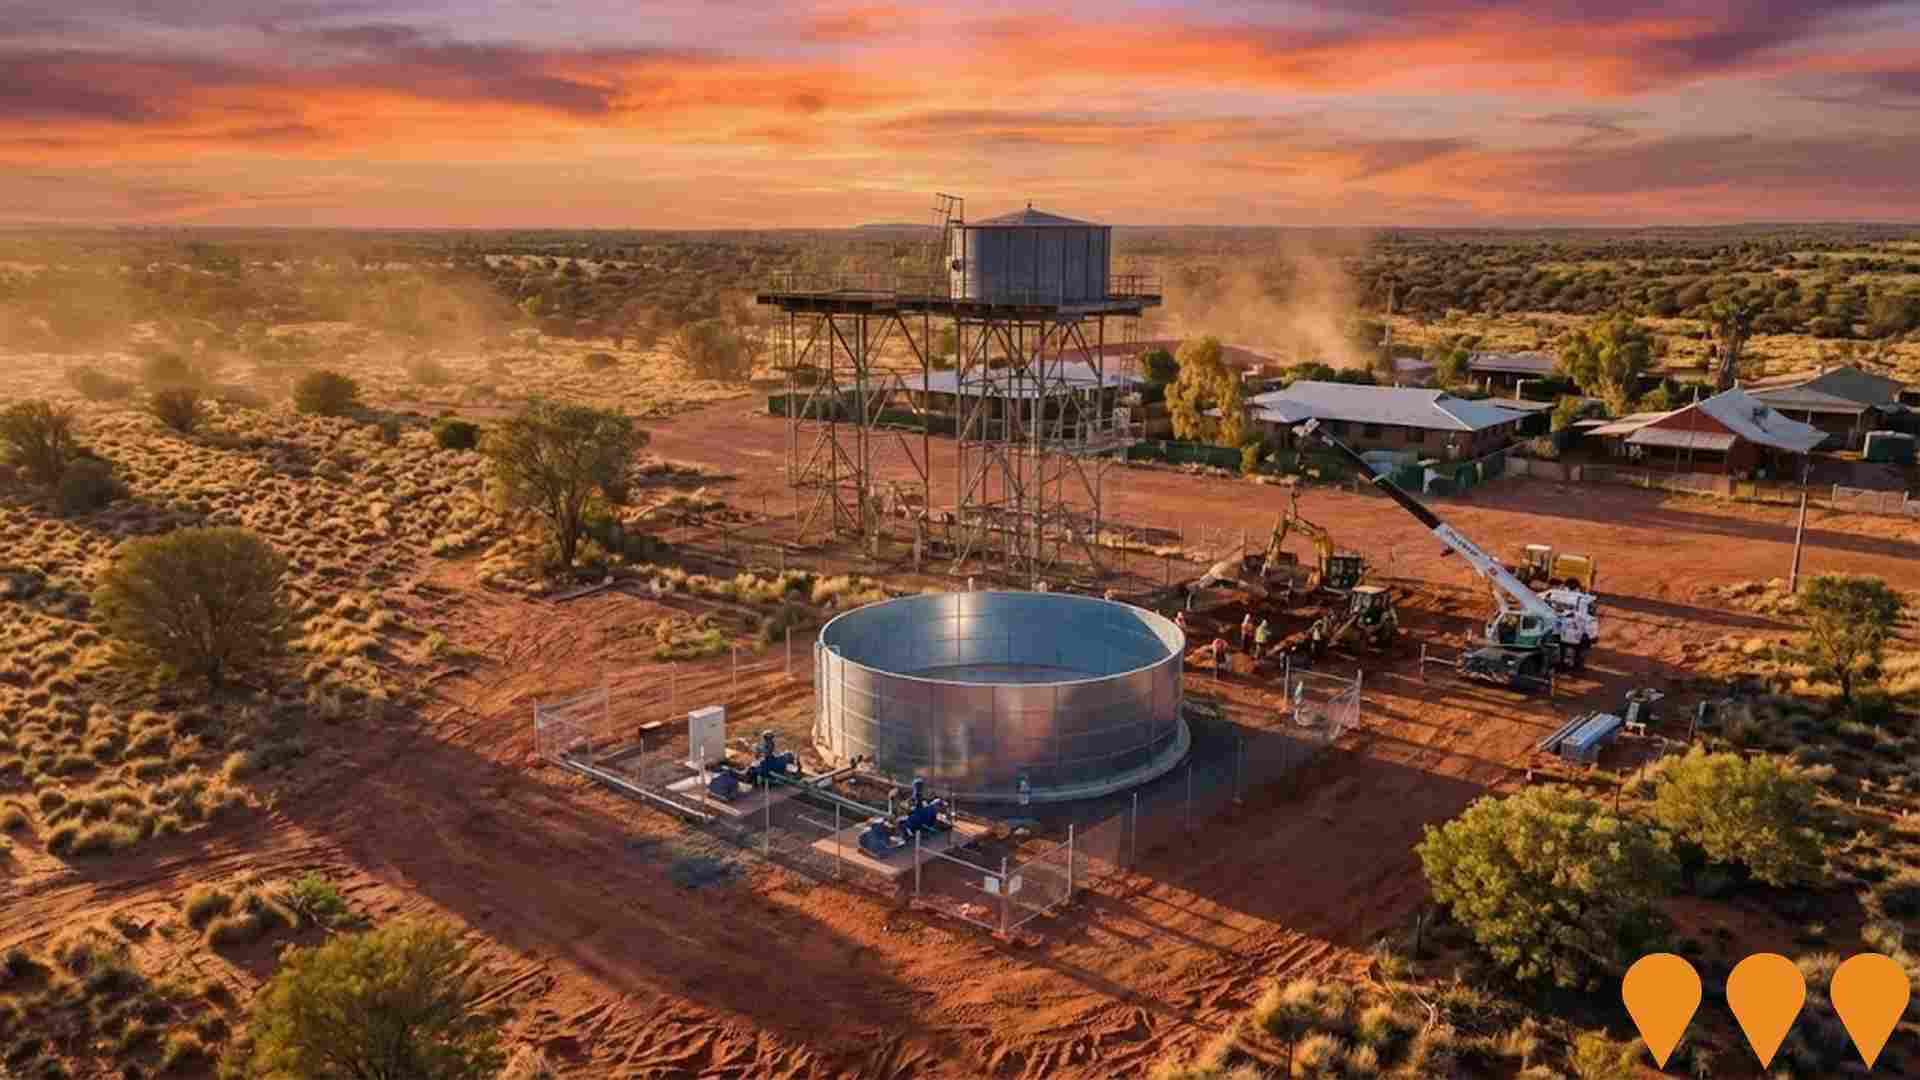
Changes to local infrastructure significantly impact an area's performance. AreaSearch identified 68 projects likely influencing the region. Notable initiatives include Green Iron Metal Project, Great Northern Highway Overtaking Lanes Newman-Port Hedland, Cloudbreak Solar Farm, and Jigalong Water Infrastructure Upgrade. The following list details those most relevant.
Professional plan users can use the search below to filter and access additional projects.
INFRASTRUCTURE SEARCH
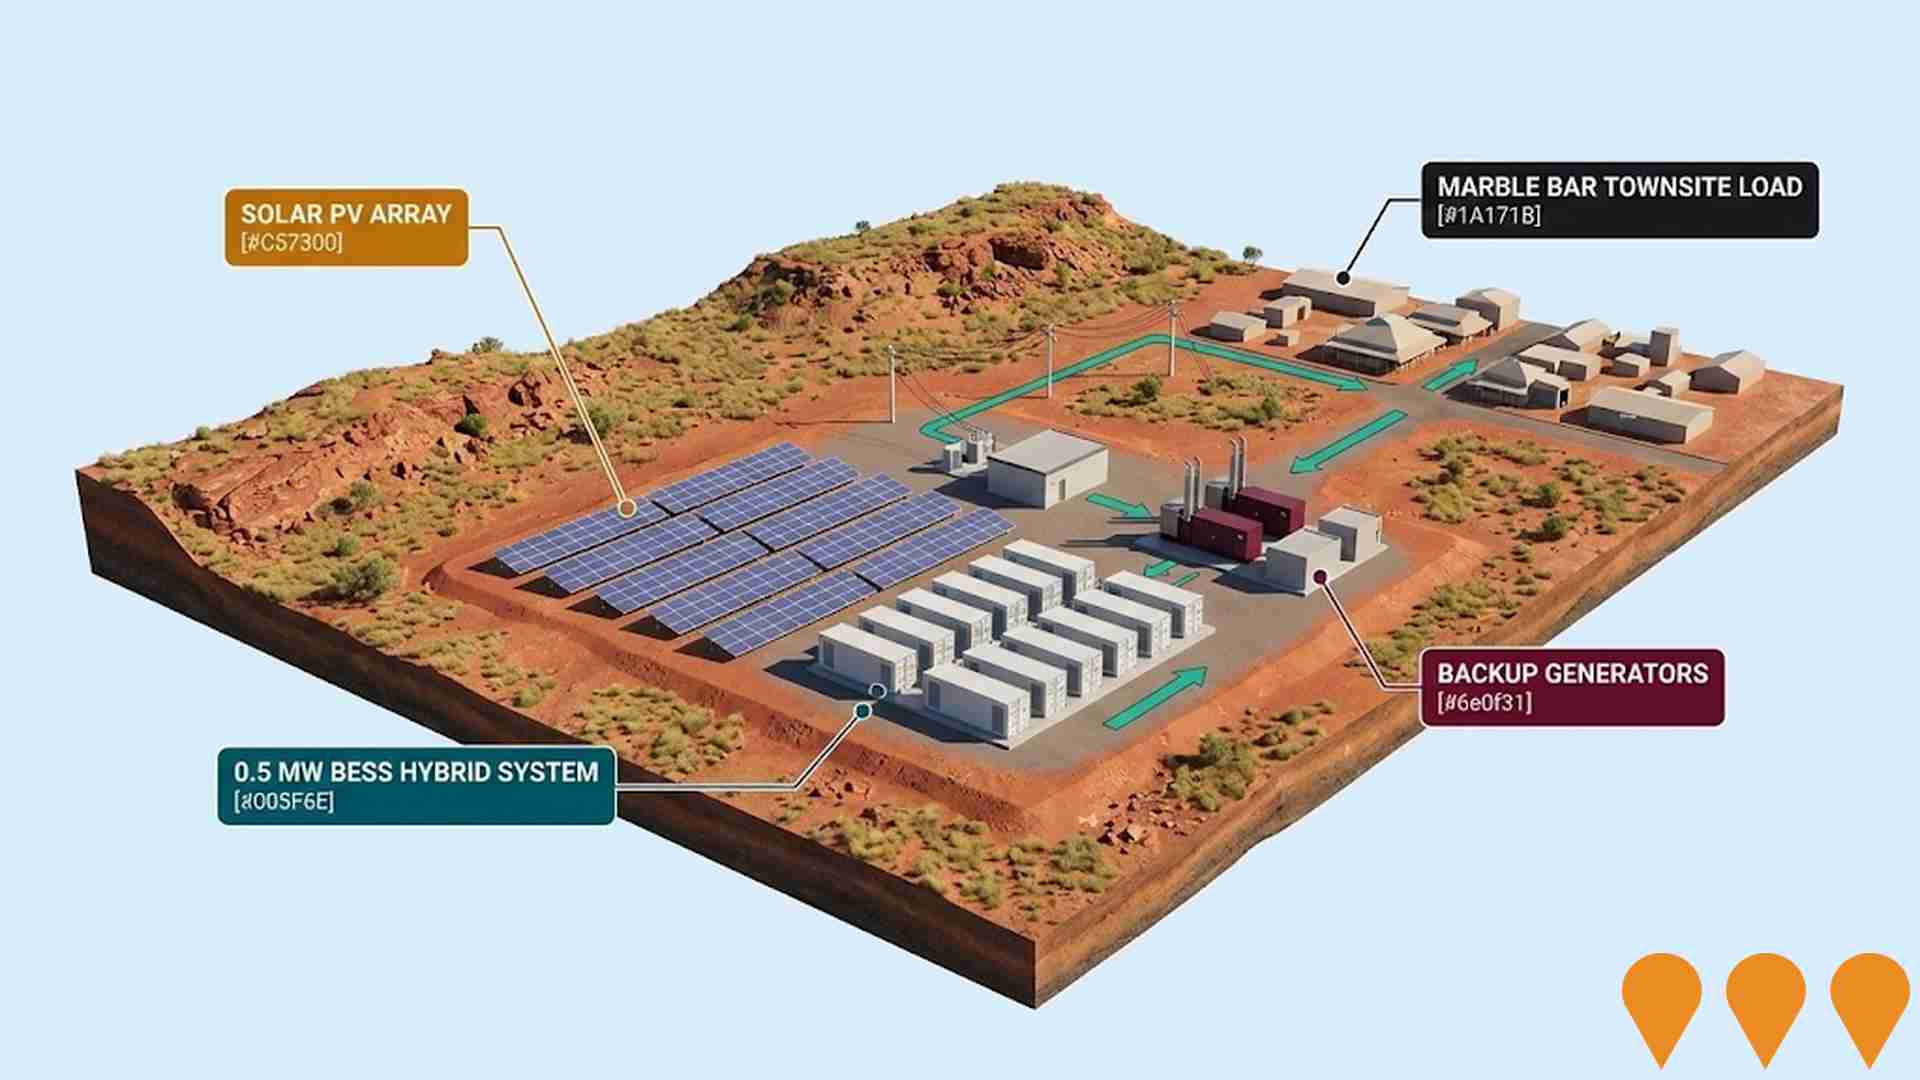
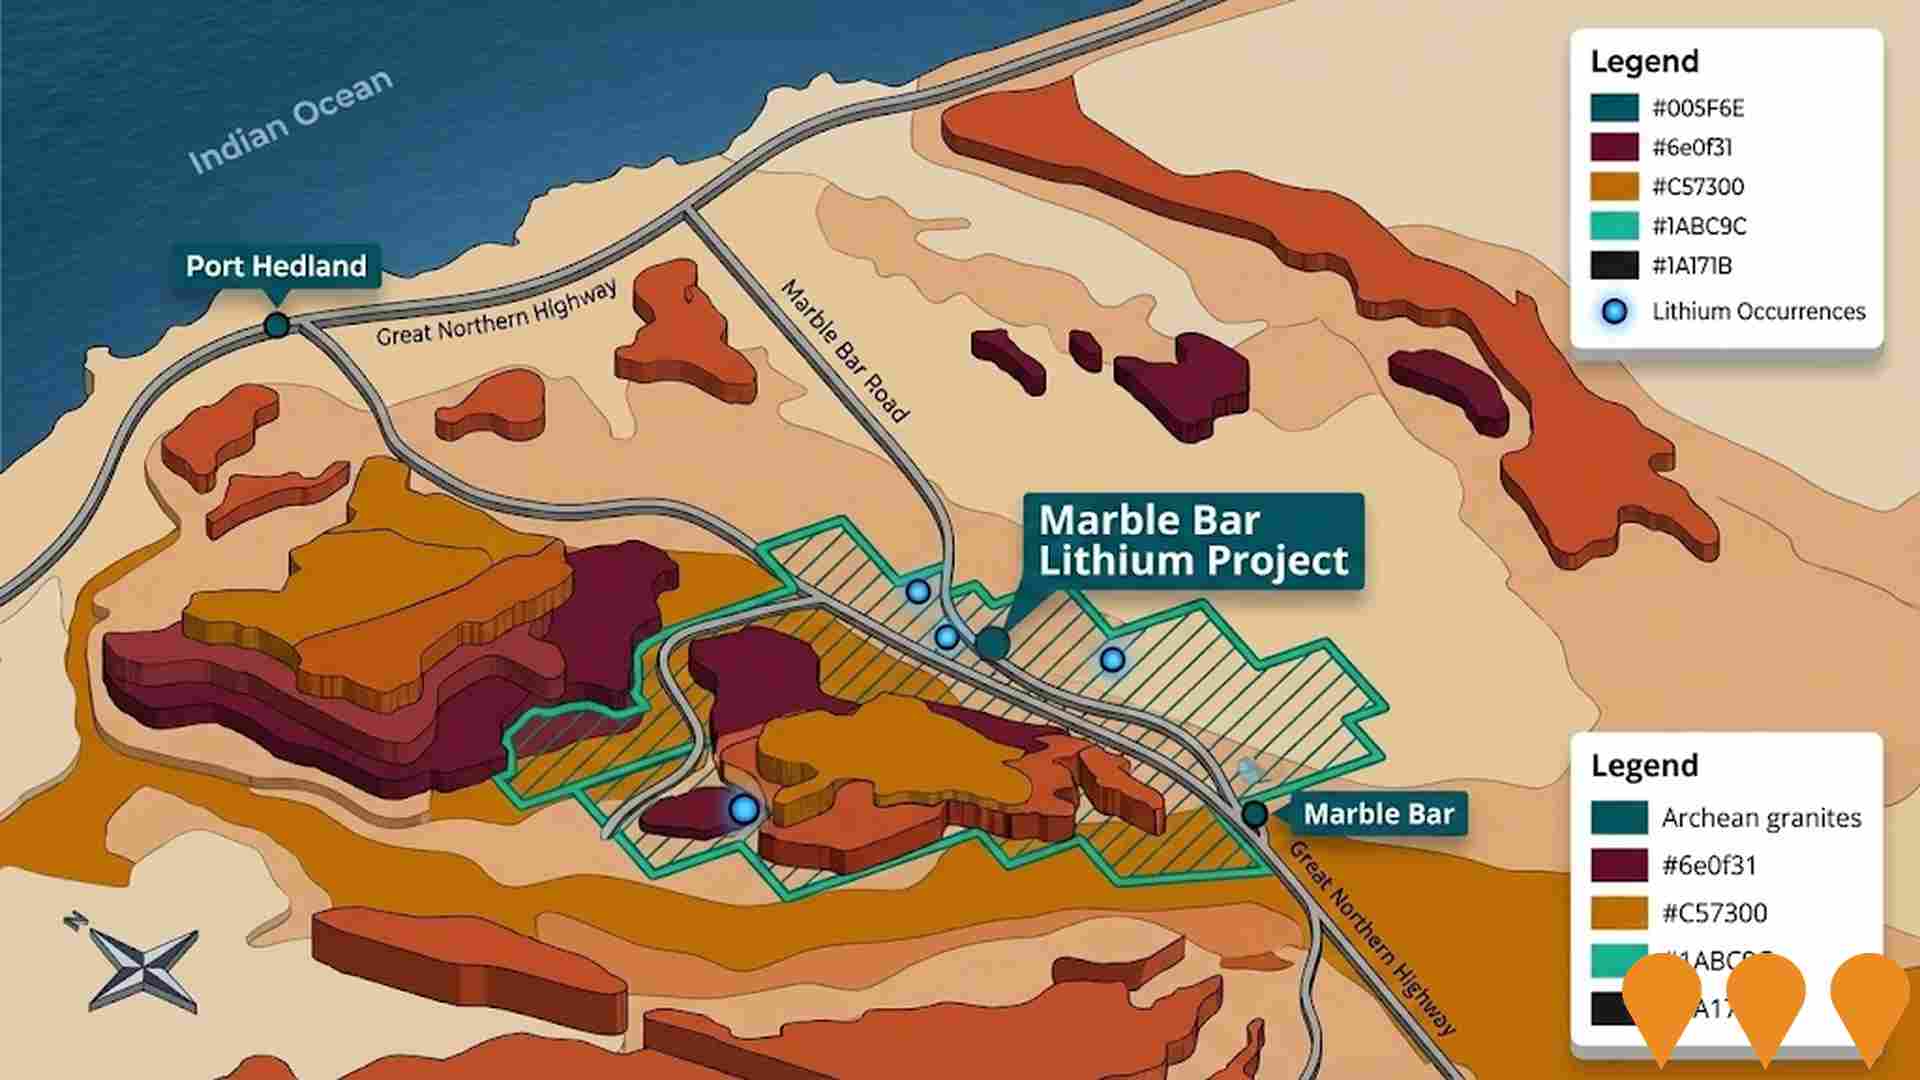
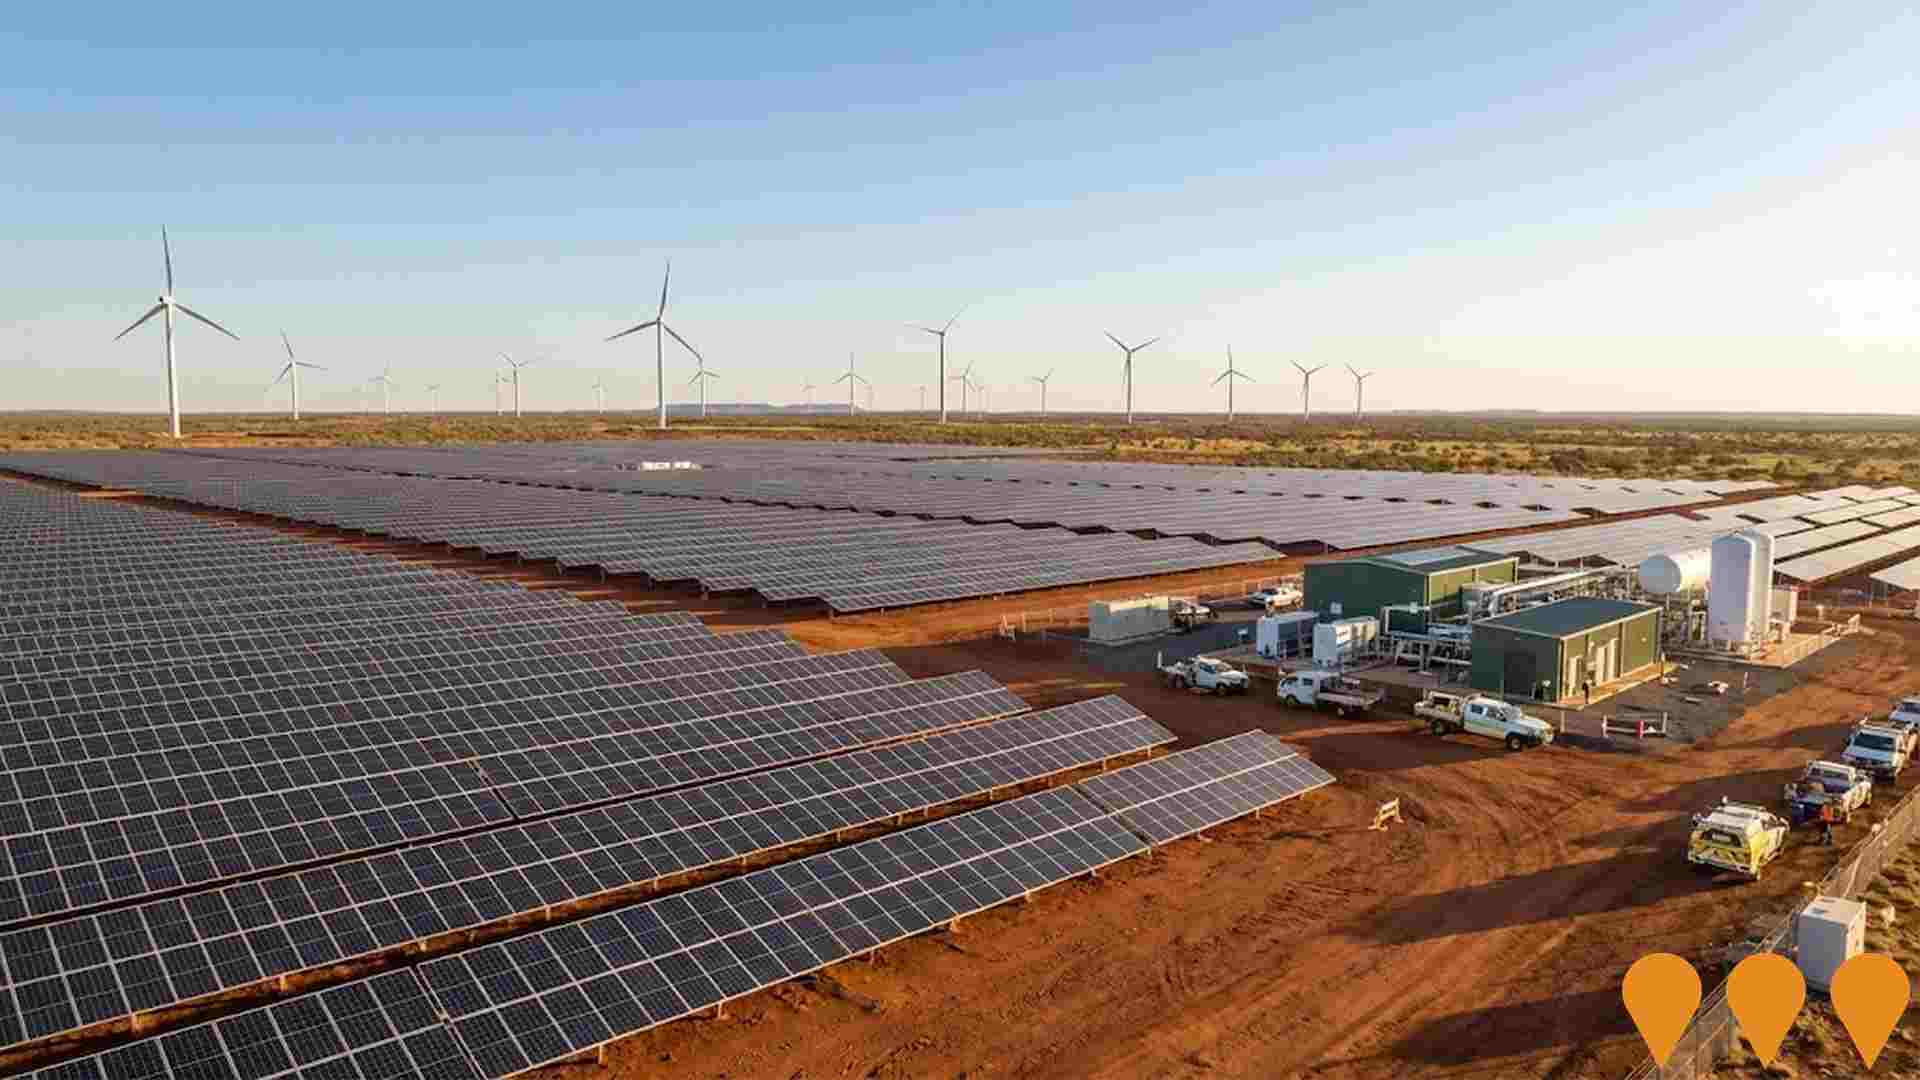
 Denotes AI-based impression for illustrative purposes only, not to be taken as definitive under any circumstances. Please follow links and conduct other investigations from the project's source for actual imagery. Developers and project owners wishing us to use original imagery please Contact Us and we will do so.
Frequently Asked Questions - Infrastructure
Australian Renewable Energy Hub (AREH)
The Australian Renewable Energy Hub (AREH) is a large-scale renewable energy and green hydrogen project in the East Pilbara region of Western Australia, covering approximately 6,500 km2. The project is planned to deliver up to 26 GW of combined solar and wind generation capacity with associated green hydrogen and ammonia production. Major environmental approvals were granted in 2024, enabling the project to progress toward final investment decision and phased construction from 2027 onward.
Resources Community Investment Initiative
A $750 million partnership between the Western Australian Government and seven major resource companies (Rio Tinto, BHP, Woodside Energy, Chevron Australia, Mineral Resources, Fortescue, Roy Hill) to co-fund community, social and regional infrastructure projects across regional Western Australia, with strong focus on the Pilbara, Goldfields, Kimberley, Mid West and Gascoyne.
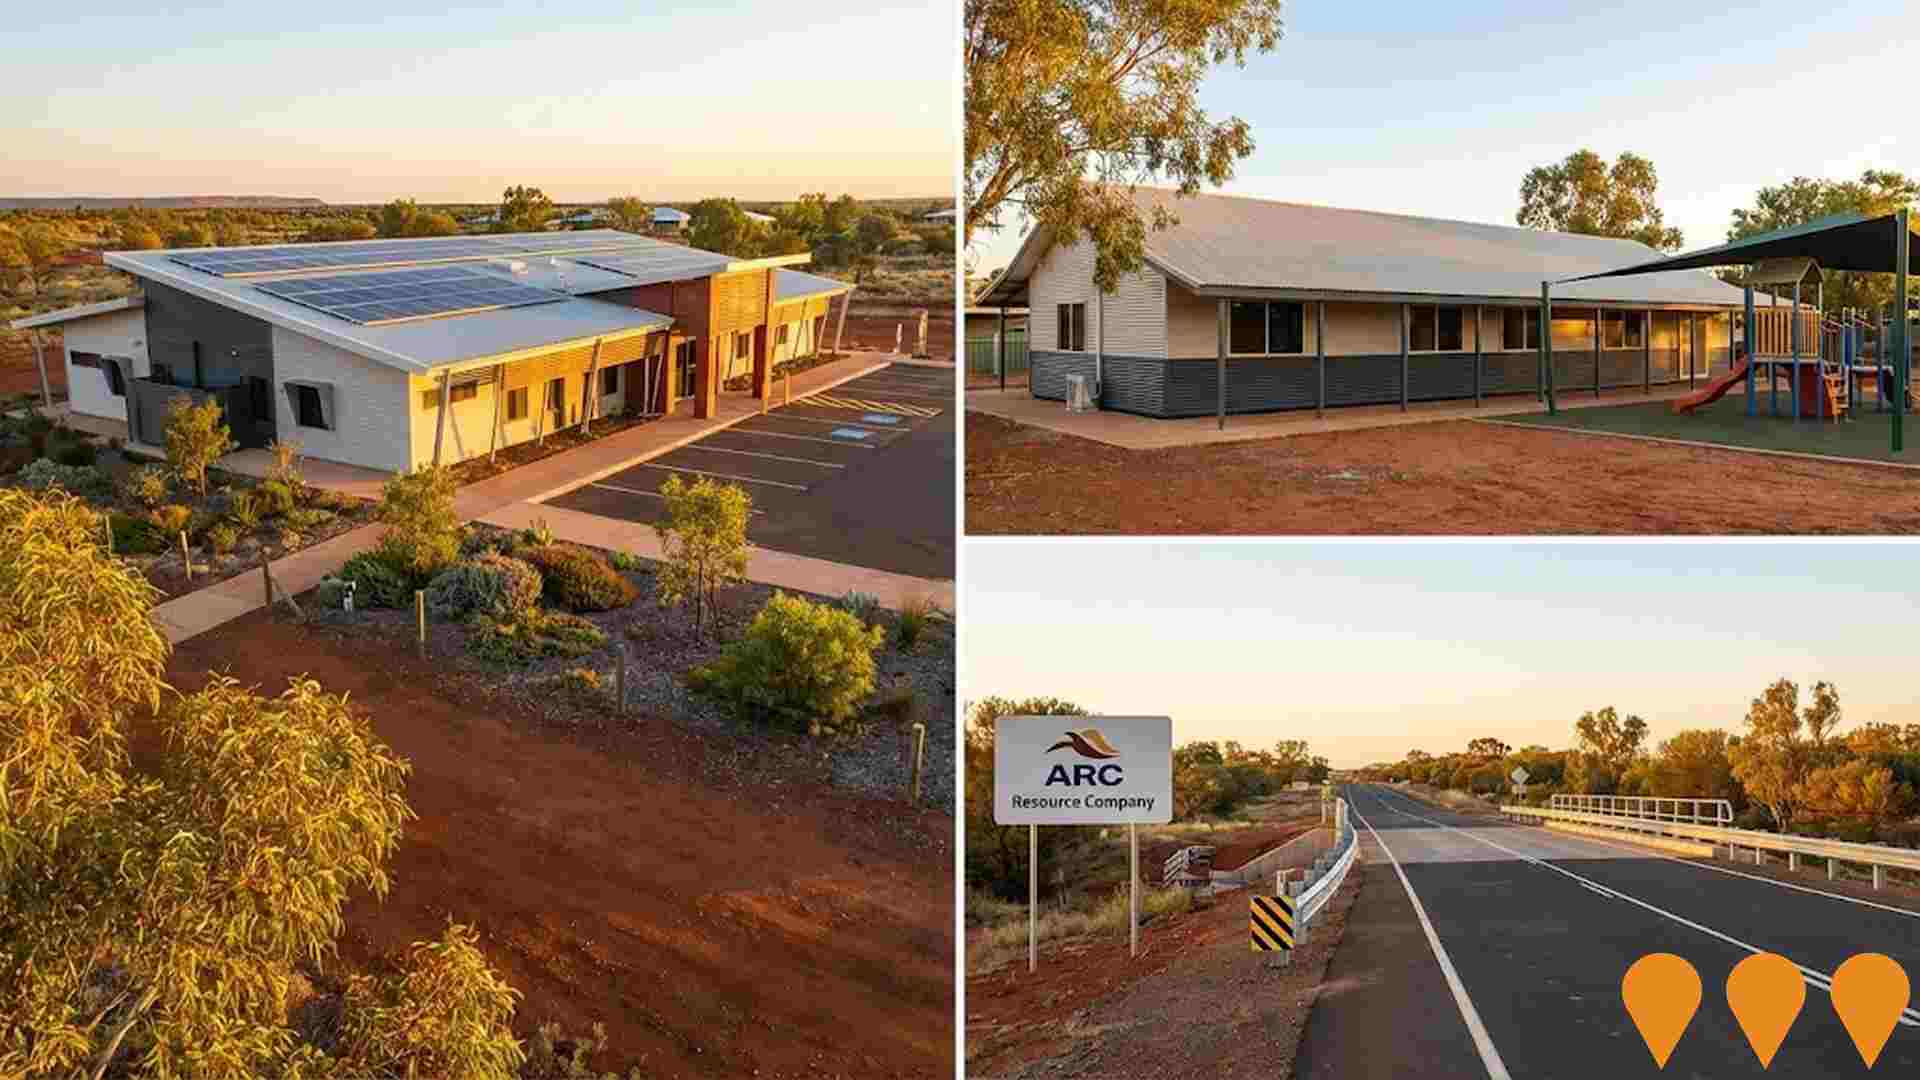
Newman Health Service Redevelopment Project
A $61.4 million redevelopment delivering a new emergency department, inpatient unit, outpatient and GP consulting spaces, dental clinic, medical imaging and pathology to serve Newman and the East Pilbara. The facility was officially opened in May 2023 and operates as a contemporary one-stop health hub.

Newman Solar Farm Development
Large-scale solar energy project to provide renewable electricity to Newman and surrounding mining operations, reducing dependence on fossil fuels.

Great Northern Highway Overtaking Lanes Newman-Port Hedland
Construction of 11 new overtaking lanes on the Great Northern Highway between Newman and Port Hedland to improve safety and freight efficiency. Package 1 (Newman to Auski) has five lanes now open. Package 2 (Auski to Port Hedland) is scheduled to commence in late 2025 with completion expected by mid-2026. Joint Australian and WA Government funding.

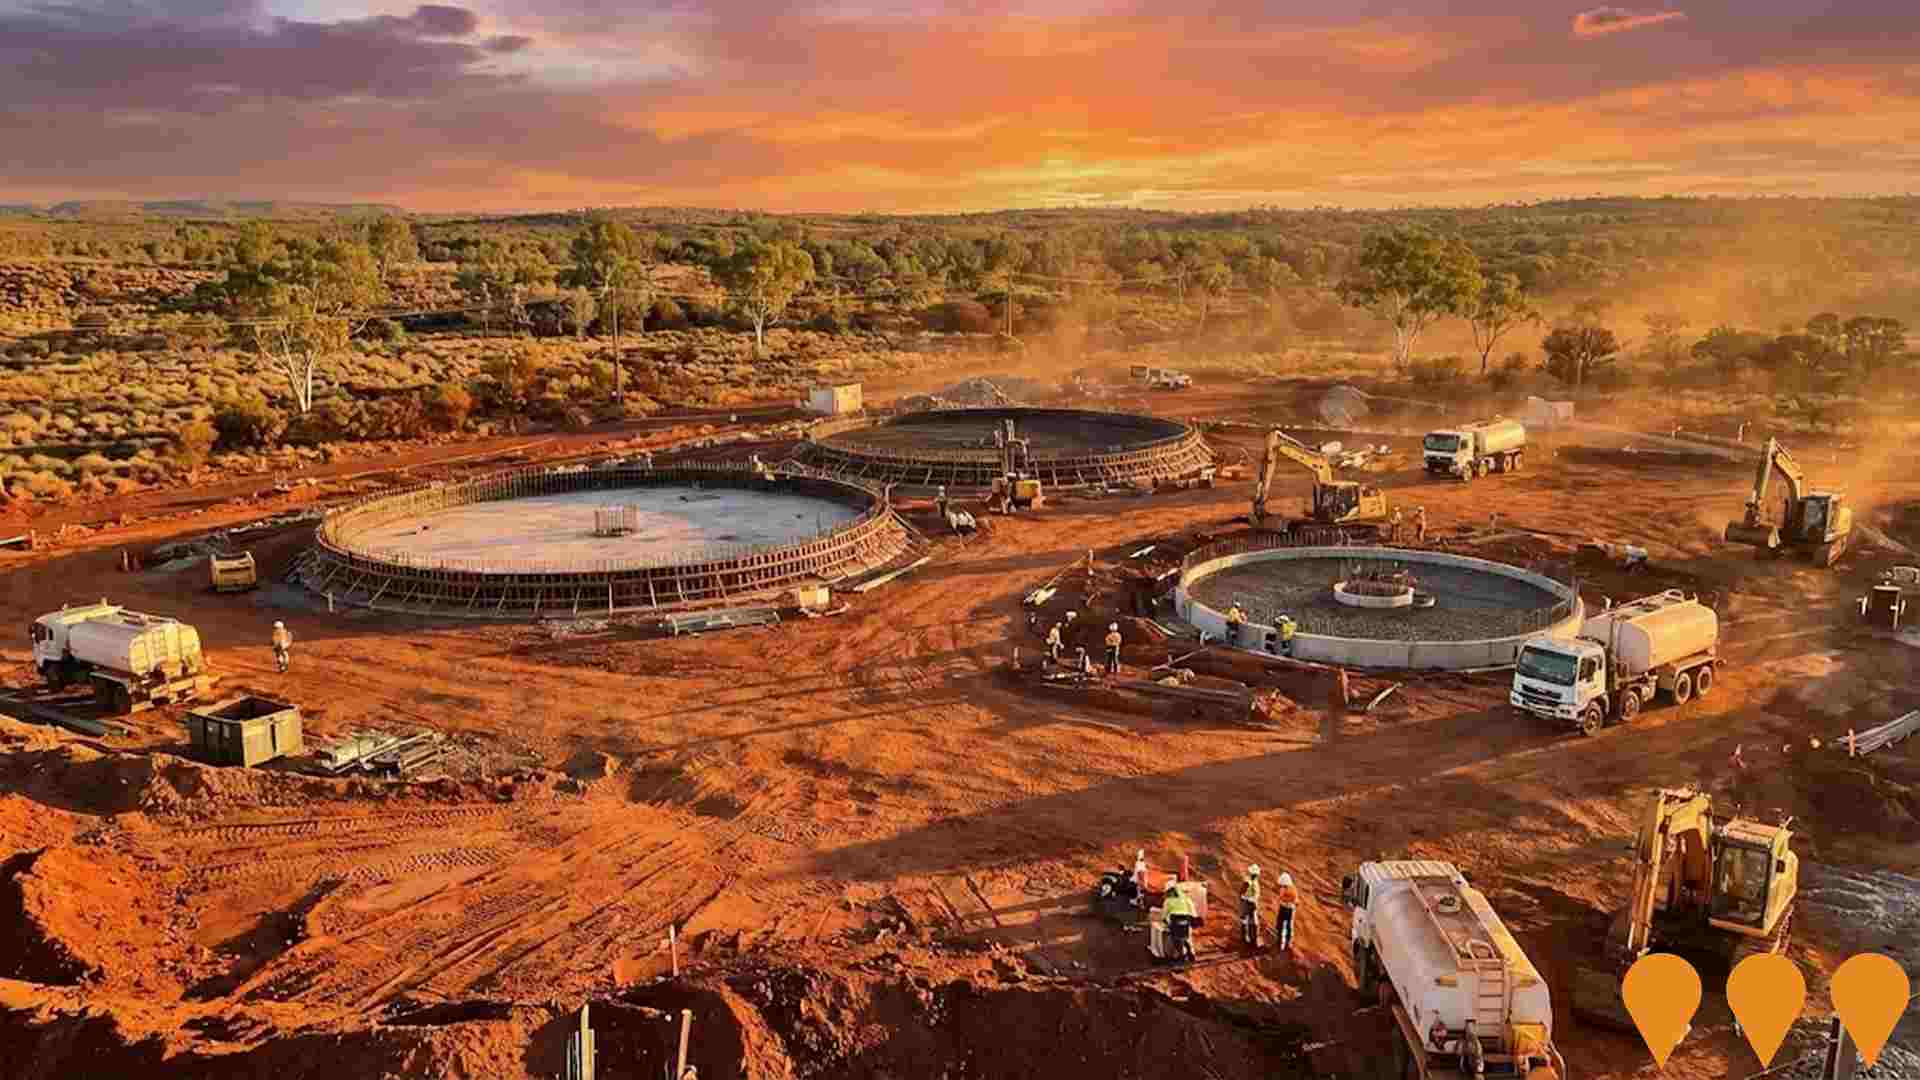
Newman Water Treatment Plant Upgrade
Upgrading Newman's water treatment infrastructure to ensure reliable water supply for the growing community and mining operations. Includes advanced filtration systems and expanded capacity.
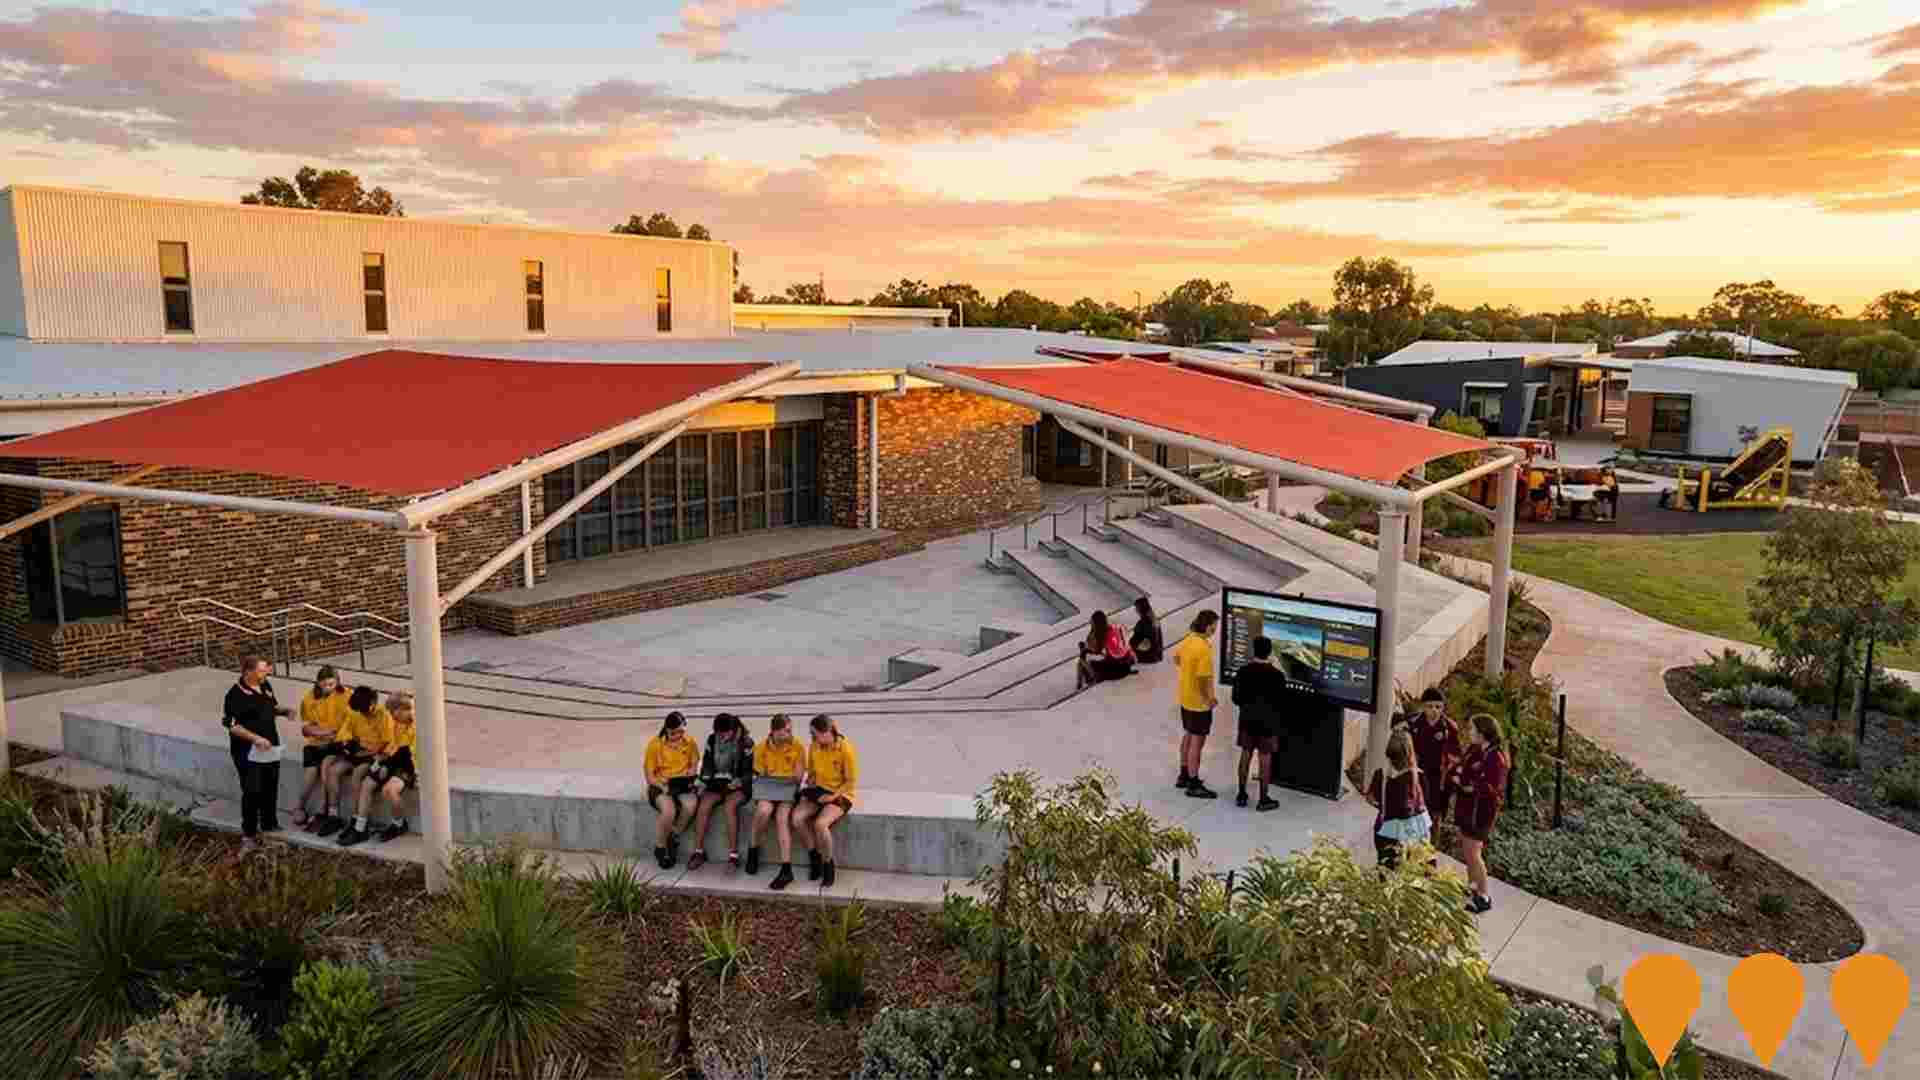
Newman Education Precinct Upgrade
Modernization of Newman's educational facilities including new classrooms, technology upgrades, and specialized learning spaces for mining industry training.
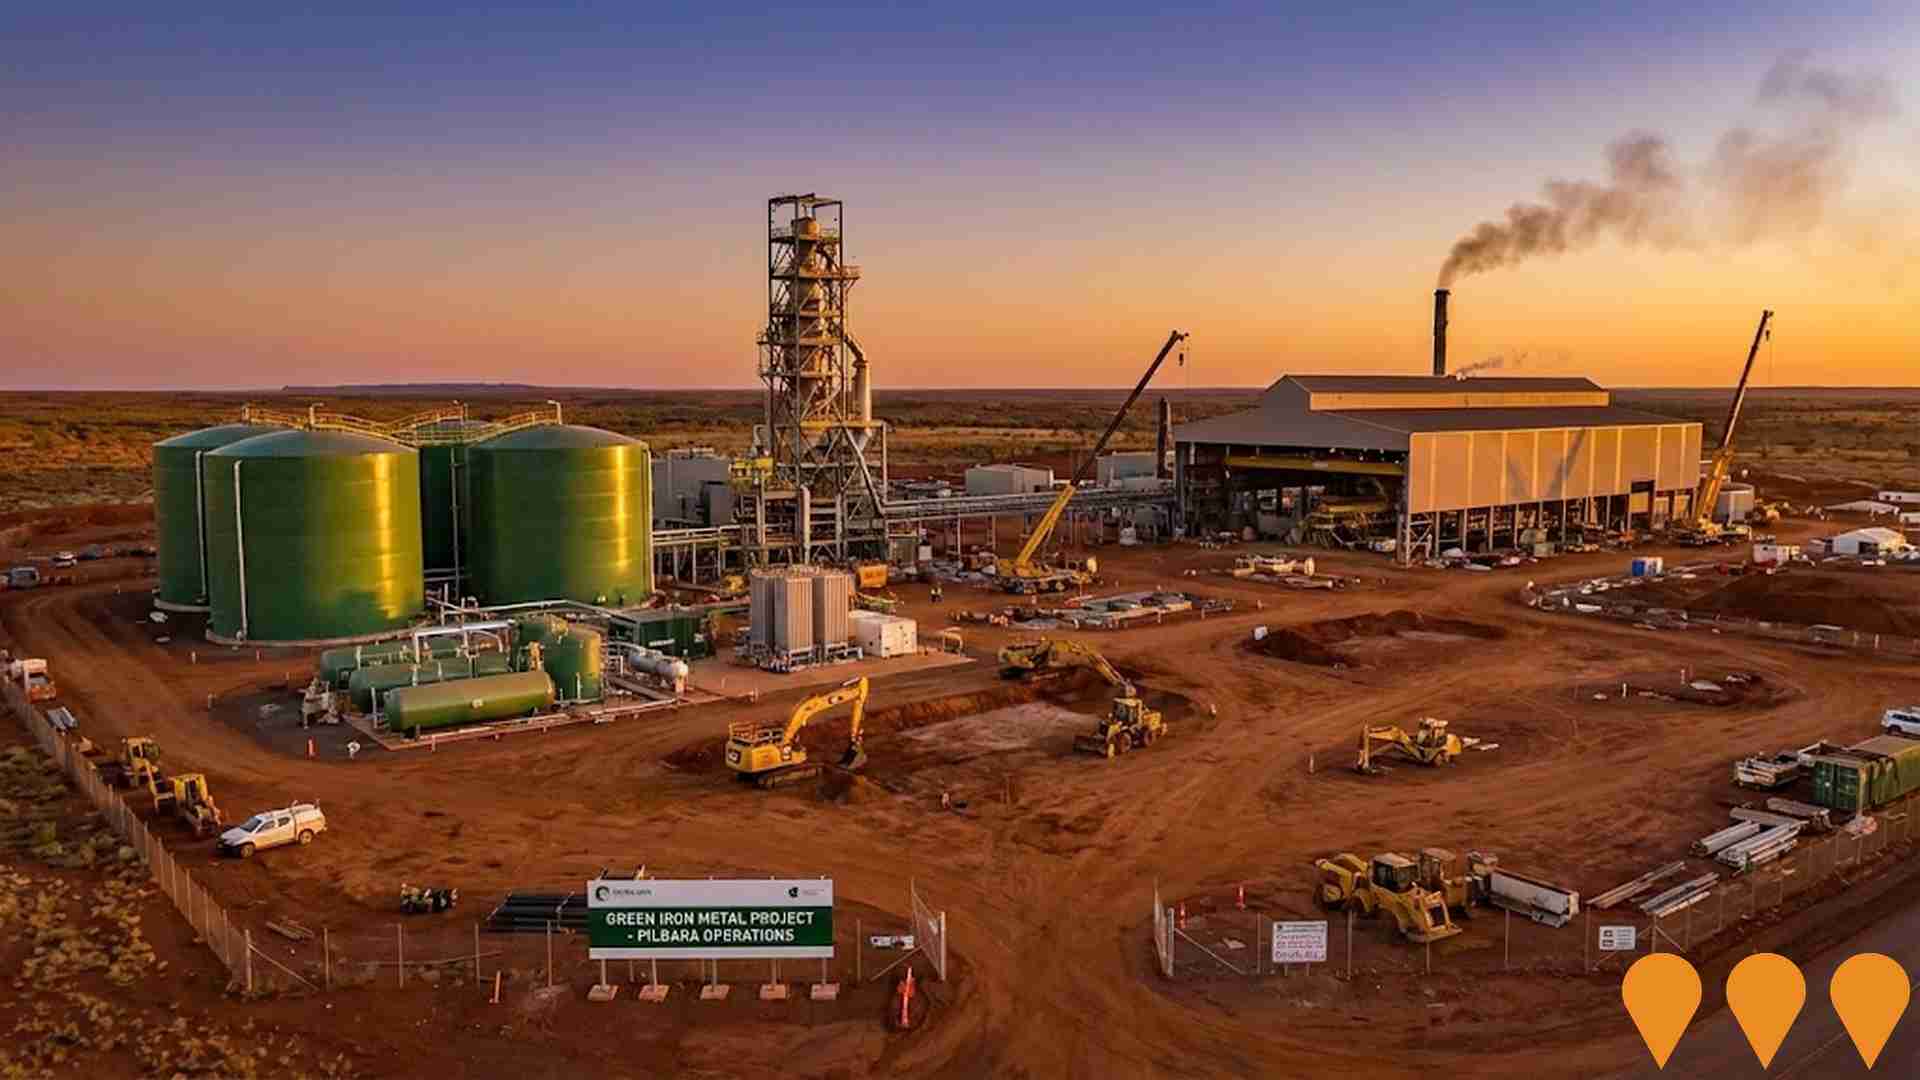
Green Iron Metal Project
A project to produce more than 1,500 tonnes per annum of green metal, located at the Green Energy Hub at Christmas Creek. It will use green hydrogen to convert iron ore into sponge iron, which is then processed in an electric smelting furnace to produce high-purity green metal.
Employment
The employment landscape in East Pilbara presents a mixed picture: unemployment remains low at 3.7%, yet recent job losses have affected its comparative national standing
East Pilbara has a diverse workforce with both white and blue collar jobs. The construction sector is prominent, and the unemployment rate was 3.7% in June 2025.
There were 4,234 residents employed at this time, which is 0.5% higher than Rest of WA's unemployment rate of 3.2%. Workforce participation was lower at 52.1%, compared to Rest of WA's 59.4%. The dominant employment sectors are mining, construction, and accommodation & food services. Mining particularly stands out with an employment share 4.8 times the regional level.
Conversely, health care & social assistance has a lower representation at 1.5% versus the regional average of 11.9%. As per the Census, there are 2.4 workers for every resident, indicating that East Pilbara functions as an employment hub with more jobs than residents. Between June 2024 and June 2025, labour force levels decreased by 3.5%, while employment fell by 5.3%, causing unemployment to rise by 1.8 percentage points. This contrasts with Rest of WA where employment grew by 1.1% during the same period. Jobs and Skills Australia's national employment forecasts from May 2025 project a 6.6% increase in employment over five years and 13.7% over ten years. However, applying these projections to East Pilbara's employment mix suggests local growth of approximately 3.9% over five years and 10.0% over ten years.
Frequently Asked Questions - Employment
Income
Income analysis reveals strong economic positioning, with the area outperforming 60% of locations assessed nationally by AreaSearch
AreaSearch's aggregation of ATO data for financial year 2022 shows East Pilbara had a median taxpayer income of $82,416 and an average income of $93,949. These figures place East Pilbara in the top percentile nationally, compared to Rest of WA's $57,323 and $71,163 respectively. Based on Wage Price Index growth of 14.2% since financial year 2022, estimated incomes as of September 2025 are approximately $94,119 (median) and $107,290 (average). In 2021 Census figures, East Pilbara's individual earnings ranked at the 99th percentile nationally ($1,801 weekly), but household income was at the 11th percentile. The data indicates that 27.6% of residents (1,725 people) fall into the $800 - 1,499 income bracket, unlike surrounding regions where 31.1% are in the $1,500 - 2,999 range. East Pilbara retains 90.8% of income after housing costs, with total disposable income ranking at the 18th percentile nationally.
Frequently Asked Questions - Income
Housing
East Pilbara is characterized by a predominantly suburban housing profile, with above-average rates of outright home ownership
In East Pilbara, as per the latest Census evaluation, 87.2% of dwellings were houses, with the remaining 12.7% being semi-detached, apartments, or other types. This compares to Non-Metro WA's 76.2% houses and 23.7% other dwellings. Home ownership in East Pilbara stood at 13.0%, with mortgaged dwellings at 9.3% and rented ones at 77.7%. The median monthly mortgage repayment was $2,435, higher than Non-Metro WA's average of $1,863. The median weekly rent in East Pilbara was $70, lower than Non-Metro WA's $180 and the national average of $375.
Frequently Asked Questions - Housing
Household Composition
East Pilbara features high concentrations of lone person households, with a higher-than-average median household size
Family households constitute 68.2% of all households, including 29.1% couples with children, 19.3% couples without children, and 15.6% single parent families. Non-family households account for the remaining 31.8%, with lone person households at 30.7% and group households comprising 2.0%. The median household size is 3.3 people, larger than the Rest of WA average of 2.7.
Frequently Asked Questions - Households
Local Schools & Education
East Pilbara faces educational challenges, with performance metrics placing it in the bottom quartile of areas assessed nationally
The area faces educational challenges, with university qualification rates at 15.8%, significantly lower than the Australian average of 30.4%. This presents both a challenge and an opportunity for targeted educational initiatives. Bachelor degrees are most common at 11.5%, followed by postgraduate qualifications (3.4%) and graduate diplomas (0.9%). Trade and technical skills are prominent, with 53.4% of residents aged 15+ holding vocational credentials - advanced diplomas (9.0%) and certificates (44.4%).
Educational participation is high at 40.6%, including 16.0% in primary education, 9.7% in secondary education, and 4.5% pursuing tertiary education. As of September 2021, a network of 10 schools operates within East Pilbara, educating approximately 259 students. All 10 schools offer integrated K-12 education for academic continuity. Local school capacity is limited at 4.1 places per 100 residents, compared to the regional average of 15.4, leading many families to travel for schooling. Note: where schools show 'n/a' for enrolments, please refer to parent campus.
Frequently Asked Questions - Education
Schools Detail
Nearby Services & Amenities
Transport
No public transport data available for this catchment area.
Frequently Asked Questions - Transport
Transport Stops Detail
Health
East Pilbara's residents boast exceedingly positive health performance metrics with very low prevalence of common health conditions across all age groups
Health outcomes data shows excellent results across East Pilbara, with very low prevalence of common health conditions across all age groups. The rate of private health cover is exceptionally high at approximately 68% of the total population (4264 people), compared to 70.8% across Rest of WA and a national average of 55.3%. Diabetes and asthma are the most common medical conditions in the area, impacting 5.5 and 5.1% of residents respectively, while 81.6% declare themselves completely clear of medical ailments, compared to 80.7% across Rest of WA.
As of 2021, 4.4% of residents are aged 65 and over (277 people). Health outcomes among seniors are particularly strong, broadly in line with the general population's health profile.
Frequently Asked Questions - Health
Cultural Diversity
East Pilbara was found to be more culturally diverse than the vast majority of local markets in Australia, upon assessment of a range of language and cultural background related metrics
East Pilbara was found to have a higher proportion of overseas-born residents, with 27.2% born abroad, compared to most local markets. Additionally, 36.8% spoke a language other than English at home. Christianity was the predominant religion in East Pilbara, with 41.7% of people identifying as such.
However, there was an overrepresentation of 'Other' religions, comprising 5.5%, compared to 1.6% across the rest of WA. In terms of ancestry, Australian Aboriginal was the most represented group at 25.6%, substantially higher than the regional average of 14.8%. English ancestry followed at 23.5%, and Australian ancestry was present at 16.0%, notably lower than the regional average of 22.1%. Certain ethnic groups showed notable divergences: Maori were overrepresented at 2.3% (vs 2.7%), Filipino at 2.0% (vs 2.7%), and Samoan at 0.3% (vs 0.3%).
Frequently Asked Questions - Diversity
Age
East Pilbara's population is slightly younger than the national pattern
The median age in East Pilbara is 35 years, which is lower than Rest of WA's average of 40 and also slightly below the Australian median of 38. Compared to Rest of WA, East Pilbara has a higher percentage of residents aged 25-34 (27.1%) but fewer residents aged 5-14 (4.4%). This concentration of 25-34 year-olds is significantly above the national average of 14.5%. Between the 2016 and 2021 Census, East Pilbara's median age decreased from 36 to 35 years. During this period, the percentage of residents aged 35-44 increased from 22.0% to 25.7%, while those aged 25-34 rose from 25.7% to 27.1%. Conversely, the percentage of residents aged 15-24 declined from 10.7% to 8.3%, and those aged 5-14 dropped from 5.7% to 4.4%. By 2041, East Pilbara's age composition is expected to change significantly. The 35-44 age group is projected to grow by 24% (388 people), reaching 1,997 from 1,608. Meanwhile, population declines are anticipated for the 65-74 and 5-14 age groups.
