Chart Color Schemes
This analysis uses ABS Statistical Areas Level 2 (SA2) boundaries, which can materially differ from Suburbs and Localities (SAL) even when sharing similar names.
SA2 boundaries are defined by the Australian Bureau of Statistics and are designed to represent communities for statistical reporting (e.g., census and ERP).
Suburbs and Localities (SAL) represent commonly-used suburb/locality names (postal-style areas) and may use different geographic boundaries. For comprehensive analysis, consider reviewing both boundary types if available.
est. as @ -- *
ABS ERP | -- people | --
2021 Census | -- people
Sales Activity
Curious about local property values? Filter the chart to assess the volume and appreciation (including resales) trends and regional comparisons, or scroll to the map below view this information at an individual property level.
Find a Recent Sale
Sales Detail
Population
Inala - Richlands lies within the top quartile of areas nationally for population growth performance according to AreaSearch analysis of recent, and medium to long-term trends
As of November 2025, Inala-Richlands' population is approximately 21,797. This figure represents a growth of 1,906 people since the 2021 Census, which recorded a population of 19,891. The increase was inferred from ABS's June 2024 estimated resident population of 21,363 and an additional 296 validated new addresses post-Census date. This results in a density ratio of 2,005 persons per square kilometer, higher than the national average assessed by AreaSearch. The area's 9.6% growth since 2021 exceeds the national average of 8.9%, indicating it as a region with significant population growth. Overseas migration contributed approximately 61.3% to this growth.
AreaSearch uses ABS/Geoscience Australia projections for each SA2 area, released in 2024 with a base year of 2022. For areas not covered by this data and years post-2032, Queensland State Government's SA2 area projections are adopted, based on 2021 data and released in 2023. However, these state projections do not provide age category splits, so AreaSearch applies proportional growth weightings from ABS Greater Capital Region projections (released in 2023, based on 2022 data) for each age cohort. Future population trends forecast a significant increase in the top quartile of national statistical areas. By 2041, Inala-Richlands is expected to expand by 6,784 persons, reflecting a total increase of 29.1% over the 17-year period, based on the latest annual ERP population numbers.
Frequently Asked Questions - Population
Development
AreaSearch assessment of residential development activity positions Inala - Richlands among the top 25% of areas assessed nationwide
Inala-Richlands averaged approximately 84 new dwelling approvals annually over the past five financial years, from FY21 to FY25. A total of 422 homes were approved during this period, with an additional 50 approved in FY26 as of present. On average, 3.1 people moved to the area for each dwelling built over these five years, indicating a significant demand outpacing supply which may exert upward pressure on prices and intensify competition among buyers.
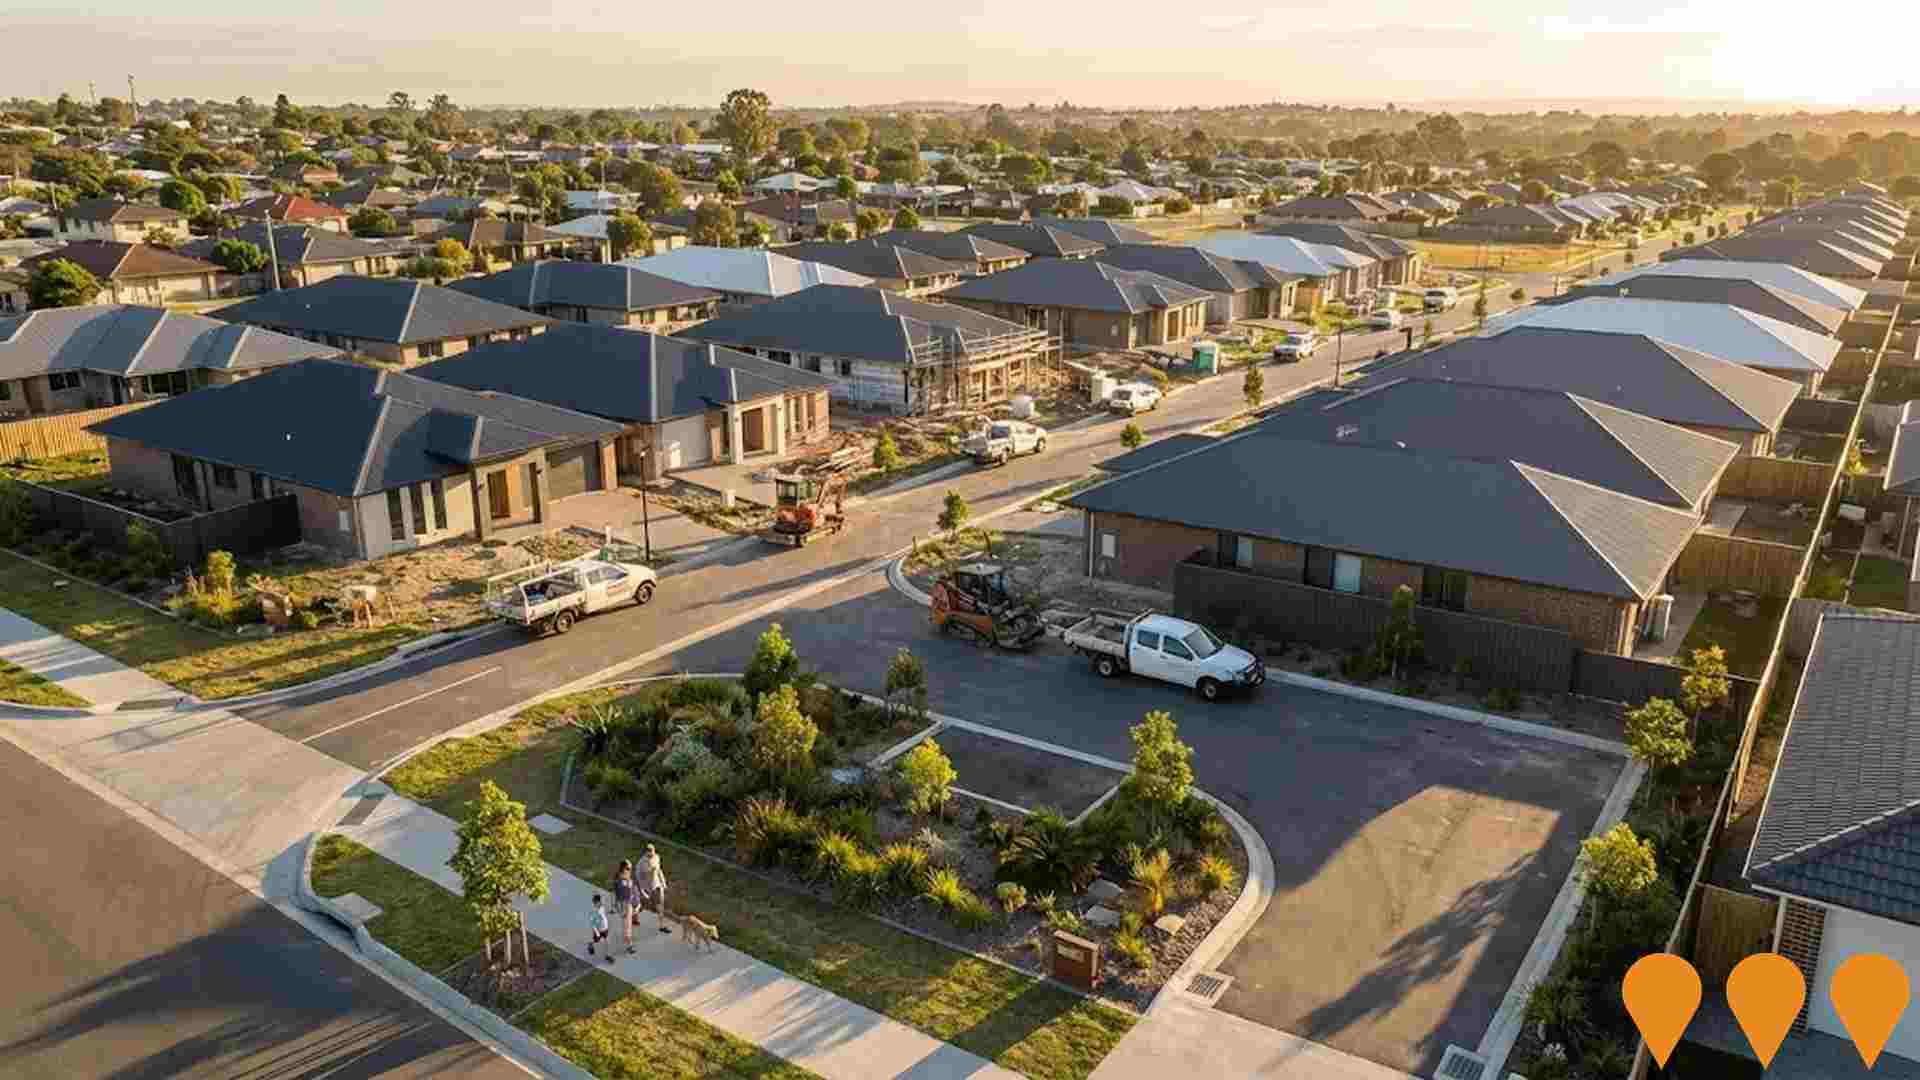
The average construction cost value of new homes was $260,000, lower than regional levels, suggesting more affordable housing options. This financial year has seen $139.0 million in commercial development approvals, reflecting robust local business investment. Compared to Greater Brisbane, Inala-Richlands maintains comparable new home approvals per capita, preserving market equilibrium with surrounding areas. The current new development composition is 58.0% standalone homes and 42.0% attached dwellings, with a growing mix of townhouses and apartments offering diverse housing options across different price points.
This shift represents a notable change from the area's existing housing stock, which is currently 75.0% houses. This trend suggests decreasing availability of developable sites and reflects evolving lifestyles and the need for more affordable, compact living choices. With around 278 people moving to the area per dwelling approval, Inala-Richlands exhibits a developing market. According to AreaSearch's latest quarterly estimate, Inala-Richlands is projected to gain approximately 6,350 residents by 2041. If current development rates persist, housing supply may not keep pace with population growth, potentially increasing competition among buyers and supporting stronger price growth.
Frequently Asked Questions - Development
Infrastructure
Inala - Richlands has strong levels of nearby infrastructure activity, ranking in the top 30% nationally
The performance of an area can significantly influenced by changes in local infrastructure projects and planning initiatives. AreaSearch has identified a total of 30 such projects that could potentially impact this area. Notable among these are the Proposed Coles Shopping Centre at Progress Road, Inala; the Inala Walking Network Plan; Kane Constructions Social Housing project on Tallow Street, Inala; and the Blunder Road Residential Estate (Stage 2 & 3). The following list provides details of those projects likely to have the most relevance.
Professional plan users can use the search below to filter and access additional projects.
INFRASTRUCTURE SEARCH
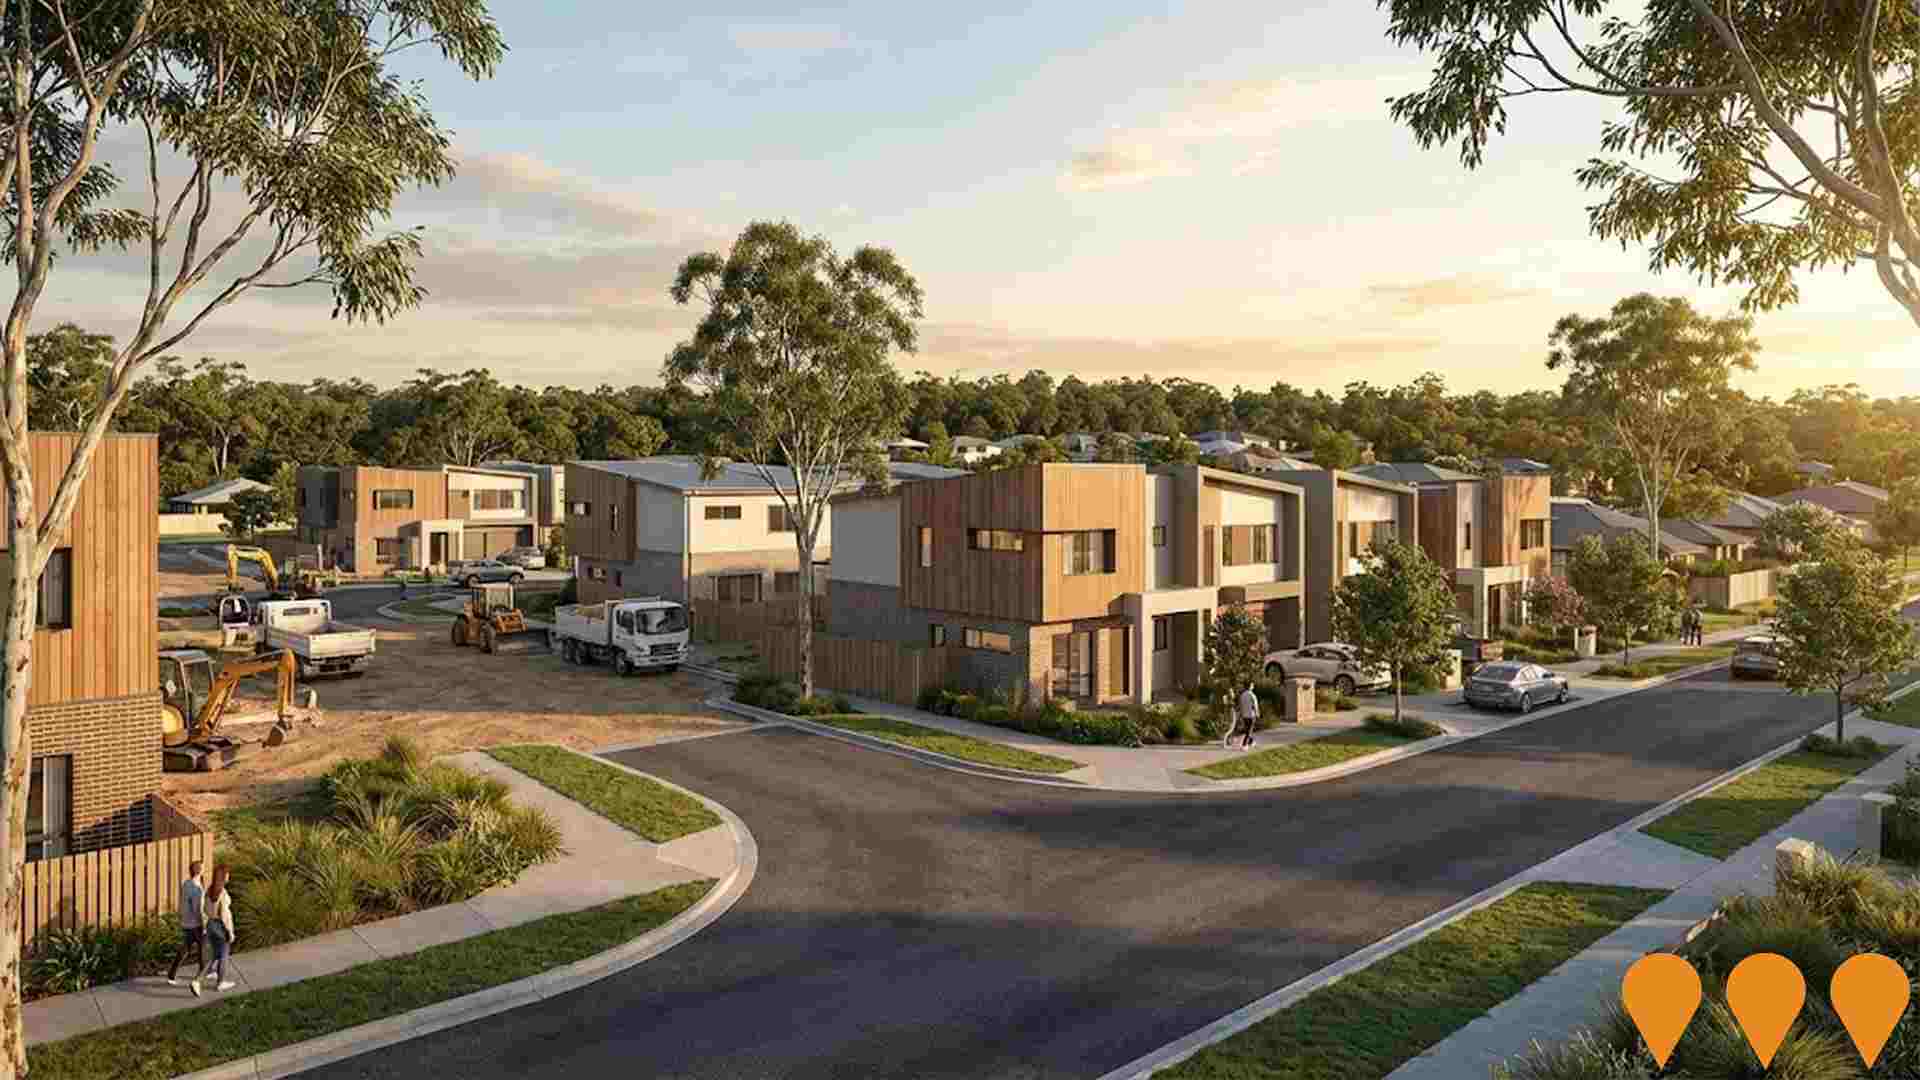
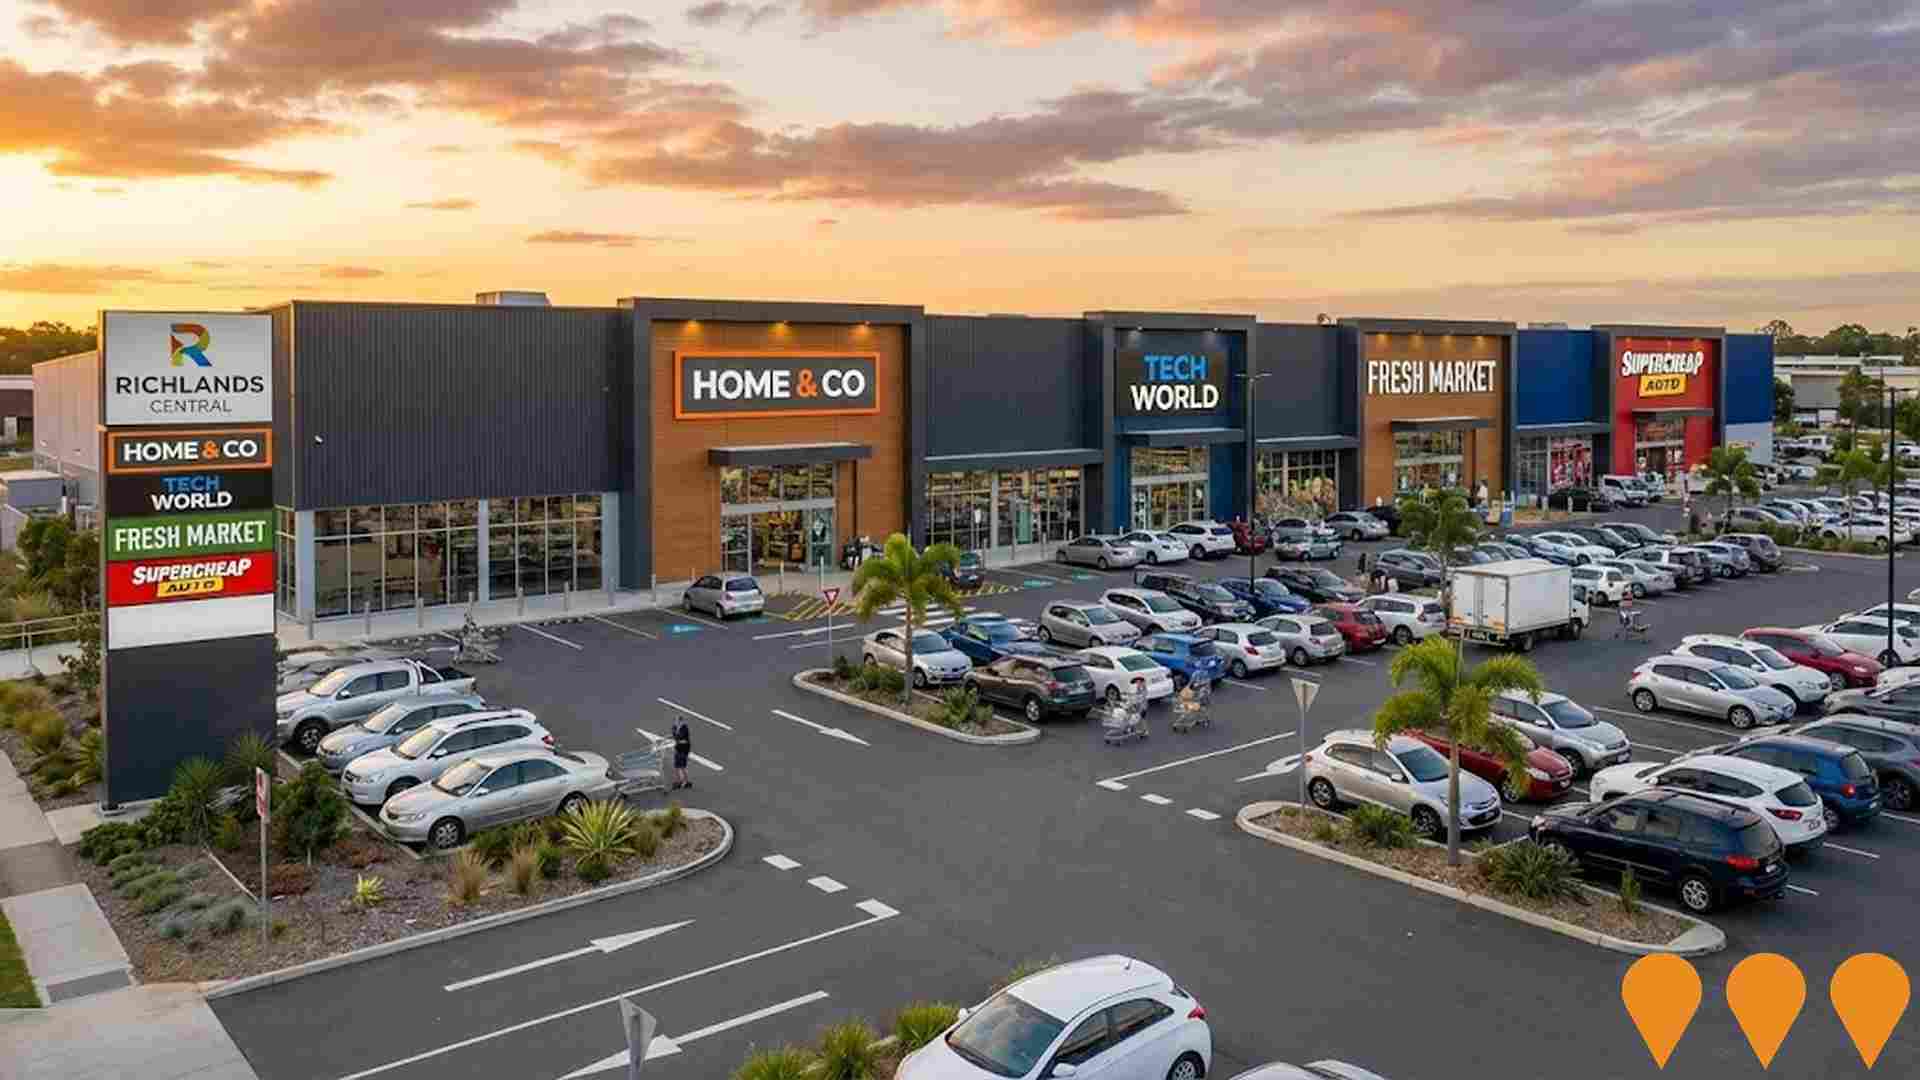
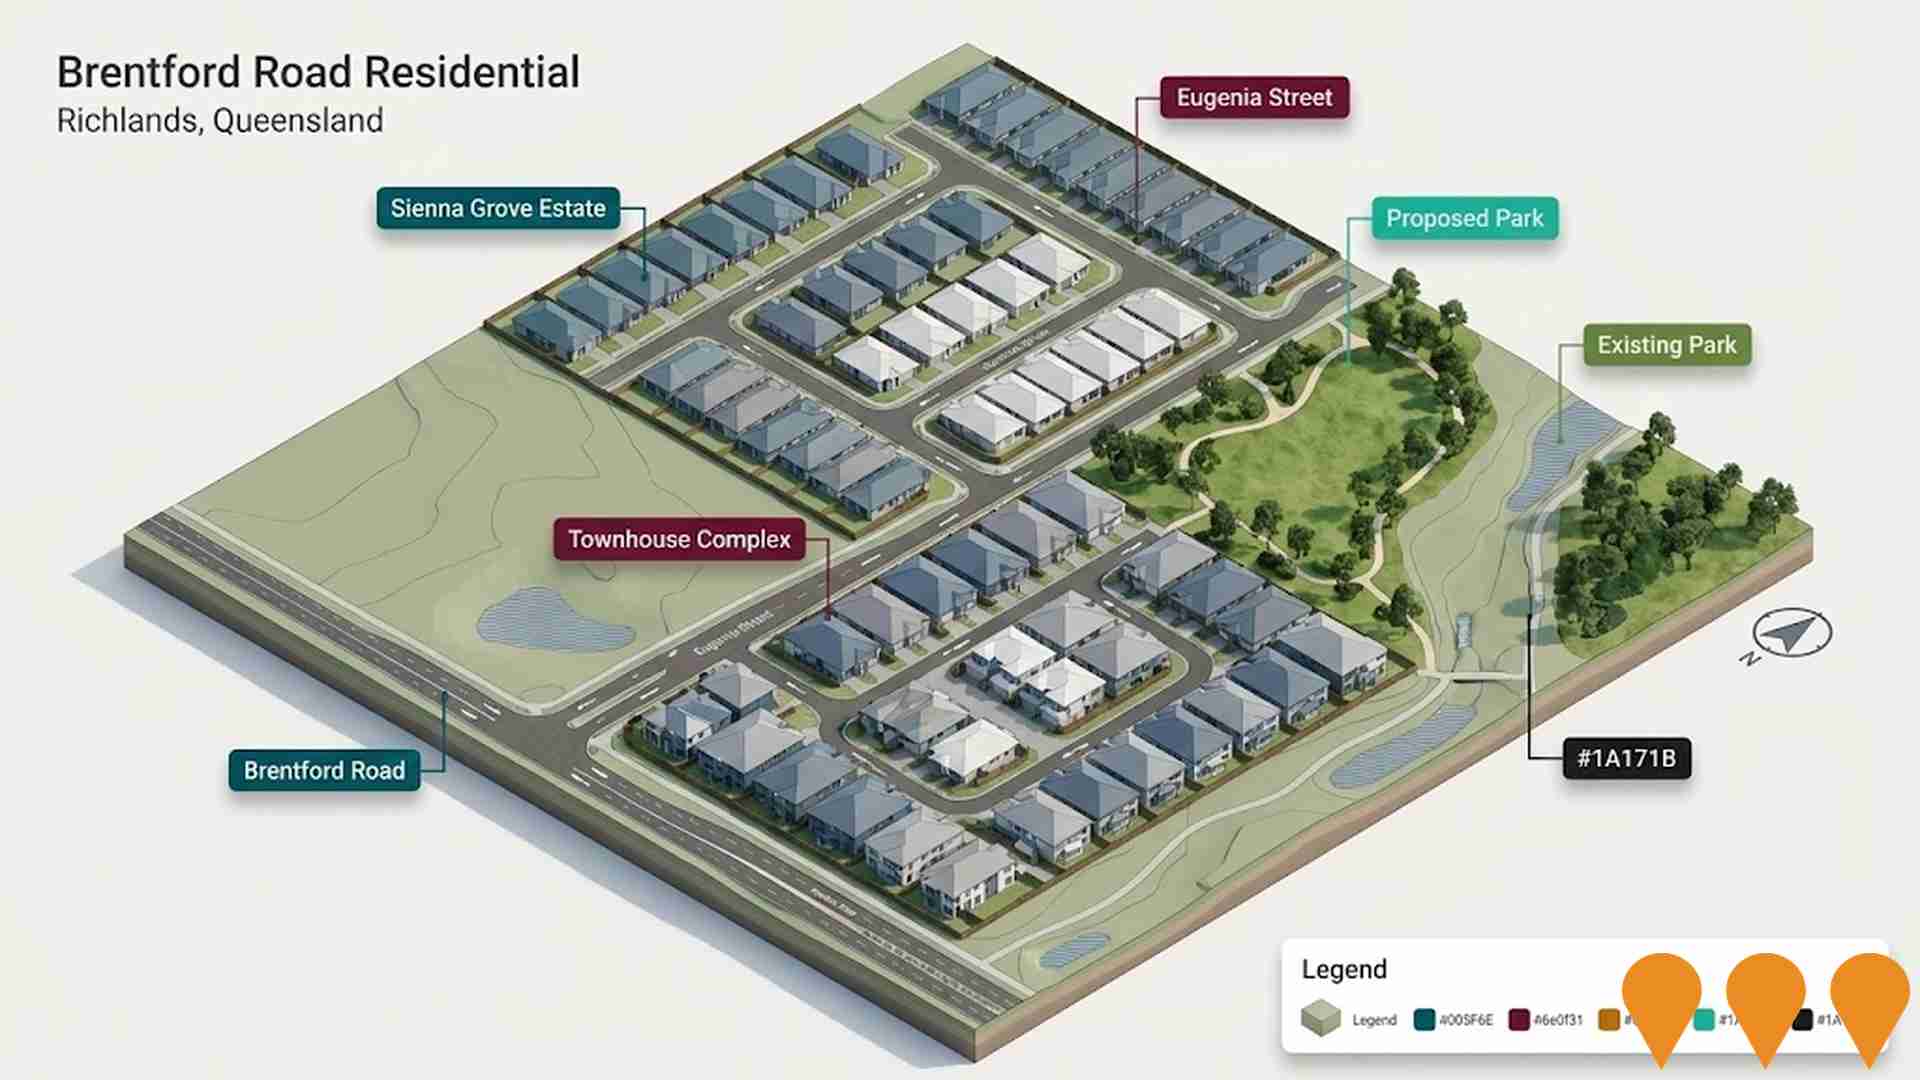
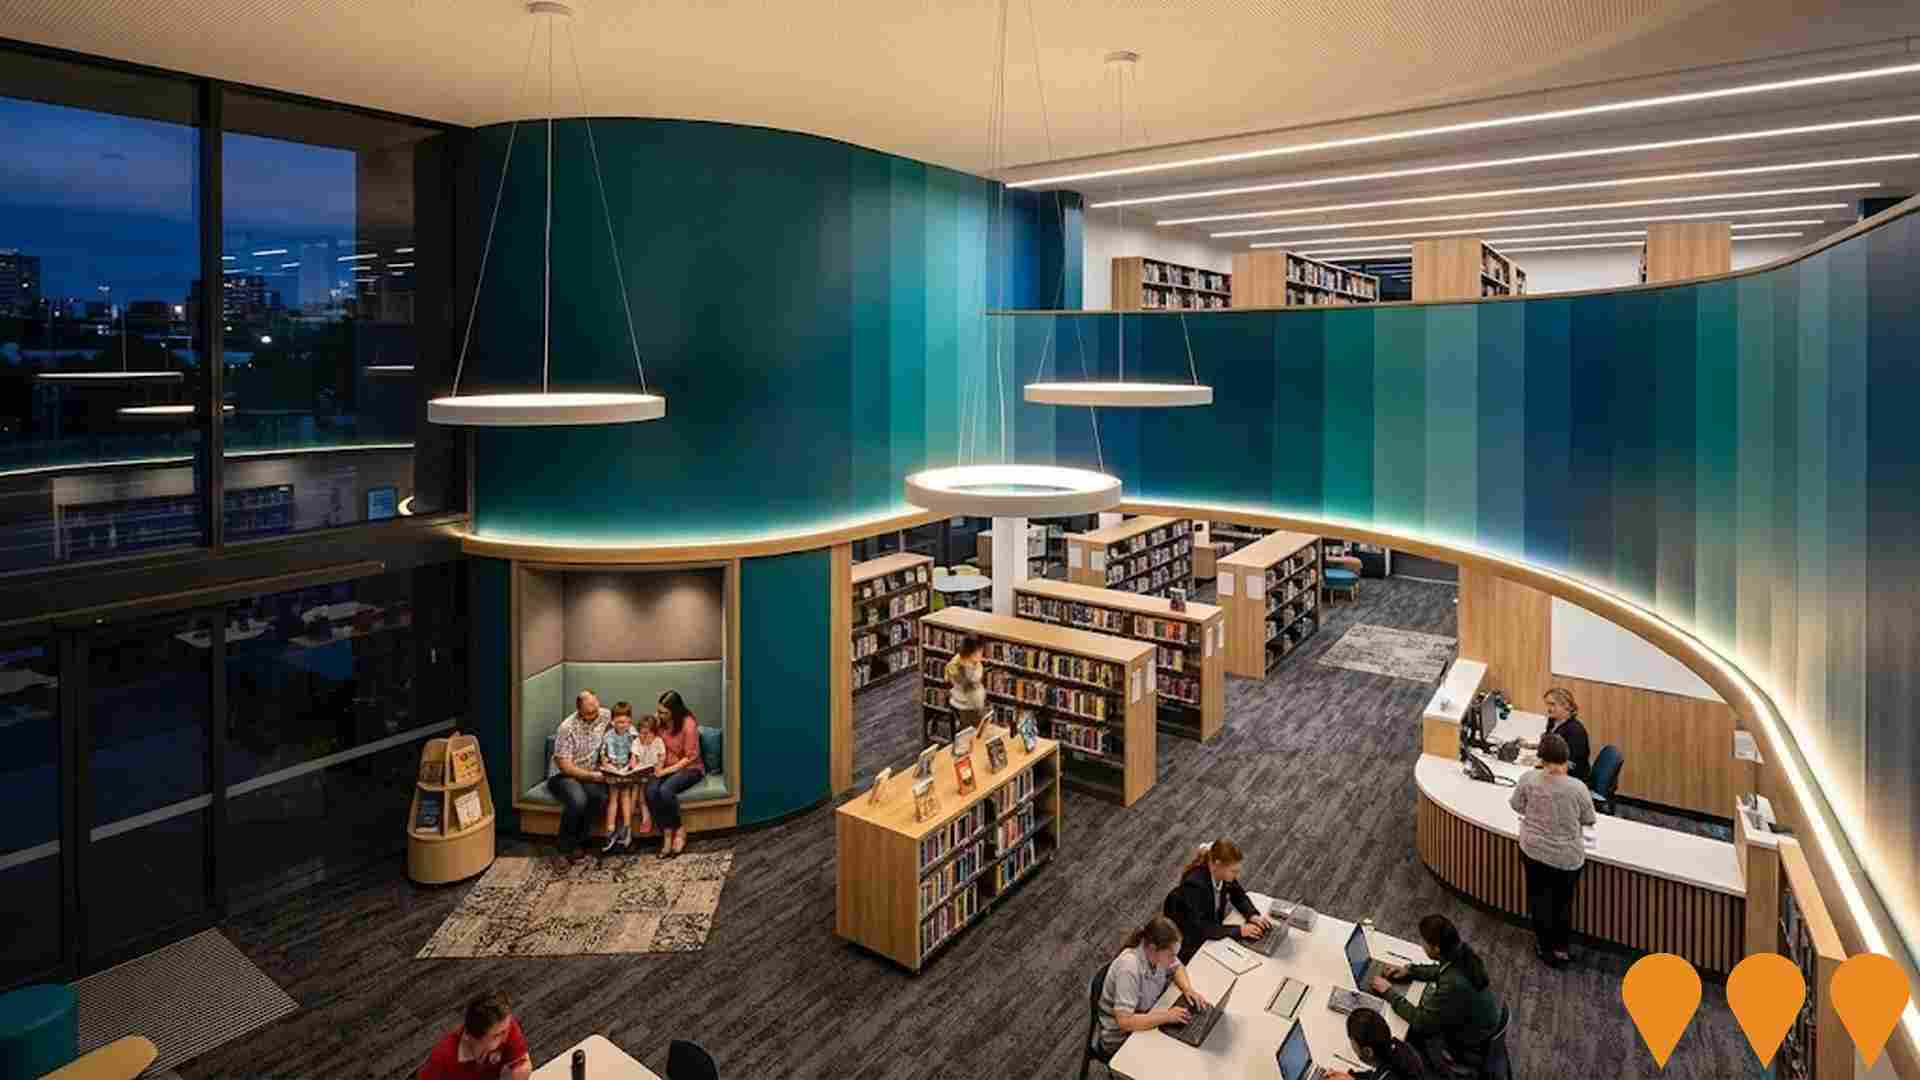
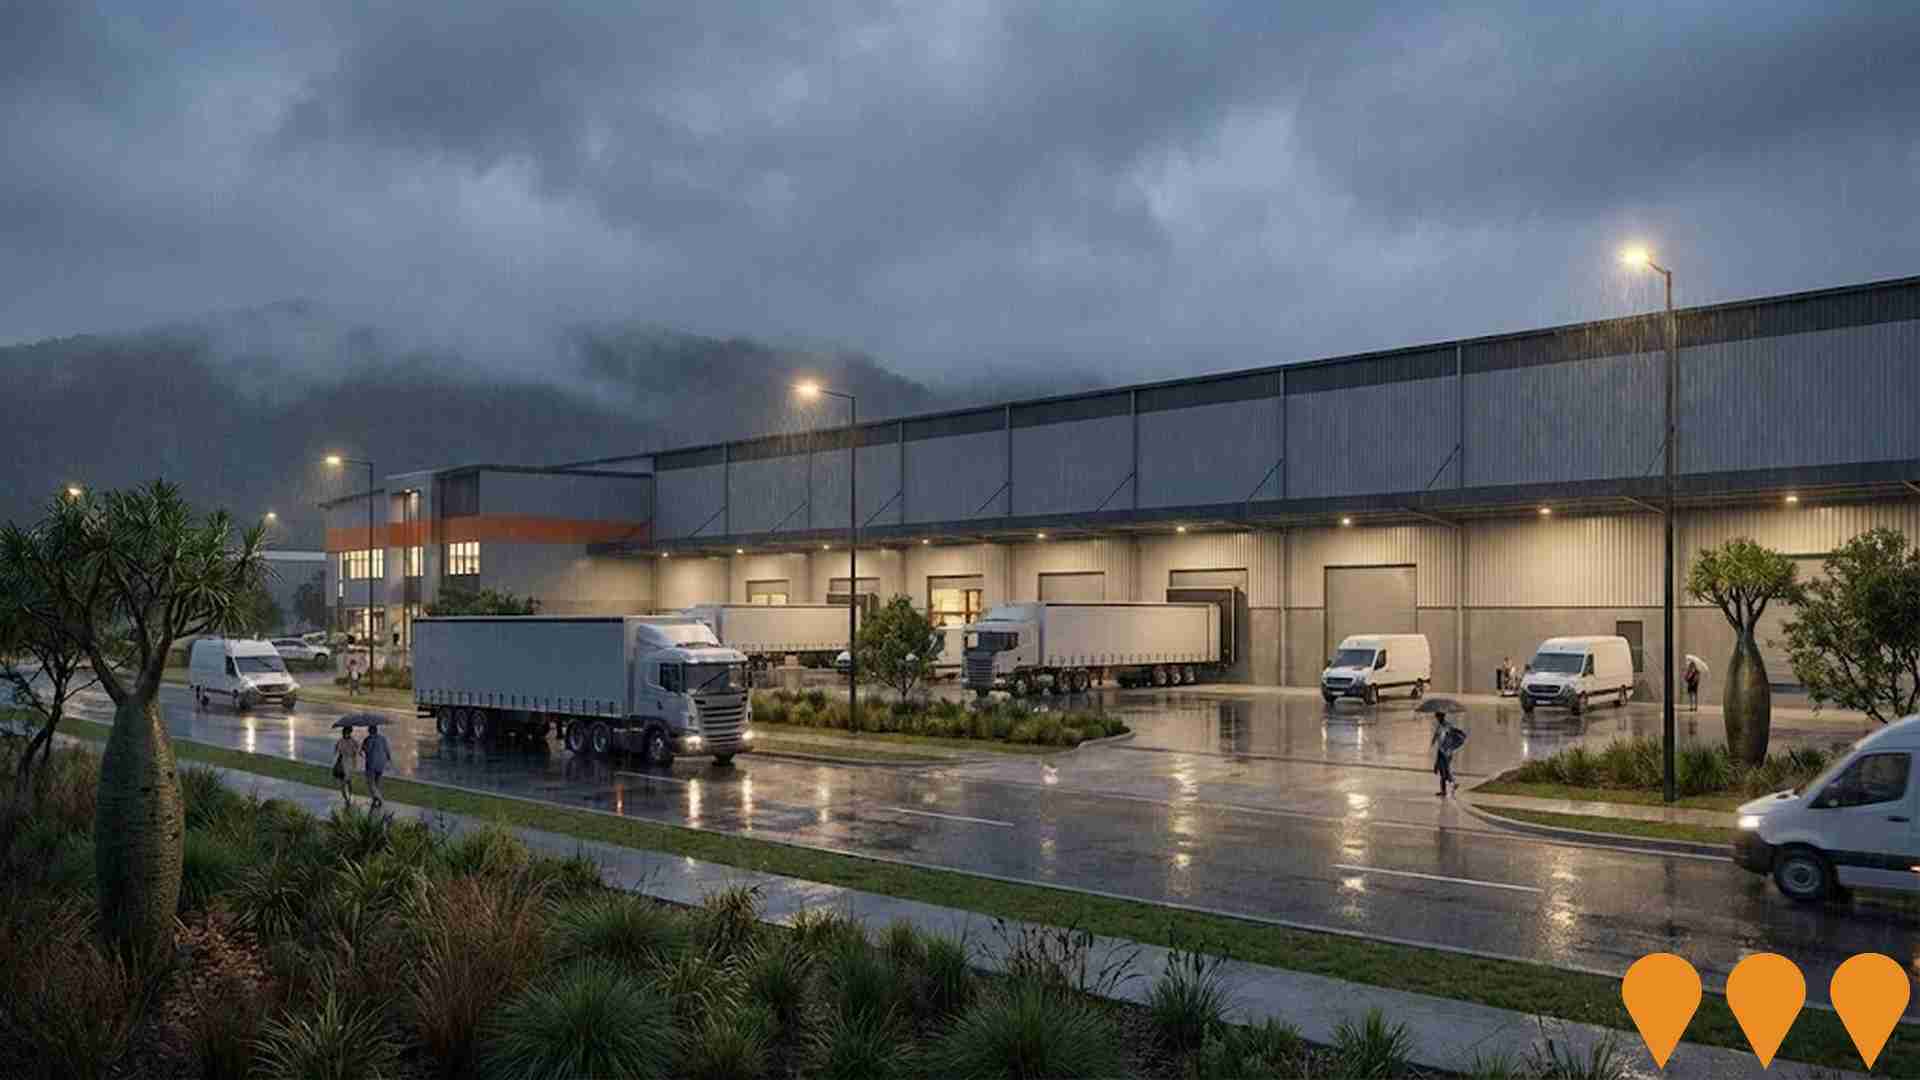
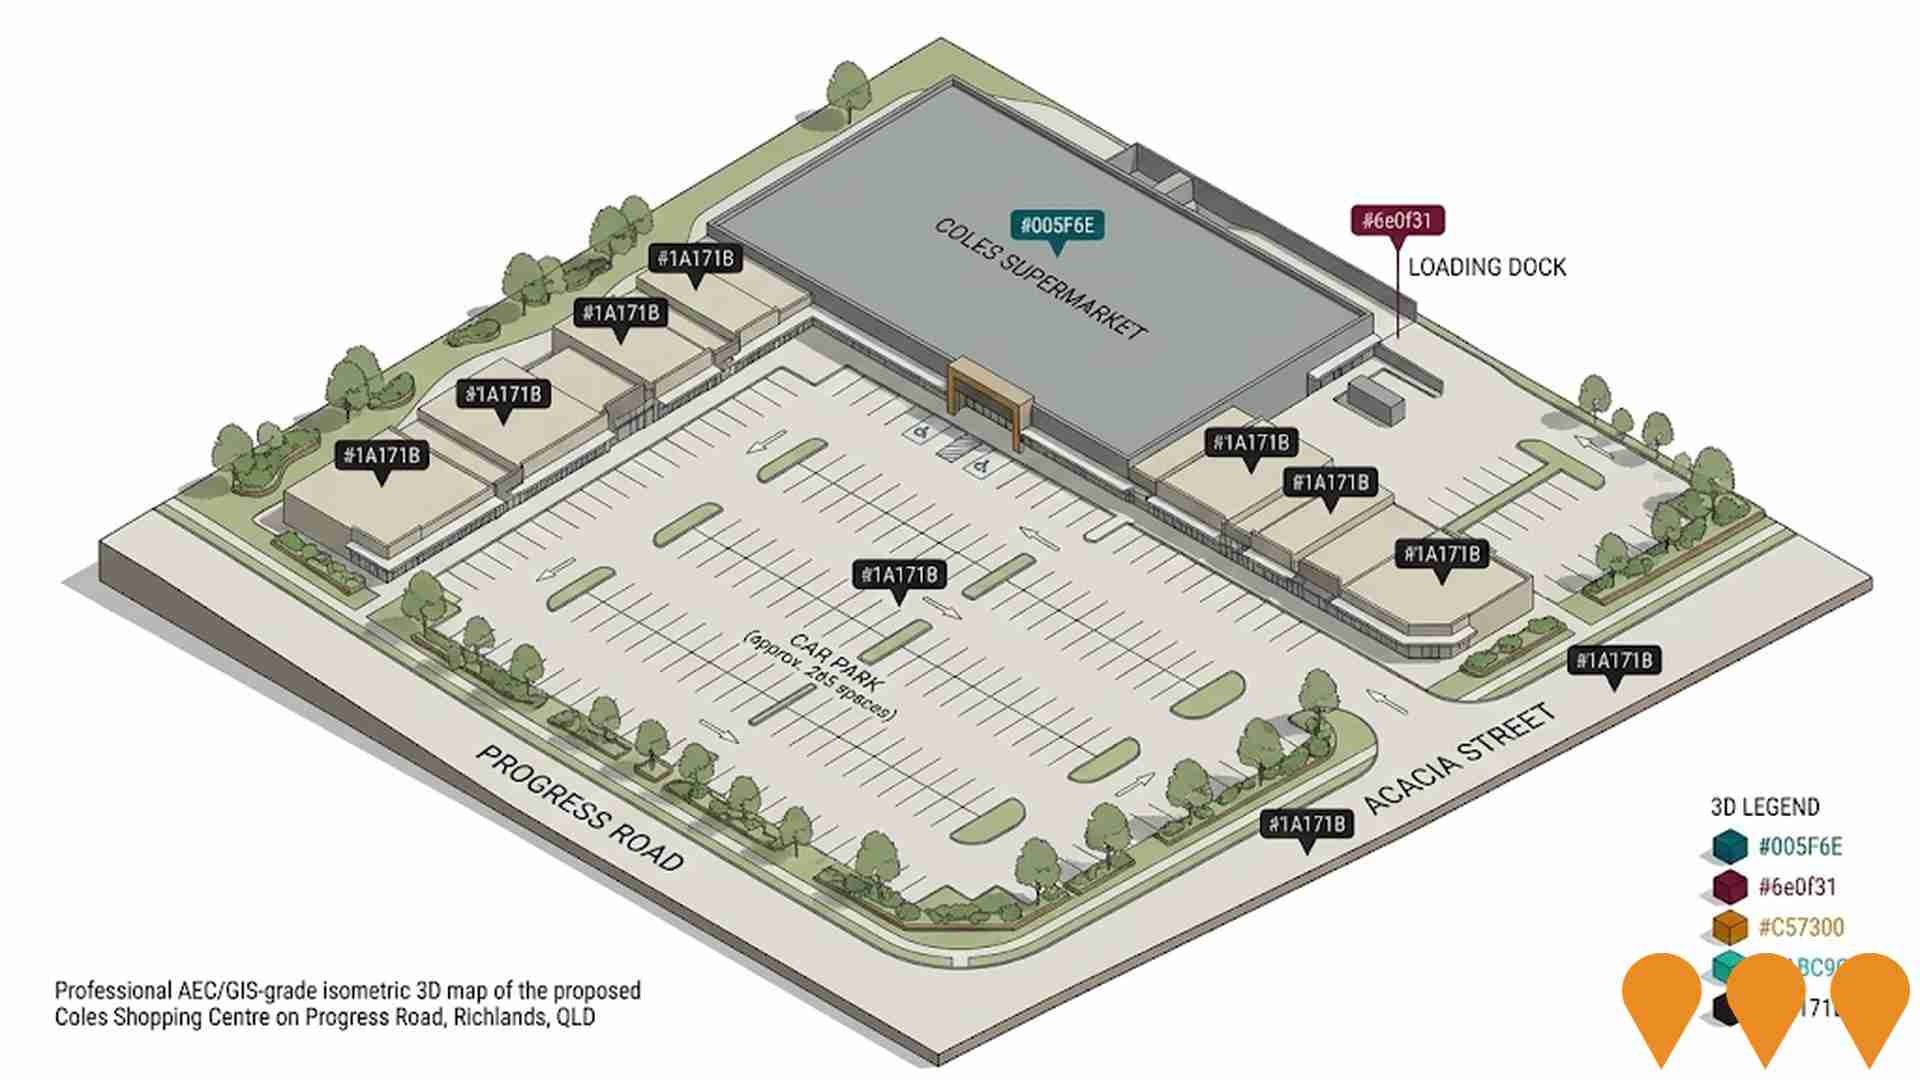
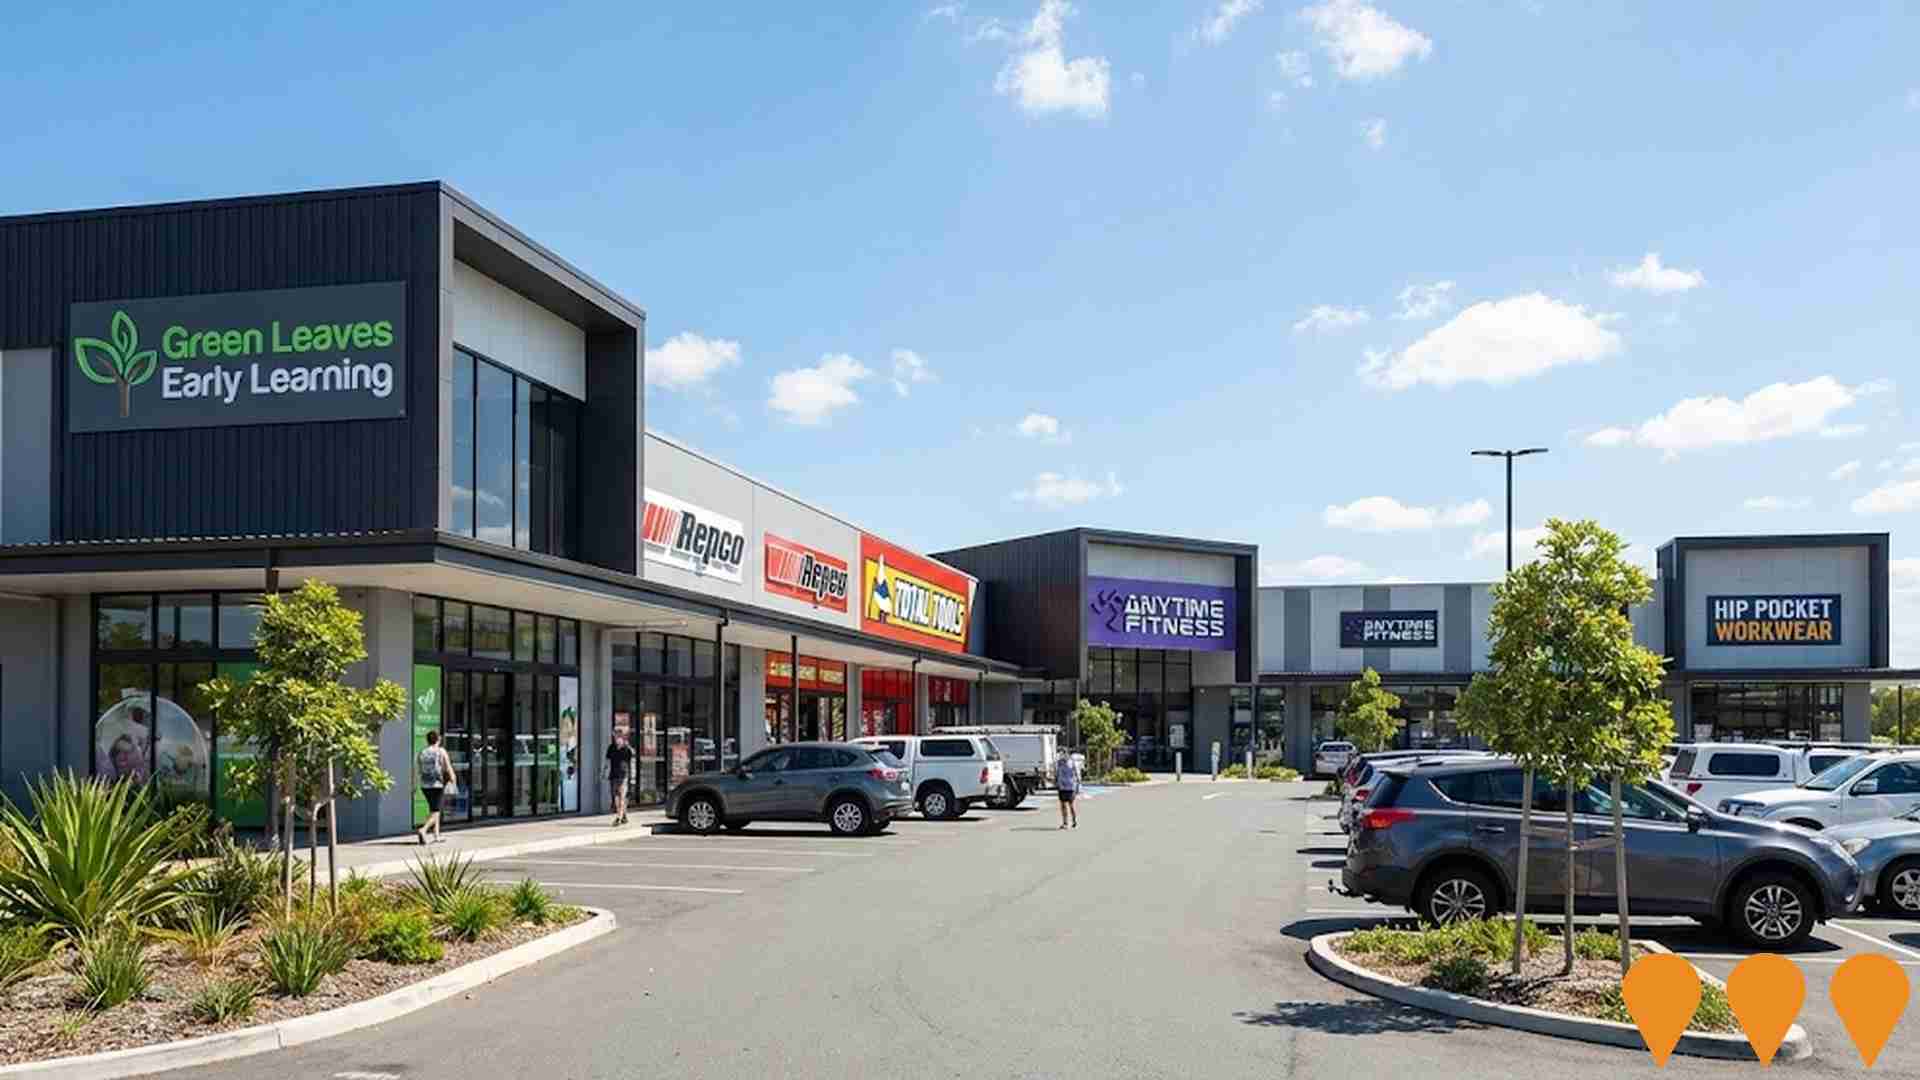
 Denotes AI-based impression for illustrative purposes only, not to be taken as definitive under any circumstances. Please follow links and conduct other investigations from the project's source for actual imagery. Developers and project owners wishing us to use original imagery please Contact Us and we will do so.
Frequently Asked Questions - Infrastructure
Richlands Railway Station
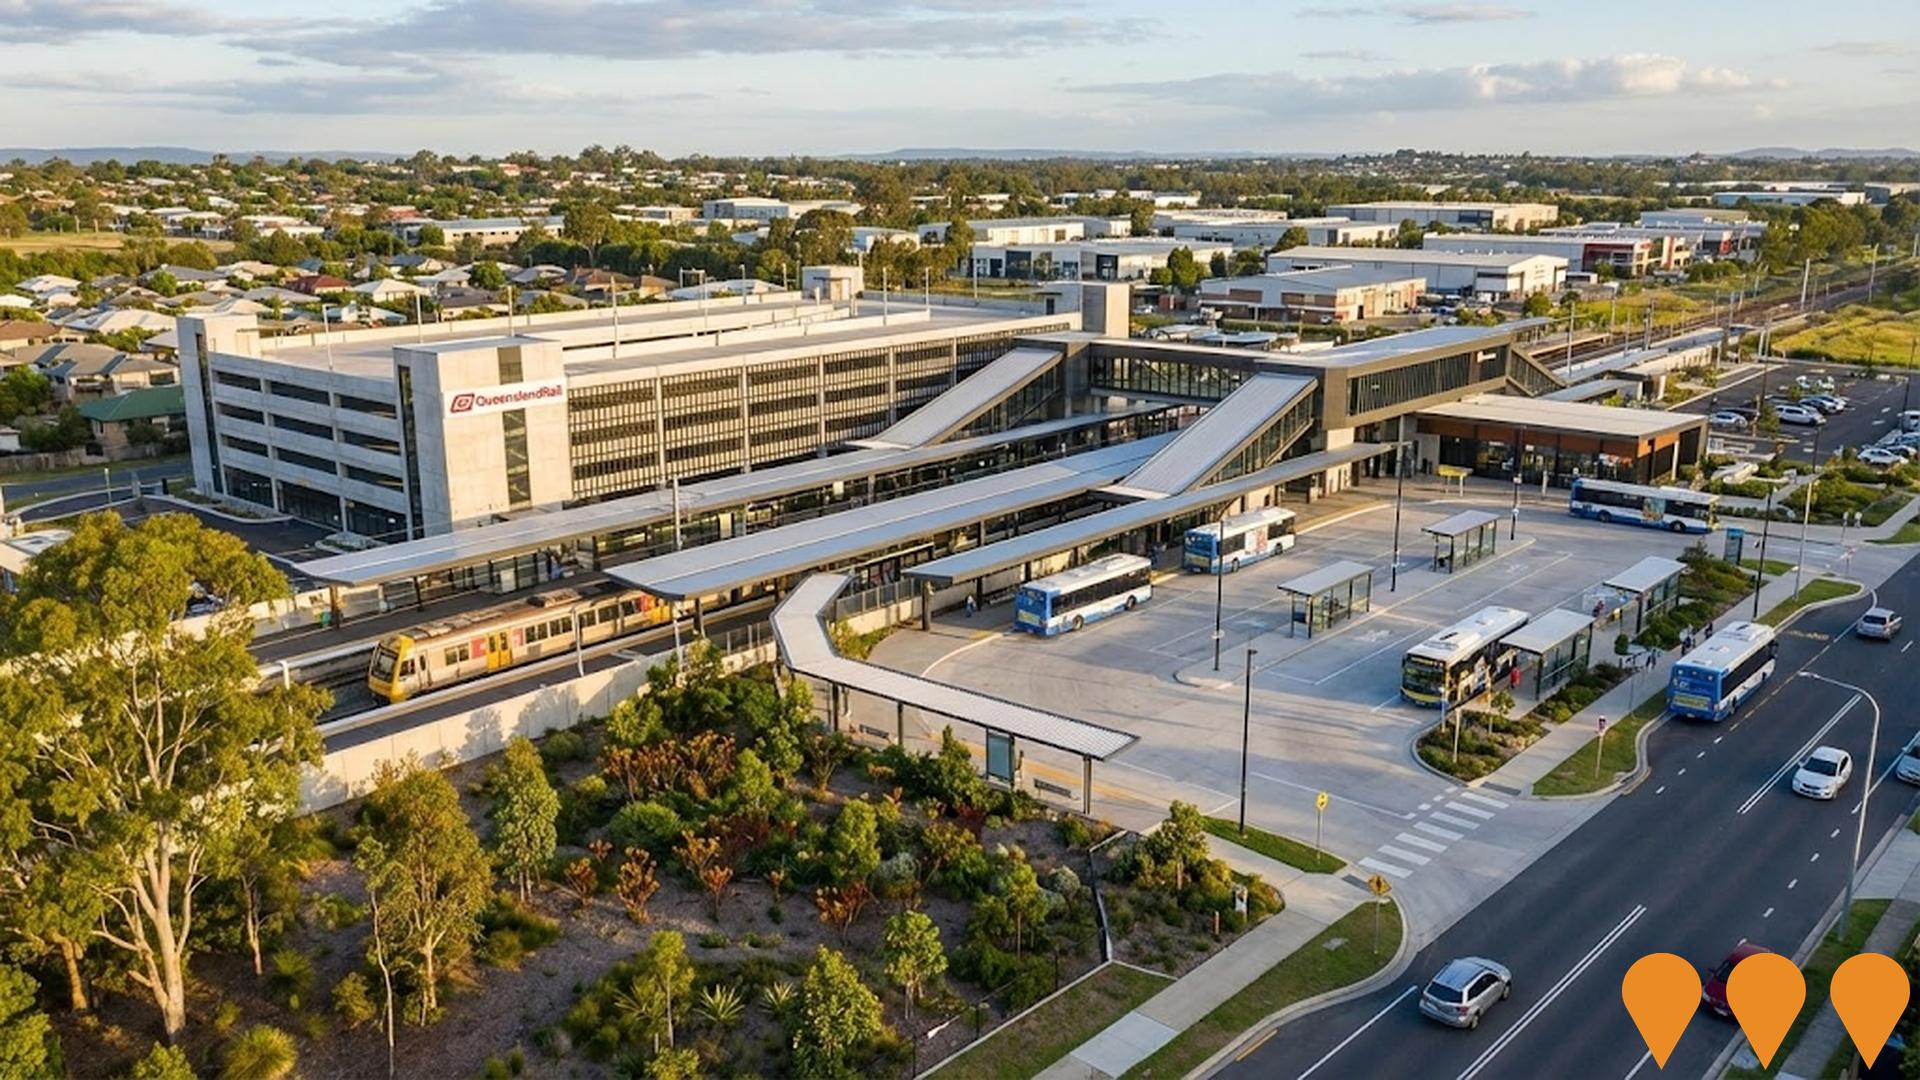
Completed modern railway station serving the Springfield line of Queensland Rail Citytrain network. Features 650 car parking spaces in multi-storey car park, bus interchange with four bus stops, and state-of-the-art facilities serving as major transport hub for southwest Brisbane corridor. Provides important public transport connectivity for the Richlands and surrounding communities including Inala. Opened January 17, 2011 as the terminus station with full line services to Springfield commencing December 2013.
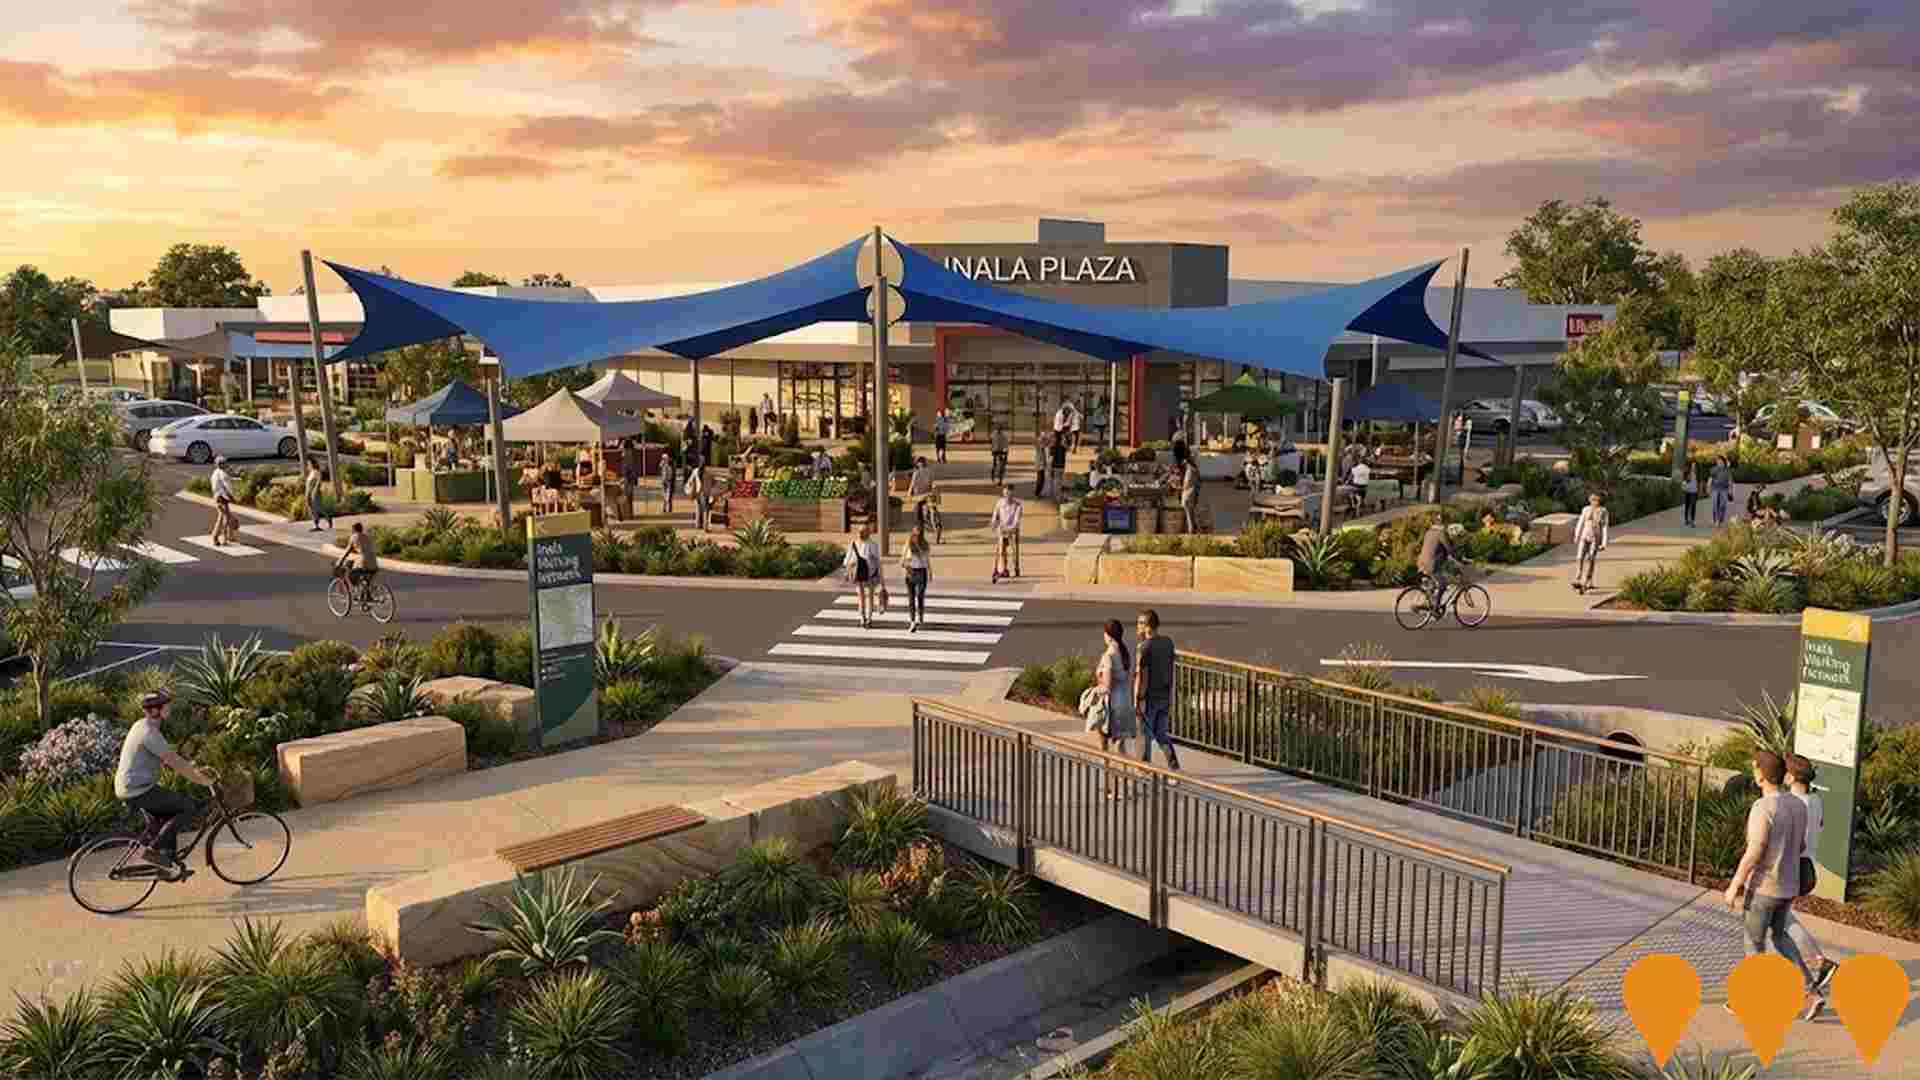
Inala Walking Network Plan
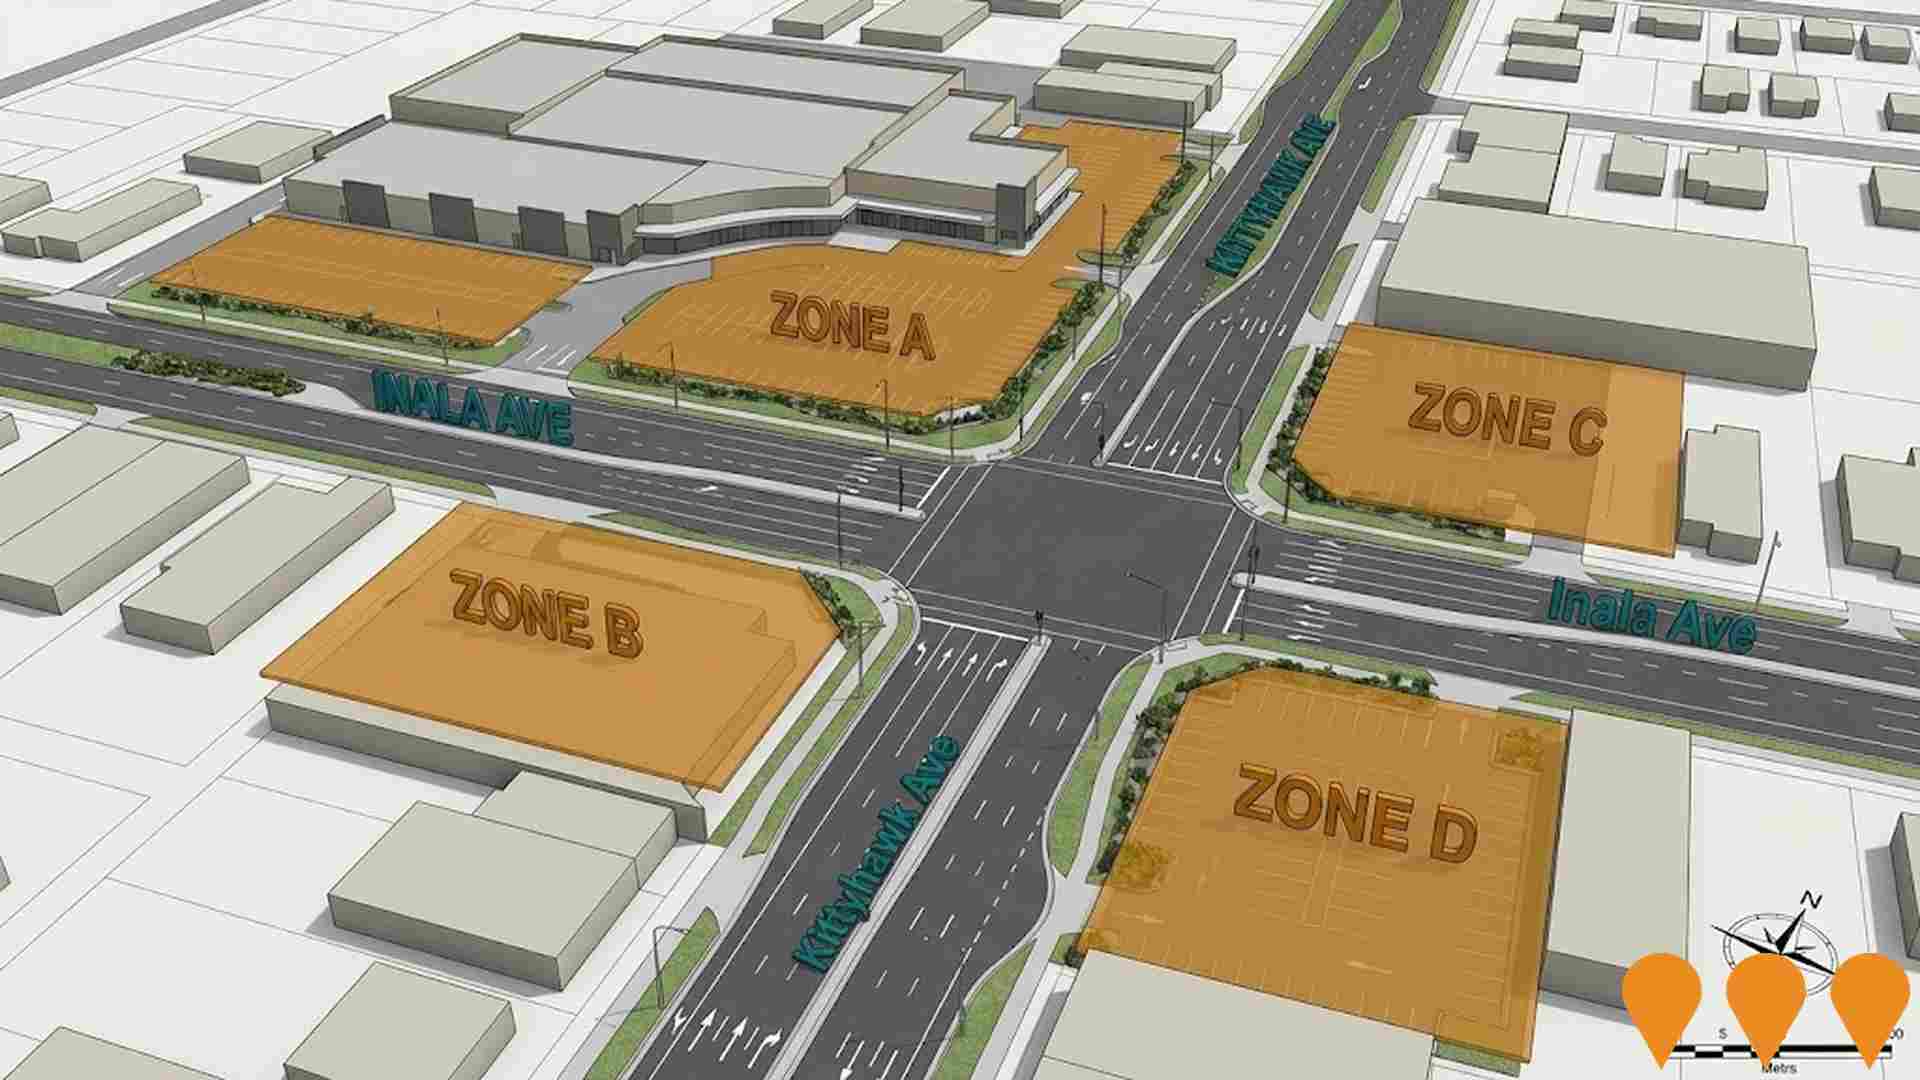
Brisbane City Council is preparing a Walking Network Plan for the Inala precinct focused on the area around Inala Plaza and the bus station. The plan maps primary and secondary walking routes within roughly a 2 km catchment to guide future investment in comfortable, safe and accessible walking links and street upgrades. Community consultation closed in November 2024 and Council is reviewing feedback to finalise the plan.
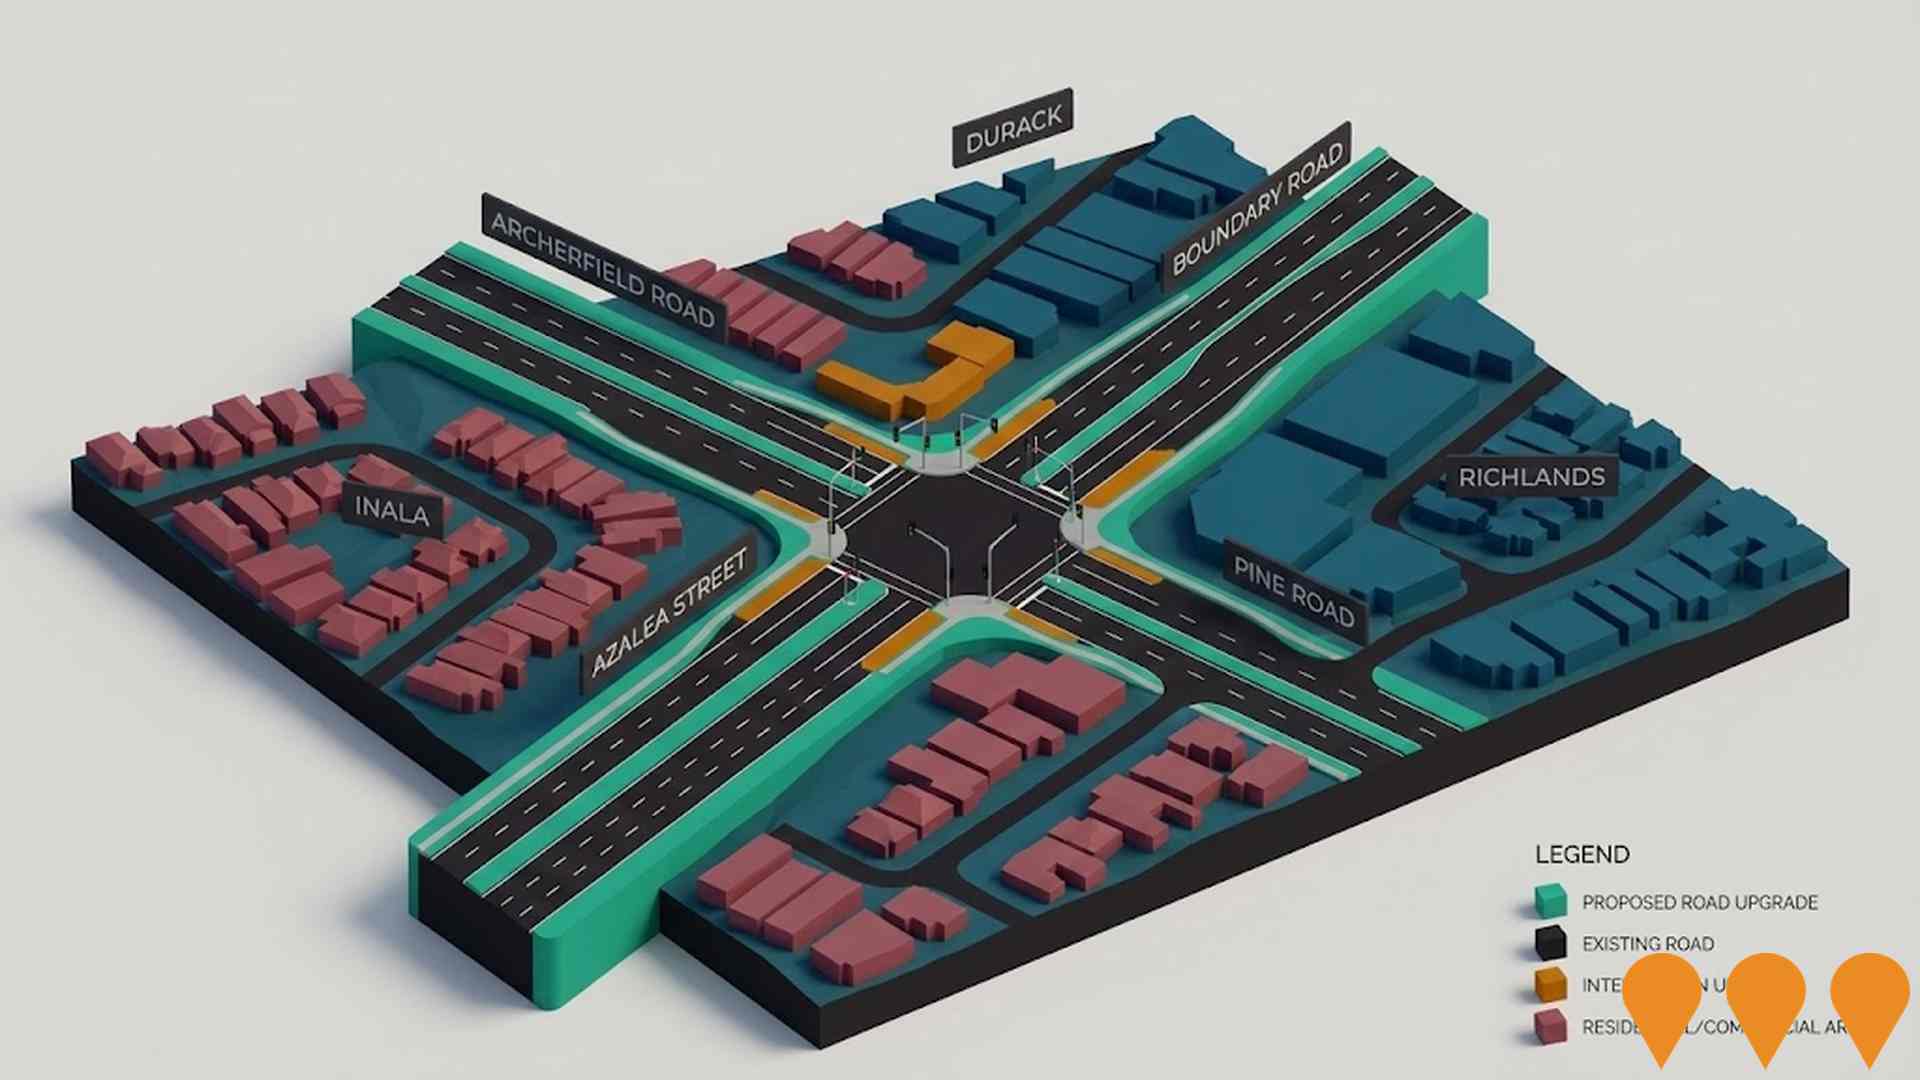
Inala to Richlands Corridor Upgrade (Stage 2) - Archerfield and Boundary Road Upgrades
Brisbane City Council is planning upgrades along the Archerfield Road and Boundary Road corridor between Inala and Richlands, including new traffic lights, turning lanes and signalised pedestrian crossings at the Archerfield Road, Azalea Street and Pine Road intersection. The intersection carries around 22,000 vehicles per day and has been identified as a safety black spot, prompting concept design and community consultation. The corridor forms part of the Boundary Road (Archerfield Road to Acanthus Street) 4 lane road corridor identified in the City Plan transport network schedule of works. Together these works are intended to improve traffic flow, road safety and pedestrian connectivity between Inala, Durack, Richlands and surrounding suburbs.
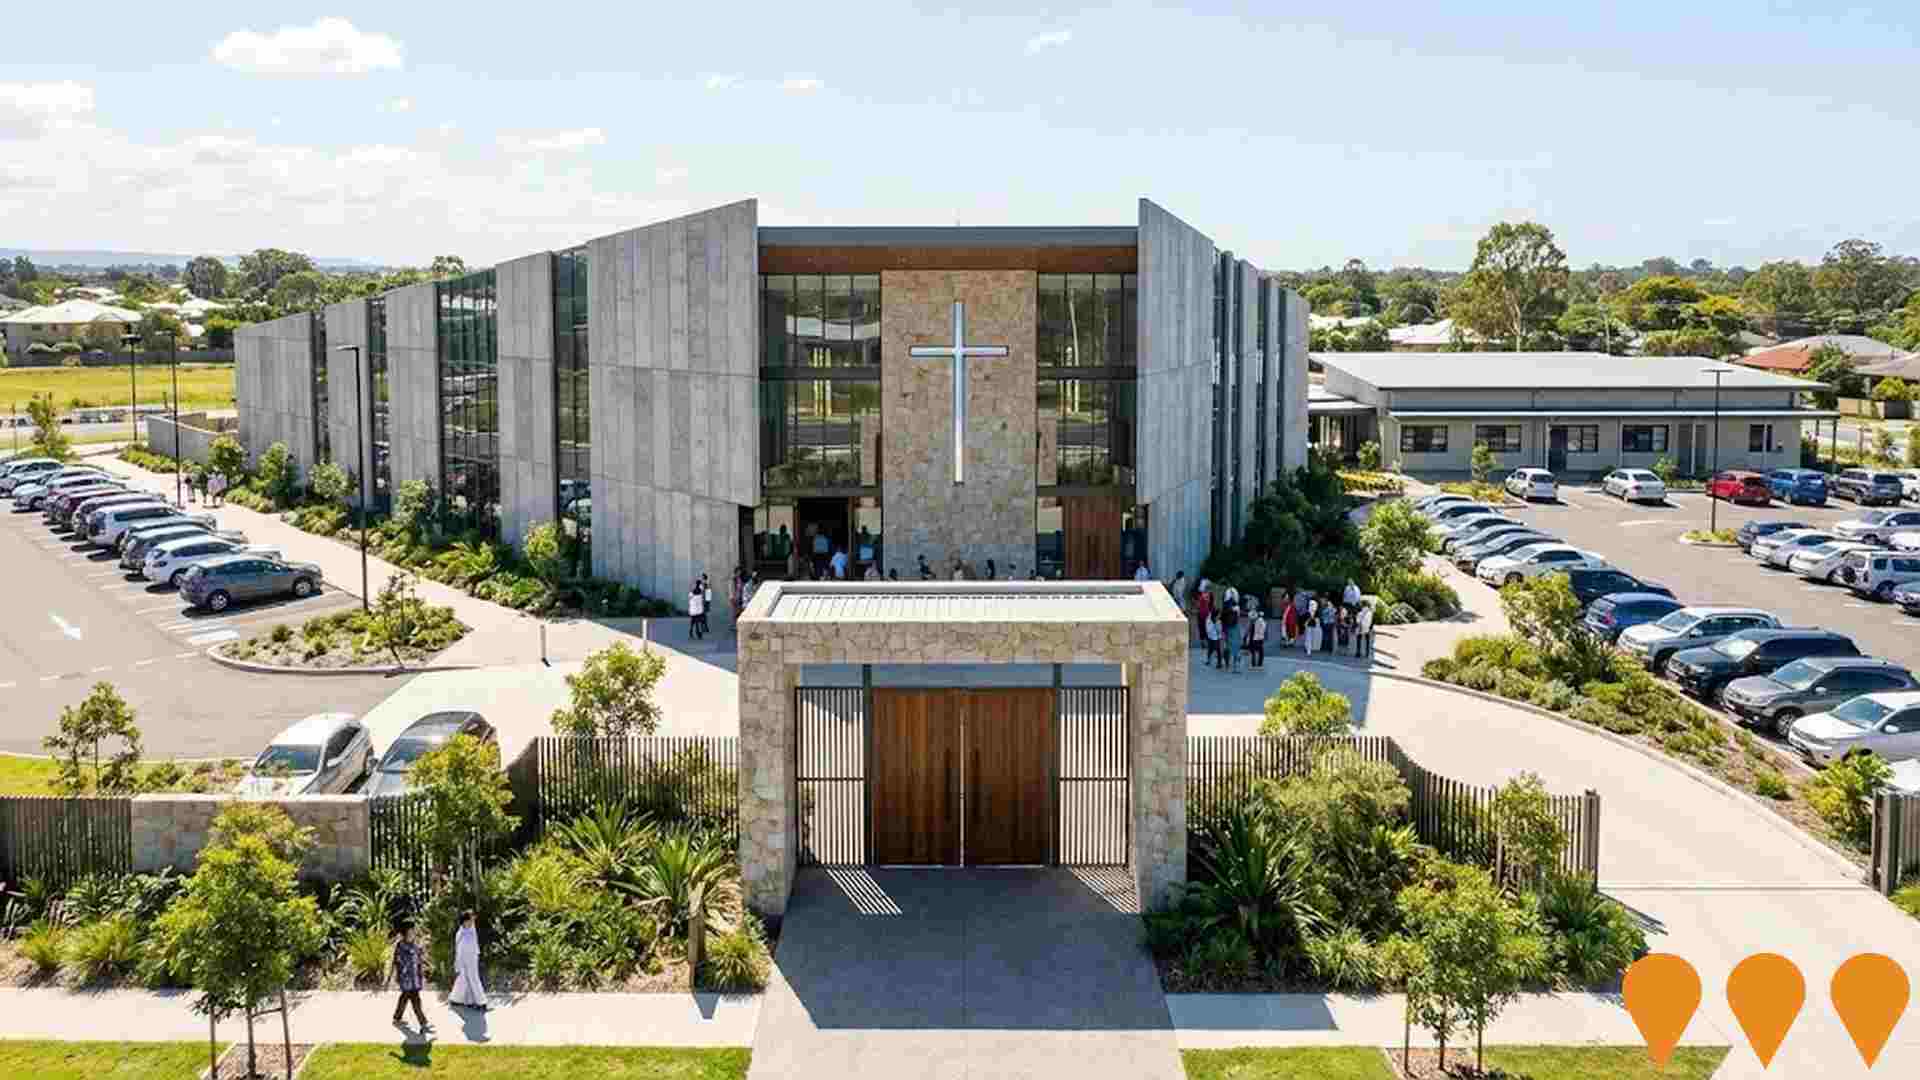
Queen of the Vietnamese Martyrs Catholic Church
A new Catholic worship complex with over 1,000 seating capacity, featuring concrete panels, extensive glazing, natural ventilation, stone-clad altar wall, grand solid timber entry doors, and external amenities including 150 carparks, landscaping, a grand entry gate, and a separate amenities block. The church is designed for natural cooling and includes a community centre with classrooms for Sunday School. It was consecrated in July 2024, fulfilling a 45-year dream for the Vietnamese Catholic Community in Brisbane.
Archerfield Wetlands Parkland
$11 million Stage 1 development of Archerfield Wetlands Parkland featuring outdoor theatre, water park, recreation areas, kids play space, boardwalks and environmental facilities over 8.65 hectares. Part of Oxley Creek Transformation Master Plan.

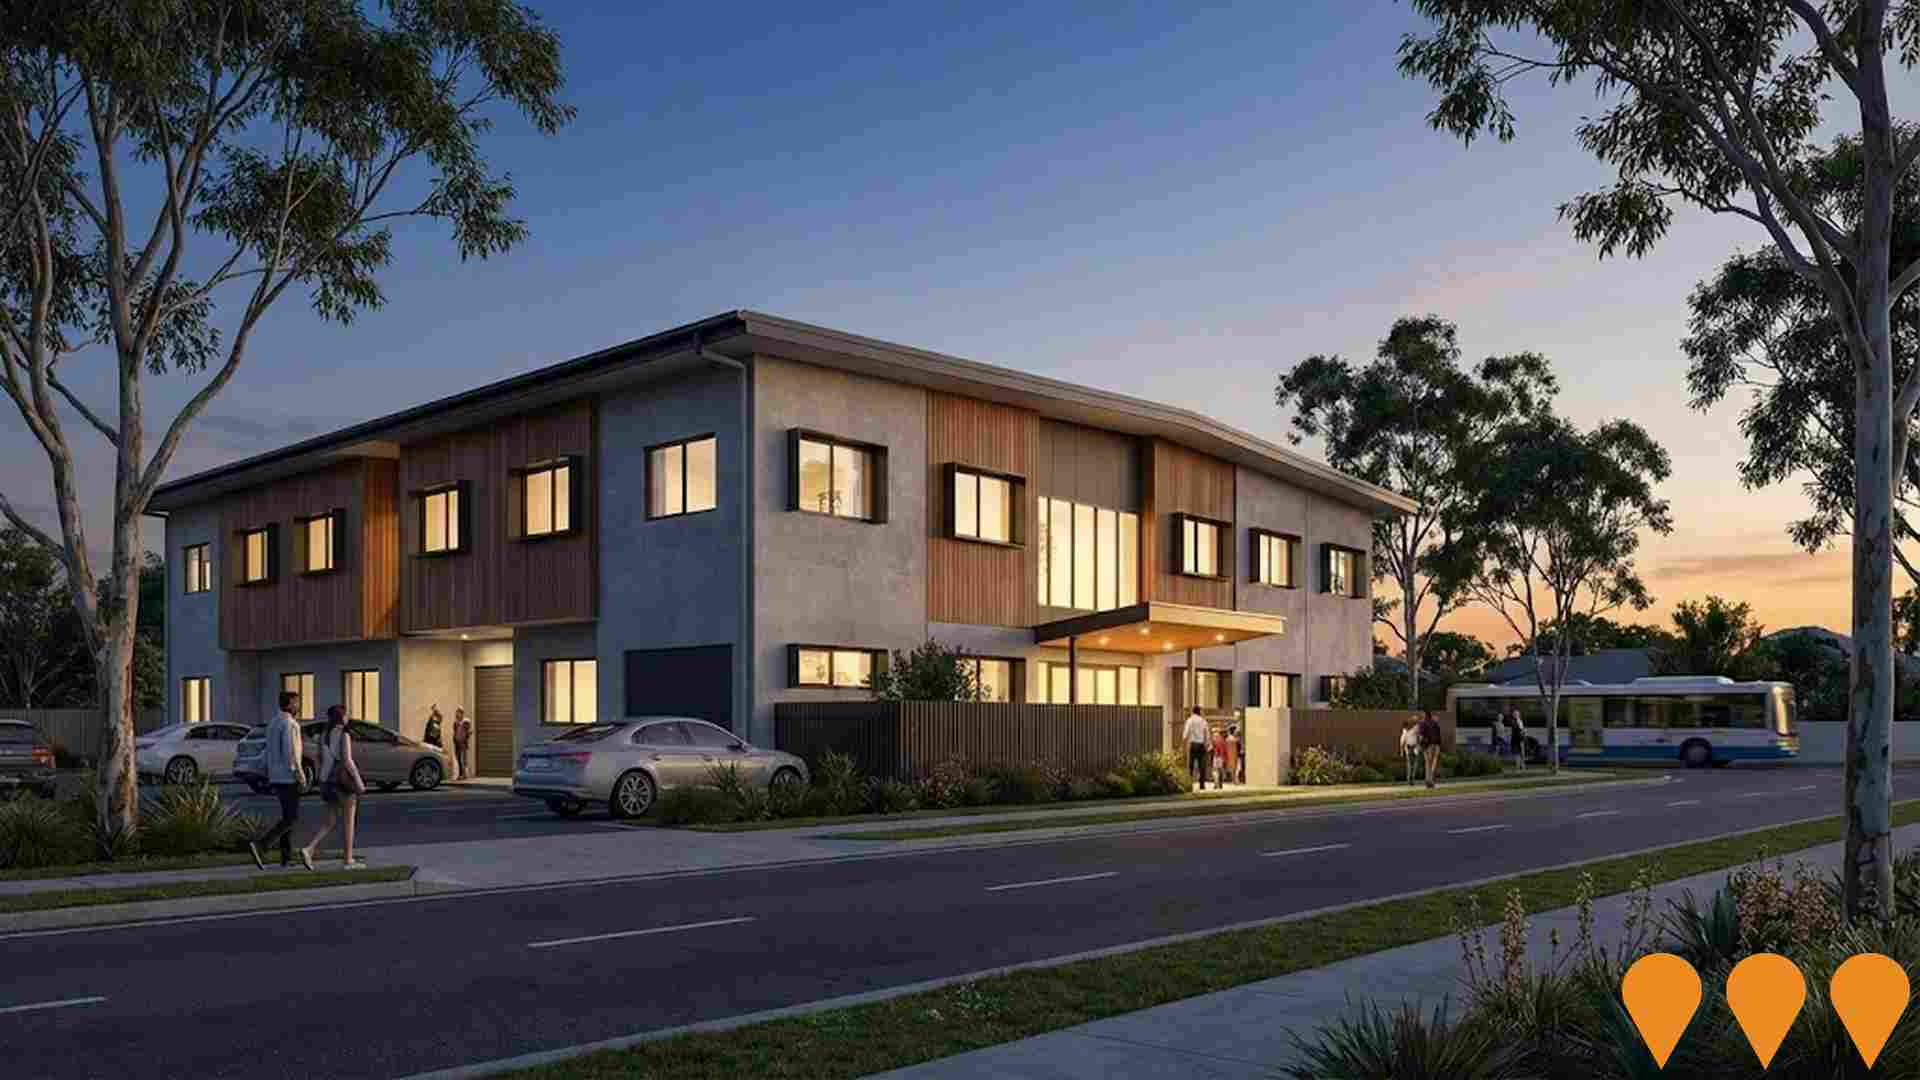
Kane Constructions Social Housing - Tallow Street, Inala
A 14-unit social housing development featuring one three-bedroom unit and thirteen one-bedroom units (comprising two Platinum units, nine Gold units, and two general units). Two-level building constructed with innovative hybrid concrete and cross-laminated timber construction, featuring on-grade parking and passenger lifts. Aimed at older Queenslanders and social housing tenants looking to downsize. Part of Queensland's Homes for Queenslanders Big Build program. Located close to shops, medical services and public transport.
Proposed Coles Shopping Centre - Progress Road
Proposed single-storey shopping complex featuring Coles supermarket and 18 additional retail tenancies on 28,885 sqm site, with 265 car parking spaces.
Richlands Central
Multi-precinct retail and community hub delivered by Engage Group. The project comprises a 120-place Green Leaves Early Learning centre, a 700sqm Repco tenancy, a Total Tools large-format retail store, and a completed 1,200sqm showroom anchored by Anytime Fitness and Hip Pocket Workwear. All precincts are leased and the estate is sold out.
Employment
Employment drivers in Inala - Richlands are experiencing difficulties, placing it among the bottom 20% of areas assessed across Australia
Inala-Richlands has a skilled workforce with manufacturing and industrial sectors prominently represented. The unemployment rate was 10.1% as of September 2025, with an estimated employment growth of 5.5% over the past year.
There are 8,234 residents employed, but the unemployment rate is higher than Greater Brisbane's at 6.1%, indicating room for improvement. Workforce participation lags significantly at 50.0%. Leading industries include health care & social assistance, manufacturing, and retail trade, with a notable concentration in manufacturing at 2.2 times the regional average. However, professional & technical employment is lower at 4.5% compared to Greater Brisbane's 8.9%.
Employment opportunities locally may be limited due to the predominantly residential nature of the area. Between September 2024 and September 2025, employment levels increased by 5.5%, while labour force grew by 3.3%, reducing the unemployment rate by 1.9 percentage points. In comparison, Greater Brisbane saw employment growth of 3.8% with a 0.5 percentage point decrease in unemployment. State-wide, Queensland's employment contracted by 0.01% (losing 1,210 jobs) as of 25-Nov, with an unemployment rate of 4.2%, closely aligned with the national rate of 4.3%. National employment forecasts from May-25 suggest a 6.6% increase over five years and 13.7% over ten years. Applying these projections to Inala-Richlands' employment mix, local employment is expected to grow by 5.6% over five years and 12.4% over ten years.
Frequently Asked Questions - Employment
Income
Income metrics place the area in the bottom 10% of locations nationally according to AreaSearch analysis
The Inala-Richlands SA2 had a median taxpayer income of $45,228 and an average income of $50,136 in the financial year 2022, according to postcode level ATO data aggregated by AreaSearch. This is lower than the national average, with Greater Brisbane's median income being $55,645 and average income being $70,520. By September 2025, estimated incomes would be approximately $51,555 (median) and $57,150 (average), based on Wage Price Index growth of 13.99% since financial year 2022. Inala-Richlands' incomes were between the 3rd and 11th percentiles nationally in 2021 Census figures, with the $800-$1499 bracket dominant at 29.7%, contrasting regional levels where the $1500-$2999 bracket led at 33.3%. Housing affordability pressures were severe, with only 78.5% of income remaining, ranking at the 8th percentile nationally.
Frequently Asked Questions - Income
Housing
Inala - Richlands is characterized by a predominantly suburban housing profile, with a higher proportion of rental properties than the broader region
Inala-Richlands' dwellings, as per the latest Census, consisted of 74.7% houses and 25.3% other dwellings (semi-detached, apartments, 'other'). Brisbane metro had 80.2% houses and 19.8% other dwellings. Home ownership in Inala-Richlands was 17.3%, with mortgaged dwellings at 21.9% and rented ones at 60.8%. The median monthly mortgage repayment was $1,376, below Brisbane metro's average of $1,630. Median weekly rent in Inala-Richlands was $300, compared to Brisbane metro's $355. Nationally, Inala-Richlands' mortgage repayments were significantly lower than the Australian average of $1,863, and rents substantially below the national figure of $375.
Frequently Asked Questions - Housing
Household Composition
Inala - Richlands features high concentrations of group households, with a higher-than-average median household size
Family households constitute 71.1% of all households, including 29.5% couples with children, 16.5% couples without children, and 22.5% single parent families. Non-family households comprise the remaining 28.9%, with lone person households at 24.1% and group households comprising 4.9%. The median household size is 2.9 people, which is larger than the Greater Brisbane average of 2.8.
Frequently Asked Questions - Households
Local Schools & Education
Inala - Richlands faces educational challenges, with performance metrics placing it in the bottom quartile of areas assessed nationally
The area's university qualification rate is 16.2%, significantly lower than Greater Brisbane's average of 30.5%. Bachelor degrees are the most common at 11.6%, followed by postgraduate qualifications (3.5%) and graduate diplomas (1.1%). Vocational credentials are prevalent, with 29.8% of residents aged 15+ holding them, including advanced diplomas (9.0%) and certificates (20.8%). Educational participation is high, with 35.3% of residents currently enrolled in formal education.
This includes 12.1% in primary education, 9.4% in secondary education, and 5.5% pursuing tertiary education.
Frequently Asked Questions - Education
Schools Detail
Nearby Services & Amenities
Transport
Transport servicing is moderate compared to other areas nationally based on assessment of service frequency, route connectivity and accessibility
Inala-Richlands has 110 active public transport stops offering a mix of train and bus services. These stops are served by 34 individual routes, collectively facilitating 2,665 weekly passenger trips. Residents enjoy excellent transport accessibility, with an average distance of 187 meters to the nearest stop.
Service frequency stands at 380 trips per day across all routes, translating to about 24 weekly trips per stop.
Frequently Asked Questions - Transport
Transport Stops Detail
Health
Inala - Richlands's residents are healthier than average in comparison to broader Australia with prevalence of common health conditions quite low among the general population though higher than the nation's average across older, at risk cohorts
Inala-Richlands residents show relatively positive health outcomes, with low prevalence rates for common conditions compared to the general population but higher than national averages among older, at-risk groups. Private health cover is extremely low, at approximately 46% of the total population (~10,070 people), compared to 49.5% in Greater Brisbane and a national average of 55.3%. Asthma and mental health issues are the most common medical conditions, affecting 7.7% and 7.3% of residents respectively, while 73.2% report being completely free from medical ailments, compared to 72.1% in Greater Brisbane.
The area has 12.6% of residents aged 65 and over (2,746 people), lower than the 13.6% in Greater Brisbane. Health outcomes among seniors require more attention than those for the broader population.
Frequently Asked Questions - Health
Cultural Diversity
Inala - Richlands is among the most culturally diverse areas in the country based on AreaSearch assessment of a range of language and cultural background related metrics
Inala-Richlands has a population where 49.5% were born overseas and 56.4% speak a language other than English at home. Christianity is the primary religion in Inala-Richlands, with 44.1%. Buddhism is more prevalent here at 12.9%, compared to Greater Brisbane's 8.7%.
The top three ancestry groups are Other (21.3%), Vietnamese (20.5%), and English (15.0%). Notably, Samoan (3.6%) and Australian Aboriginal (4.5%) populations are higher than regional averages of 2.7% and 2.4%, respectively.
Frequently Asked Questions - Diversity
Age
Inala - Richlands hosts a very young demographic, ranking in the bottom 10% of areas nationwide
Inala-Richlands has a median age of 31 years, which is younger than the Greater Brisbane average of 36 and the Australian median of 38. Compared to Greater Brisbane, Inala-Richlands has a higher proportion of residents aged 5-14 (16.3%) but fewer people aged 35-44 (12.8%). According to post-2021 Census data, the 65-74 age group has increased from 6.5% to 7.6% of the population, while the 25-34 cohort has decreased from 16.4% to 15.6%. By 2041, demographic modeling suggests significant changes in Inala-Richlands' age profile, with the 65-74 age group projected to grow by 998 people (60%), reaching a total of 2,655 from its current figure of 1,656.
