Chart Color Schemes
This analysis uses ABS Statistical Areas Level 2 (SA2) boundaries, which can materially differ from Suburbs and Localities (SAL) even when sharing similar names.
SA2 boundaries are defined by the Australian Bureau of Statistics and are designed to represent communities for statistical reporting (e.g., census and ERP).
Suburbs and Localities (SAL) represent commonly-used suburb/locality names (postal-style areas) and may use different geographic boundaries. For comprehensive analysis, consider reviewing both boundary types if available.
est. as @ -- *
ABS ERP | -- people | --
2021 Census | -- people
Sales Activity
Curious about local property values? Filter the chart to assess the volume and appreciation (including resales) trends and regional comparisons, or scroll to the map below view this information at an individual property level.
Find a Recent Sale
Sales Detail
Population
Cooloola has seen population growth performance typically on par with national averages when looking at short and medium term trends
Cooloola's population was around 7,302 as of November 2025. This figure represents an increase of 734 people since the 2021 Census, which reported a population of 6,568. The growth is inferred from ABS data showing an estimated resident population of 7,084 in June 2024 and an additional 74 validated new addresses since the Census date. This results in a population density ratio of 6.4 persons per square kilometer. Cooloola's population grew by 11.2% between the 2021 Census and November 2025, exceeding both the non-metro area average growth of 8.8% and the national average. Interstate migration contributed approximately 92.1% of overall population gains during this period.
AreaSearch uses ABS/Geoscience Australia projections for each SA2 area, released in 2024 with a base year of 2022. For areas not covered by this data and years post-2032, Queensland State Government's SA2 area projections are adopted, released in 2023 based on 2021 data. However, these state projections do not provide age category splits, so AreaSearch applies proportional growth weightings in line with ABS Greater Capital Region projections for each age cohort, released in 2023 based on 2022 data. Based on projected demographic shifts, the area is expected to increase by 352 persons to reach a population of around 7,654 by 2041, reflecting an overall increase of approximately 1.8% over the 17-year period.
Frequently Asked Questions - Population
Development
AreaSearch assessment of residential development activity positions Cooloola among the top 25% of areas assessed nationwide
Cooloola averaged approximately 53 new dwelling approvals annually over the past five financial years, totalling 267 homes. As of FY-26, 17 approvals have been recorded. On average, each dwelling has accommodated around 2.3 new residents per year between FY-21 and FY-25, indicating robust demand that supports property values. The average construction cost value for new homes was $261,000 during this period, which is below the regional average, suggesting more affordable housing options.
In FY-26, there have been approximately $18.9 million in commercial approvals, reflecting moderate levels of commercial development. Compared to the Rest of Qld, Cooloola shows 12.0% lower construction activity per person while it ranks among the 76th percentile nationally when assessed areas are considered. New building activity comprises predominantly detached dwellings at 95.0%, with medium and high-density housing making up the remaining 5.0%, preserving the area's low density nature and attracting space-seeking buyers.
The location has approximately 158 people per dwelling approval, indicating an expanding market. According to the latest AreaSearch quarterly estimate, Cooloola is projected to grow by around 130 residents through to 2041. At current development rates, new housing supply should comfortably meet demand, providing favourable conditions for buyers and potentially supporting population growth beyond current projections.
Frequently Asked Questions - Development
Infrastructure
Cooloola has strong levels of nearby infrastructure activity, ranking in the top 30% nationally
AreaSearch has identified a single project likely to impact the area: Forest Wind Farm, Bruce Highway (Cooroy to Curra) Section D - Northern Contract, Gympie Water Resilience and Augmentation Project (GWRAP) - Phase 1, and Bruce Highway Targeted Safety Program - Wide Bay Burnett are key projects.
Professional plan users can use the search below to filter and access additional projects.
INFRASTRUCTURE SEARCH
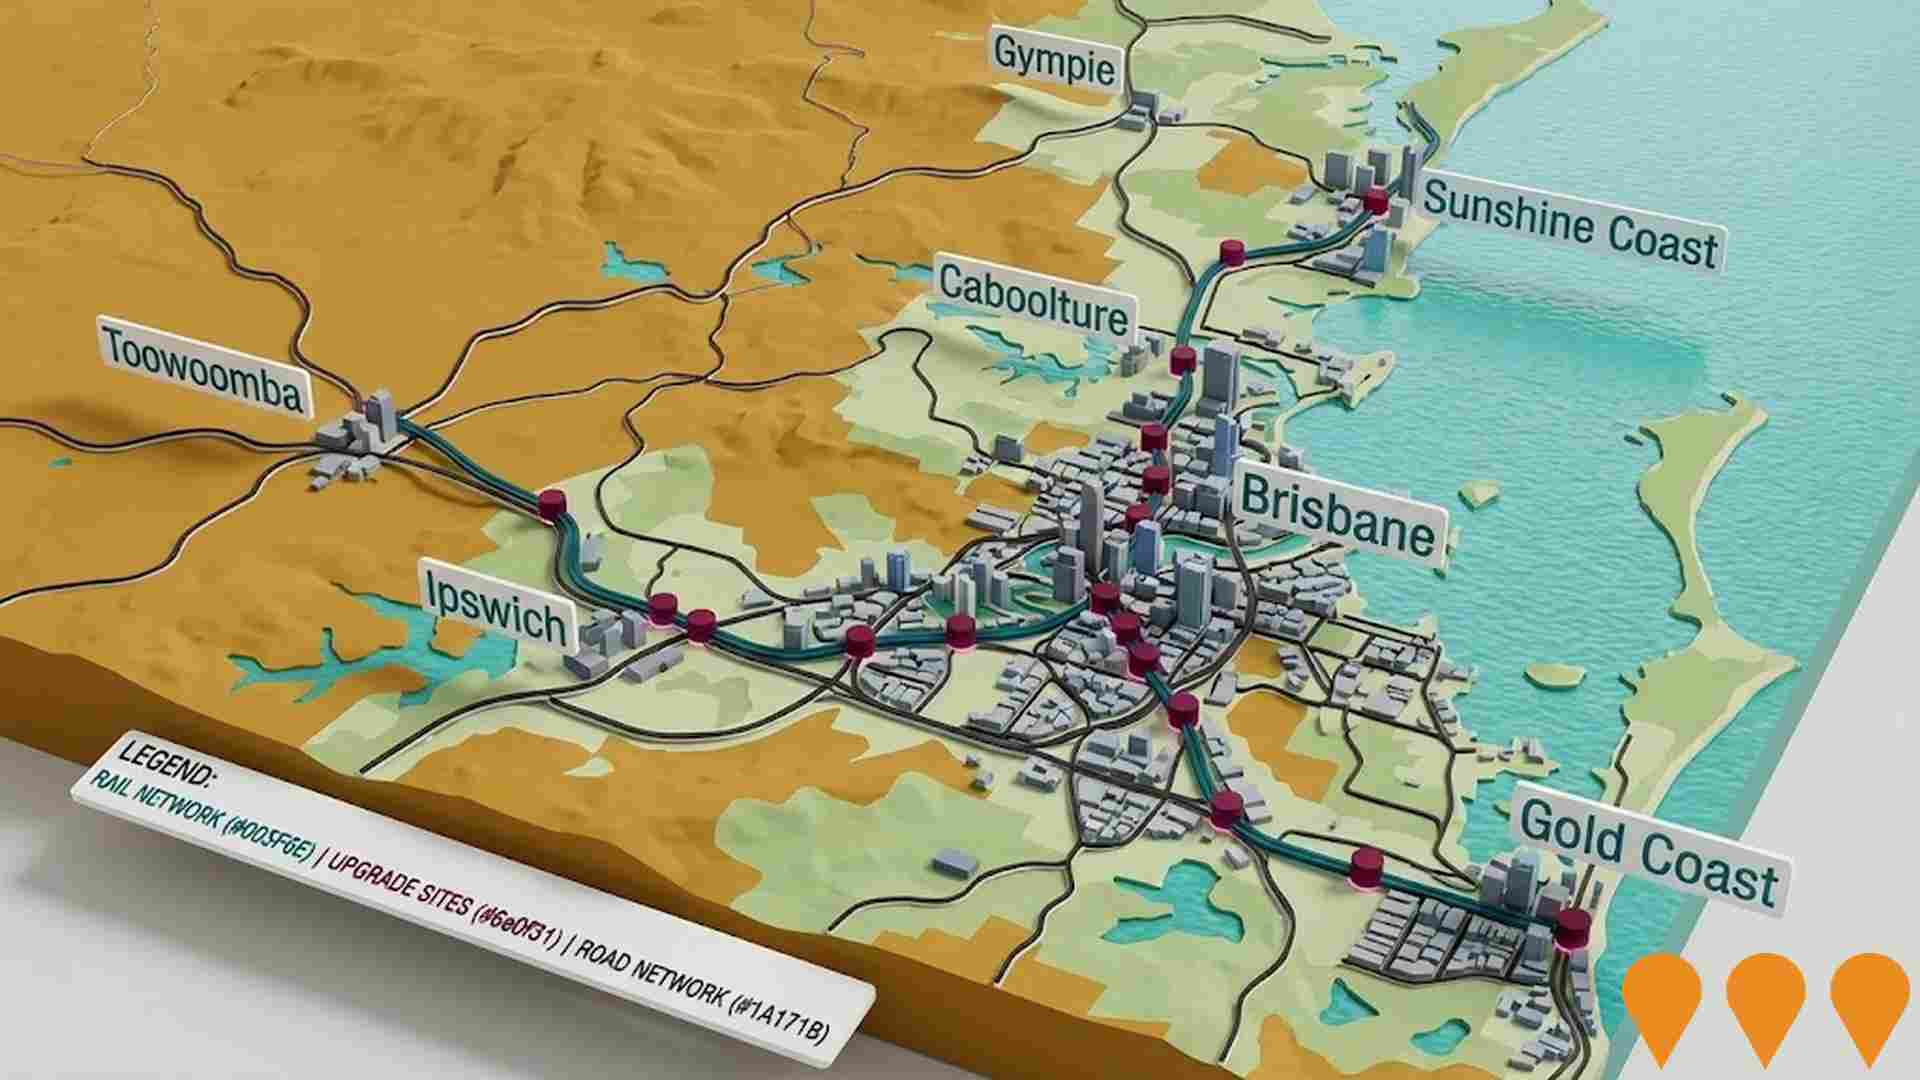
 Denotes AI-based impression for illustrative purposes only, not to be taken as definitive under any circumstances. Please follow links and conduct other investigations from the project's source for actual imagery. Developers and project owners wishing us to use original imagery please Contact Us and we will do so.
Frequently Asked Questions - Infrastructure
Brisbane 2032 Olympic and Paralympic Games Infrastructure Program
The $7.1 billion infrastructure program for the Brisbane 2032 Olympic and Paralympic Games includes a new ~60,000-seat main stadium at Victoria Park (hosting opening/closing ceremonies and athletics), a new Brisbane Arena (Roma Street or alternate location), venue upgrades to QSAC and Suncorp Stadium, new and upgraded aquatic centres, athletes' villages, and supporting transport improvements across South East Queensland. The program emphasises existing venues where possible with targeted new builds for legacy benefit.

Queensland Energy and Jobs Plan
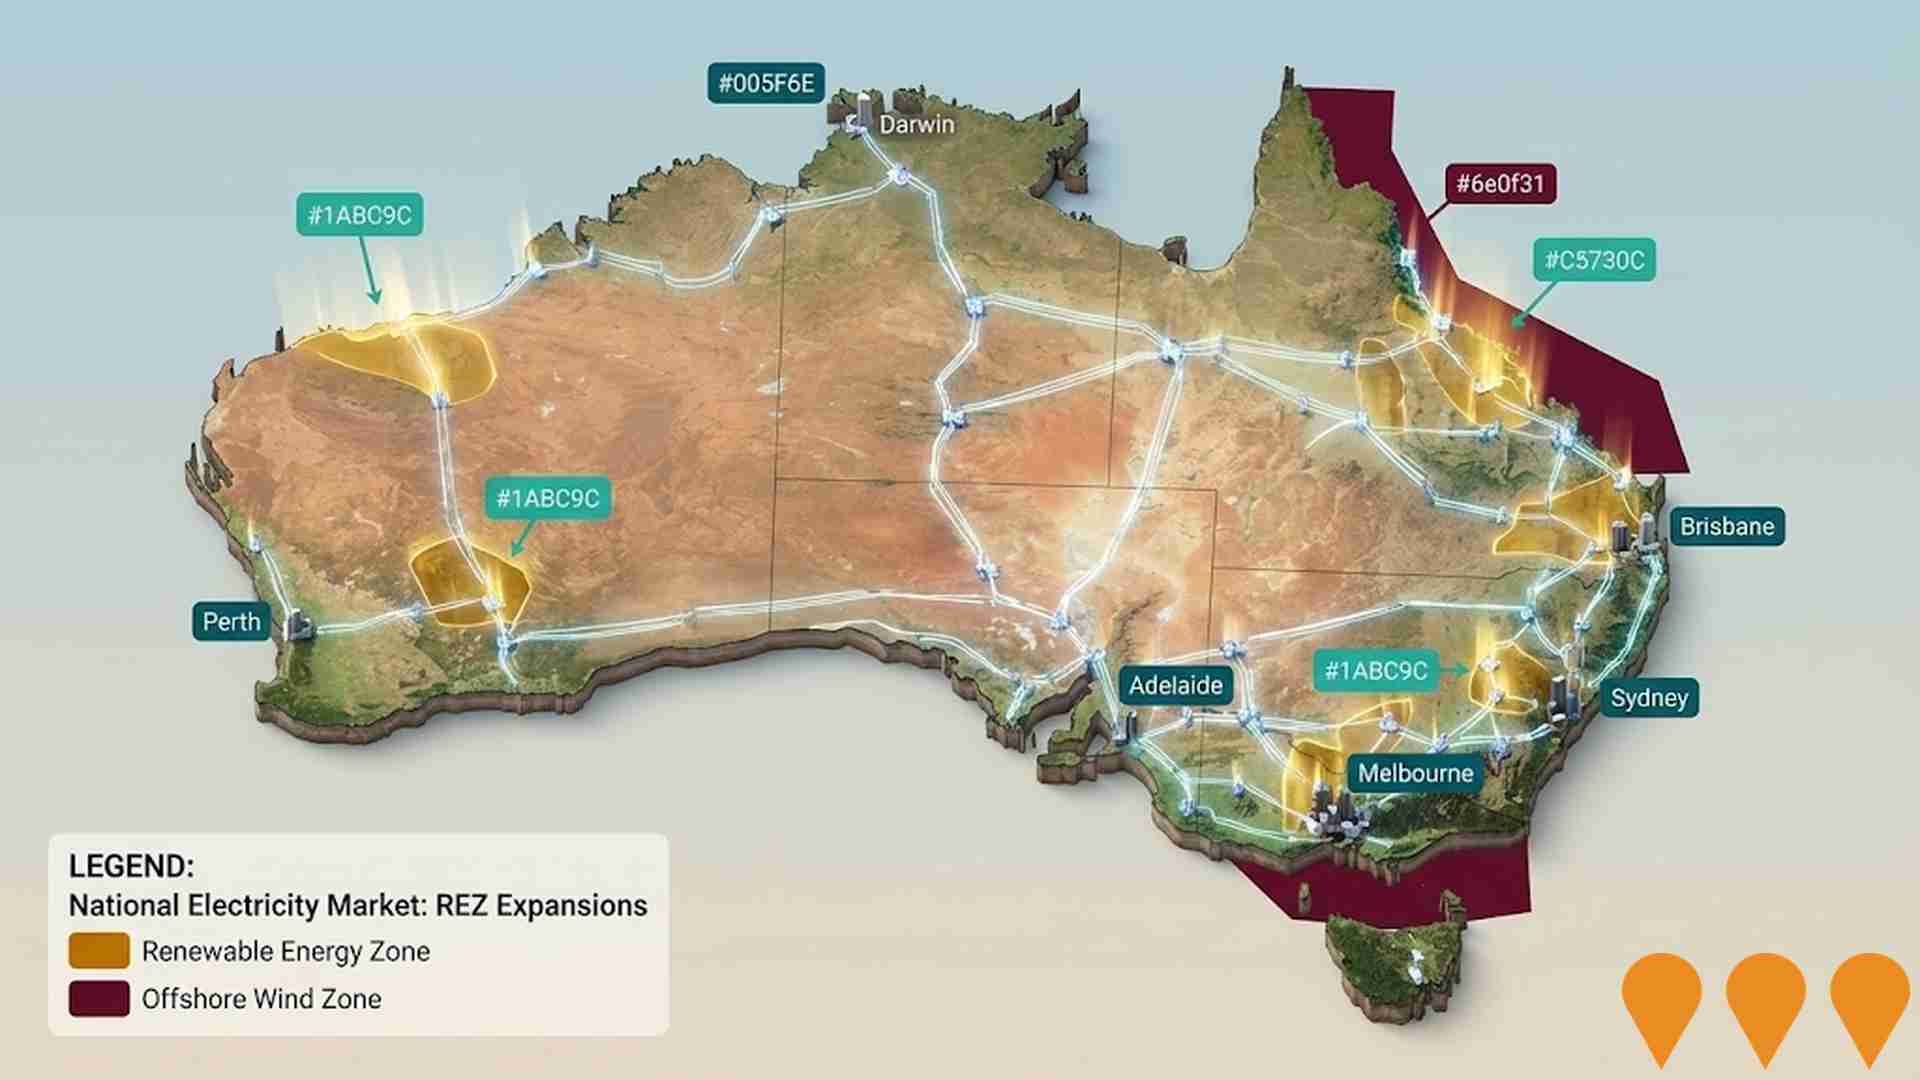
The Queensland Energy and Jobs Plan, initially a comprehensive plan for renewable energy and job creation, has been superseded by the Queensland Energy Roadmap 2025 by the new government (October 2025). The Roadmap focuses on energy affordability, reliability, and sustainability by leveraging existing coal and gas assets, increasing private sector investment in renewables and storage (targeting 6.8 GW of wind/solar and 3.8 GW of storage by 2030), and developing a new Regional Energy Hubs framework to replace Renewable Energy Zones. The initial $62 billion investment pipeline is now primarily focused on implementing the new Roadmap's priorities, including an estimated $26 billion in reduced energy system costs compared to the previous plan. The foundational legislation is the Energy Roadmap Amendment Bill 2025, which is currently before Parliament and expected to pass by December 2025, formally repealing the previous renewable energy targets. Key infrastructure projects like CopperString's Eastern Link are still progressing. The overall project is in the planning and legislative amendment phase under the new policy.
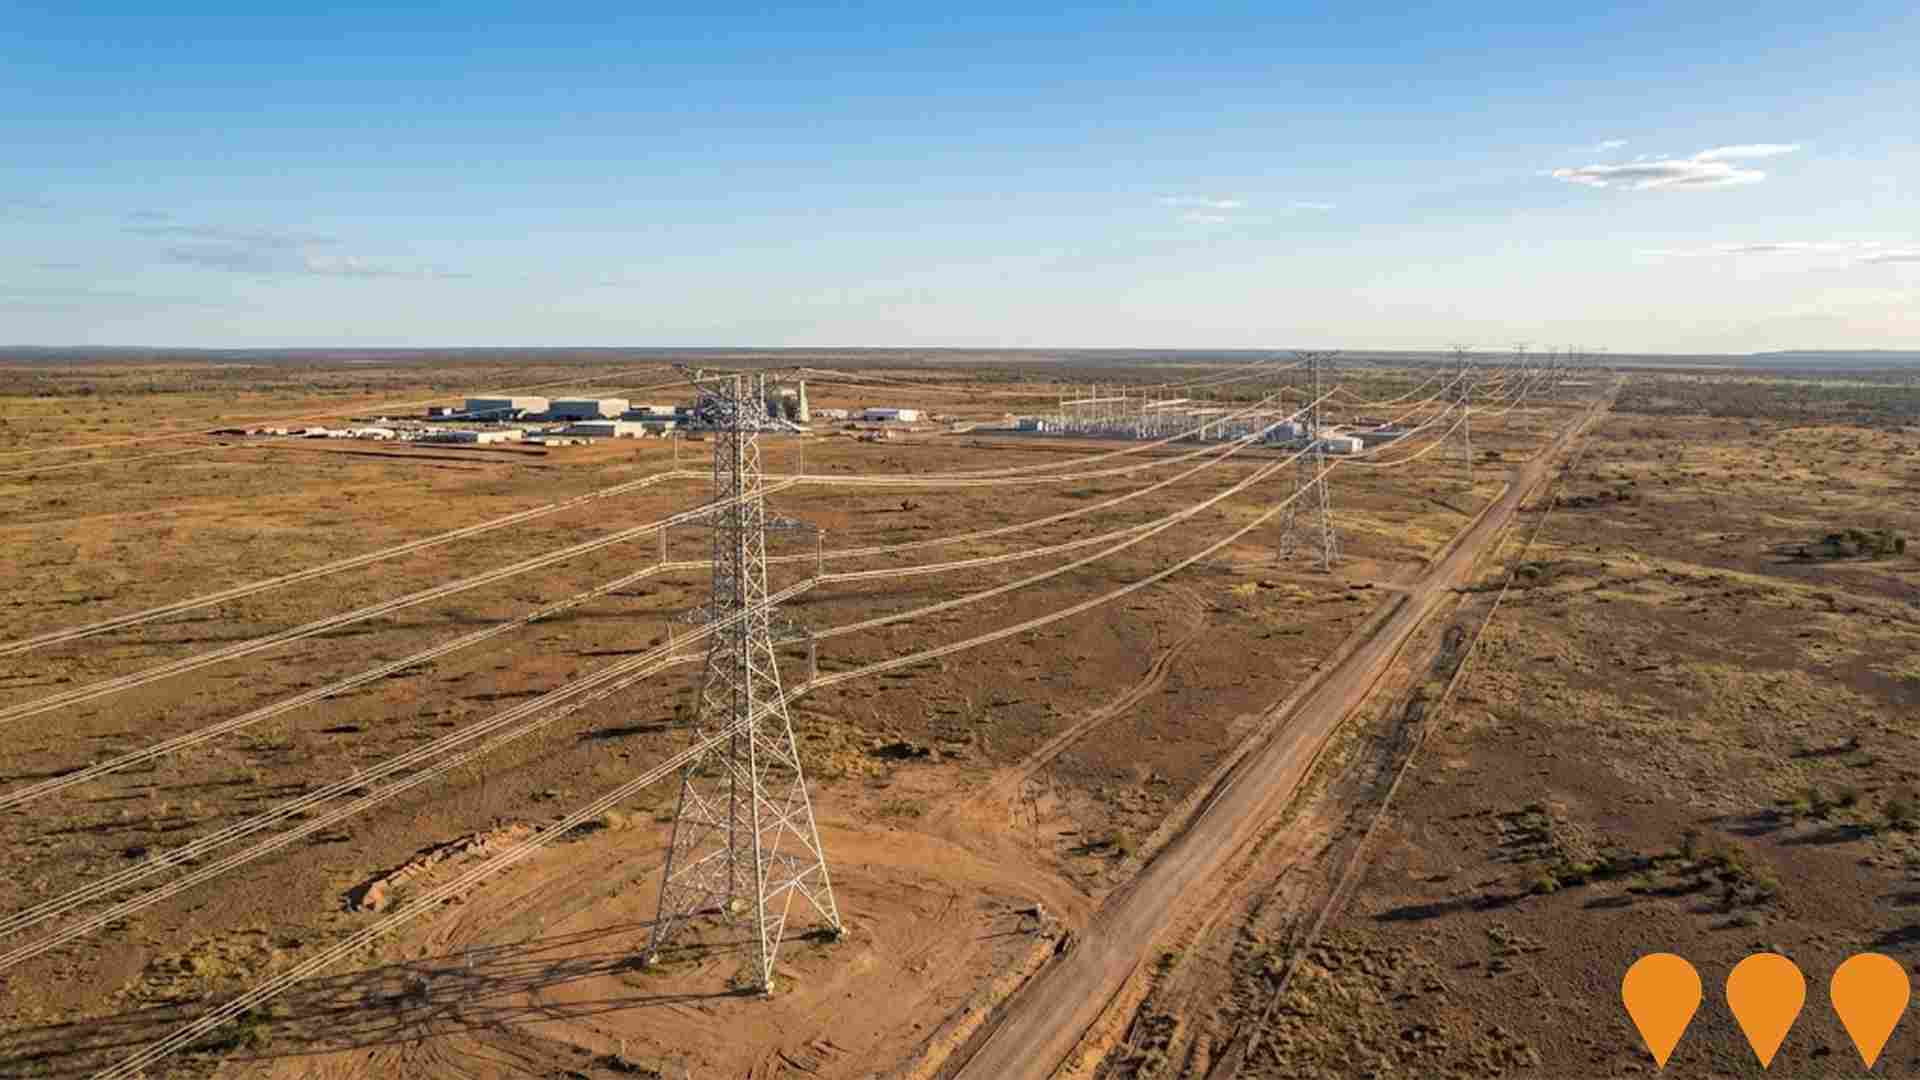
Queensland Energy Roadmap Infrastructure
The Queensland Energy Roadmap 2025 is the State Government's strategic plan to deliver affordable, reliable, and sustainable energy. Replaces the former Energy and Jobs Plan, focusing on extending the life of state-owned coal assets, a $1.6 billion Electricity Maintenance Guarantee, and the $400 million Queensland Energy Investment Fund. Key infrastructure includes the CopperString transmission line and new gas-fired generation, while the Pioneer-Burdekin Pumped Hydro project has been cancelled in favor of smaller storage options.
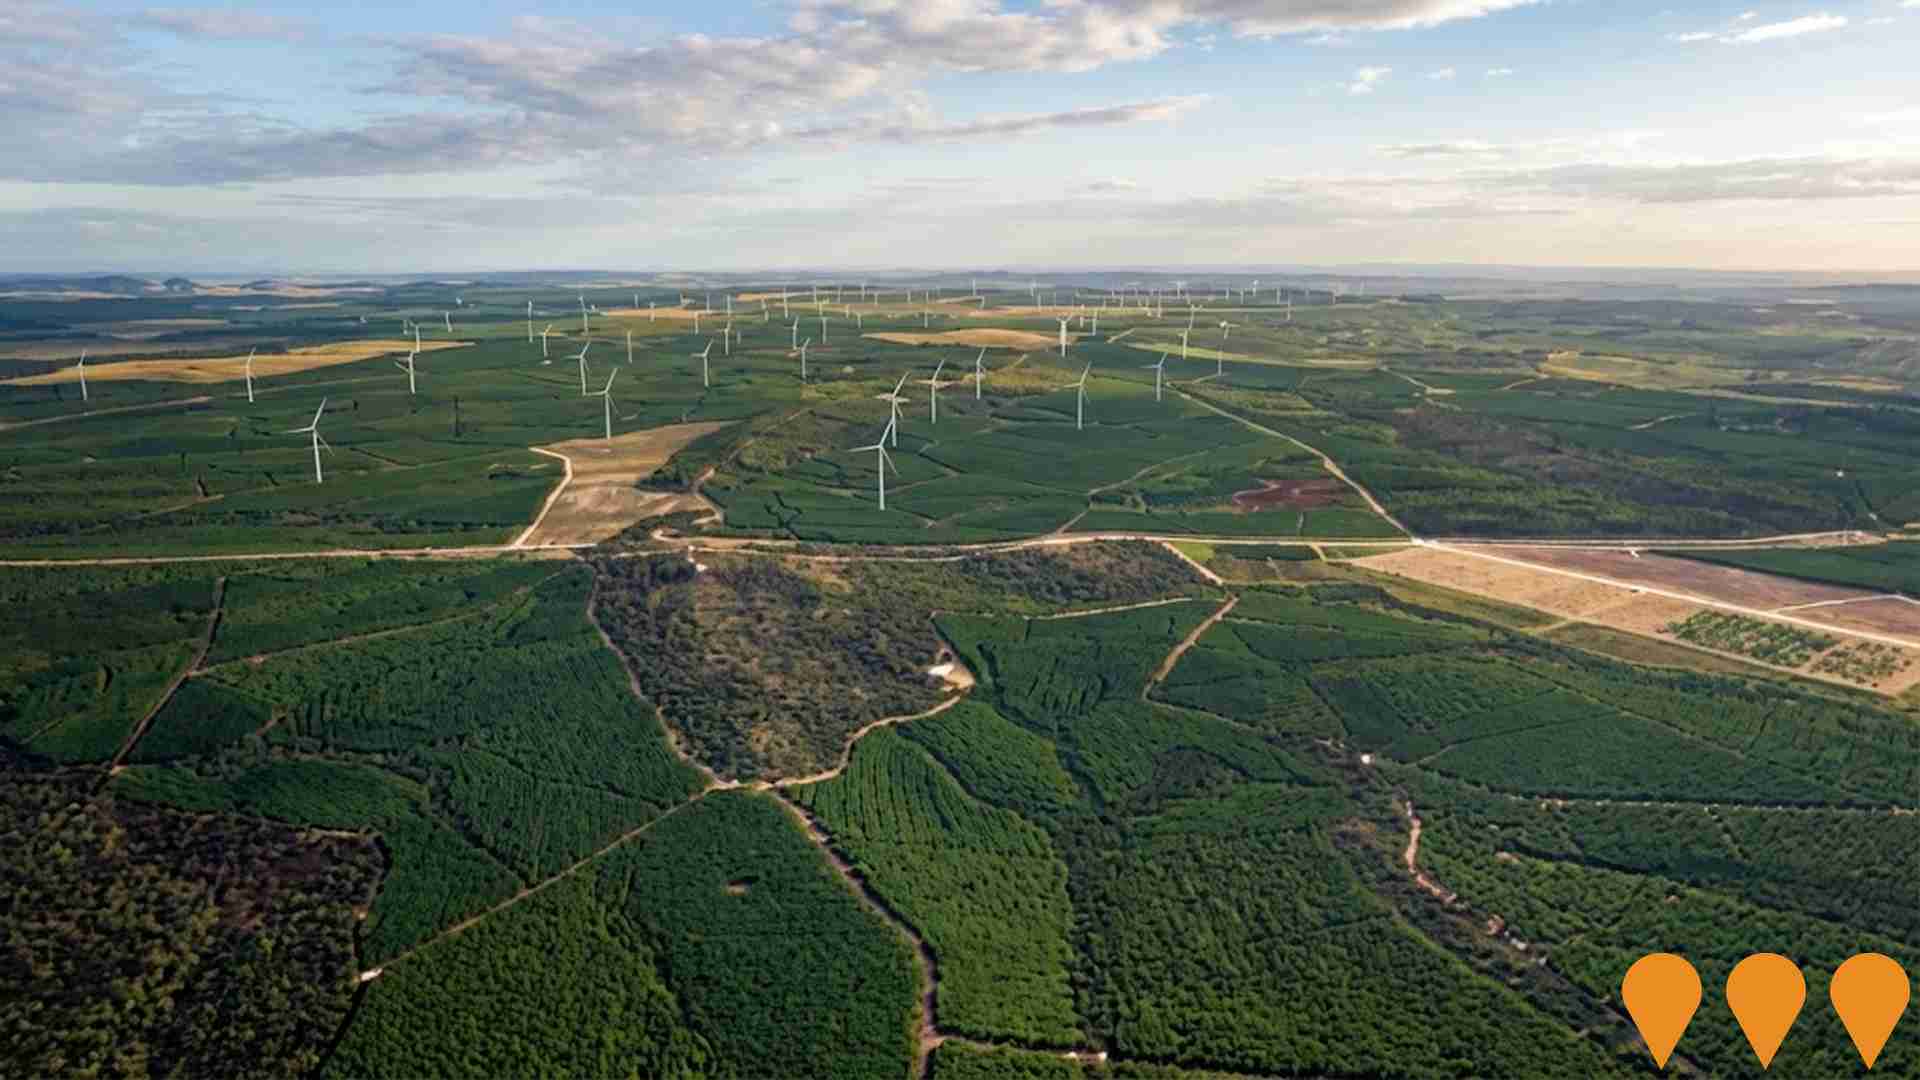
Forest Wind Farm
Australia's largest wind farm project with up to 226 turbines and a capacity of 1,200 MW, located within commercial pine plantations in the Wide Bay region of Queensland. The project will generate enough clean energy to power approximately 650,000 Queensland homes and reduce CO2 emissions by over 3 million tonnes annually. It has received Commonwealth EPBC approval (2024) and Queensland Coordinated Project declaration, with construction expected to commence in 2026 subject to final investment decision.
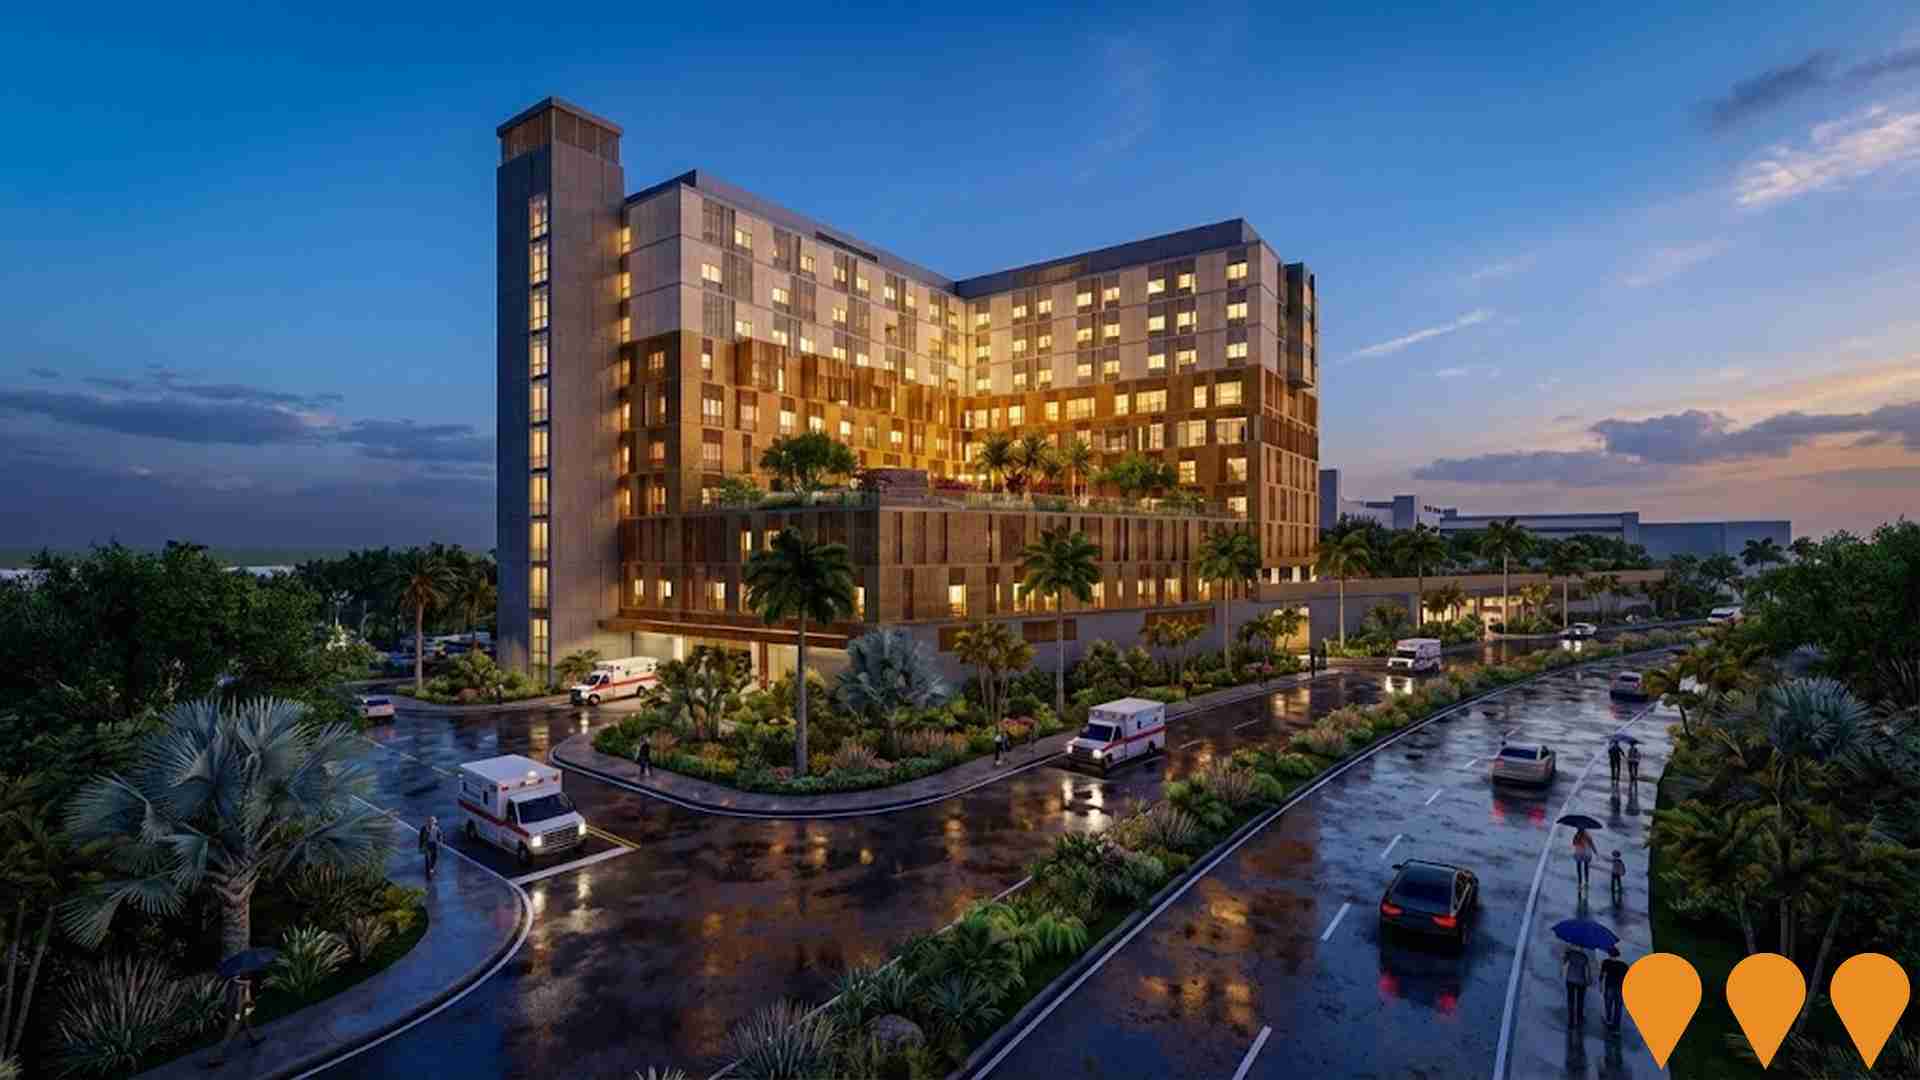
Building Future Hospitals Program
Queensland's flagship hospital infrastructure program delivering over 2,600 new and refurbished public hospital beds by 2031-32. Includes major expansions at Ipswich Hospital (Stage 2), Logan Hospital, Princess Alexandra Hospital, Townsville University Hospital, Gold Coast University Hospital and multiple new satellite hospitals and community health centres.
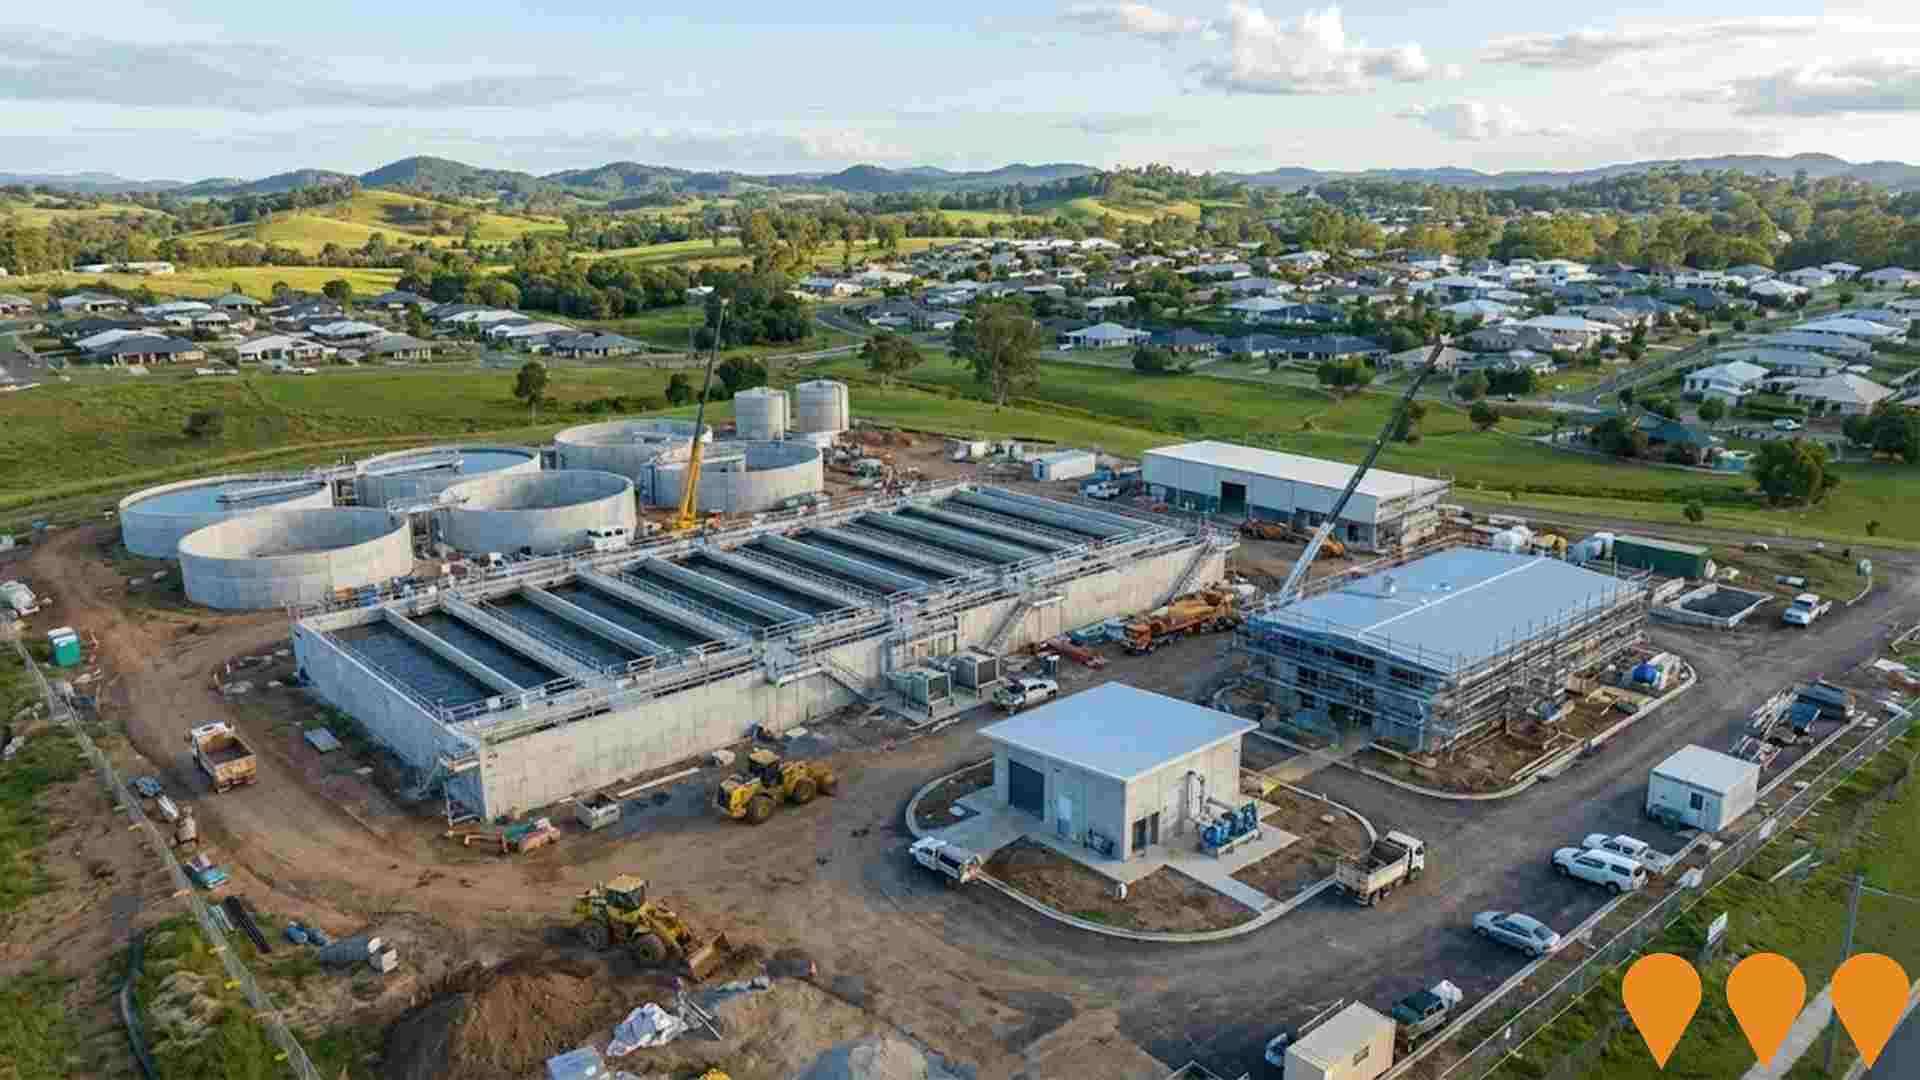
Gympie Water Resilience and Augmentation Project (GWRAP) - Phase 1
Phase 1 of the Gympie Water Resilience and Augmentation Project delivers critical water security infrastructure including a new water treatment plant at Jones Hill and associated trunk mains to support population and economic growth to 2050, enabling an additional 5,350 dwellings across the region.
Bruce Highway Upgrade Program
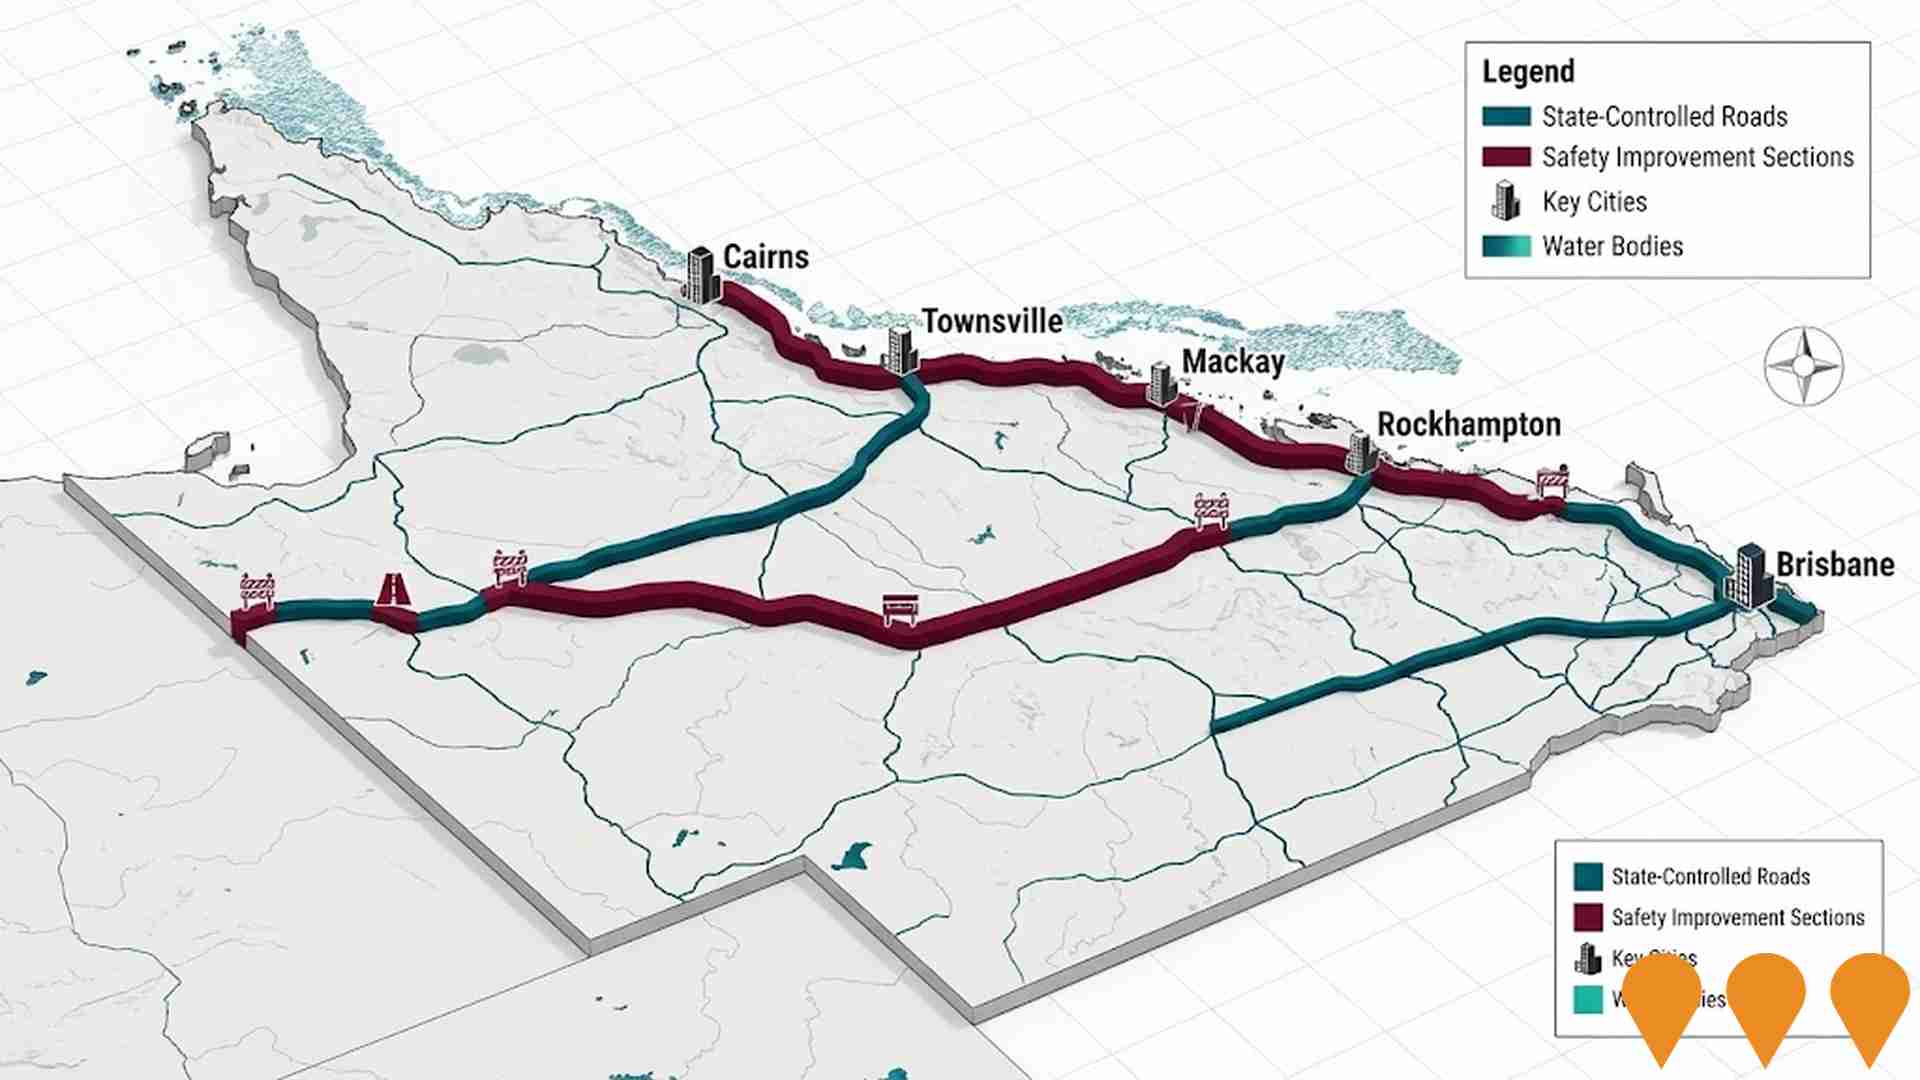
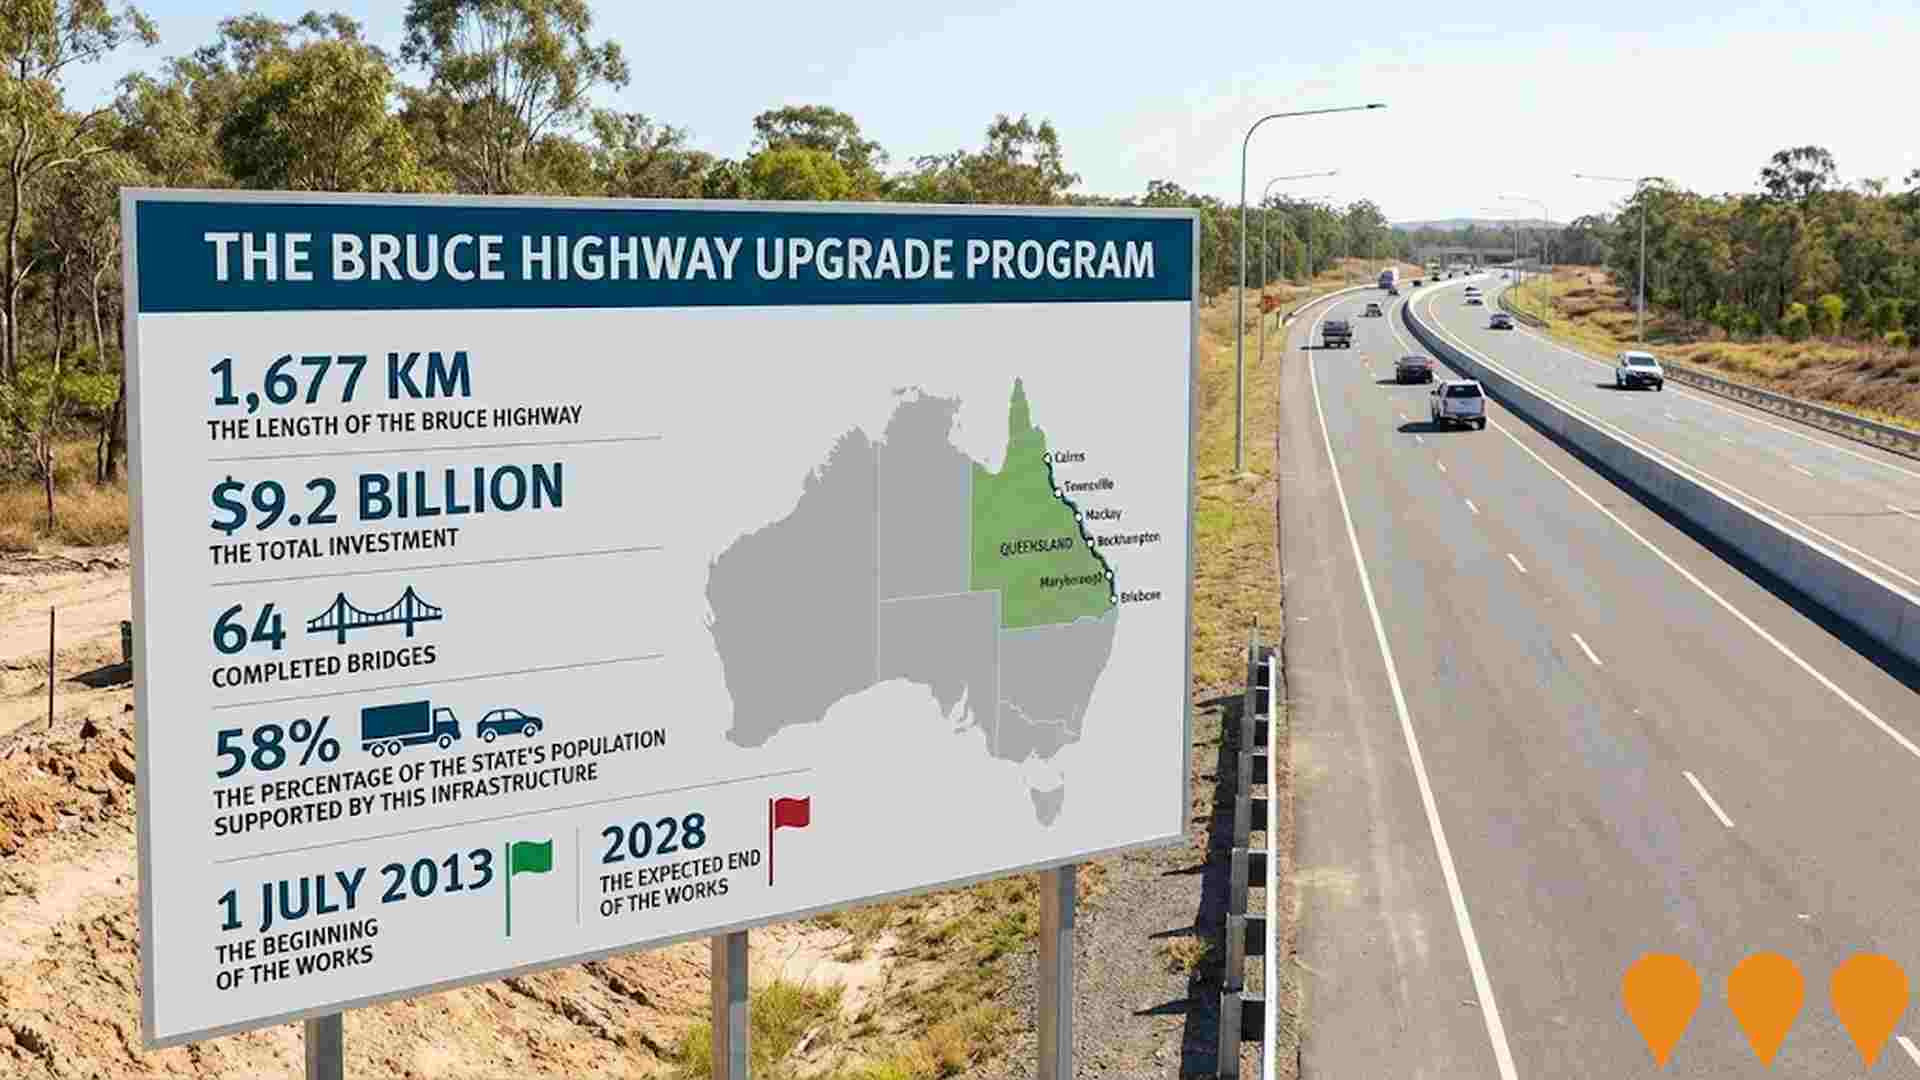
The Bruce Highway Upgrade Program is Queensland's largest road infrastructure initiative, delivering safety, flood resilience, and capacity improvements along the 1,677km corridor from Brisbane to Cairns. The massive investment program includes the $9 billion Targeted Safety Program, major bypass projects (including Gympie, Rockhampton, and Tiaro), bridge replacements, and wide centre line treatments. Jointly funded by the Australian and Queensland governments, works are progressing across multiple sections simultaneously.
Bruce Highway (Cooroy to Curra) Section D - Northern Contract
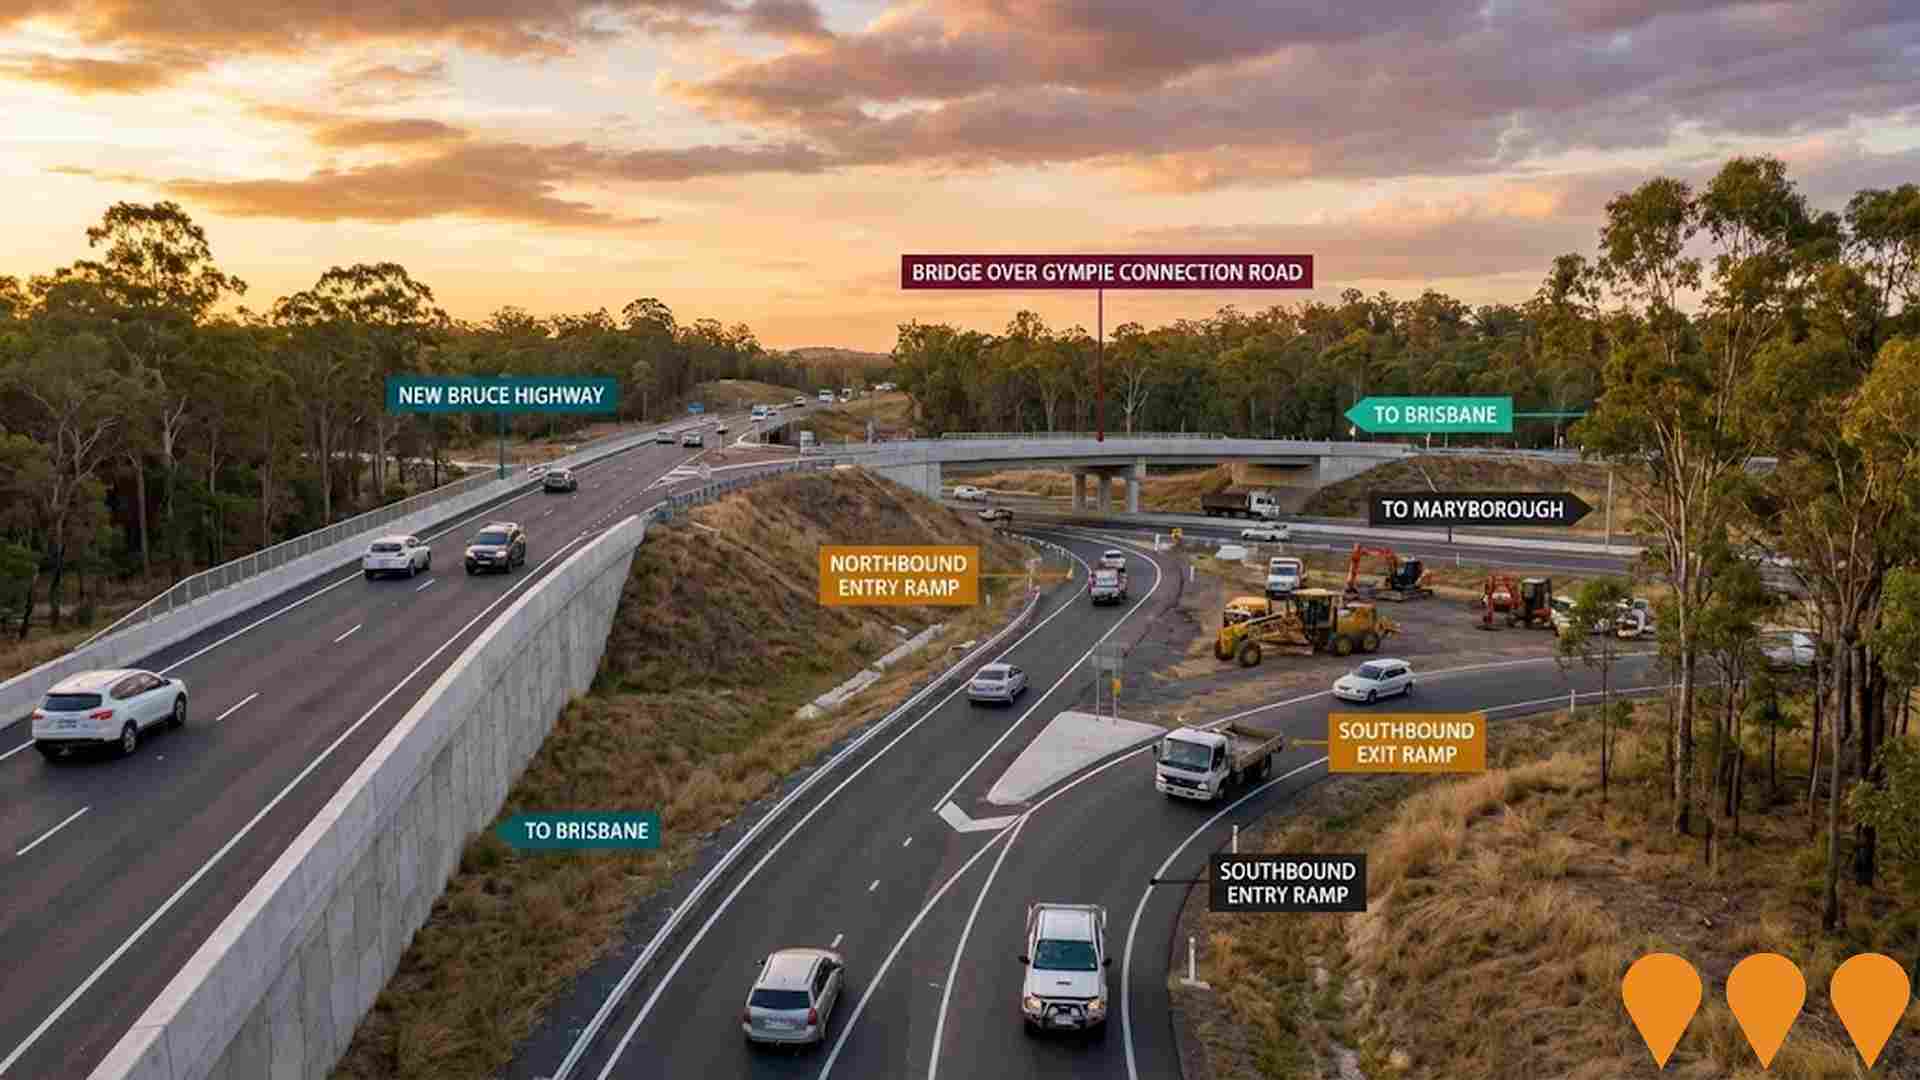
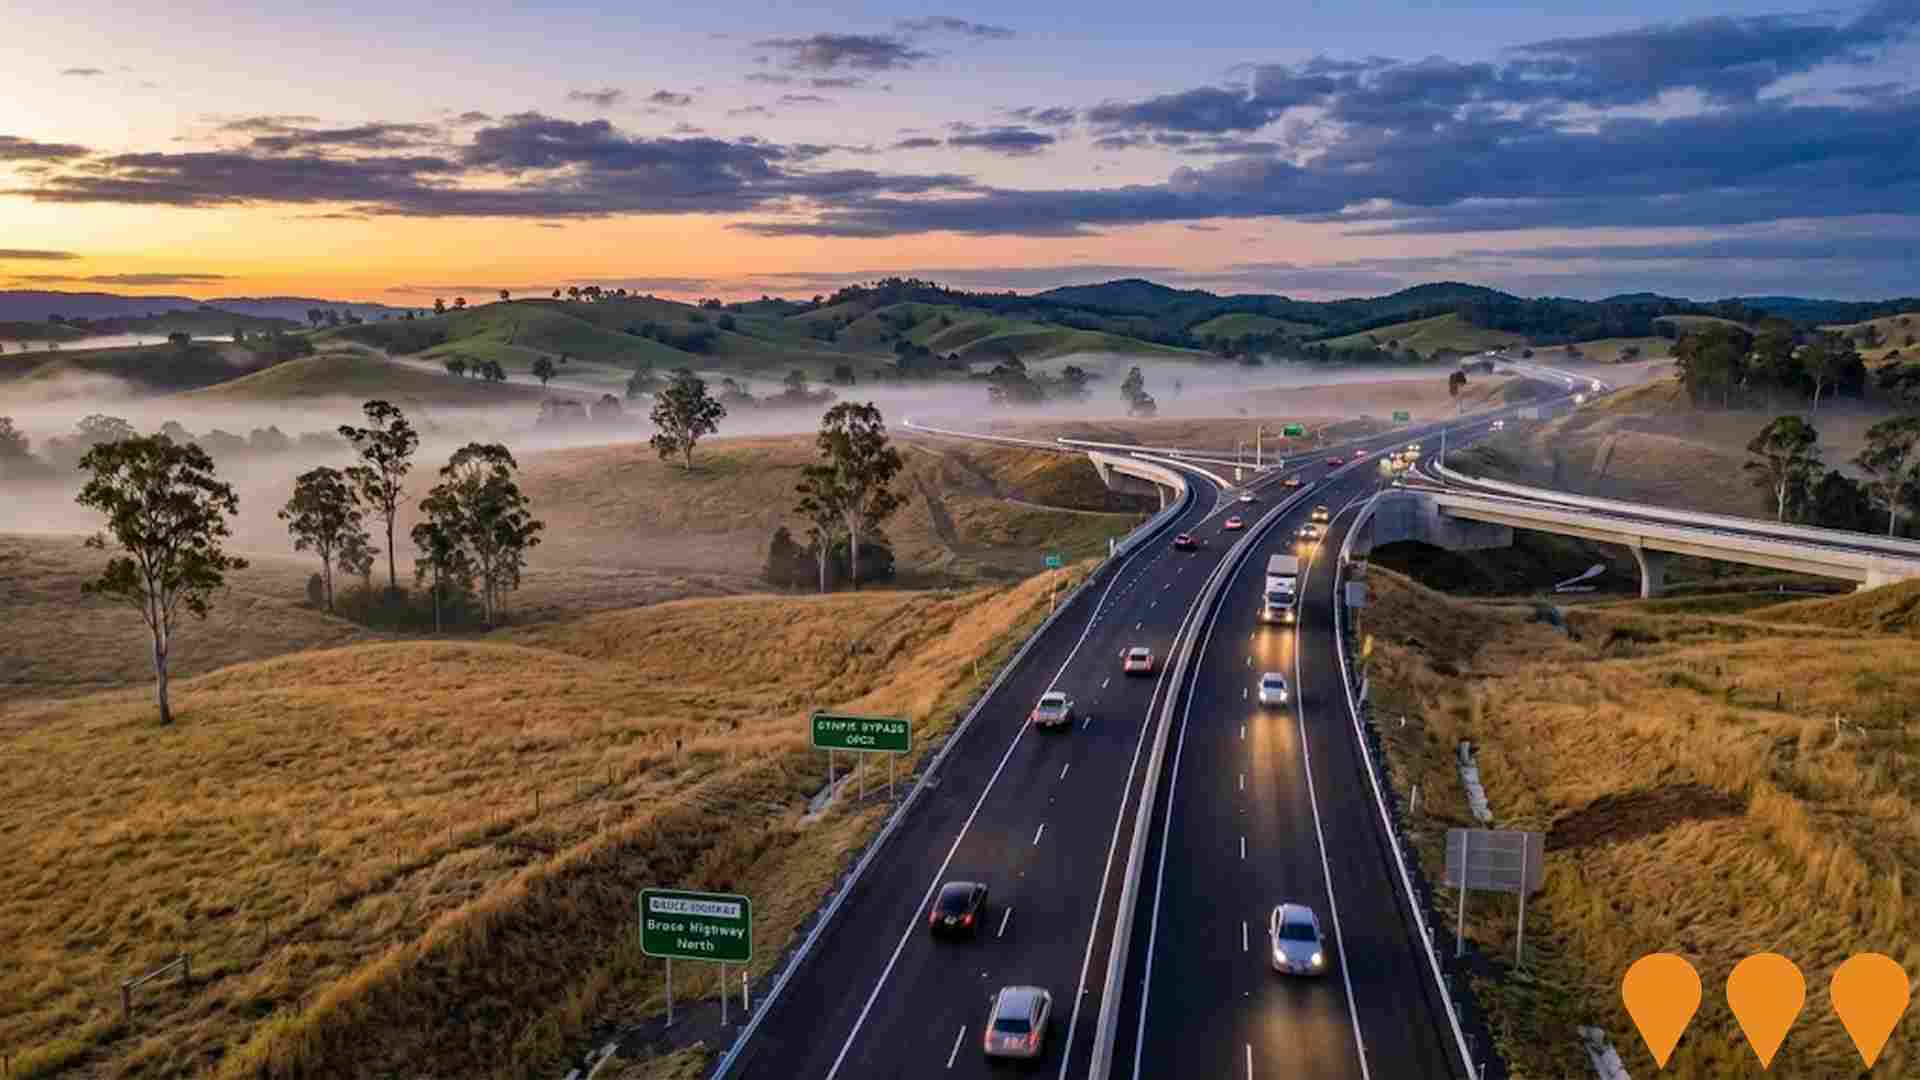
The northern contract of Section D delivered part of the 26 km four-lane Gympie Bypass from north of Sandy Creek Road to Curra, including major structures and realignments. Section D opened to traffic on 16 Oct 2024 and completes the Cooroy to Curra upgrade with 42 bridges at 23 locations and three new interchanges (Flood Road, Gympie Connection Road, Curra).
Employment
Employment performance in Cooloola has been below expectations when compared to most other areas nationally
Cooloola has a balanced workforce with both white and blue collar jobs. The tourism and hospitality sectors are prominent.
As of September 2025, the unemployment rate is 6.2%. There was an estimated employment growth of 9.8% over the past year. In Cooloola, 2,319 residents are employed while the unemployment rate is 2.1% higher than Rest of Qld's rate of 4.1%. Workforce participation in Cooloola lags significantly at 31.1%, compared to Rest of Qld's 59.1%.
Key industries for employment among residents include accommodation & food, retail trade, and health care & social assistance. Cooloola has a particular specialization in accommodation & food with an employment share of 1.9 times the regional level. However, health care & social assistance is under-represented at 9.9% compared to Rest of Qld's 16.1%. The area offers limited local employment opportunities as indicated by Census data. Over a 12-month period ending in September 2025, employment increased by 9.8%, labour force by 10.2%, leading to an unemployment rise of 0.4 percentage points. In comparison, Rest of Qld recorded employment growth of 1.7% and unemployment rose by 0.3 percentage points. As of 25-Nov-25, Queensland's employment contracted by 0.01% (losing 1,210 jobs), with the state unemployment rate at 4.2%, closely aligned with the national rate of 4.3%. Jobs and Skills Australia forecasts indicate national employment growth of 6.6% over five years and 13.7% over ten years. Applying these projections to Cooloola's employment mix suggests local employment should increase by 5.6% over five years and 11.9% over ten years, based on a simple weighting extrapolation for illustrative purposes.
Frequently Asked Questions - Employment
Income
Income metrics place the area in the bottom 10% of locations nationally according to AreaSearch analysis
The Cooloola SA2's median income among taxpayers was $34,812 and average income stood at $46,943 in financial year 2022, according to latest ATO data aggregated by AreaSearch. This is lower than the national averages of $50,780 and $64,844 respectively for Rest of Qld's median and average incomes. Based on Wage Price Index growth of 13.99% since financial year 2022, estimated current incomes as of September 2025 would be approximately $39,682 (median) and $53,510 (average). Census 2021 income data shows household, family and personal incomes in Cooloola fall between the 0th and 2nd percentiles nationally. The earnings band of $400 - 799 captures 41.5% of the community (3,030 individuals), differing from regional patterns where $1,500 - 2,999 dominates with 31.7%. This indicates that 51.3% of residents earn less than $800 per week, suggesting constrained household budgets across much of the locality. Housing affordability pressures are severe, with only 84.4% of income remaining after housing costs, ranking at the 2nd percentile nationally.
Frequently Asked Questions - Income
Housing
Cooloola is characterized by a predominantly suburban housing profile, with above-average rates of outright home ownership
Dwelling structure in Cooloola, as evaluated at the latest Census held on 28 August 2016, comprised 85.2% houses and 14.7% other dwellings including semi-detached homes, apartments, and 'other' dwellings. This compares to Non-Metro Qld's 91.8% houses and 8.2% other dwellings. Home ownership within Cooloola stood at 57.4%, with mortgaged properties at 19.9% and rented dwellings at 22.7%. The median monthly mortgage repayment in the area was $1,300, lower than Non-Metro Qld's average of $1,326 recorded as of June 2021. The median weekly rent figure for Cooloola was $280, compared to Non-Metro Qld's $290. Nationally, Cooloola's mortgage repayments were significantly lower than the Australian average of $1,863 reported in March 2022, while rents were substantially below the national figure of $375 recorded at the same time.
Frequently Asked Questions - Housing
Household Composition
Cooloola features high concentrations of lone person households, with a lower-than-average median household size
Family households account for 63.6% of all households, including 11.2% couples with children, 44.8% couples without children, and 7.2% single parent families. Non-family households make up the remaining 36.4%, with lone person households at 33.1% and group households comprising 3.2%. The median household size is 2.0 people, which is smaller than the Rest of Qld average of 2.4.
Frequently Asked Questions - Households
Local Schools & Education
Cooloola faces educational challenges, with performance metrics placing it in the bottom quartile of areas assessed nationally
The area's university qualification rate is 10.4%, significantly lower than the Australian average of 30.4%. This disparity presents both a challenge and an opportunity for targeted educational initiatives. Bachelor degrees are most prevalent at 7.7%, followed by graduate diplomas (1.4%) and postgraduate qualifications (1.3%). Vocational credentials are held by 43.1% of residents aged 15 and above, with advanced diplomas at 9.6% and certificates at 33.5%.
School and university attendance comprises 19.1% of the community, including 7.3% in primary education, 6.8% in secondary education, and 1.3% pursuing tertiary education.
Frequently Asked Questions - Education
Schools Detail
Nearby Services & Amenities
Transport
Transport servicing is very low compared to other areas nationally based on assessment of service frequency, route connectivity and accessibility
Cooloola has 19 active public transport stops operating within its boundaries. These stops are served by a mix of buses, with one individual route providing service. In total, these routes offer 15 weekly passenger trips.
Transport accessibility in Cooloola is rated as limited, with residents typically located 607 meters from the nearest transport stop. Service frequency averages two trips per day across all routes, equating to approximately zero weekly trips per individual stop.
Frequently Asked Questions - Transport
Transport Stops Detail
Health
Health performance in Cooloola is a key challenge with a range of health conditions having marked impacts on both younger and older age cohorts
Cooloola faces significant health challenges, with various conditions affecting both younger and older residents. Approximately 46% (~3,358 people) have private health cover, lower than the national average of 55.3%.
The most prevalent medical issues are arthritis (15.9%) and mental health concerns (9.1%). Conversely, 51.6% report no medical ailments, compared to 60.3% in Rest of Qld. Residents aged 65 and over comprise 42.8% (3,126 people), higher than the 25.4% in Rest of Qld. Despite this, health outcomes among seniors in Cooloola are better than those of the general population.
Frequently Asked Questions - Health
Cultural Diversity
Cooloola is considerably less culturally diverse than average when assessed alongside AreaSearch's national rankings for language and cultural background related metrics
Cooloola's cultural diversity was found to be below average, with 88.2% of its population being citizens, 83.8% born in Australia, and 97.8% speaking English only at home. The predominant religion in Cooloola is Christianity, accounting for 53.6% of the population, compared to 50.4% across the rest of Queensland. In terms of ancestry, the top three represented groups are English (34.5%), Australian (28.5%), and Irish (9.4%).
Notably, German ethnicity is overrepresented in Cooloola at 5.8%, compared to 5.8% regionally, Scottish at 8.9% versus 8.3%, and French at 0.6% versus 0.4%.
Frequently Asked Questions - Diversity
Age
Cooloola ranks among the oldest 10% of areas nationwide
Cooloola's median age is 62 years, which is notably higher than Rest of Qld's 41 years and well above Australia's median age of 38 years. The age profile shows that those aged 65-74 are particularly prominent at 25.5%, while the 25-34 age group is smaller at 5.2% compared to Rest of Qld. This concentration of 65-74 year-olds is significantly higher than the national average of 9.4%. Between 2021 and present, the 75-84 age group has grown from 13.2% to 14.4%, while the 15-24 cohort increased from 5.4% to 6.5%. Conversely, the 65-74 age group has declined from 27.9% to 25.5%. Looking ahead to 2041, demographic projections indicate significant shifts in Cooloola's age structure. The 85+ age cohort is projected to rise substantially by 210 people (99%), from 212 to 423. Senior residents aged 65 and above will drive 79% of population growth, emphasizing demographic aging trends. In contrast, population declines are projected for the 75-84 and 5-14 age cohorts.
