Chart Color Schemes
This analysis uses ABS Statistical Areas Level 2 (SA2) boundaries, which can materially differ from Suburbs and Localities (SAL) even when sharing similar names.
SA2 boundaries are defined by the Australian Bureau of Statistics and are designed to represent communities for statistical reporting (e.g., census and ERP).
Suburbs and Localities (SAL) represent commonly-used suburb/locality names (postal-style areas) and may use different geographic boundaries. For comprehensive analysis, consider reviewing both boundary types if available.
est. as @ -- *
ABS ERP | -- people | --
2021 Census | -- people
Sales Activity
Curious about local property values? Filter the chart to assess the volume and appreciation (including resales) trends and regional comparisons, or scroll to the map below view this information at an individual property level.
Find a Recent Sale
Sales Detail
Population
Coolangatta lies within the top quartile of areas nationally for population growth performance according to AreaSearch analysis of recent, and medium to long-term trends
Based on AreaSearch's analysis, Coolangatta's population was around 7566 as of Nov 2025. This reflected an increase of 1075 people (16.6%) since the 2021 Census which reported a population of 6491 people. The change was inferred from the estimated resident population of 7074 from the ABS as of June 2024 and an additional 638 validated new addresses since the Census date. This level of population equated to a density ratio of 3982 persons per square kilometer, placing Coolangatta in the top 10% of national locations assessed by AreaSearch, making land in the area highly sought after. Coolangatta's growth of 16.6% since the 2021 Census exceeded the non-metro area (8.8%) and the national average, marking it as a growth leader in the region. Population growth was primarily driven by overseas migration contributing approximately 68.9% of overall population gains during recent periods.
AreaSearch adopted ABS/Geoscience Australia projections for each SA2 area, released in 2024 with 2022 as the base year. For areas not covered and years post-2032, Queensland State Government's SA2 area projections were used, released in 2023 based on 2021 data. These state projections did not provide age category splits, so AreaSearch applied proportional growth weightings in line with the ABS Greater Capital Region projections for each age cohort, released in 2023 based on 2022 data. Looking ahead, a significant population increase in the top quartile of non-metropolitan areas nationally was forecast, with Coolangatta expected to grow by 2493 persons to 2041 based on the latest annual ERP population numbers, reflecting an increase of 26.4% over the 17 years.
Frequently Asked Questions - Population
Development
AreaSearch assessment of residential development activity positions Coolangatta among the top 25% of areas assessed nationwide
Coolangatta averaged approximately 194 new dwelling approvals annually. Between FY-21 and FY-25972 homes were approved, with an additional 106 approved in FY-26 to date. Over the past five financial years, on average, 0.7 people moved to the area for each dwelling built.
This indicates that new supply has kept pace with or exceeded demand, providing ample buyer choice and creating capacity for population growth beyond current forecasts. The average value of new homes being built is $724,000, suggesting developers are targeting the premium market segment with higher-end properties. In FY-26, there have been $6.5 million in commercial approvals, reflecting the area's residential character. Compared to the Rest of Qld, Coolangatta records 201.0% more development activity per person, offering buyers greater choice. However, development activity has moderated in recent periods. This activity is significantly above the national average, indicating robust developer interest in the area.
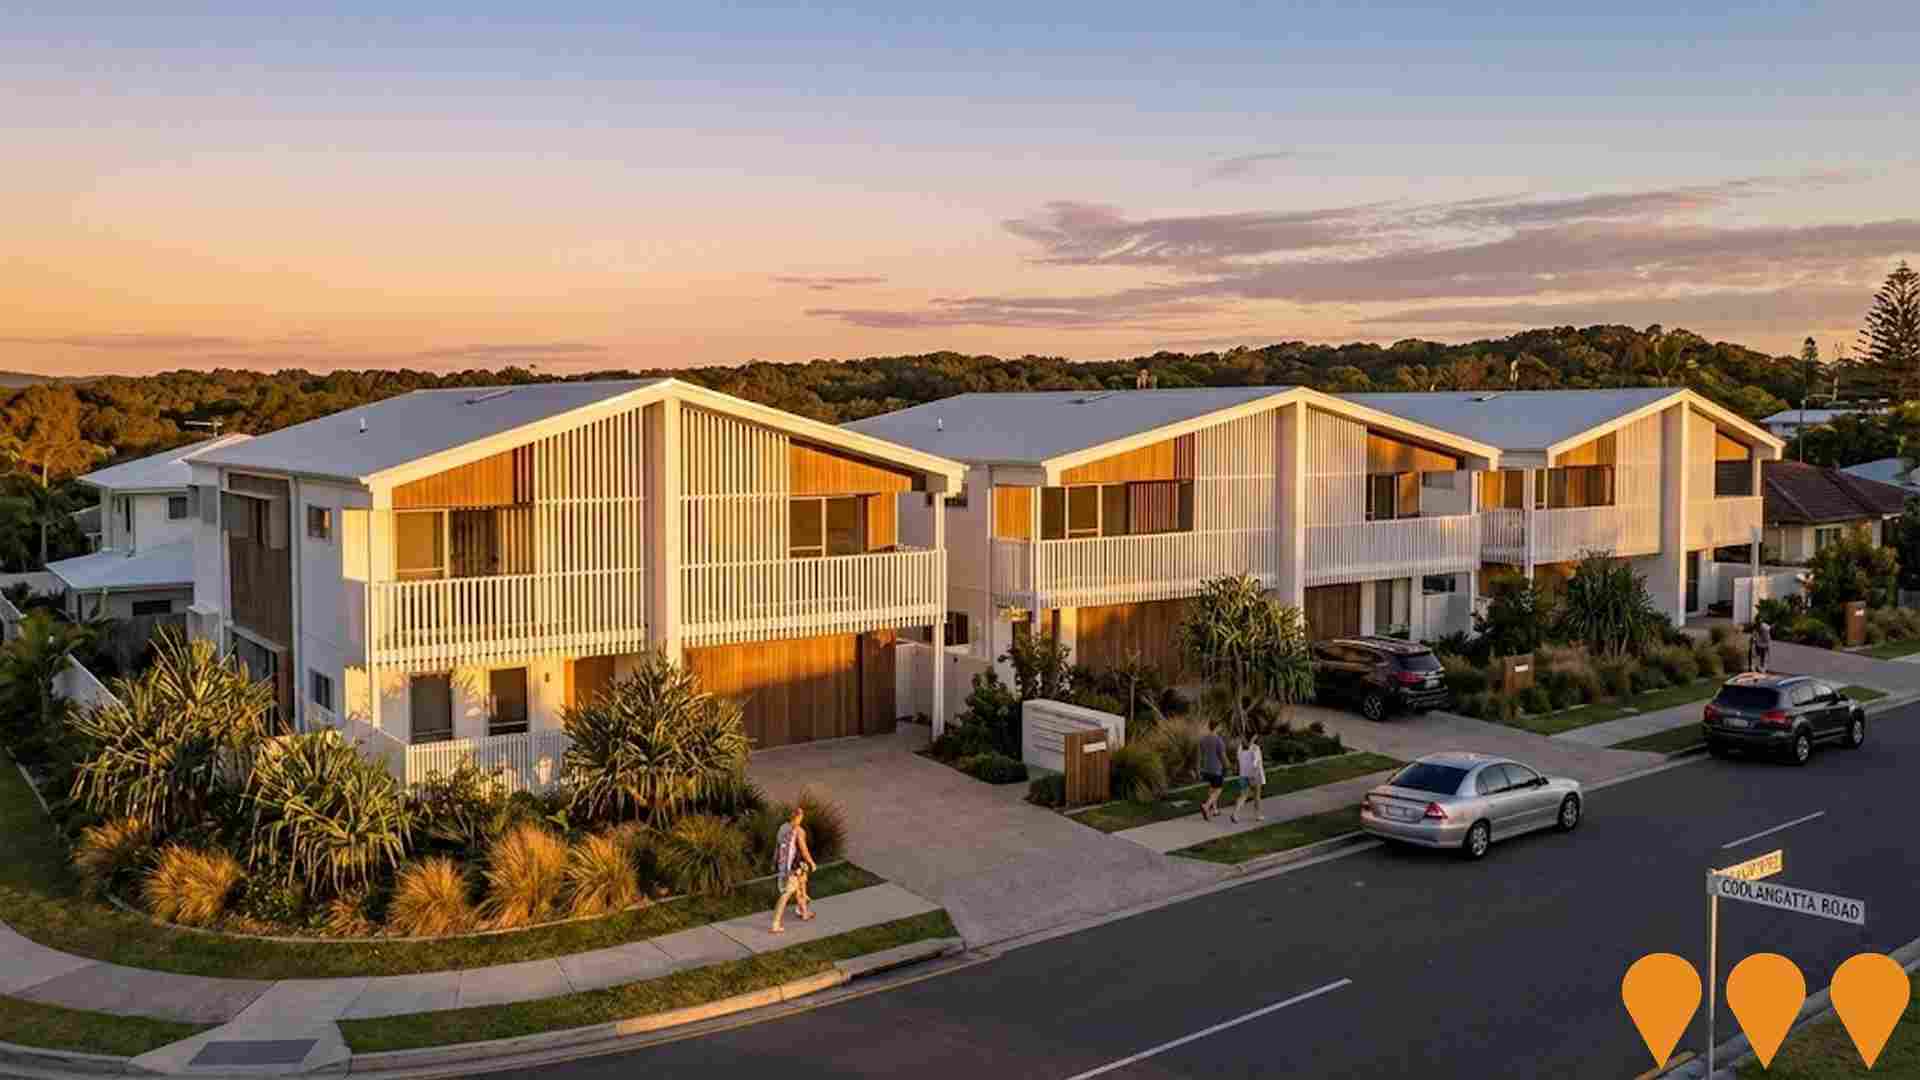
New development consists of 3.0% detached dwellings and 97.0% townhouses or apartments, demonstrating a trend towards denser development that provides accessible entry options for downsizers, investors, and entry-level buyers. The location has approximately 169 people per dwelling approval, indicating an expanding market. Looking ahead, Coolangatta is expected to grow by 2,001 residents through to 2041, according to the latest AreaSearch quarterly estimate. At current development rates, new housing supply should comfortably meet demand, providing good conditions for buyers and potentially supporting growth beyond current population projections.
Frequently Asked Questions - Development
Infrastructure
Coolangatta has strong levels of nearby infrastructure activity, ranking in the top 30% nationally
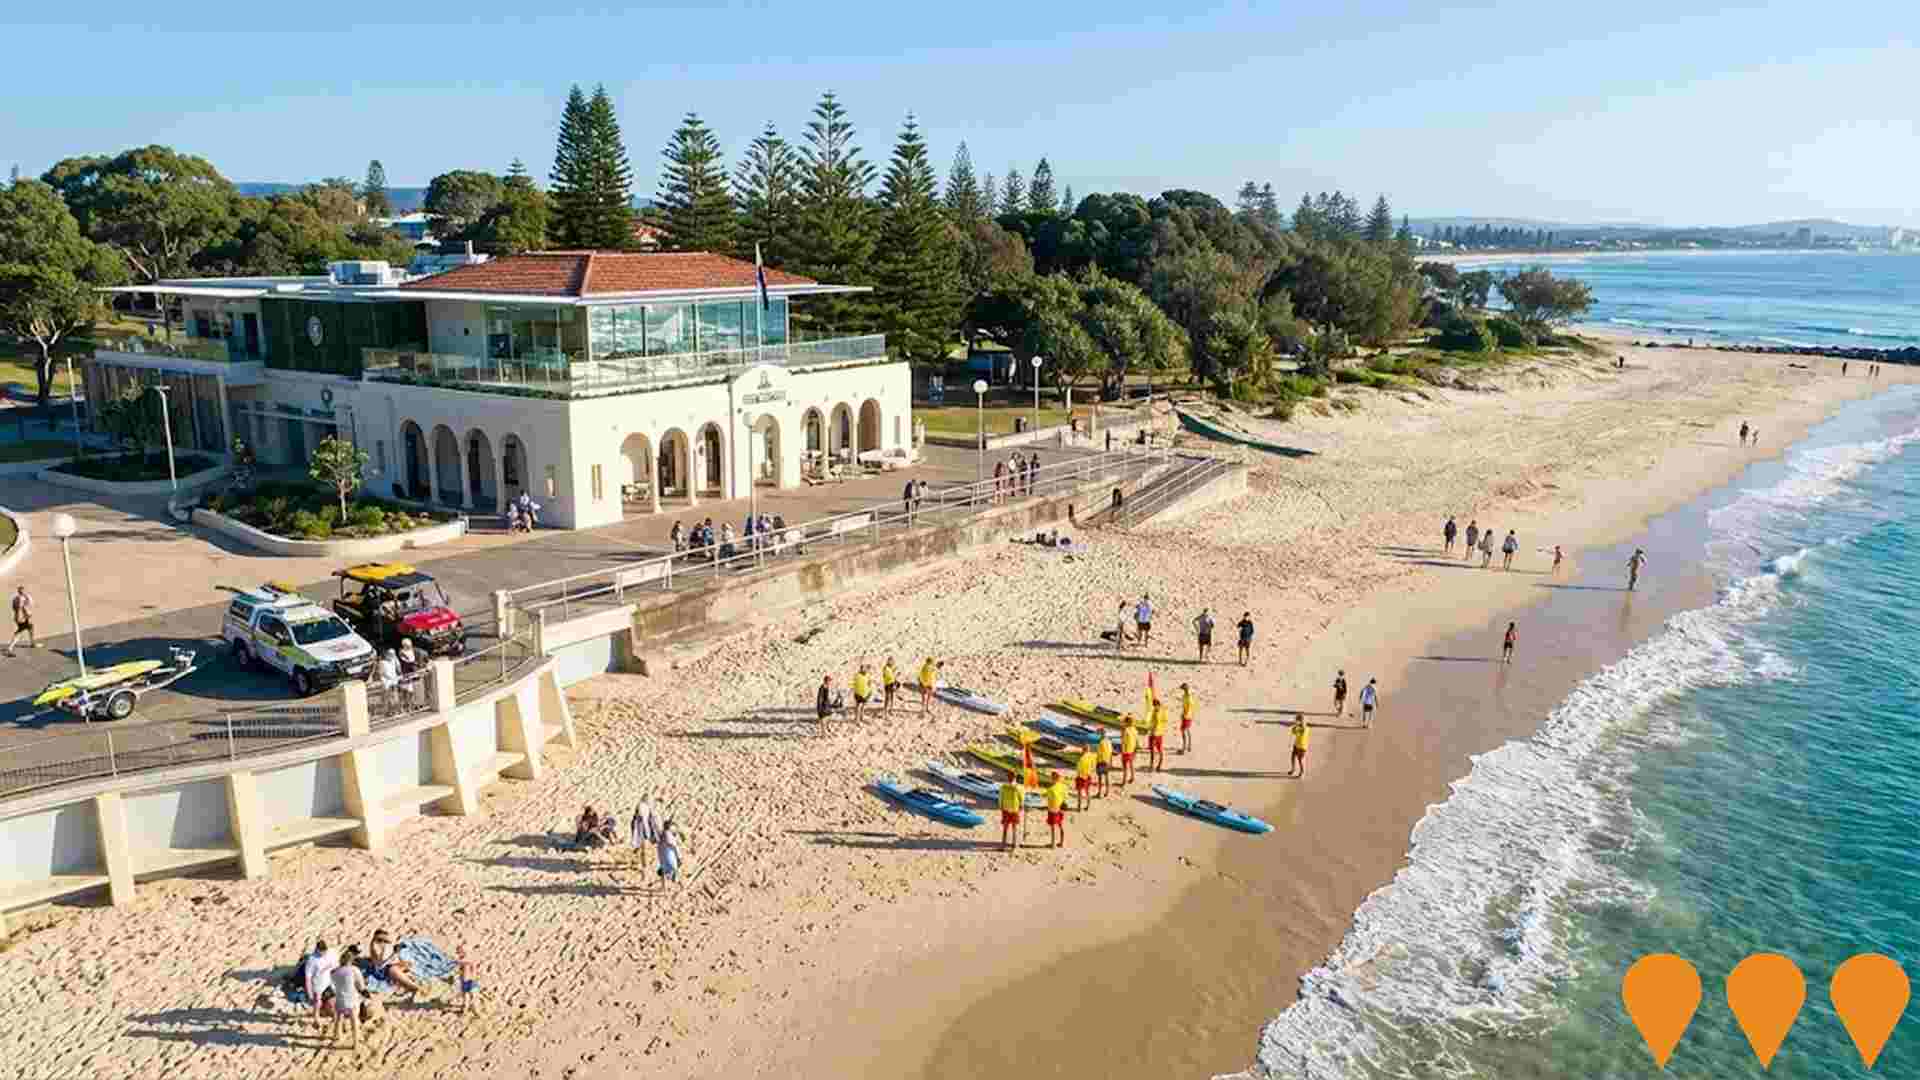
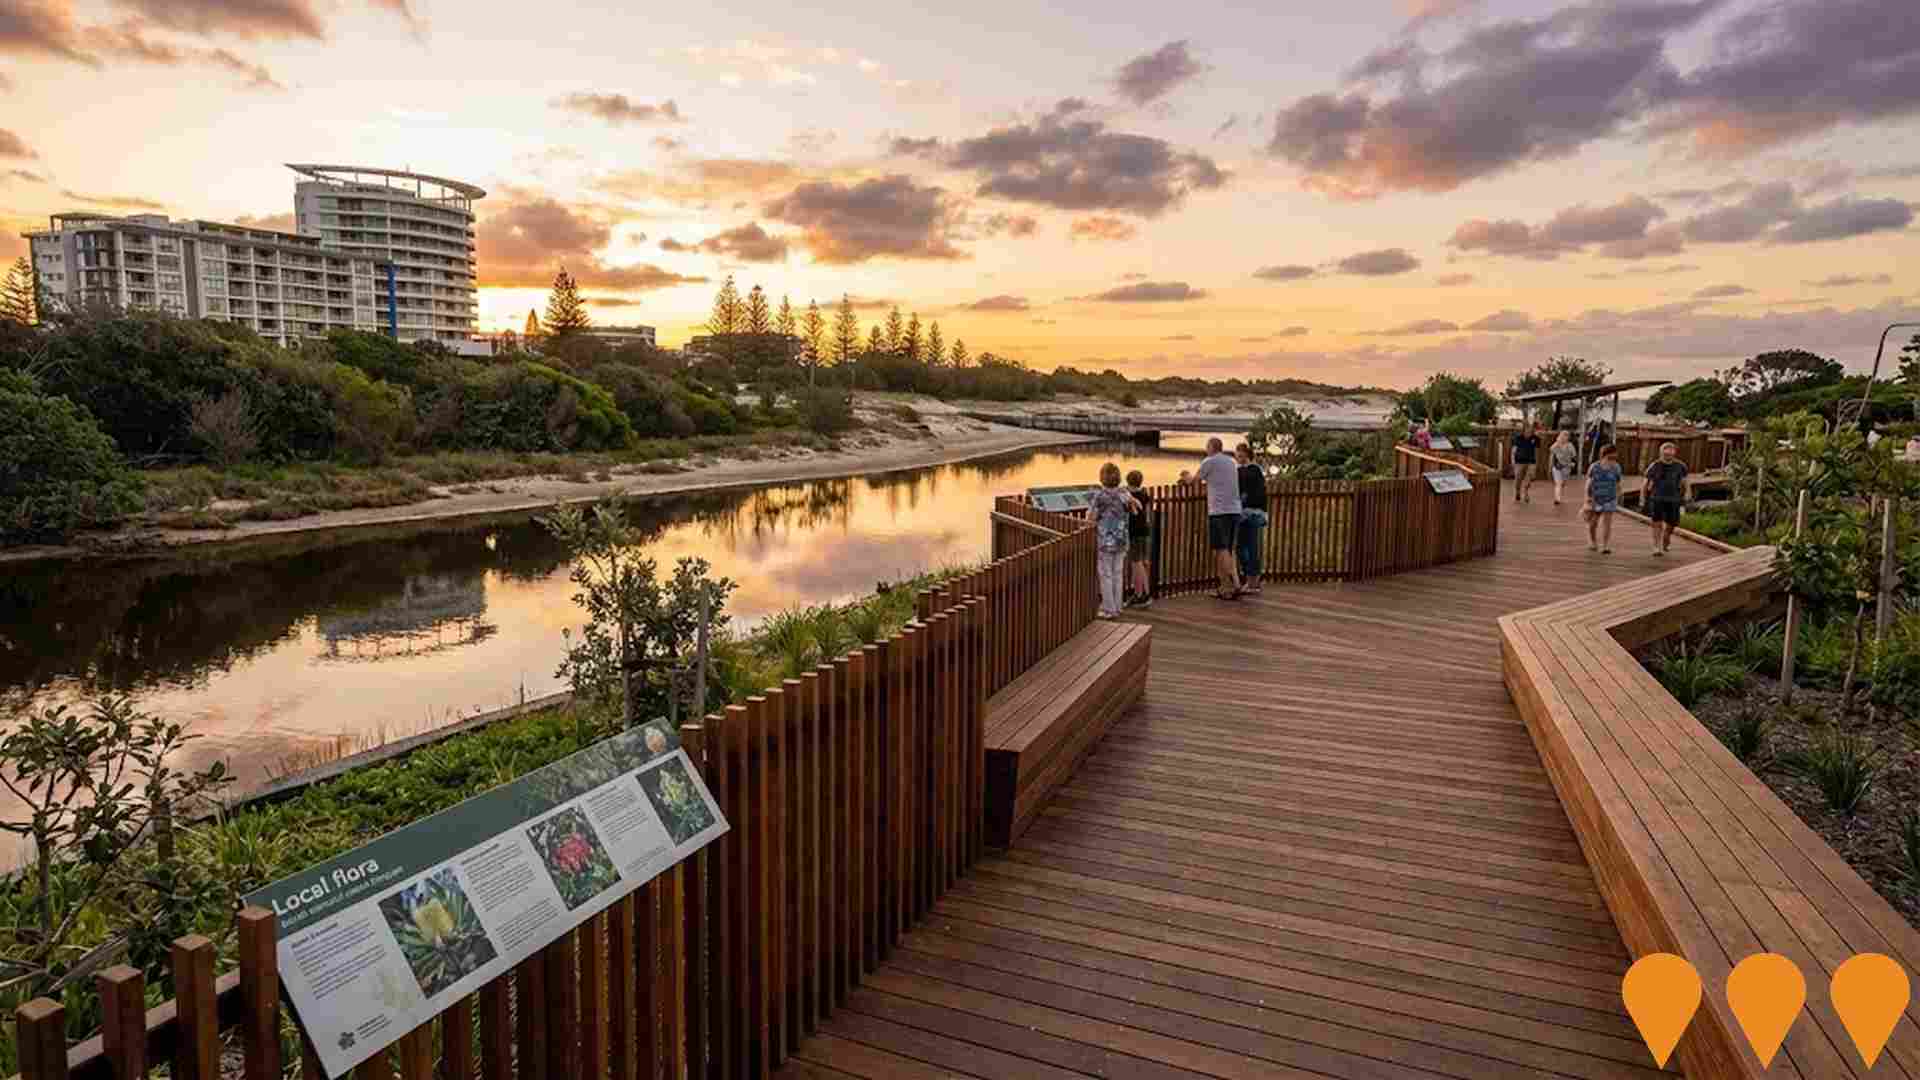
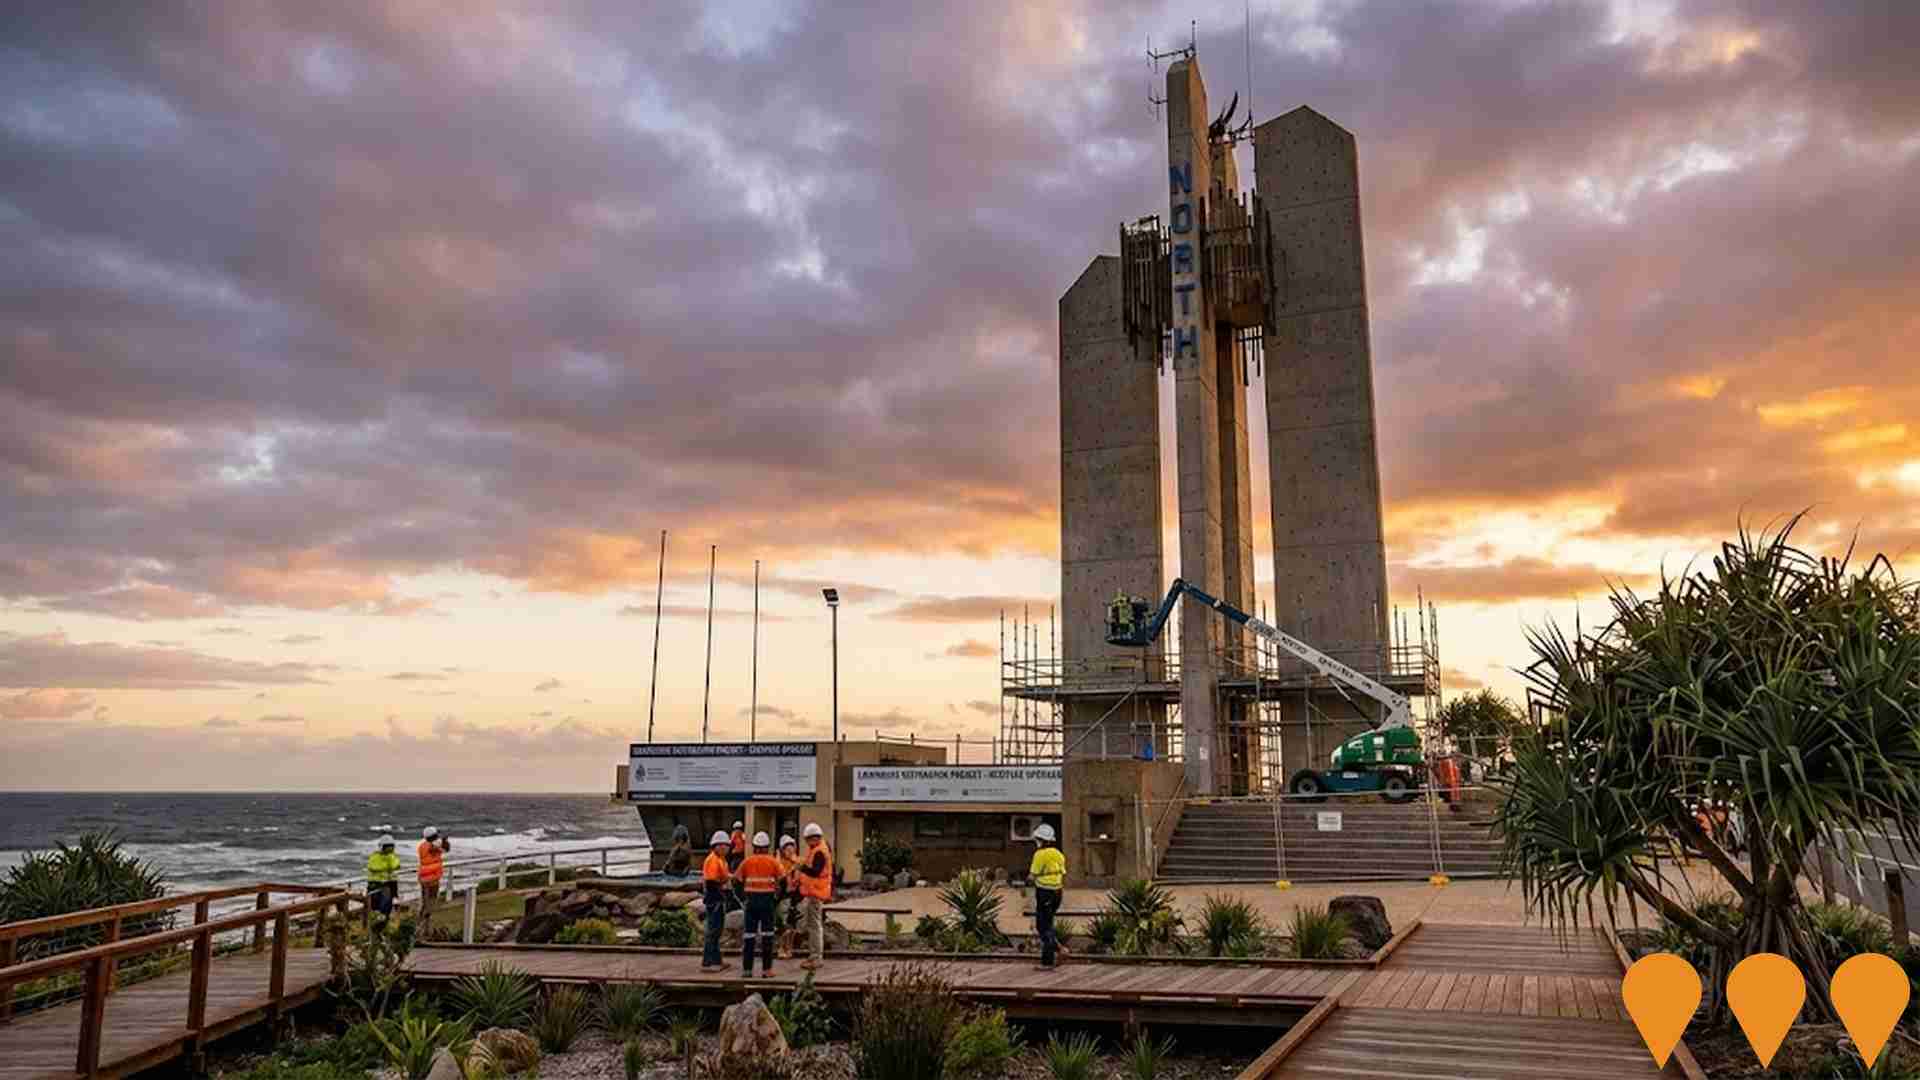
Changes to local infrastructure significantly impact an area's performance. AreaSearch identified 31 projects that could affect this region. Notable ones include Kirra Point Holiday Apartments, Coolangatta Beachfront Redevelopment, Coolangatta Beachside Resort, and Greenmount Beach Surf Life Saving Club Redevelopment. The following list details those most likely to be relevant.
Professional plan users can use the search below to filter and access additional projects.
INFRASTRUCTURE SEARCH
 Denotes AI-based impression for illustrative purposes only, not to be taken as definitive under any circumstances. Please follow links and conduct other investigations from the project's source for actual imagery. Developers and project owners wishing us to use original imagery please Contact Us and we will do so.
Frequently Asked Questions - Infrastructure
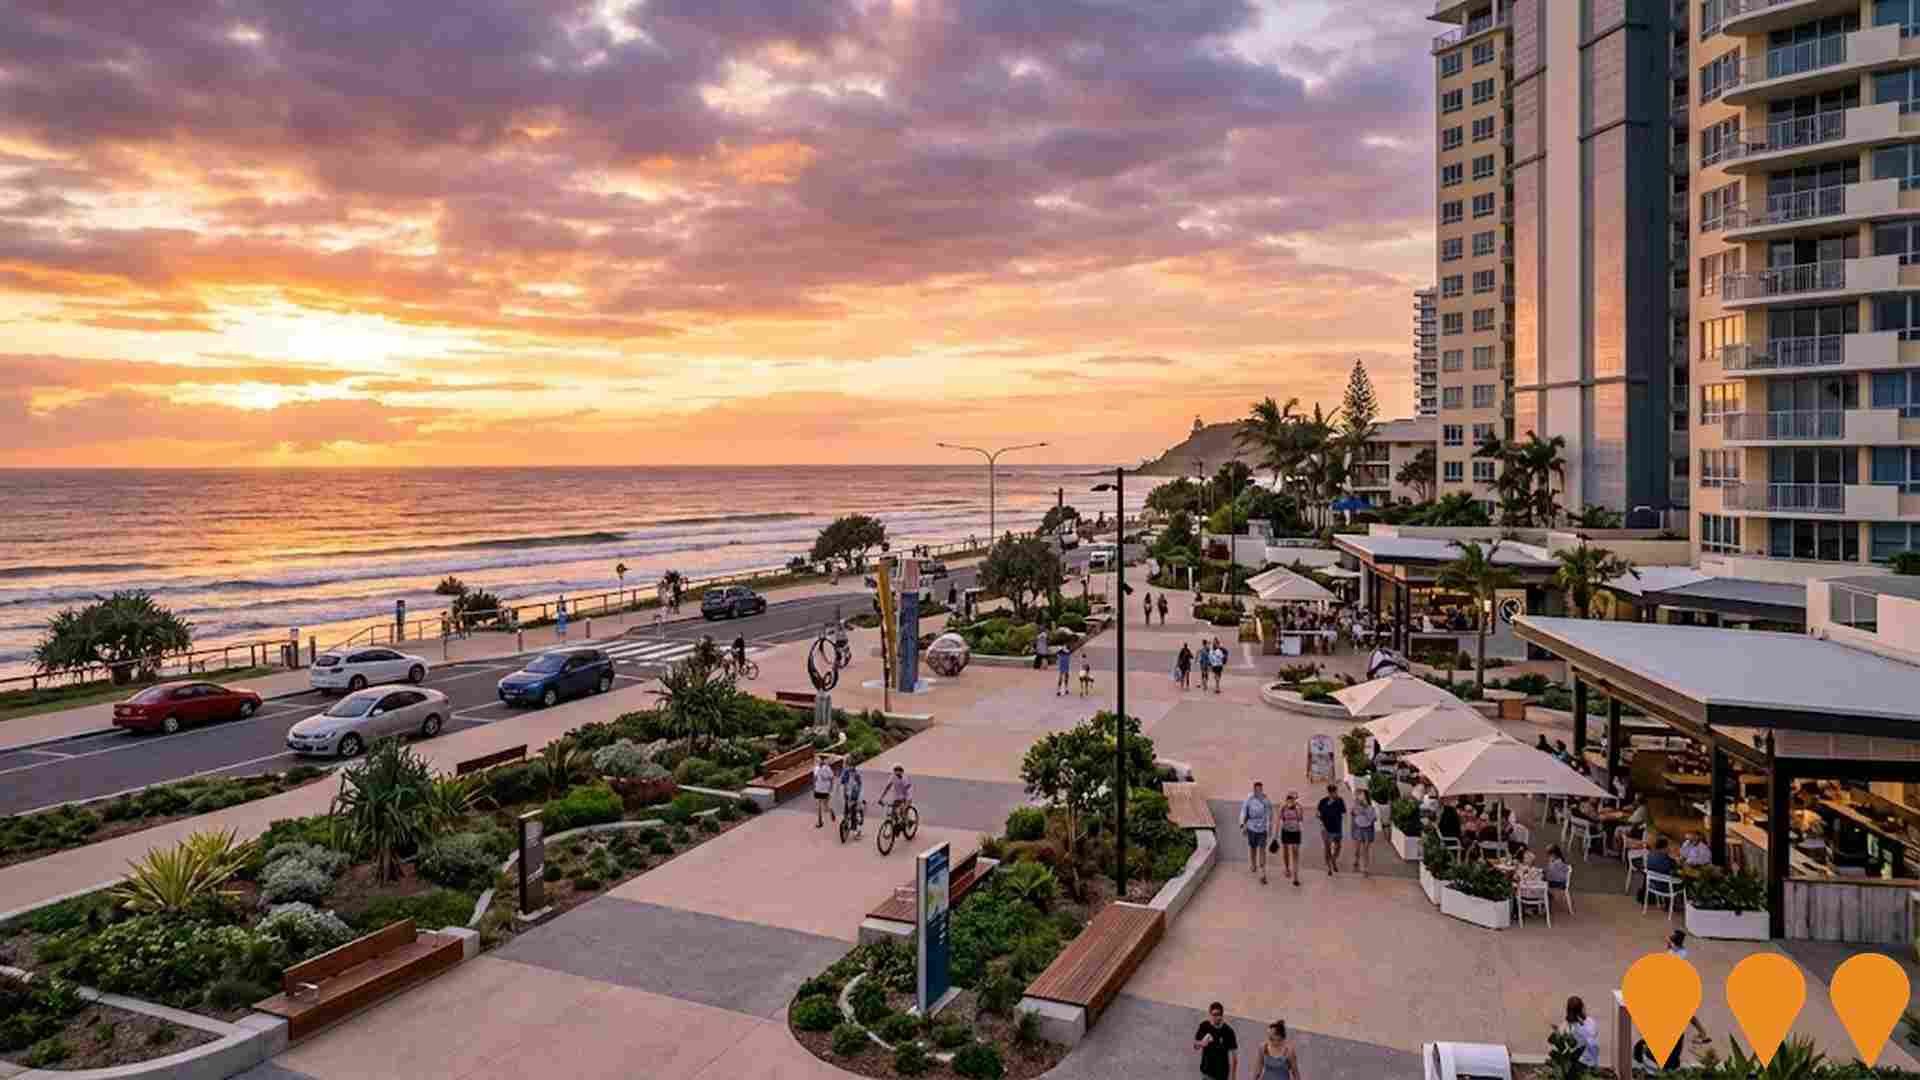
Coolangatta Beachfront Redevelopment
Comprehensive redevelopment of Coolangatta beachfront precinct including new public spaces, pedestrian walkways, commercial facilities and improved beach access. Designed to enhance tourism amenities and local community facilities.
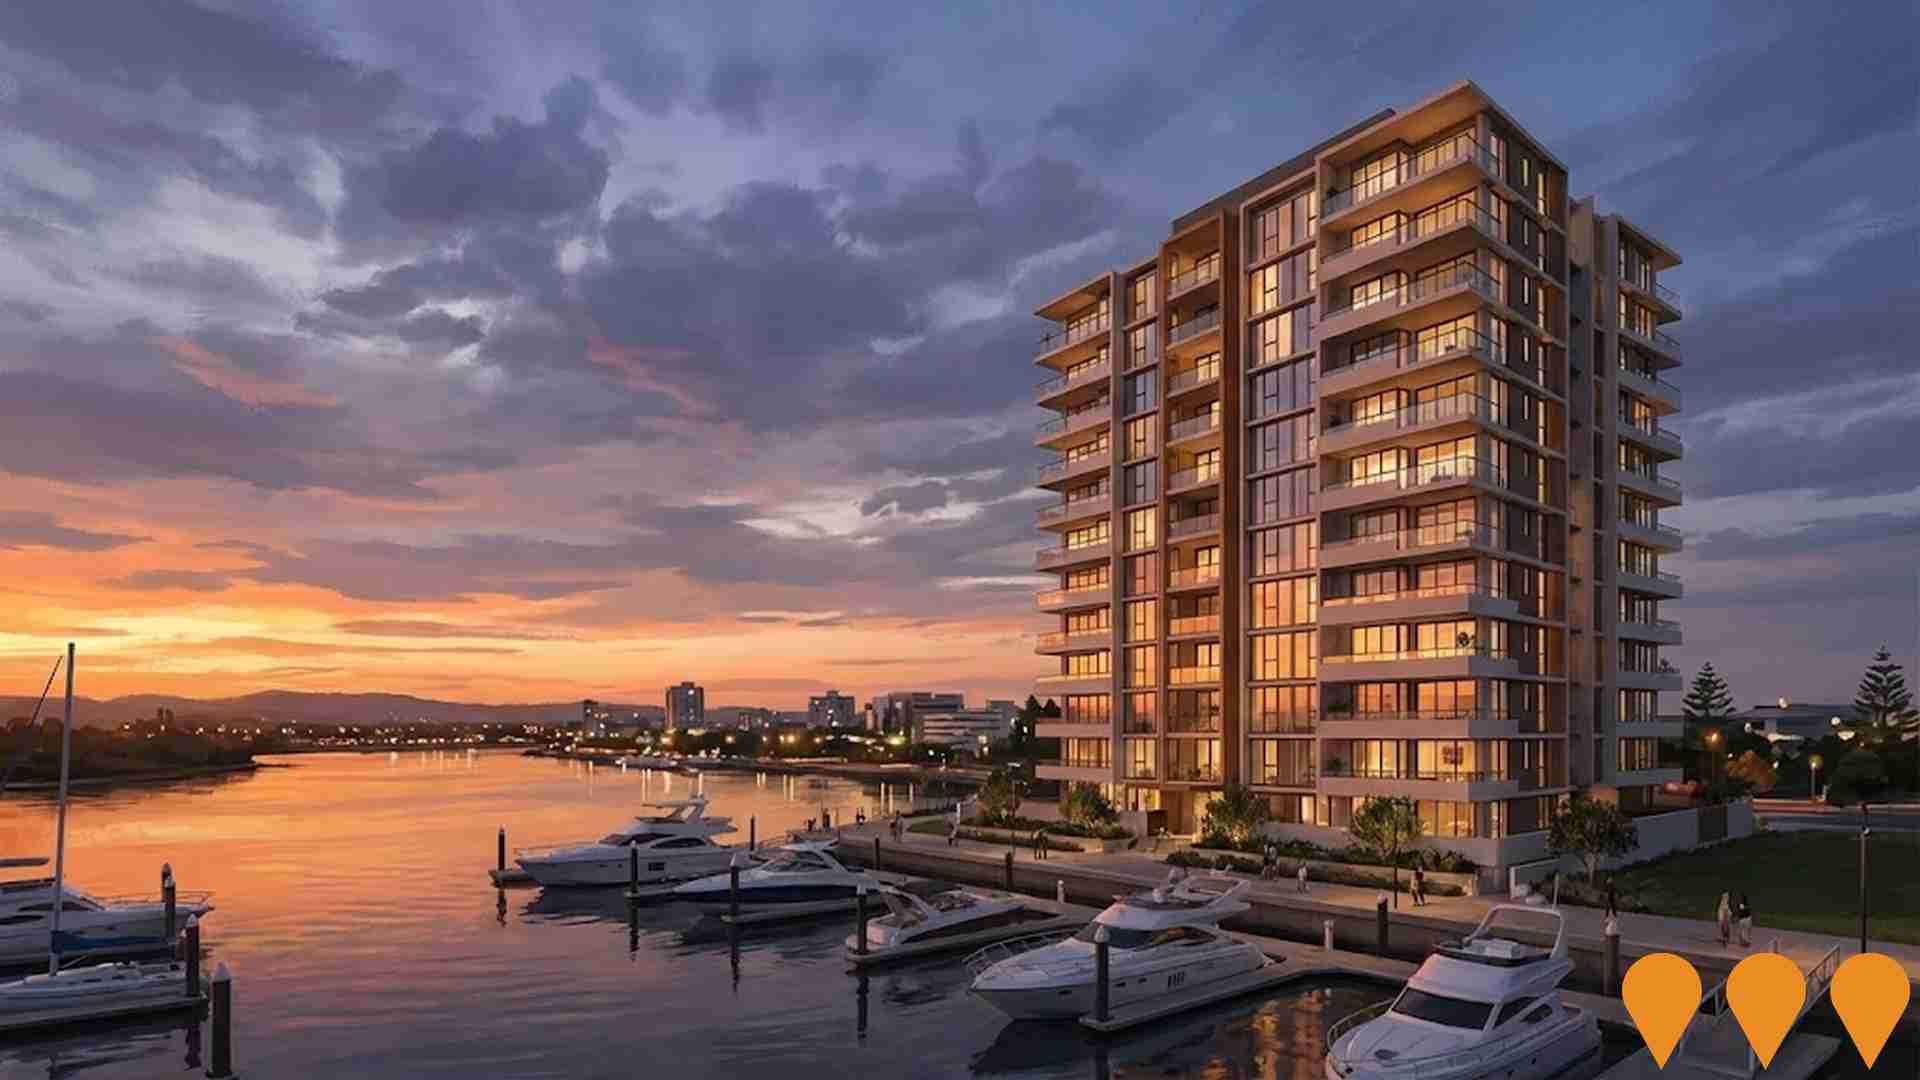
River Terrace Mixed-Use Development
A 14-storey apartment tower with 72 apartments plus ground-floor retail and basement parking with 93 car spaces. The development features 1, 2 and 3-bedroom apartments with river and city views, rooftop facilities, and commercial spaces. Located in the heart of Tweed Heads with direct access to the Tweed River and CBD amenities.
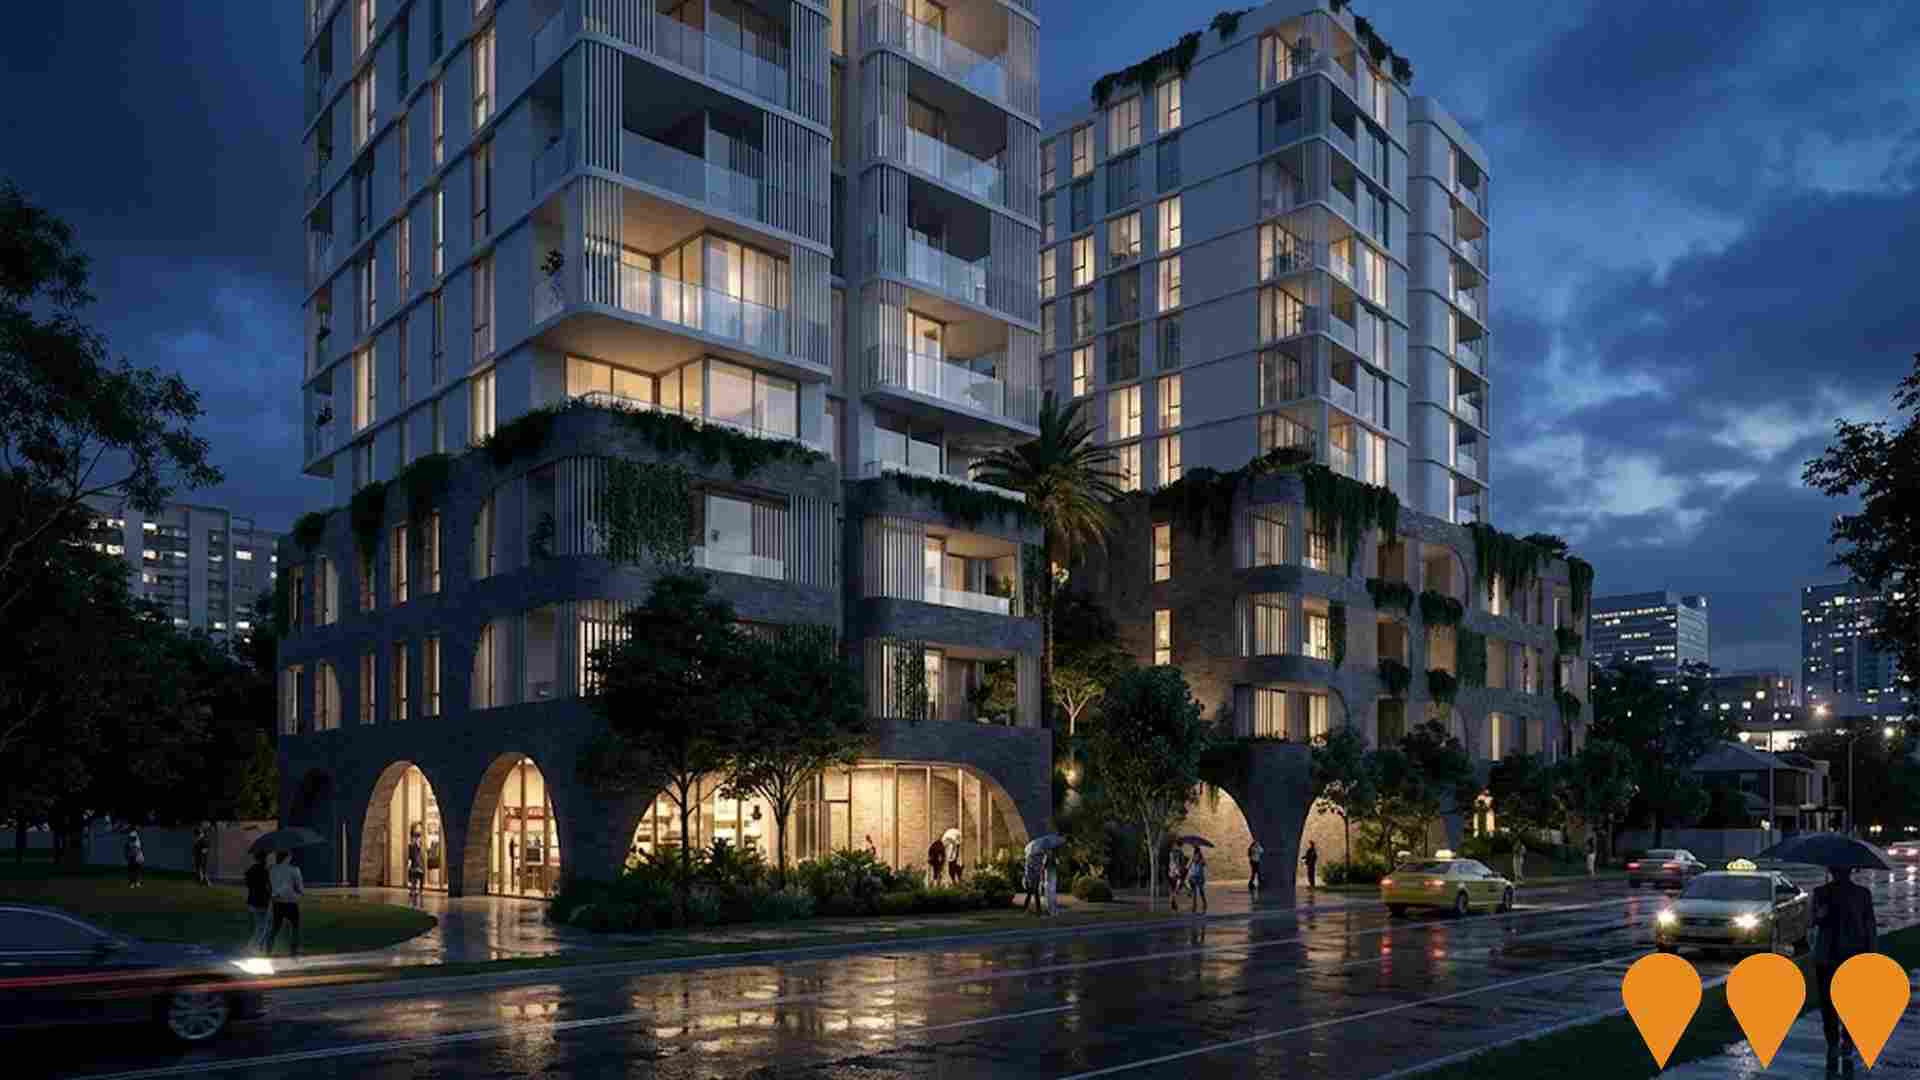
Enid Street Residential Towers
Twin tower development with 122 apartments across two 14-storey buildings, featuring 1-4 bedroom units, communal facilities and underground parking.
Tweed Heads Road Infrastructure Upgrades
Comprehensive road infrastructure upgrades including intersection improvements, cycling paths and pedestrian facilities throughout Tweed Heads.

Tweed Heads Social Housing Development
New social housing development providing 120 affordable dwellings for low-income families and seniors in the Tweed Heads area.
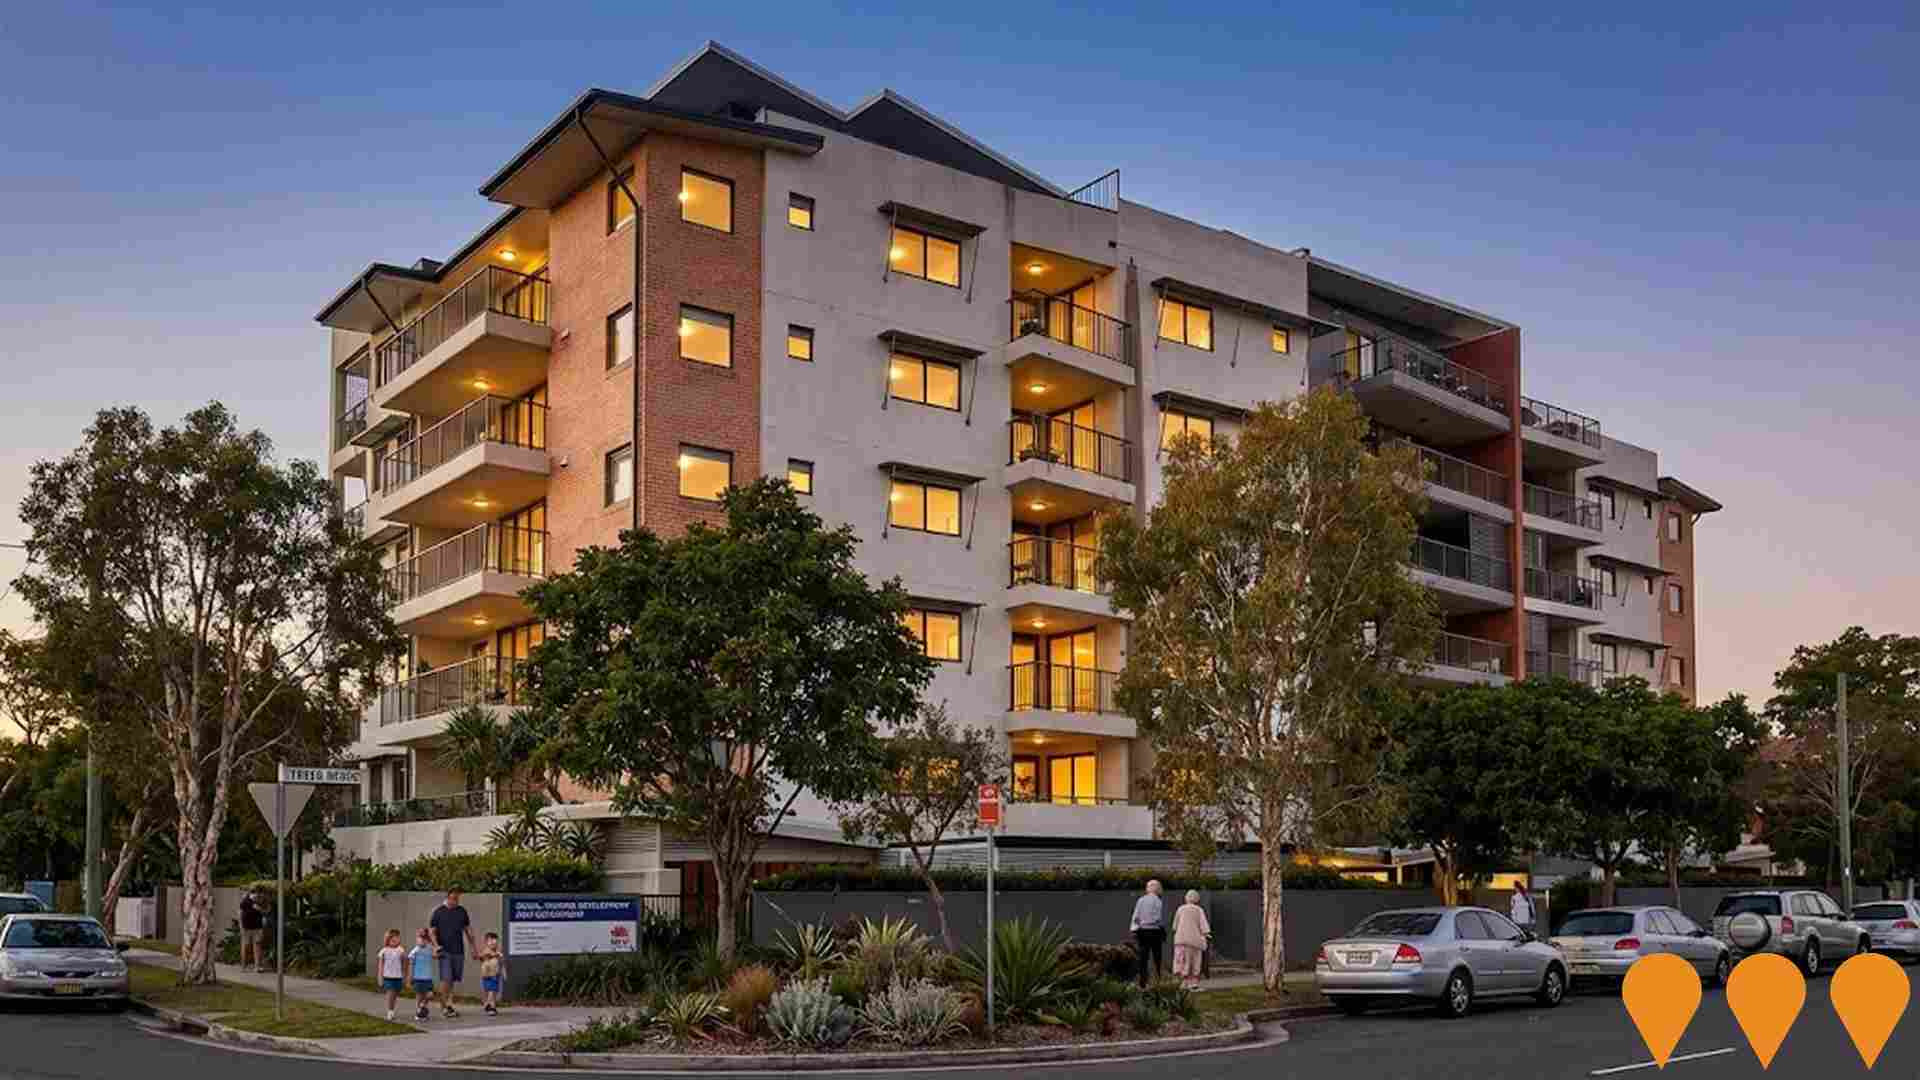
Coolangatta Beachside Resort
Luxury beachside resort development featuring hotel accommodation, restaurants, spa facilities, and conference spaces. Prime beachfront location with direct beach access and panoramic ocean views.

Reflections Tower Two
Second tower in the Reflections development featuring 134 residential apartments with modern amenities, ocean views, and resort-style facilities including pool, gym, and entertainment areas.

Pipis Bilinga
Luxury beachfront apartment development with 17 half-floor three-bedroom apartments and 2 four-bedroom penthouses. 11-storey building at 303 Golden Four Drive, Bilinga. Completion expected Q1 2025.

Employment
AreaSearch analysis indicates Coolangatta maintains employment conditions that align with national benchmarks
Coolangatta has a well-educated workforce with essential services sectors well represented. The unemployment rate was 3.5% as of September 2025.
Employment growth over the past year was estimated at 2.6%. There were 3,852 residents in work by September 2025, with an unemployment rate of 0.5% below Rest of Qld's rate of 4.1%. Workforce participation was somewhat below standard at 55.1%, compared to Rest of Qld's 59.1%. Employment among residents is concentrated in health care & social assistance, accommodation & food, and construction.
The area shows particularly strong specialization in accommodation & food with an employment share of 1.5 times the regional level. Meanwhile, agriculture, forestry & fishing has limited presence at 0.8% compared to the regional level of 4.5%. Many residents commute elsewhere for work based on Census data. During the year to September 2025, employment levels increased by 2.6% and labour force increased by 2.4%, causing the unemployment rate to fall by 0.2 percentage points. In comparison, Rest of Qld recorded employment growth of 1.7%, labour force growth of 2.1%, with unemployment rising by 0.3 percentage points. State-level data to 25-Nov shows QLD employment contracted by 0.01% (losing 1,210 jobs), with the state unemployment rate at 4.2%, broadly in line with the national rate of 4.3%. National employment forecasts from May-25 suggest national employment should expand by 6.6% over five years and 13.7% over ten years. Applying these projections to Coolangatta's employment mix suggests local employment should increase by 6.9% over five years and 14.1% over ten years, assuming constant population growth for illustrative purposes.
Frequently Asked Questions - Employment
Income
Income figures position the area below 75% of locations analysed nationally by AreaSearch
According to AreaSearch's aggregation of latest postcode level ATO data released for financial year ending June 2022, Coolangatta SA2 had a median income among taxpayers of $46,449. The average income stood at $67,326. This was slightly above the national average and compared to levels of $50,780 and $64,844 across Rest of Qld respectively. Based on Wage Price Index growth of 13.99% since financial year ending June 2022, current estimates would be approximately $52,947 (median) and $76,745 (average) as of September 2025. Census data reveals personal income ranks at the 46th percentile ($785 weekly), while household income sits at the 22nd percentile. Looking at income distribution, the $1,500 - 2,999 bracket dominates with 28.9% of residents (2,186 people), mirroring regional levels where 31.7% occupy this bracket. Housing affordability pressures are severe, with only 80.9% of income remaining after housing costs, ranking at the 19th percentile. The area's SEIFA income ranking places it in the 5th decile.
Frequently Asked Questions - Income
Housing
Coolangatta features a more urban dwelling mix with significant apartment living, with above-average rates of outright home ownership
In Coolangatta, as per the latest Census evaluation, 13.1% of dwellings were houses while 86.9% were other types such as semi-detached homes, apartments, and 'other' dwellings. This contrasts with Non-Metro Qld's 49.8% houses and 50.2% other dwellings. The home ownership rate in Coolangatta was higher at 37.7%, with the rest being mortgaged (19.9%) or rented (42.4%). The median monthly mortgage repayment in the area was $1,805, lower than Non-Metro Qld's average of $2,000 and the national figure of $1,863. The median weekly rent in Coolangatta was recorded at $405, compared to Non-Metro Qld's $450 and the national average of $375.
Frequently Asked Questions - Housing
Household Composition
Coolangatta features high concentrations of lone person households and group households, with a lower-than-average median household size
Family households comprise 54.7% of all households, including 12.1% couples with children, 34.0% couples without children, and 7.7% single parent families. Non-family households account for the remaining 45.3%, with lone person households at 37.6% and group households comprising 7.6%. The median household size is 1.9 people, which is smaller than the Rest of Qld average of 2.4.
Frequently Asked Questions - Households
Local Schools & Education
Educational attainment in Coolangatta aligns closely with national averages, showing typical qualification patterns and performance metrics
The area's educational profile is notable regionally, with university qualification rates at 28.7% of residents aged 15+, surpassing the Rest of Qld average of 20.6% and the SA4 region rate of 25.4%. Bachelor degrees are the most common at 21.0%, followed by postgraduate qualifications (5.3%) and graduate diplomas (2.4%). Vocational credentials are prevalent, with 36.9% of residents aged 15+ holding such qualifications - advanced diplomas account for 12.3% and certificates for 24.6%.
A significant 23.0% of the population is actively engaged in formal education, including 7.4% in tertiary education, 4.7% in primary education, and 3.8% pursuing secondary education.
Frequently Asked Questions - Education
Schools Detail
Nearby Services & Amenities
Transport
Transport servicing is moderate compared to other areas nationally based on assessment of service frequency, route connectivity and accessibility
Transport analysis indicates 24 active transport stops in Coolangatta, operated by buses. These stops are served by 11 routes, offering 1,375 weekly passenger trips. Transport accessibility is rated good, with residents typically located 265 meters from the nearest stop.
Service frequency averages 196 trips per day across all routes, equating to approximately 57 weekly trips per stop.
Frequently Asked Questions - Transport
Transport Stops Detail
Health
Health performance in Coolangatta is lower than average with common health conditions somewhat prevalent across both younger and older age cohorts
Coolangatta faces significant health challenges with common health conditions prevalent across both younger and older age cohorts.
The rate of private health cover is approximately 53%, covering around 4,040 people. Arthritis and mental health issues are the most common medical conditions, affecting 9.5% and 8.4% of residents respectively. About 66.0% of residents report being completely clear of medical ailments compared to 70.3% in the rest of Queensland. The area has 24.8% of residents aged 65 and over, totaling 1,877 people, which is higher than the 19.2% in the rest of Queensland. Health outcomes among seniors are above average, performing better than the general population in health metrics.
Frequently Asked Questions - Health
Cultural Diversity
In terms of cultural diversity, Coolangatta records figures broadly comparable to the national average, as found in AreaSearch's assessment of a number of language and cultural background related metrics
Coolangatta's cultural diversity was found to be roughly in line with the wider region, with 82.5% of its population being citizens, 77.4% born in Australia, and 90.7% speaking English only at home. Christianity was the main religion in Coolangatta, comprising 49.5% of people. However, Judaism showed overrepresentation, making up 0.2% compared to the region's 0.1%.
The top three ancestry groups were English (31.7%), Australian (23.8%), and Irish (10.6%). Notably, Spanish (0.9%) and French (0.9%) groups were overrepresented in Coolangatta compared to regional averages of 0.4% and 0.6%, respectively. Scottish ancestry was also slightly higher at 9.2%.
Frequently Asked Questions - Diversity
Age
Coolangatta ranks among the oldest 10% of areas nationwide
Coolangatta has a median age of 48, which is higher than the Rest of Qld figure of 41 and significantly higher than the national norm of 38. The 25-34 age group makes up 20.6% of Coolangatta's population, compared to Rest of Qld, while the 5-14 cohort is less prevalent at 4.7%. This concentration in the 25-34 age group is well above the national figure of 14.5%. Post-2021 Census data shows a rejuvenation with the median age falling from 50 to 48 years. Specifically, the 25-34 age group grew from 17.1% to 20.6%, and the 35-44 cohort increased from 10.8% to 13.3%. Conversely, the 55-64 cohort declined from 16.0% to 14.0%, and the 45-54 group dropped from 11.3% to 9.5%. By 2041, Coolangatta's age composition is expected to shift notably, with the 25-34 age cohort projected to grow by 601 people (39%) from 1,560 to 2,162.

