Chart Color Schemes
This analysis uses ABS Statistical Areas Level 2 (SA2) boundaries, which can materially differ from Suburbs and Localities (SAL) even when sharing similar names.
SA2 boundaries are defined by the Australian Bureau of Statistics and are designed to represent communities for statistical reporting (e.g., census and ERP).
Suburbs and Localities (SAL) represent commonly-used suburb/locality names (postal-style areas) and may use different geographic boundaries. For comprehensive analysis, consider reviewing both boundary types if available.
est. as @ -- *
ABS ERP | -- people | --
2021 Census | -- people
Sales Activity
Curious about local property values? Filter the chart to assess the volume and appreciation (including resales) trends and regional comparisons, or scroll to the map below view this information at an individual property level.
Find a Recent Sale
Sales Detail
Population
Population growth drivers in Bentley Park are slightly above average based on AreaSearch's ranking of recent, and medium term trends
Bentley Park's population was approximately 9,301 as of November 2025. This figure represents an increase of 941 people from the 2021 Census count of 8,360. The growth is inferred from ABS data showing an estimated resident population of 9,142 in June 2024 and the addition of 216 new addresses since the Census date. Bentley Park's population density was thus around 1,355 persons per square kilometer, higher than the average seen across national locations assessed by AreaSearch. The area's growth rate of 11.3% since the 2021 census exceeded both the SA4 region (7.8%) and the SA3 area, making it a growth leader in the region. Natural growth contributed approximately 44.1% to overall population gains during recent periods, with all drivers including interstate migration and overseas migration being positive factors.
AreaSearch uses ABS/Geoscience Australia projections for each SA2 area released in 2024 with a base year of 2022. For areas not covered by this data and years post-2032, Queensland State Government's SA2 area projections from 2023 based on 2021 data are adopted. However, these state projections do not provide age category splits, so AreaSearch applies proportional growth weightings in line with ABS Greater Capital Region projections released in 2023 using 2022 data for each age cohort. Future population dynamics anticipate an above median growth for Australia's non-metropolitan areas, with Bentley Park projected to increase by 1,852 persons to 2041 based on the latest annual ERP population numbers, reflecting a total increase of 18.2% over the 17-year period.
Frequently Asked Questions - Population
Development
AreaSearch assessment of residential development activity positions Bentley Park among the top 25% of areas assessed nationwide
Bentley Park has recorded approximately 76 residential properties granted approval annually over the past five financial years, totalling 383 homes. As of FY-26, 11 approvals have been recorded. On average, 1.9 new residents arrive per year for each new home built between FY-21 and FY-25. The average construction cost value of new dwellings is $287,000, reflecting more affordable housing options compared to regional norms.
In FY-26, $2.0 million in commercial development approvals have been recorded, indicating the area's residential nature. Bentley Park records 148.0% more building activity per person when measured against the Rest of Qld, offering buyers greater choice. New development consists of 98.0% standalone homes and 2.0% townhouses or apartments, preserving the area's suburban nature with an emphasis on detached housing attracting space-seeking buyers. The location has approximately 114 people per dwelling approval, indicating an expanding market.
According to AreaSearch quarterly estimates, Bentley Park is projected to add 1,693 residents by 2041. Based on current development patterns, new housing supply should readily meet demand, offering good conditions for buyers and potentially facilitating population growth beyond current projections.
Frequently Asked Questions - Development
Infrastructure
Bentley Park has very high levels of nearby infrastructure activity, ranking in the top 20% nationally
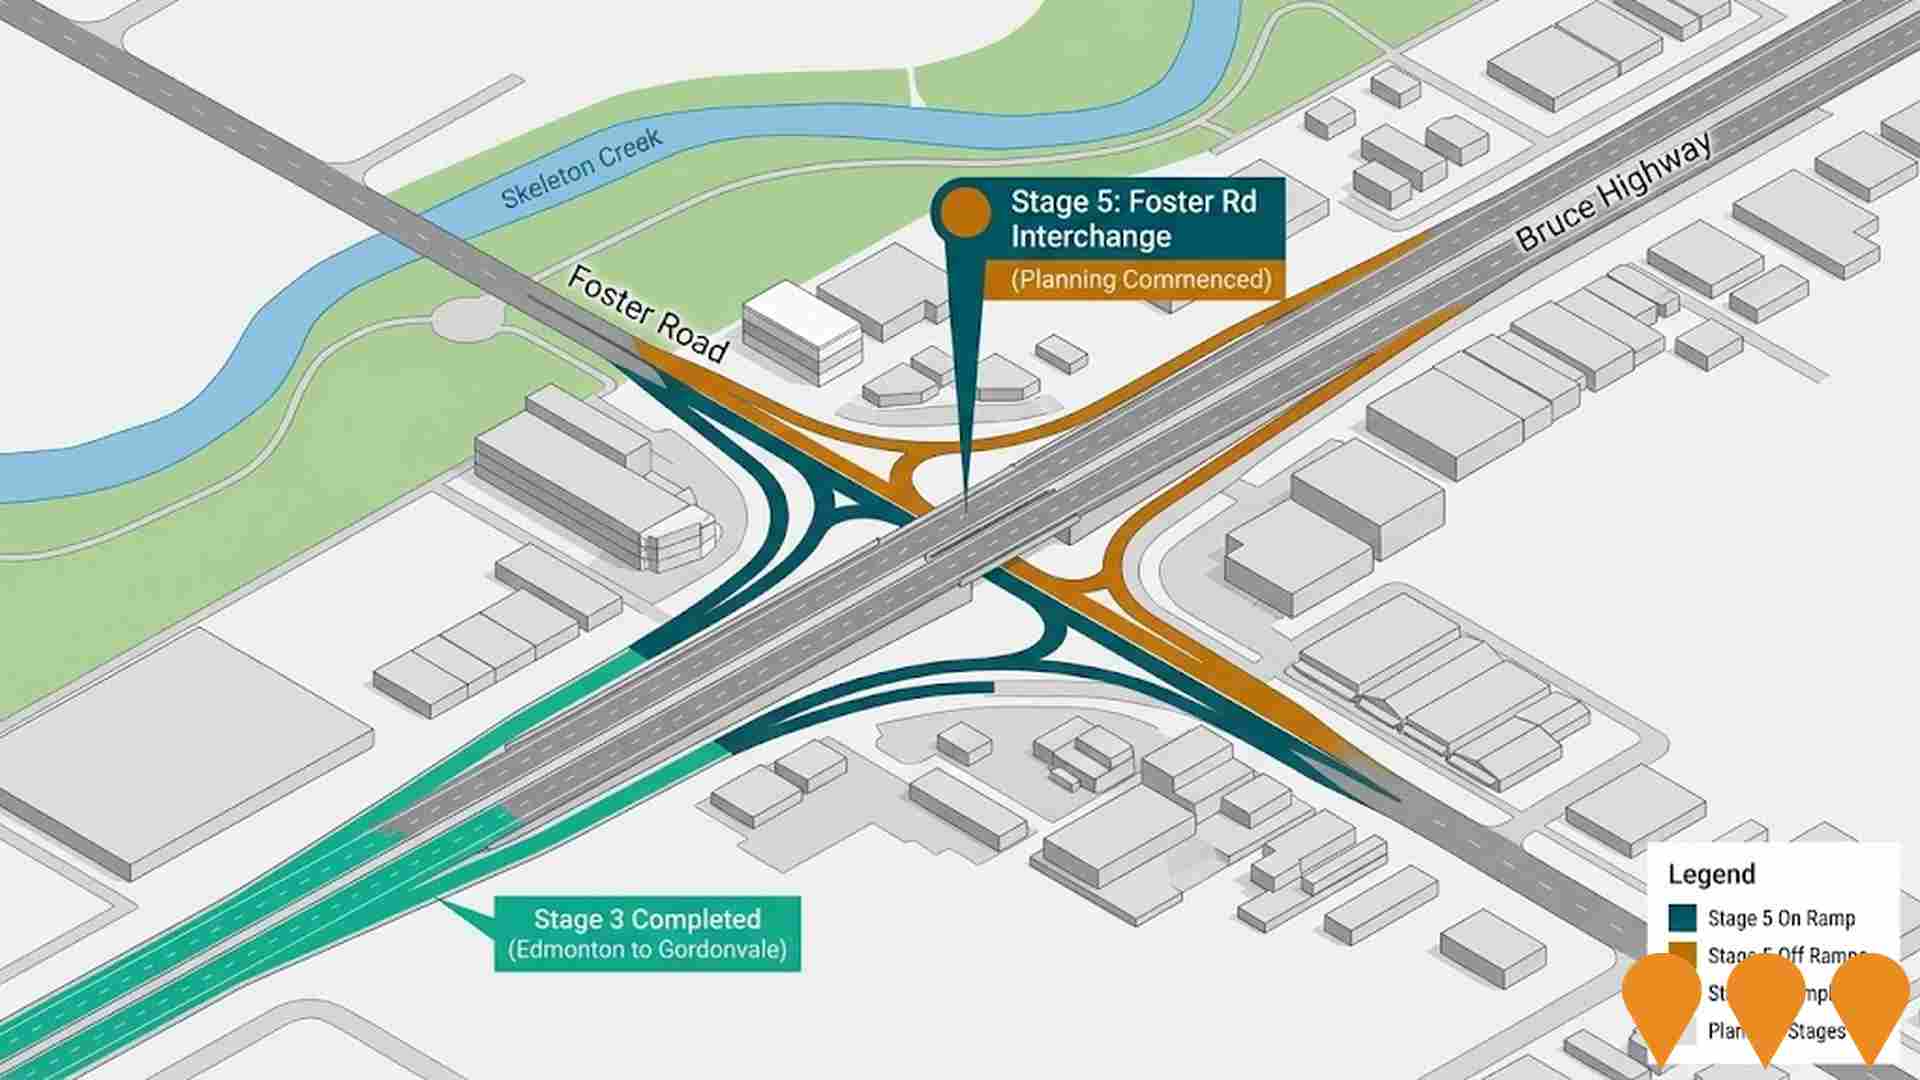
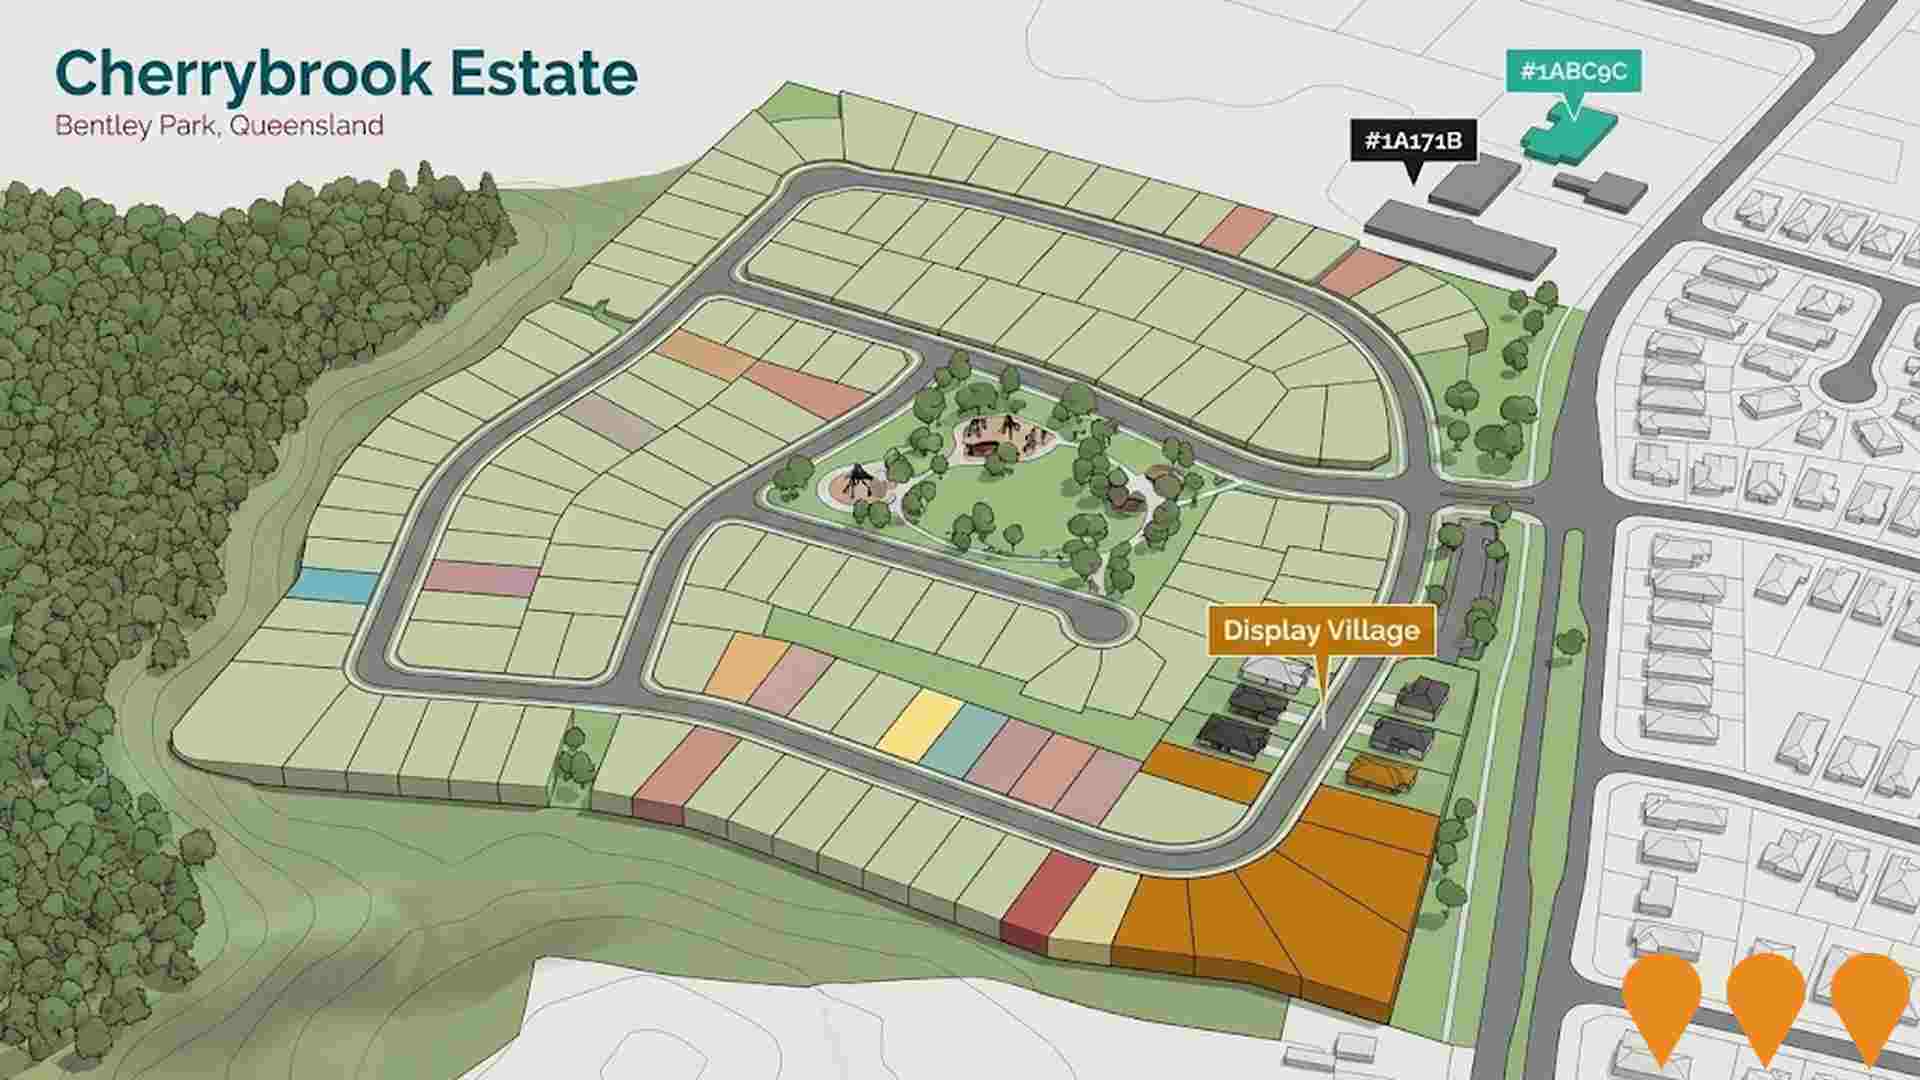
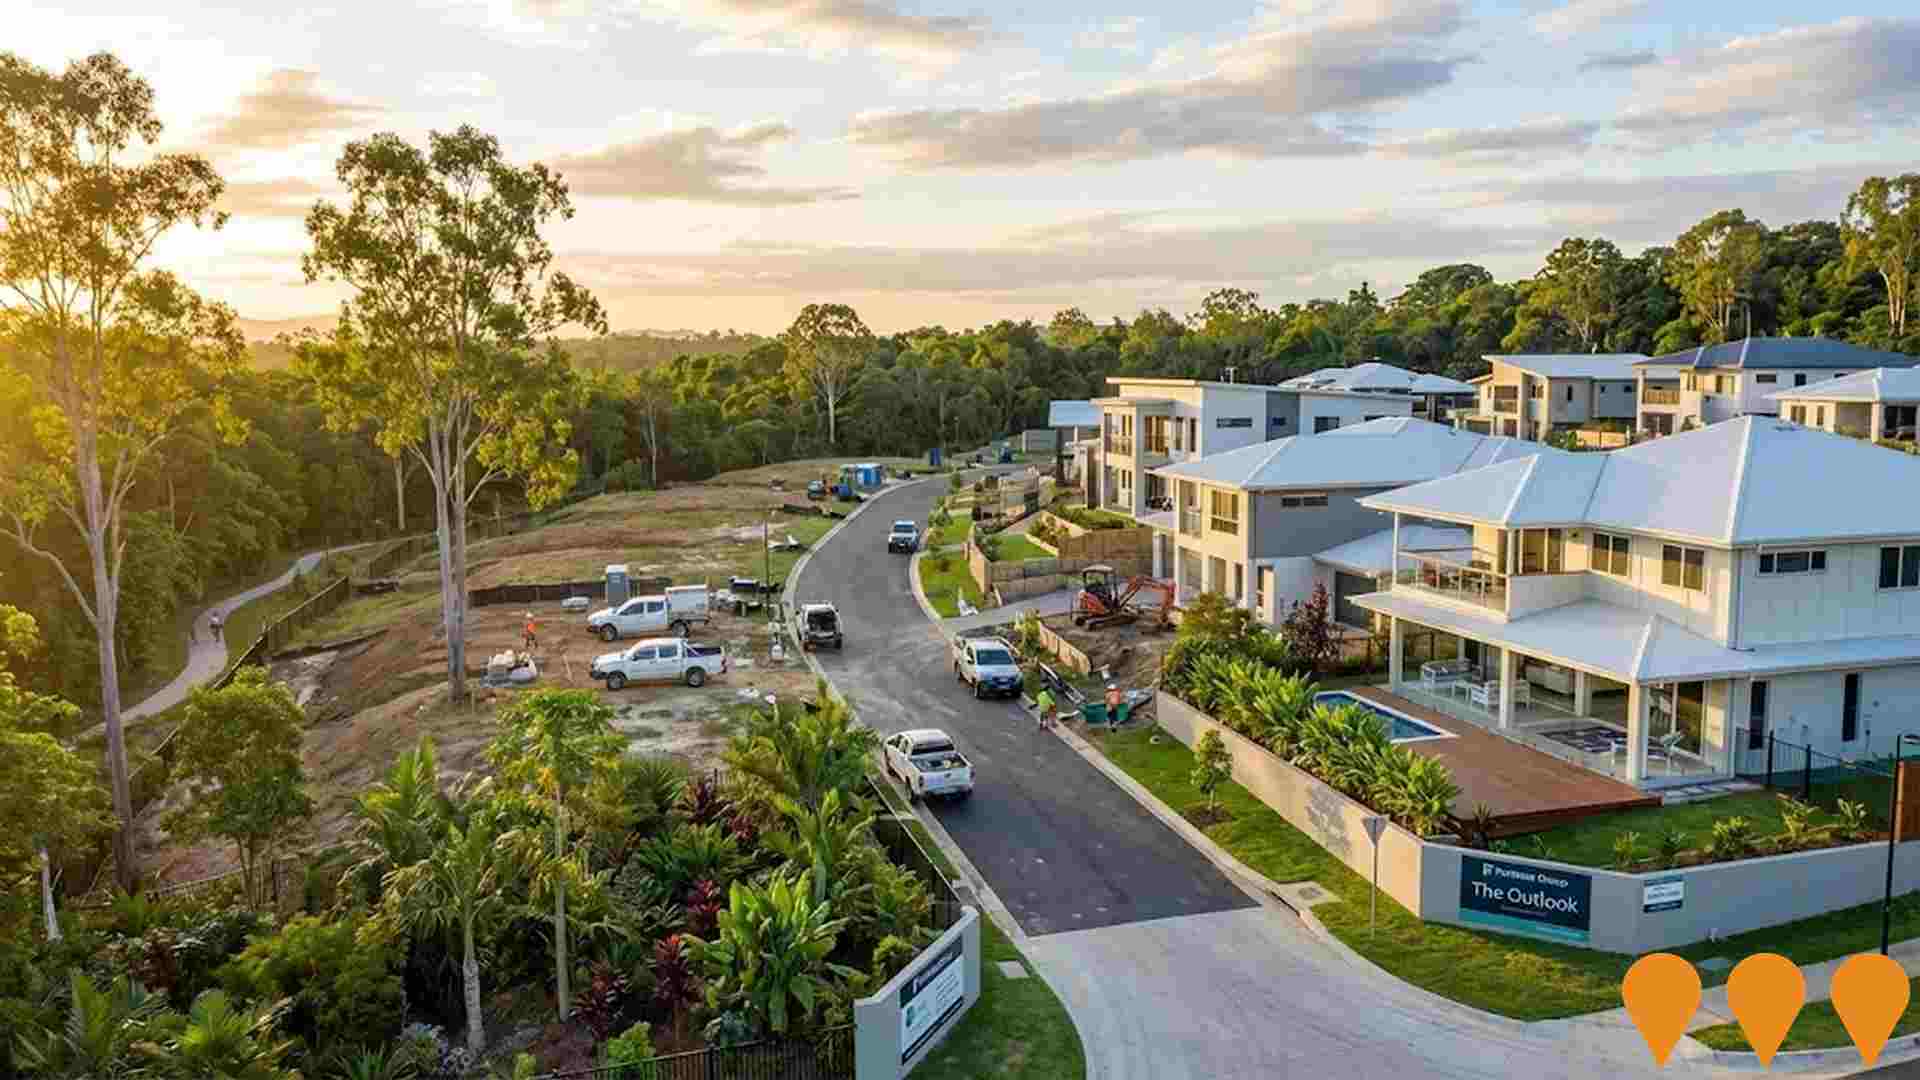
Changes in local infrastructure significantly affect an area's performance. AreaSearch has identified ten projects that could impact the region. Notable ones are Cherrybrook Estate, The Outlook, Sugarworld Estate, and Cairns Water Security Stage 1 (CWSS1) Project. Relevant details about these key initiatives follow.
Professional plan users can use the search below to filter and access additional projects.
INFRASTRUCTURE SEARCH
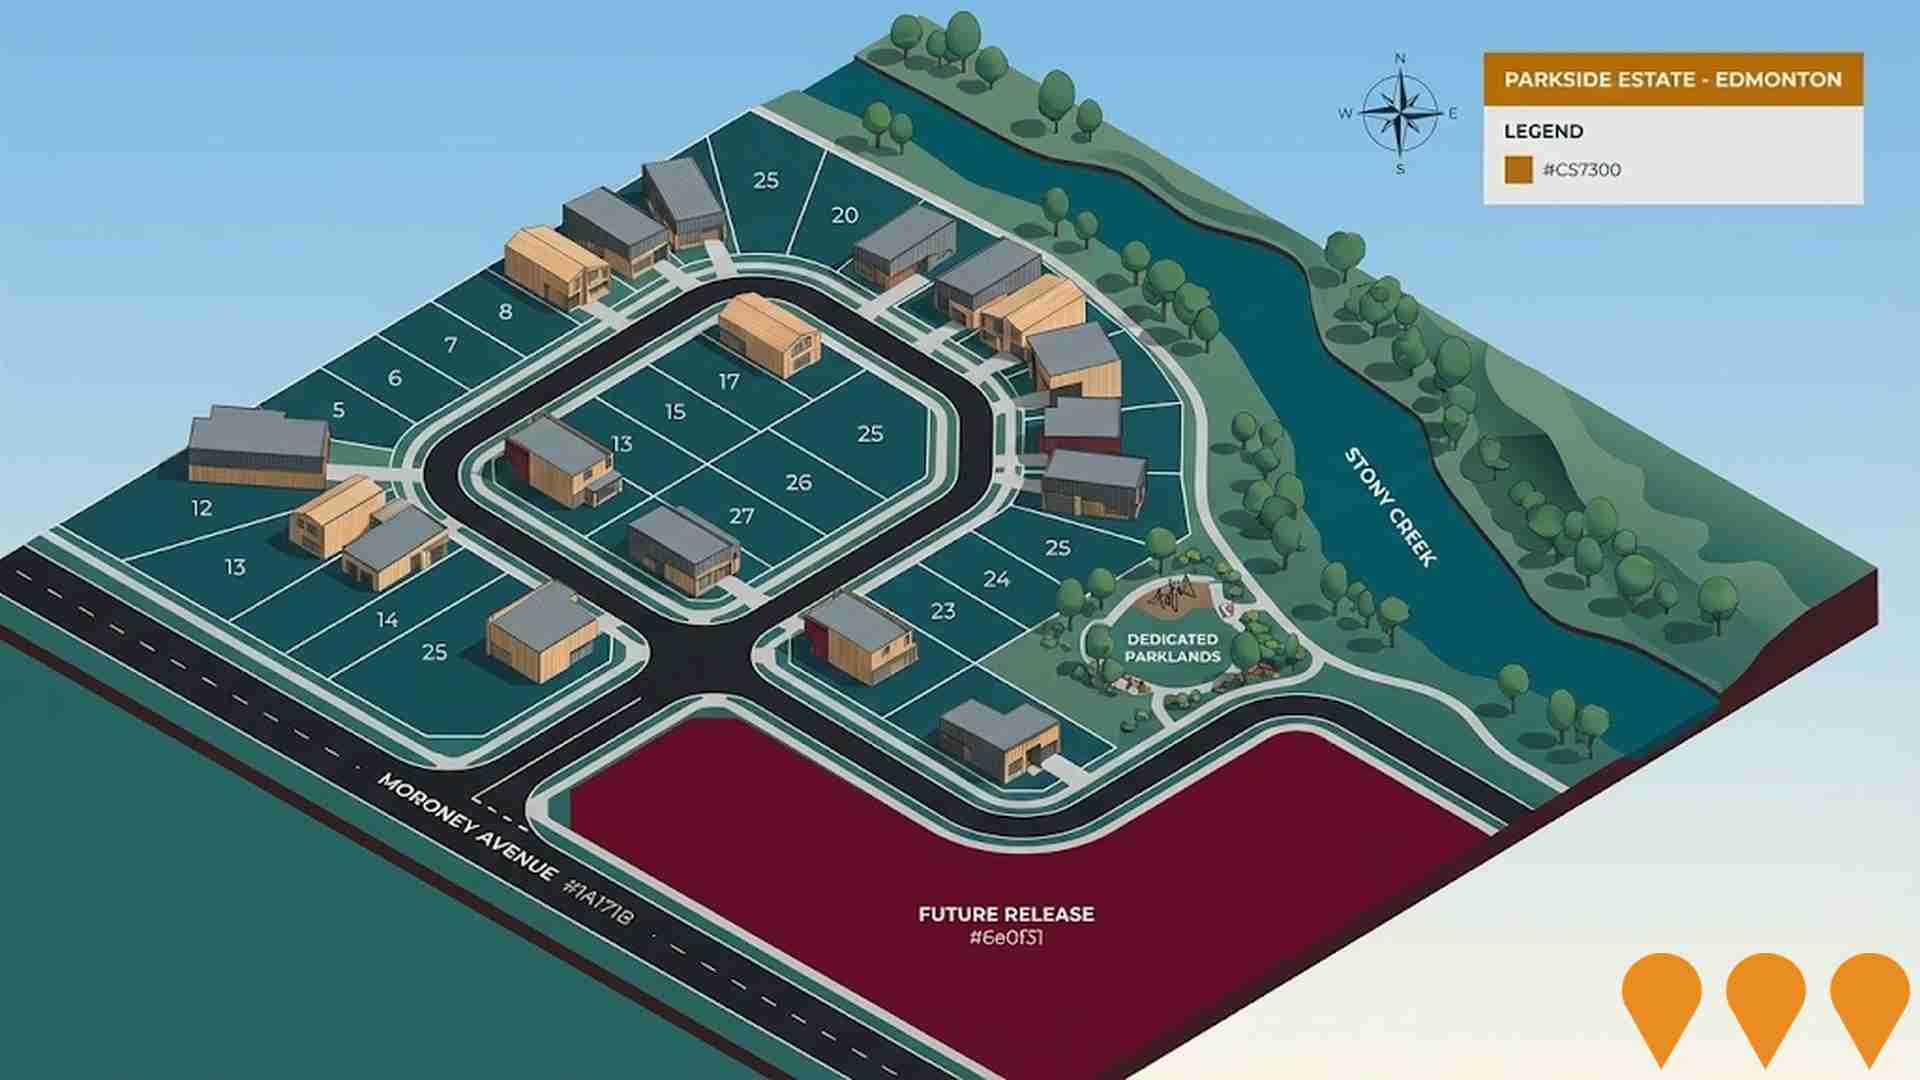
 Denotes AI-based impression for illustrative purposes only, not to be taken as definitive under any circumstances. Please follow links and conduct other investigations from the project's source for actual imagery. Developers and project owners wishing us to use original imagery please Contact Us and we will do so.
Frequently Asked Questions - Infrastructure
North Queensland Youth Alcohol and Other Drugs Residential Rehabilitation Service
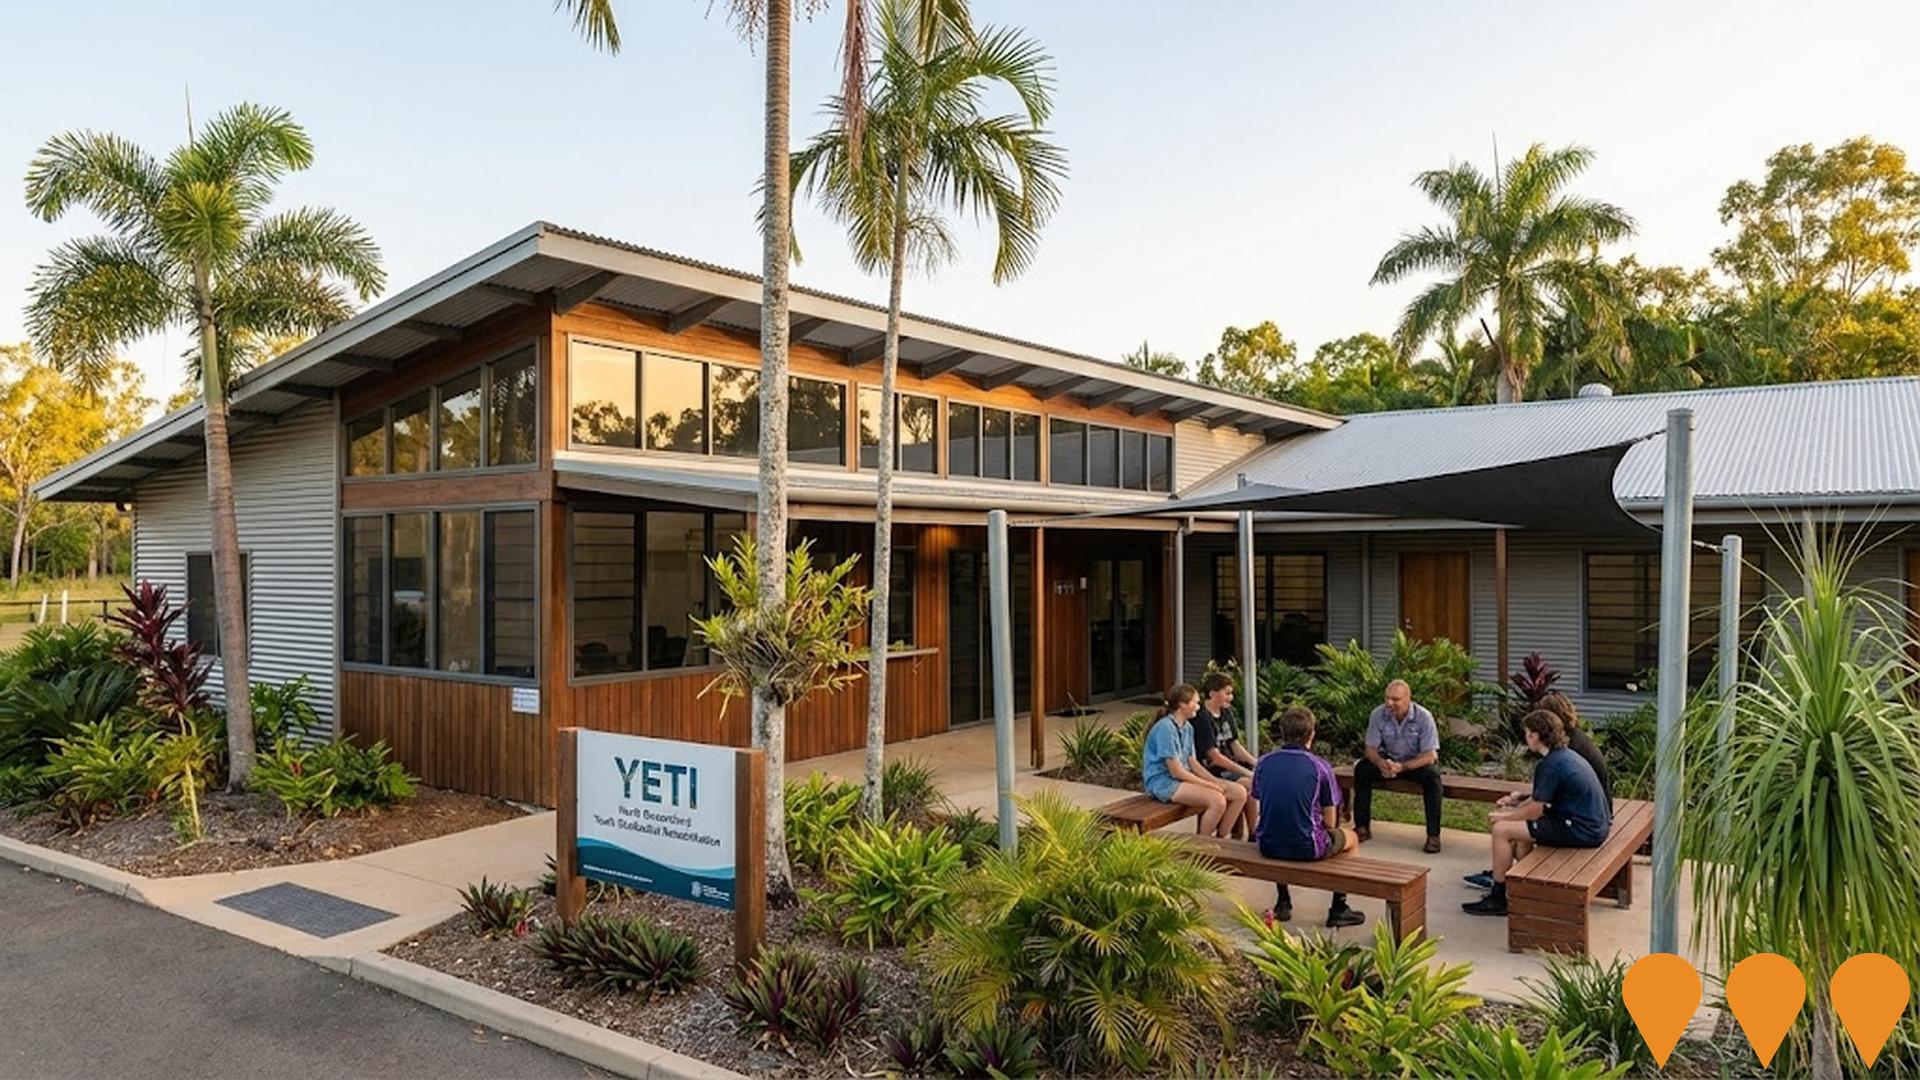
A purpose-built 10-bed residential rehabilitation facility for young people aged 13-18 experiencing alcohol and other drug issues in North Queensland. Provides 24/7 supervised care, cultural programs, education support, and outreach services up to age 25. Delivered by Youth Empowered Towards Independence (YETI) in partnership with YSAS and Gindaja Treatment and Healing Indigenous Corporation.
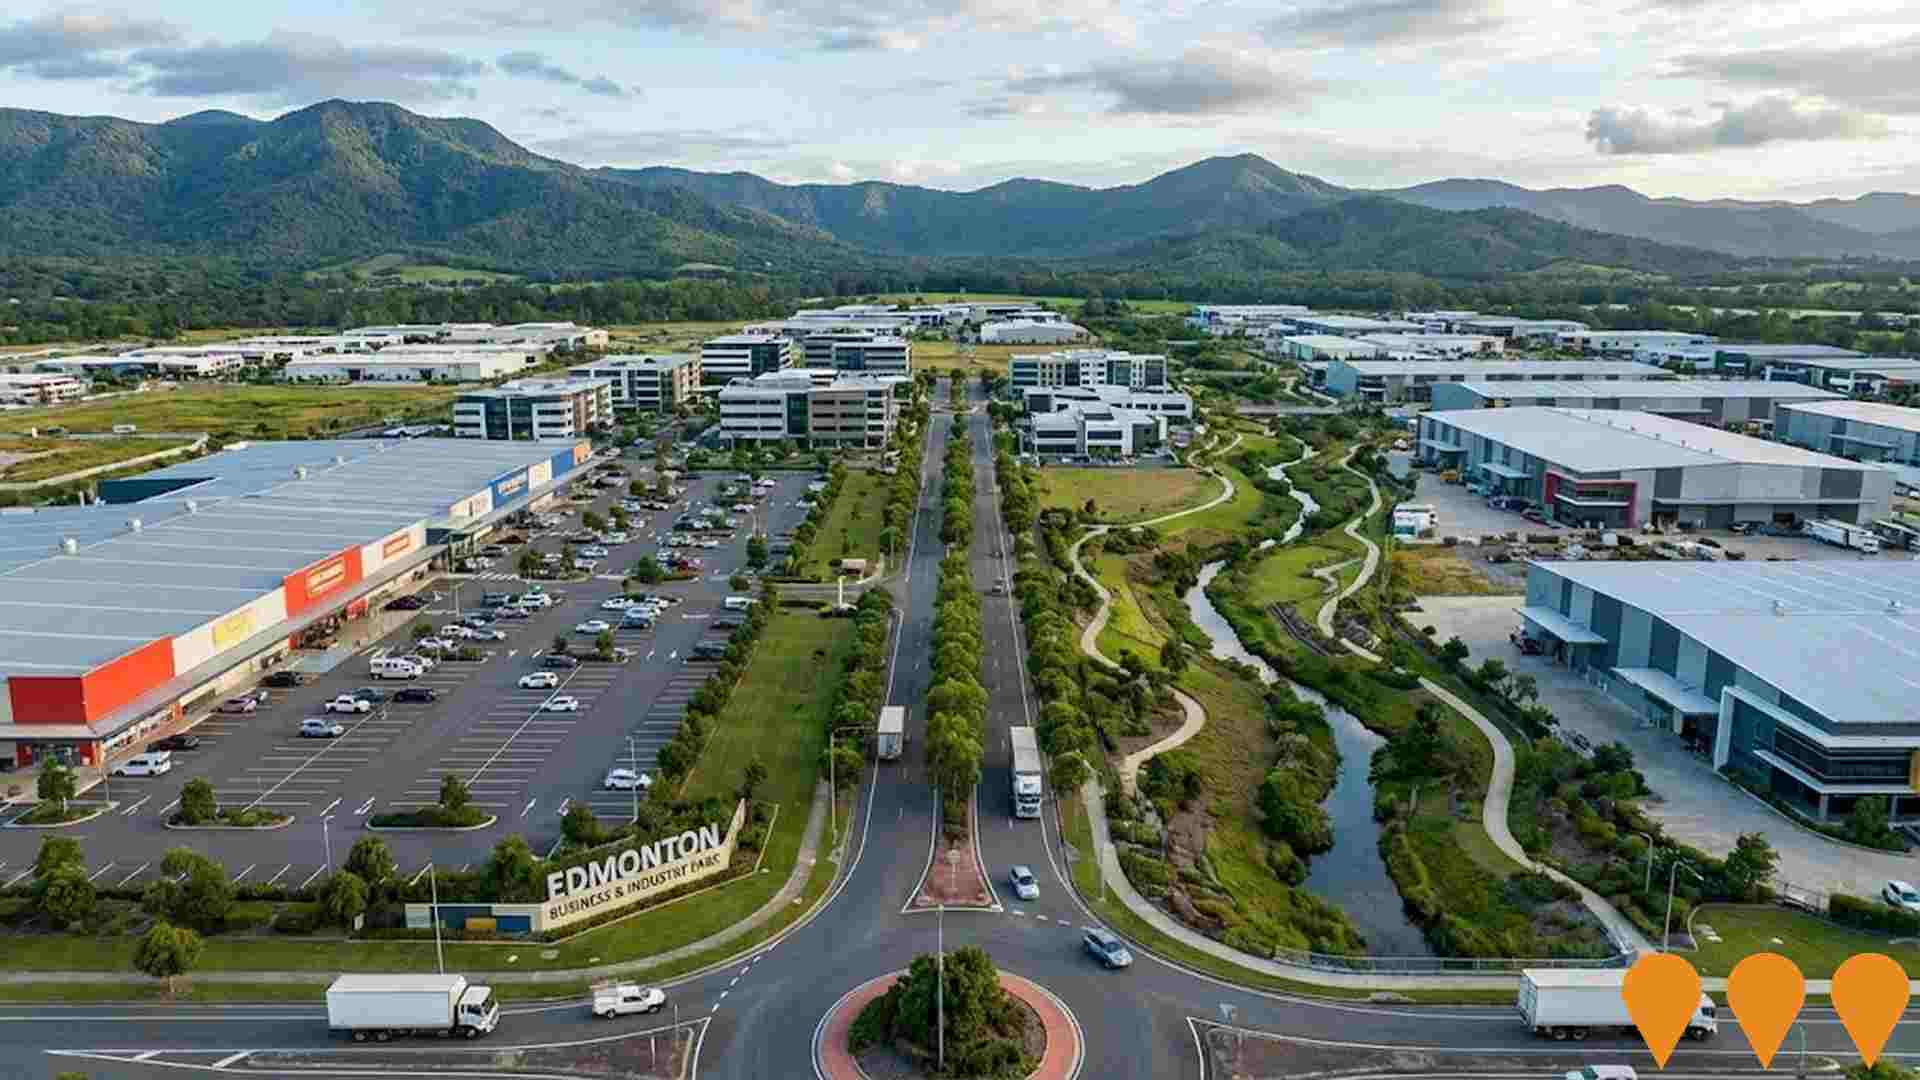
Edmonton Business & Industry Park
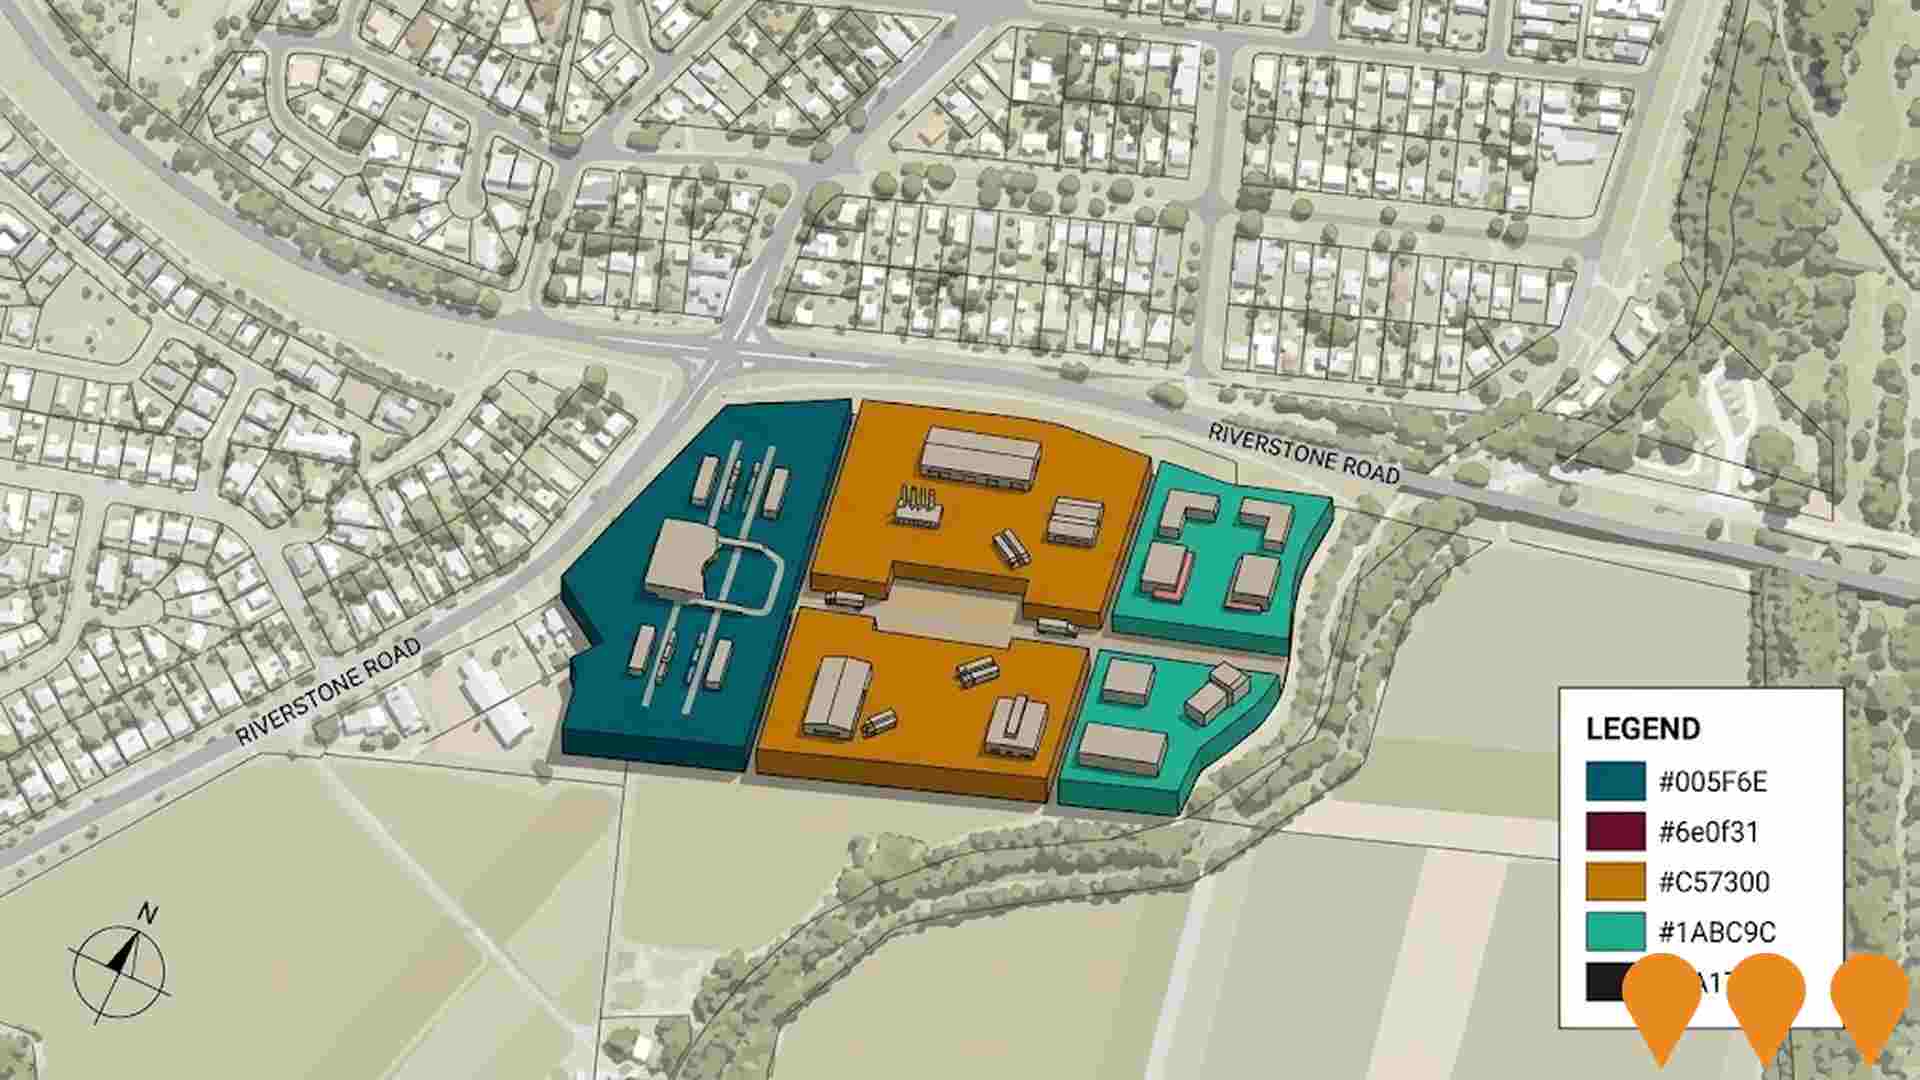
212-hectare masterplanned business and industry park south of Cairns, incorporating industrial, commercial, large-format retail, health/medical and lifestyle precincts. Six-stage development expected to deliver over 4,000 jobs and include major big-box retail, manufacturing, warehousing, private hospital/health facilities and more than 50 hectares of public open space with Blackfellows Creek environmental corridor restoration.
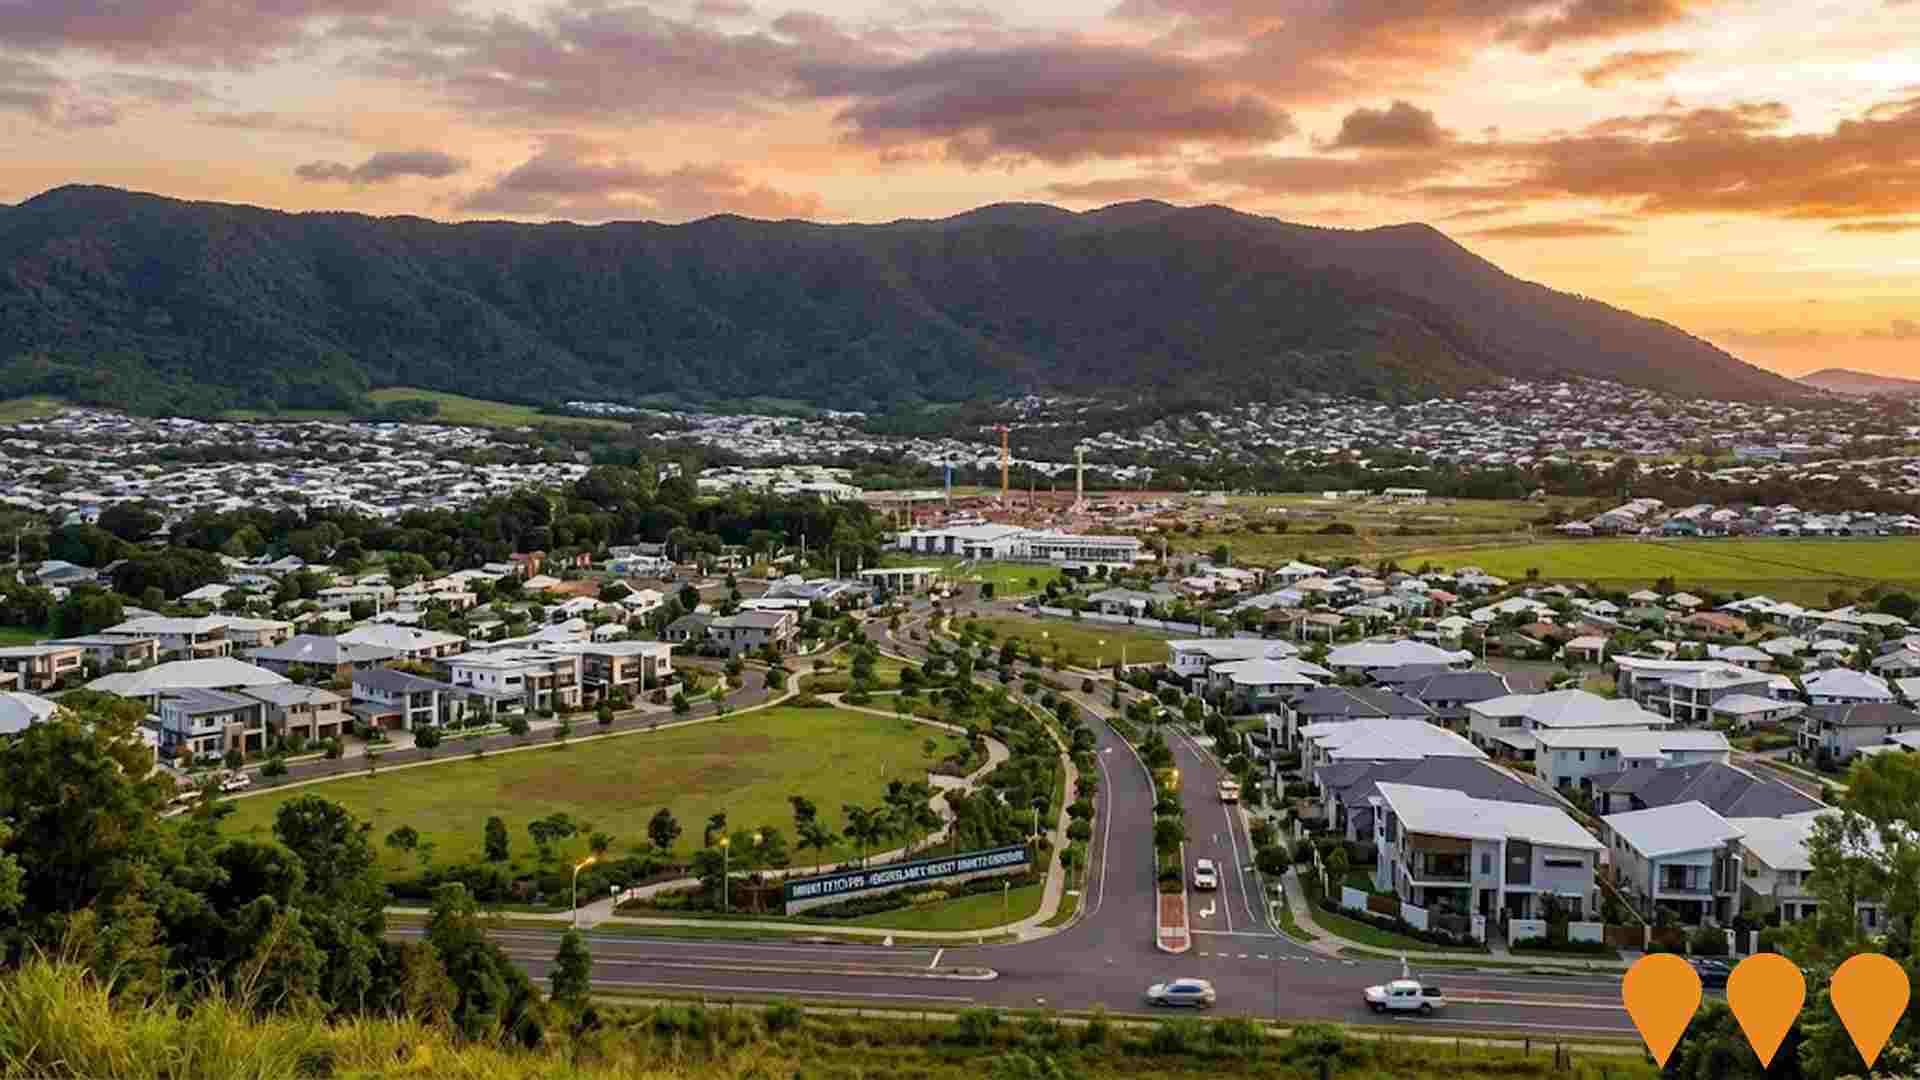
Mount Peter Priority Development Area
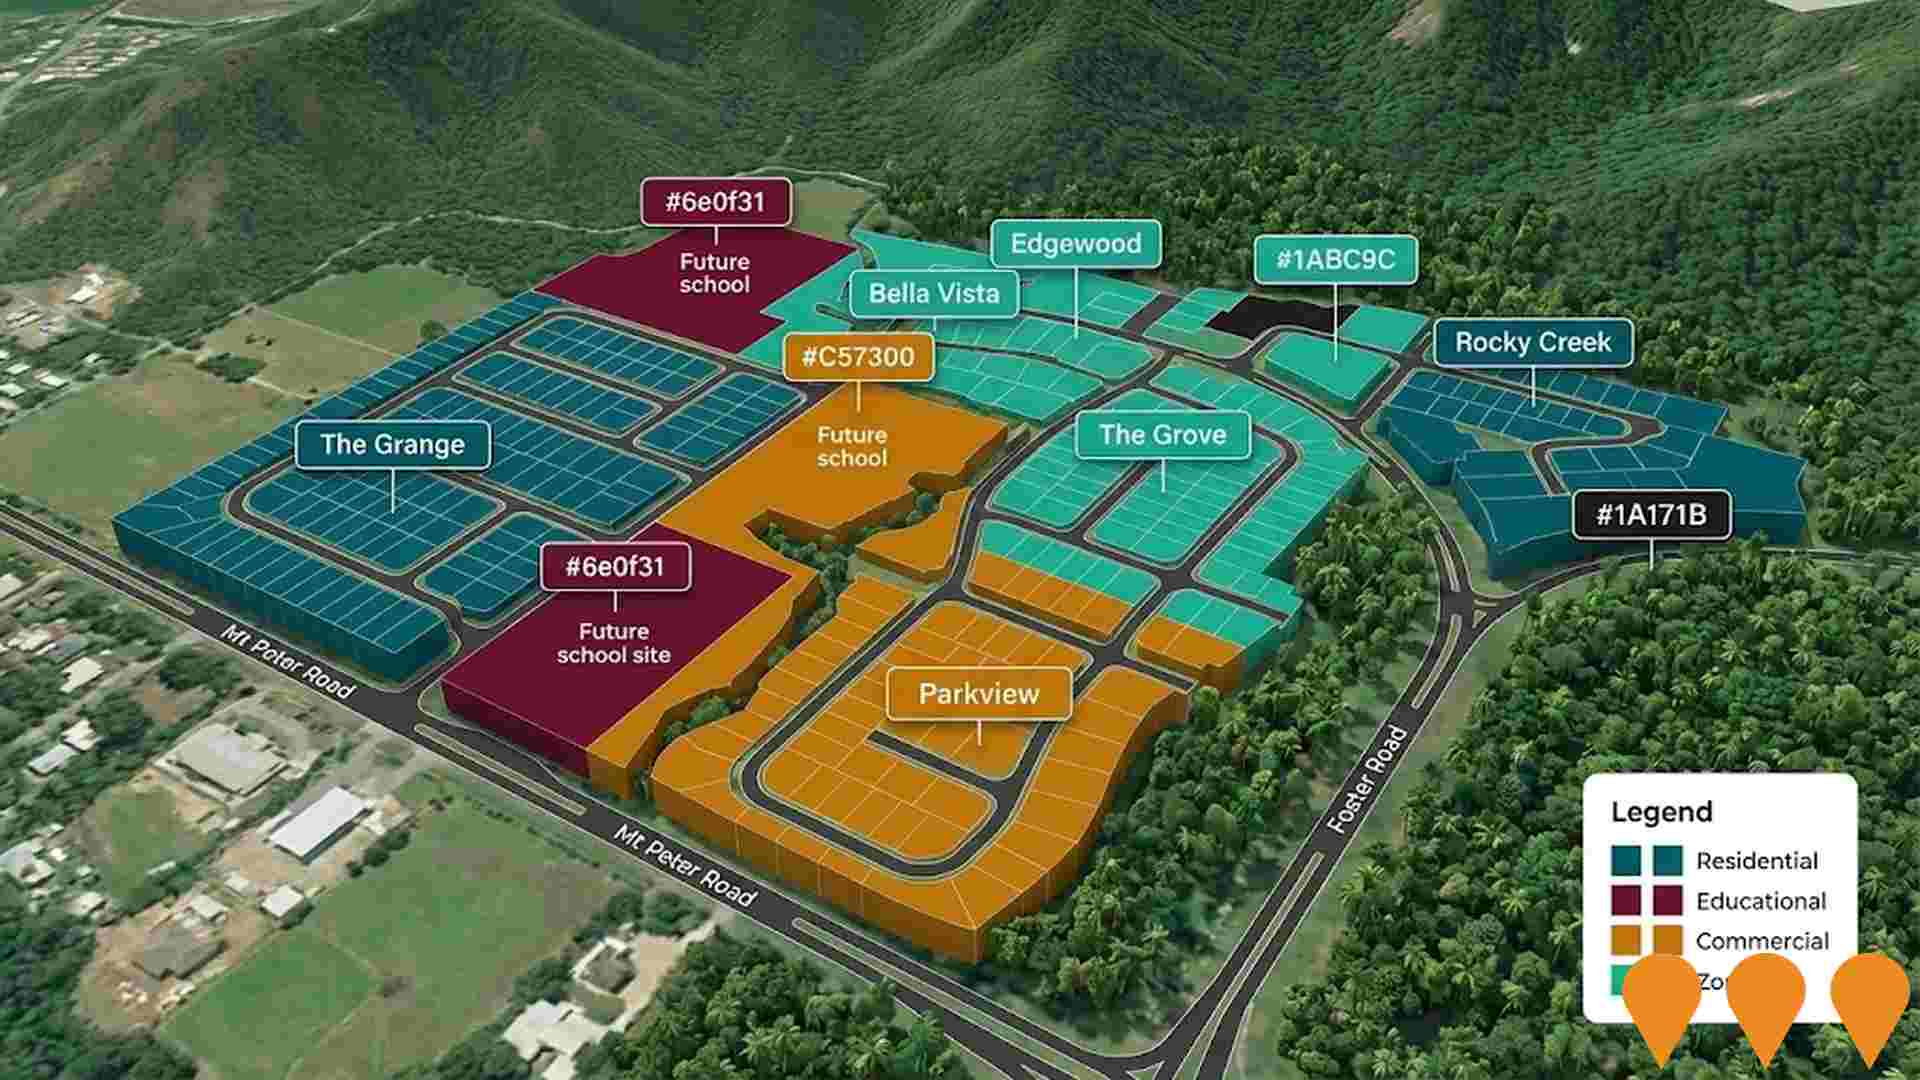
Queensland's newest Priority Development Area (PDA), declared 30 July 2025, covering 2,650 hectares in Cairns' Southern Growth Corridor. The Mount Peter PDA will deliver up to 18,500 new homes for approximately 42,000-42,500 residents by around 2050. An Interim Land Use Plan (ILUP) is in effect, enabling fast-tracked infrastructure and early development in Precinct 1 (Residential North). Economic Development Queensland (EDQ), in partnership with Cairns Regional Council, is preparing a full Development Scheme over the next 18 months with community input. The PDA provides streamlined planning and coordinated delivery of essential water, wastewater, transport, community facilities and open space infrastructure.
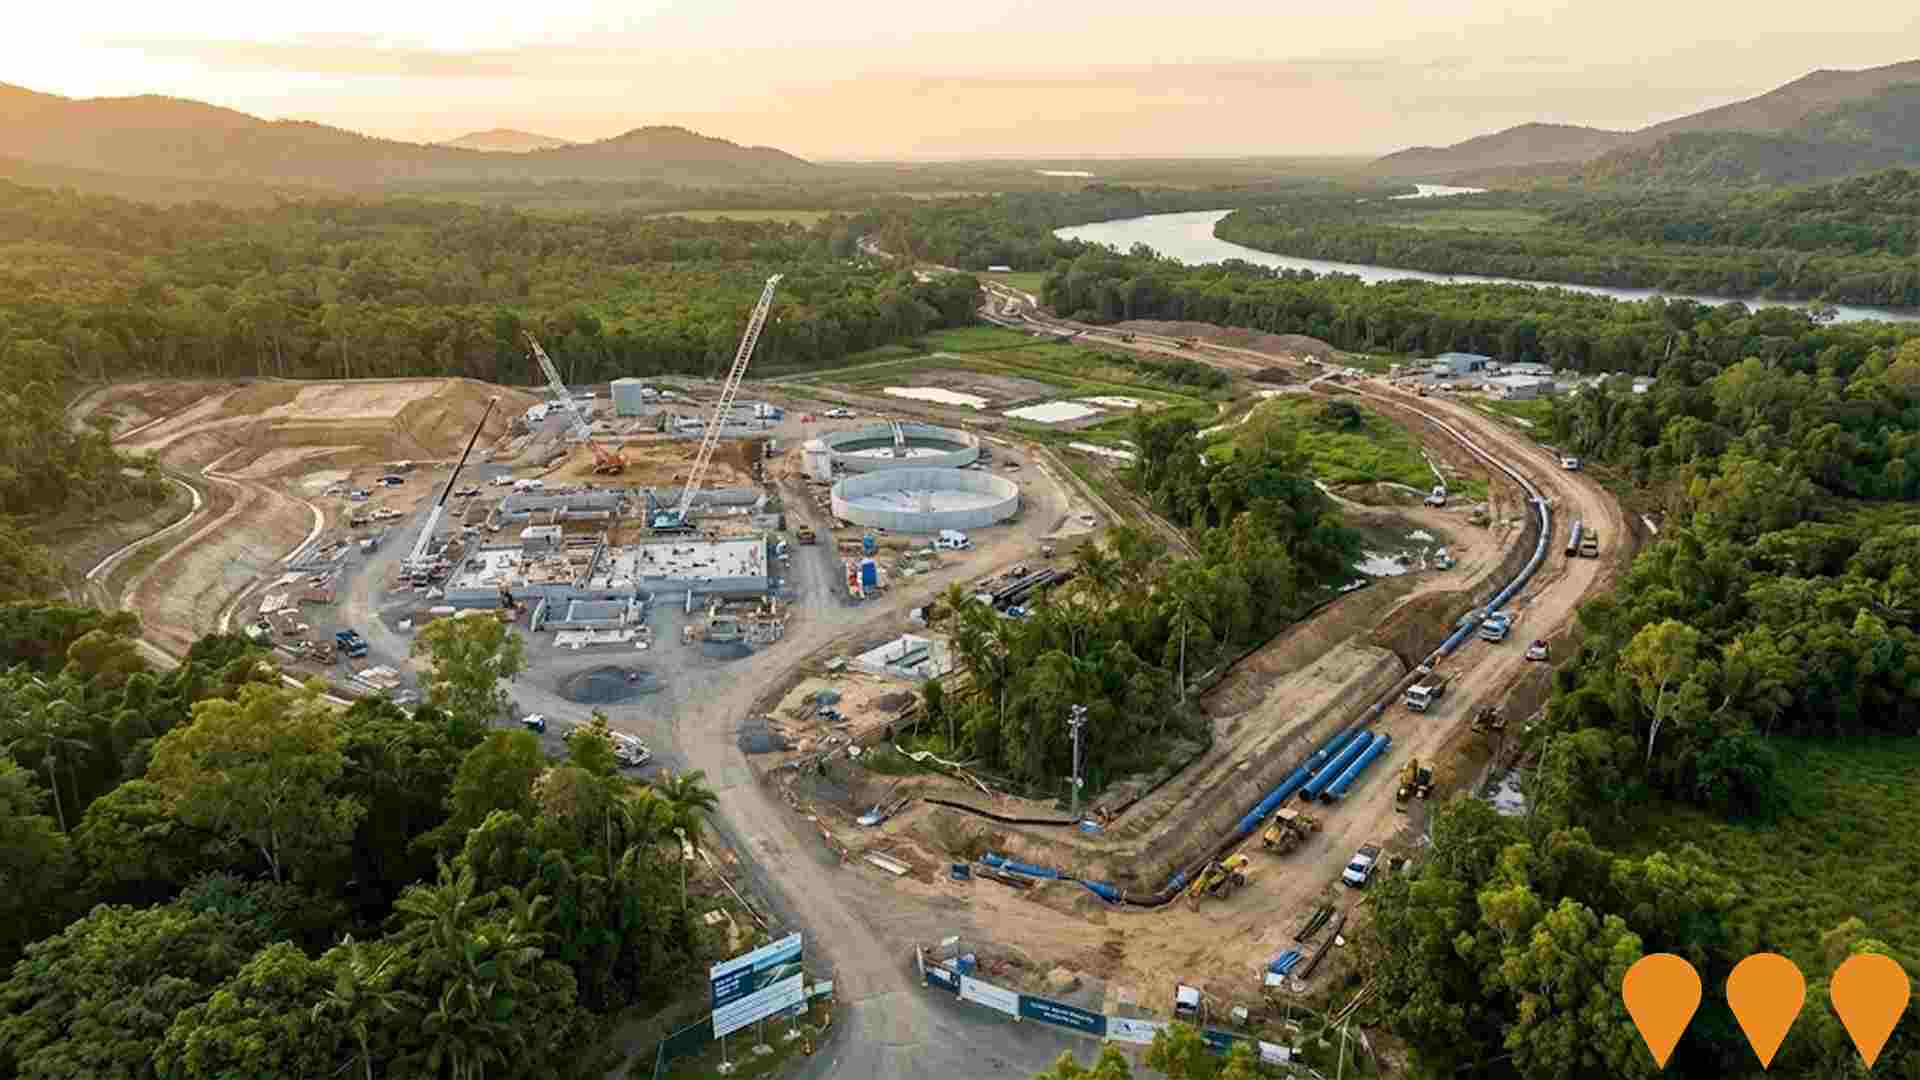
Cairns Water Security Stage 1 (CWSS1) Project
The Cairns Water Security Stage 1 (CWSS1) project is the largest infrastructure project ever undertaken by the Cairns Regional Council, designed to provide a new, reliable, and sustainable water supply for the growing Cairns region. The project involves building a new water intake at the Mulgrave River near the Desmond Trannore Bridge and a new water treatment plant and reservoirs on Council-owned land on Jones Road. It also includes the construction of a 30 km pipeline network to transport water. Once operational, the new water treatment plant will supply up to 60 megalitres of treated water per day and will make the existing treatment plant at Behana redundant. The project has passed its halfway mark and is expected to be complete in mid-2026.
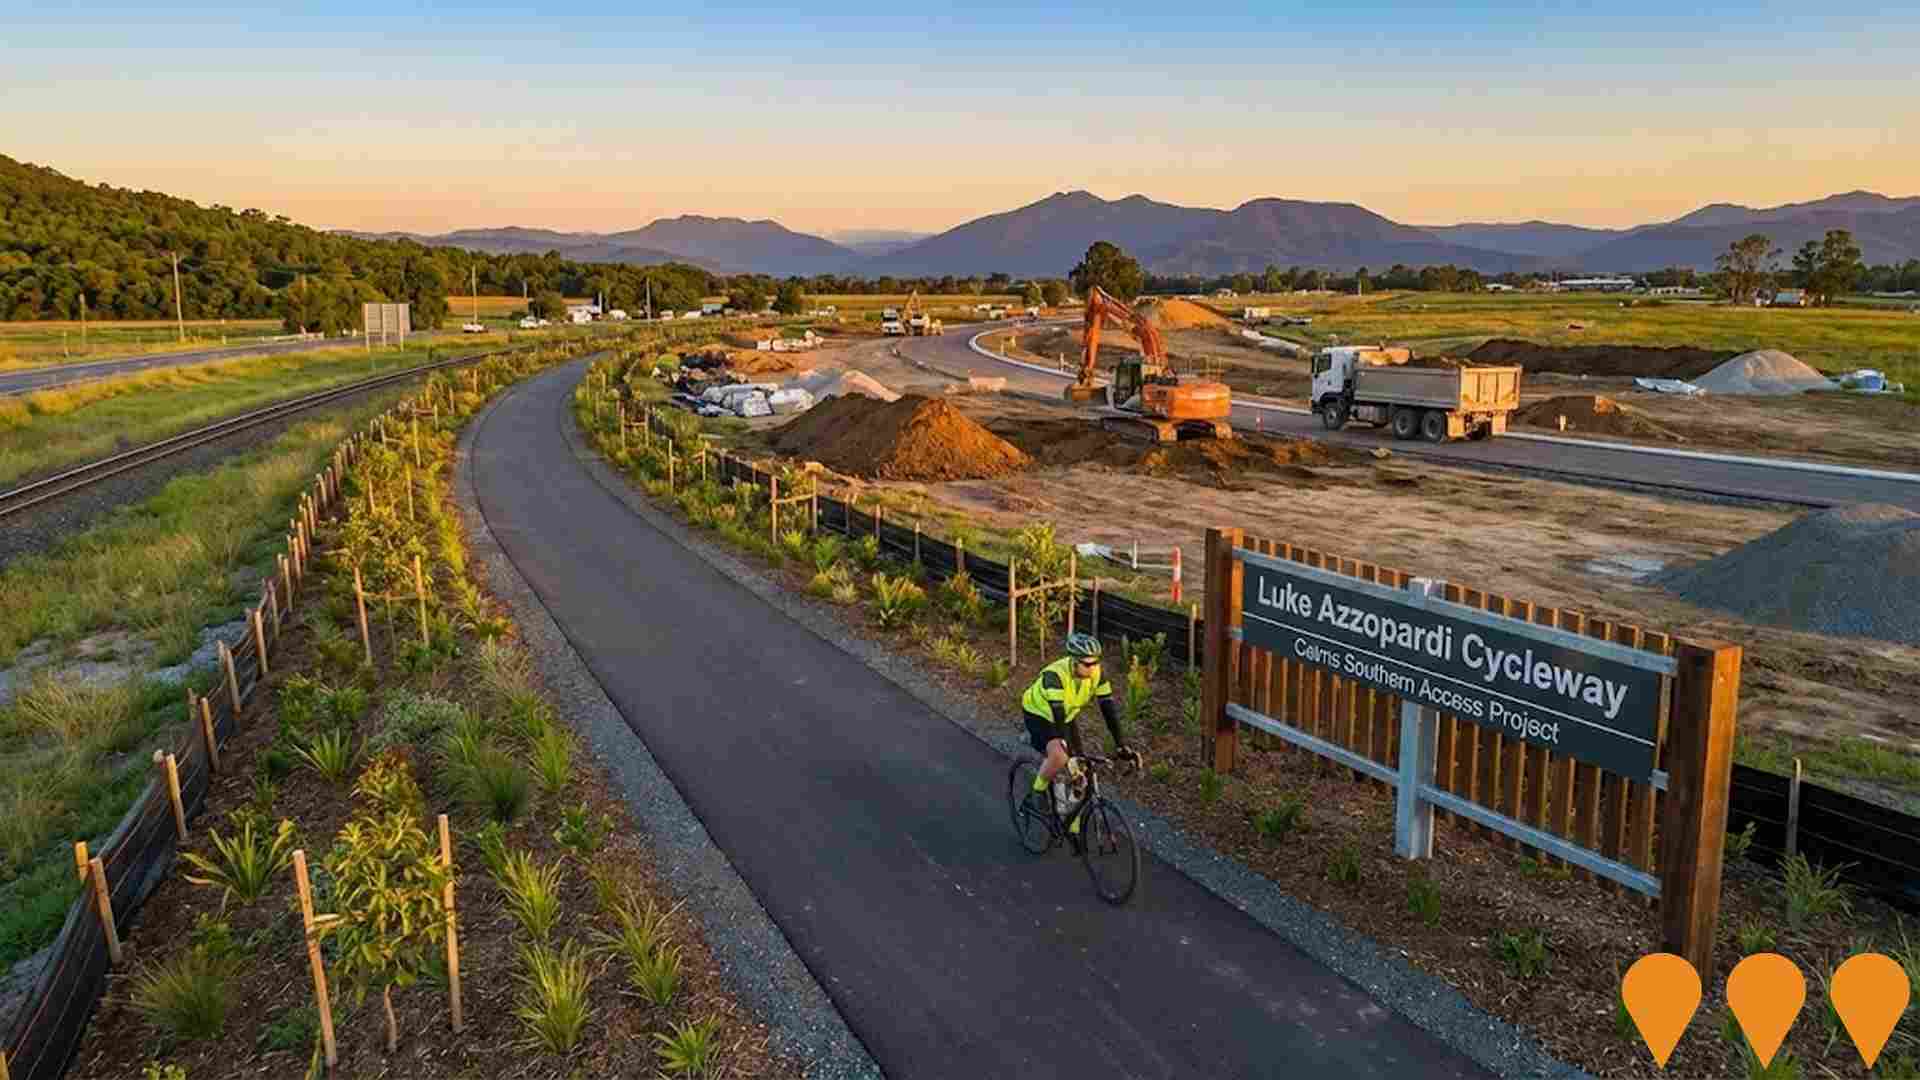
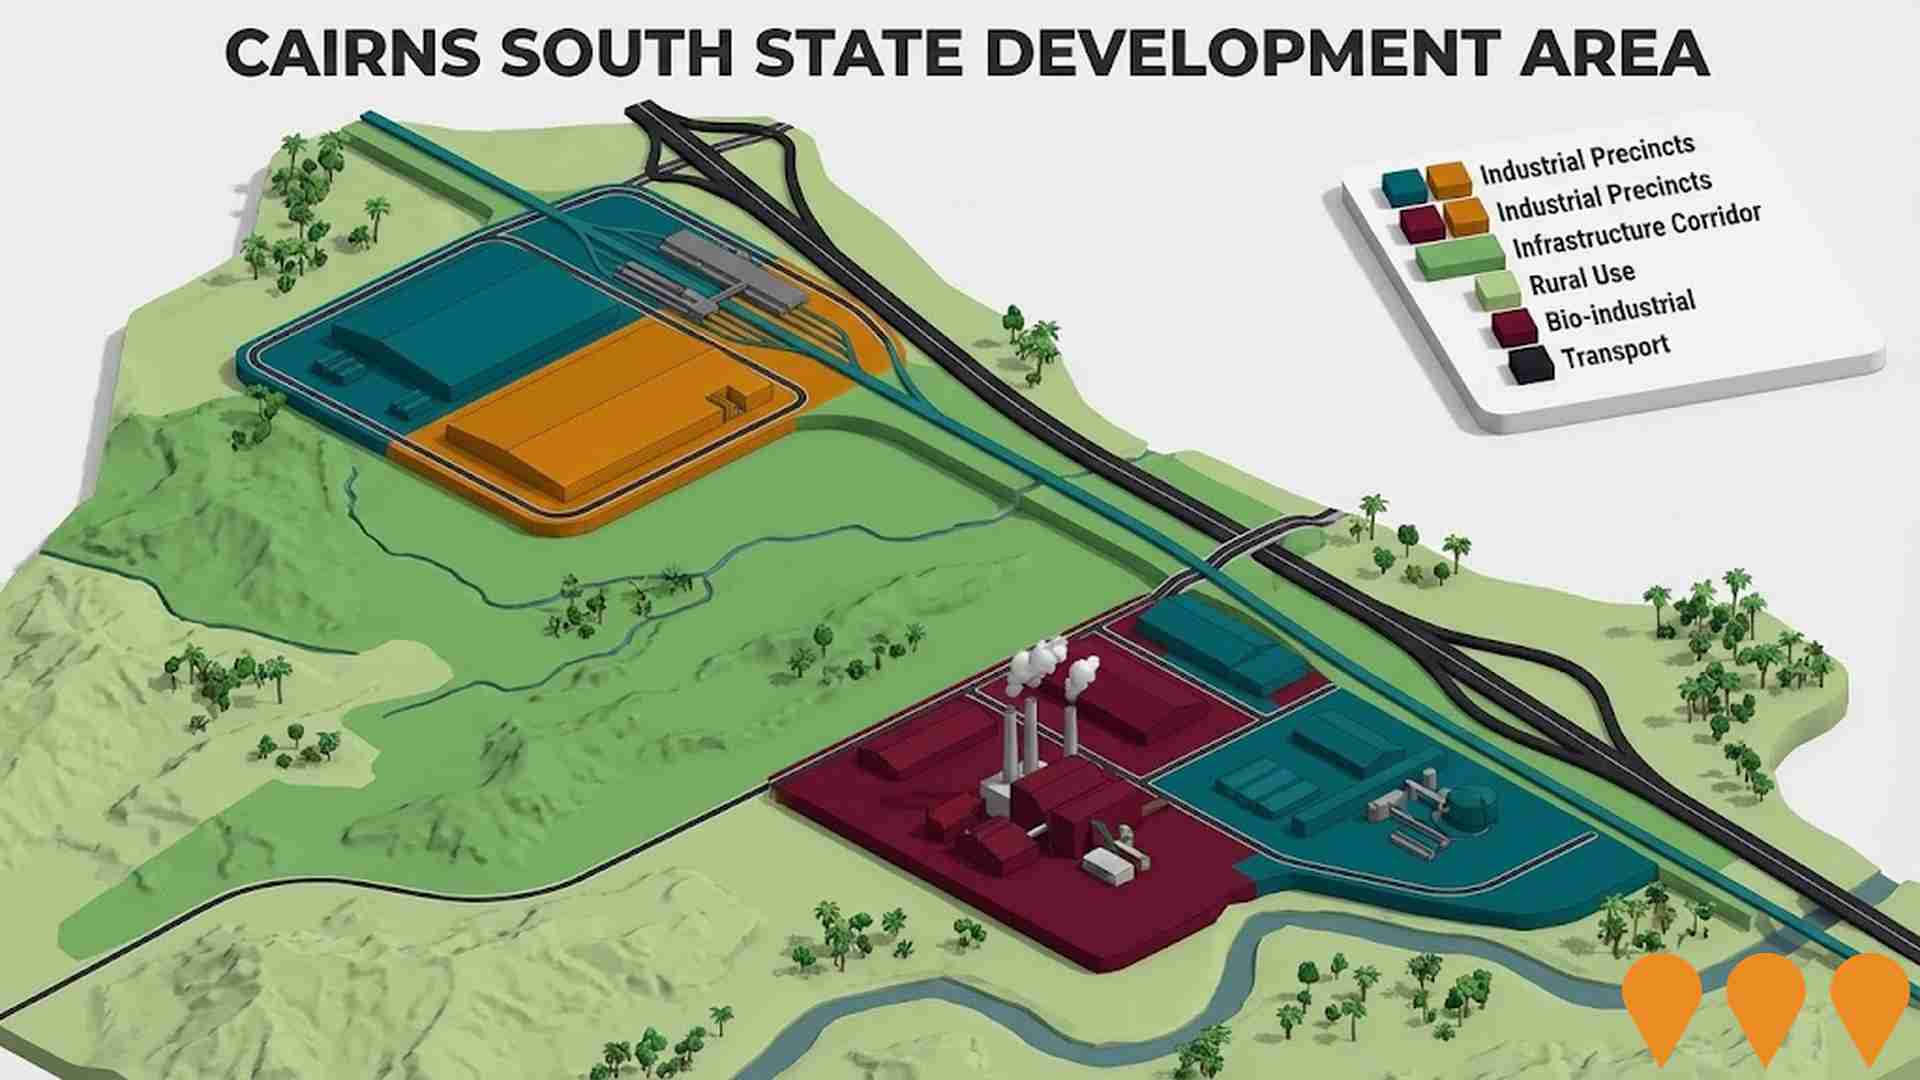
Cairns South State Development Area
A 1159-hectare state development area declared in November 2018 and expanded in February 2020 to facilitate regionally significant industrial development across two separate areas. The northern precinct at Wrights Creek enables freight, logistics, and large-scale industrial development with direct access to the Bruce Highway and North Coast Line. The southern precinct adjacent to the Mulgrave Mill supports bio-industrial development and value-added sugar processing industries. MSF Sugar has committed $150 million in planned investments including a biorefinery and cogeneration facility at the Gordonvale site.
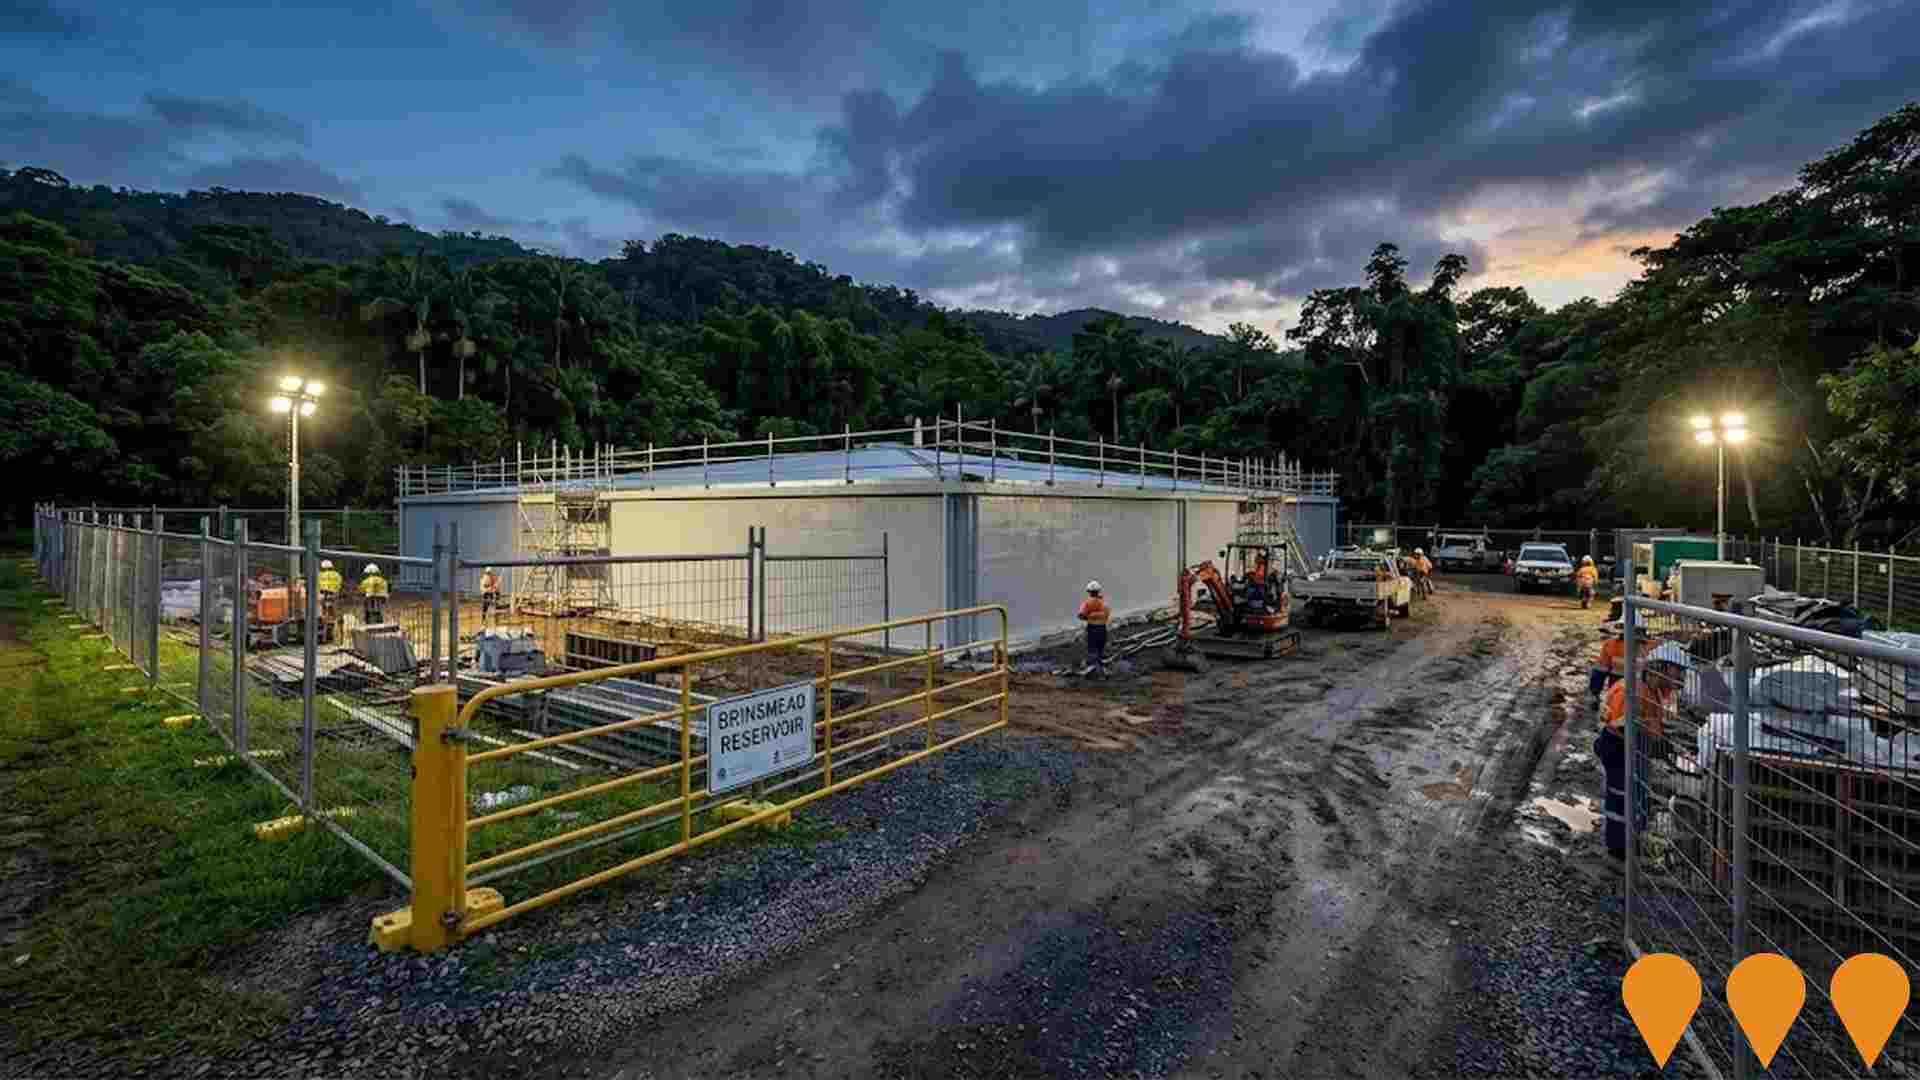
Cairns Reservoirs Remediation Package 2
Remediation works across nine reservoirs at eight sites in Cairns, including Mayer Street, Panguna, Bayview Large, Barron View, Runnymede, Brinsmead, Dempsey Street A and B, and Crest Close. The project involves concrete repairs, internal coatings, roof replacements, access upgrades, and road repairs to enhance water security and extend asset longevity.
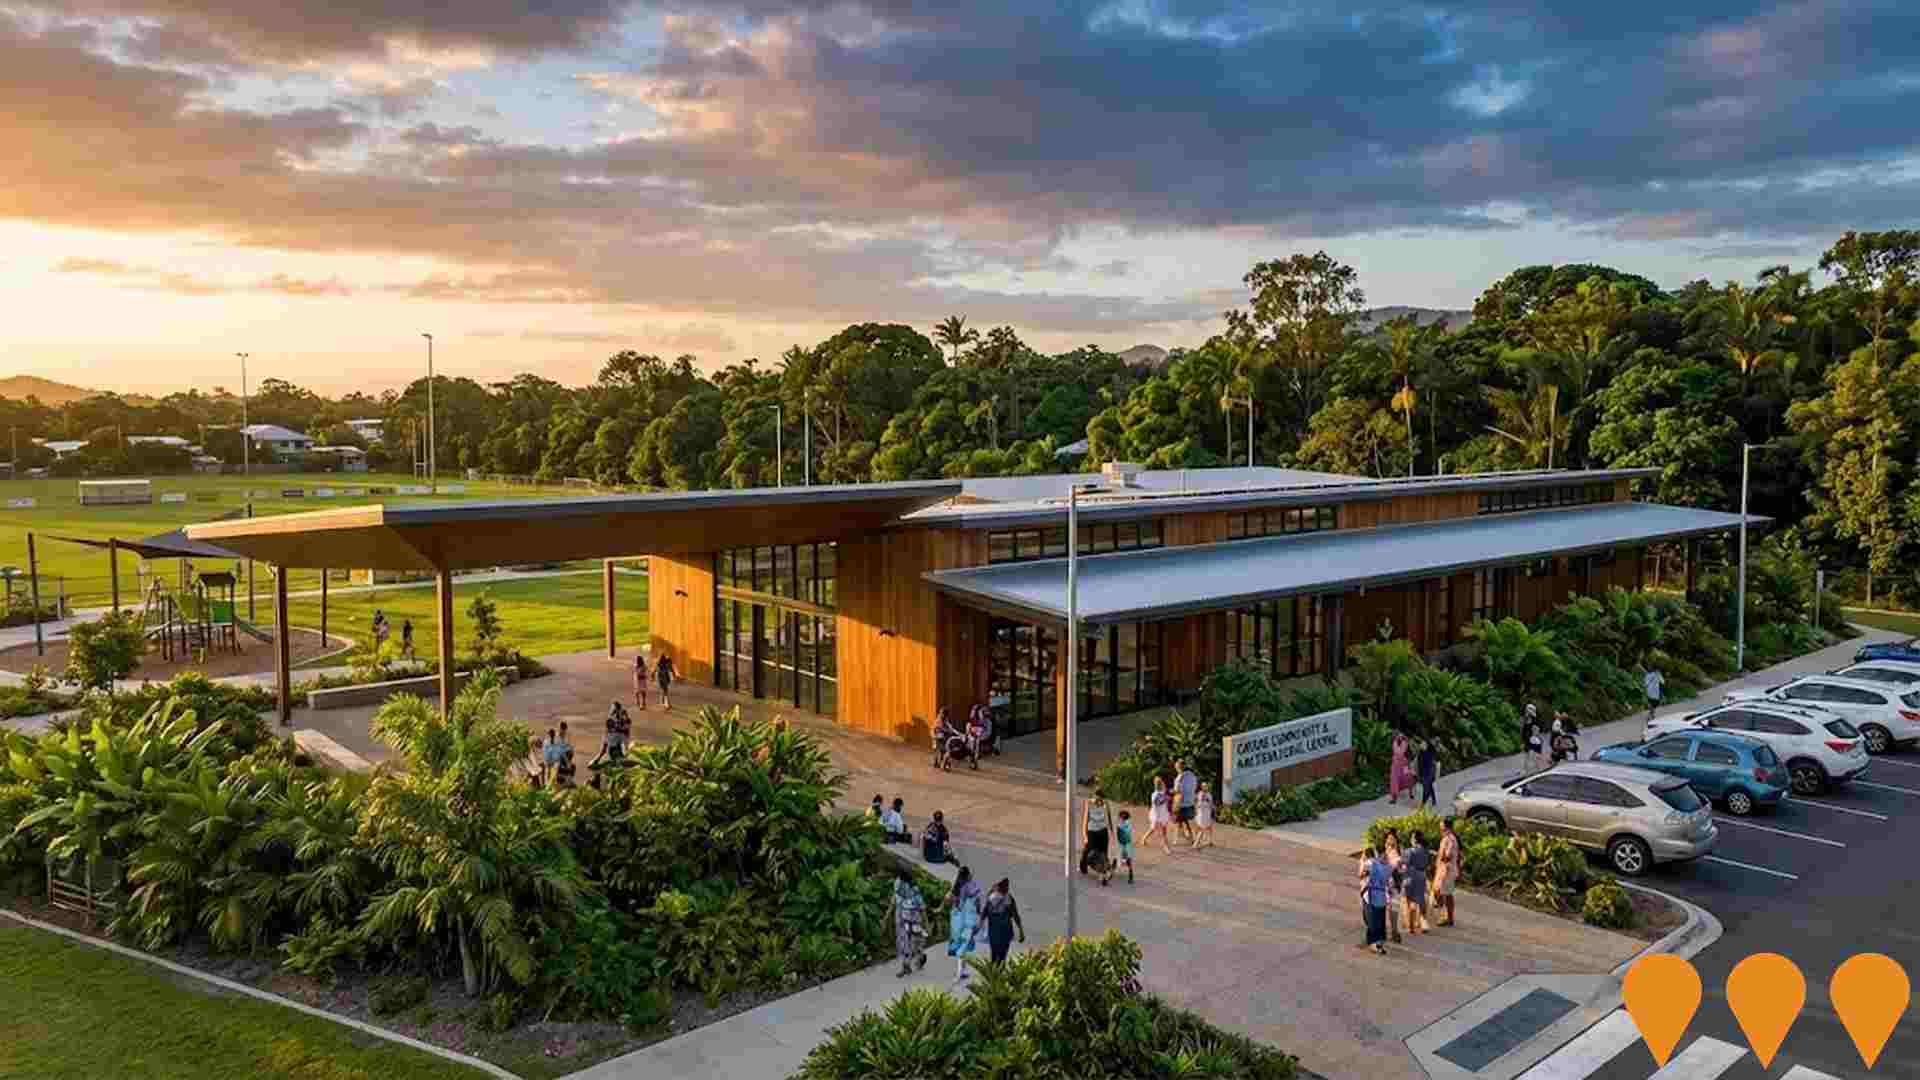
Cairns Community and Multicultural Centre
The $8 million Cairns Community and Multicultural Centre will deliver social facilities and key support and outreach services for residents of White Rock and surrounding areas, as well as Cairns diverse multicultural community. The centre will include a fully equipped commercial kitchen, multipurpose spaces for up to 200 people, small meeting rooms, dedicated space for service providers, foyer and reception area, and covered areas for play groups and cultural practices. Detailed design commenced in January 2025, with construction to be fast-tracked. The facility will be adjacent to White Rock State School and will complement new sports fields being developed at the school.
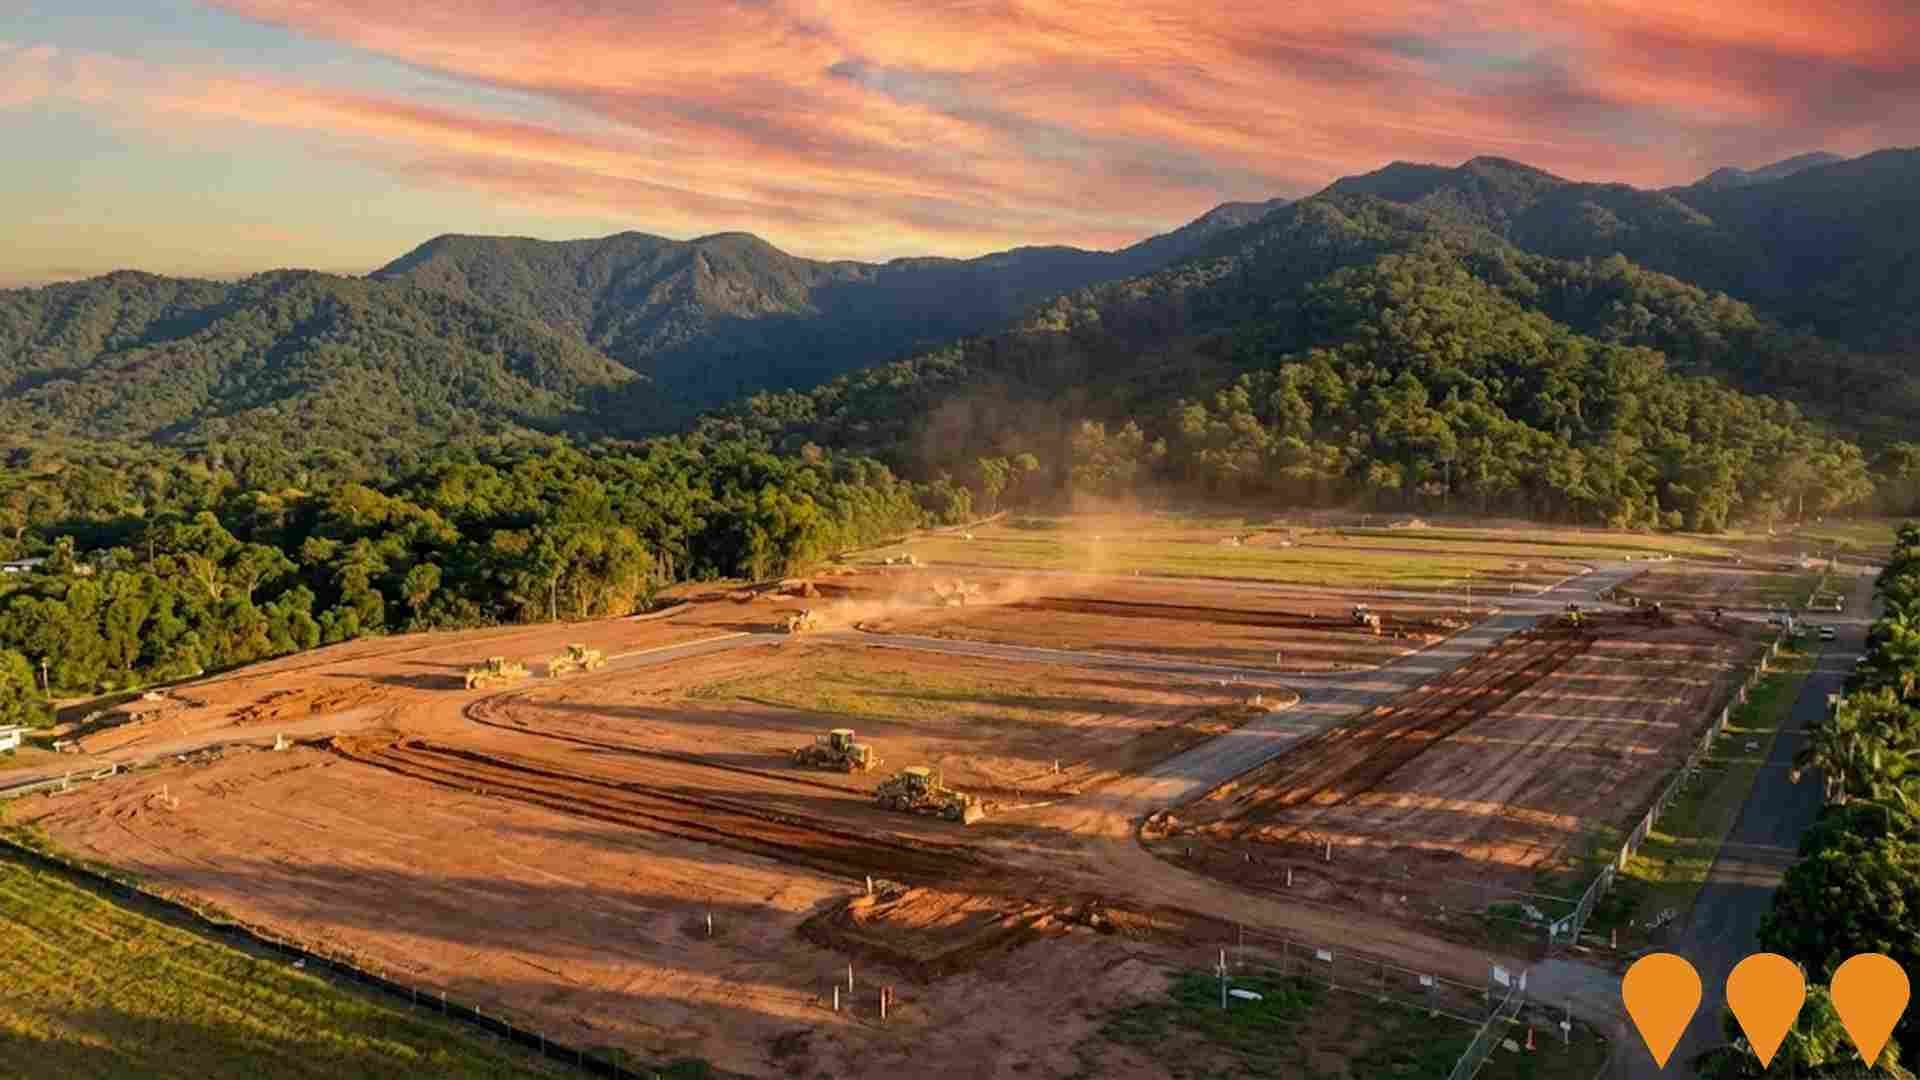
Sugarworld Estate
Sugarworld Estate is a master planned mixed-use residential development featuring The Terrace and The Heights precincts. Offering 219 fully serviced lots ranging from 465m2 to 3,222m2 with mountain views, located 20 minutes from Cairns CBD with multiple stages actively selling.
Employment
The employment landscape in Bentley Park shows performance that lags behind national averages across key labour market indicators
Bentley Park's workforce is balanced across white and blue-collar jobs with prominent essential services sectors. Its unemployment rate in September 2025 was 4.8%.
At this time, 4781 residents were employed, an unemployment rate of 0.7% higher than Rest of Qld's rate of 4.1%, and workforce participation was at 68.0%, compared to Rest of Qld's 59.1%. Key industries for employment among residents are health care & social assistance, retail trade, and construction. Bentley Park has a particular specialization in public administration & safety, with an employment share 1.5 times the regional level. However, agriculture, forestry & fishing is under-represented, with only 1.0% of Bentley Park's workforce compared to Rest of Qld's 4.5%.
The area offers limited local employment opportunities, indicated by Census data comparing working population and resident population. Between September 2024 and September 2025, Bentley Park's labour force decreased by 1.6%, with a 3.3% decline in employment leading to a 1.7 percentage point rise in unemployment. In contrast, Rest of Qld saw employment growth of 1.7% and labour force growth of 2.1%, with unemployment rising by 0.3 percentage points. State-level data up to 25-Nov-25 shows Queensland's employment contracted by 0.01% (losing 1,210 jobs), with the state unemployment rate at 4.2%, closely aligned with the national rate of 4.3%. Jobs and Skills Australia's national employment forecasts from May-25 suggest that while overall employment is projected to expand by 6.6% over five years and 13.7% over ten years, growth rates vary significantly between sectors. Applying these projections to Bentley Park's employment mix indicates local employment should increase by approximately 6.3% over five years and 13.2% over ten years.
Frequently Asked Questions - Employment
Income
Income levels align closely with national averages, indicating typical economic conditions for Australian communities according to AreaSearch analysis
AreaSearch's latest postcode level ATO data for financial year 2022 shows that income in Bentley Park SA2 is below the national average. The median income is $54,265 and the average income stands at $60,390. This contrasts with Rest of Qld's figures where the median income is $50,780 and the average income is $64,844. Based on Wage Price Index growth of 13.99% since financial year 2022, current estimates for Bentley Park would be approximately $61,857 (median) and $68,839 (average) as of September 2025. From the 2021 Census, household, family and personal incomes in Bentley Park cluster around the 54th percentile nationally. The predominant income cohort spans 41.6% of locals (3,869 people), falling within the $1,500 - 2,999 category. This aligns with the broader area where this cohort likewise represents 31.7%. High housing costs consume 16.3% of income, leaving disposable income at the 55th percentile nationally.
Frequently Asked Questions - Income
Housing
Bentley Park is characterized by a predominantly suburban housing profile, with ownership patterns similar to the broader region
Dwelling structure in Bentley Park, as evaluated at the latest Census, comprised 97.1% houses and 2.9% other dwellings. In comparison, Non-Metro Qld had 68.4% houses and 31.6% other dwellings. Home ownership in Bentley Park was 18.2%, with mortgaged dwellings at 47.1% and rented dwellings at 34.7%. The median monthly mortgage repayment was $1,517, aligning with Non-Metro Qld's average. The median weekly rent was $385, higher than Non-Metro Qld's $315. Nationally, Bentley Park's mortgage repayments were lower at $1,517 compared to the Australian average of $1,863, while rents were higher at $385 against the national figure of $375.
Frequently Asked Questions - Housing
Household Composition
Bentley Park features high concentrations of family households, with a higher-than-average median household size
Family households comprise 81.2% of all households, including 36.6% couples with children, 25.8% couples without children, and 17.8% single parent families. Non-family households make up 18.8%, consisting of 15.3% lone person households and 3.4% group households. The median household size is 3.0 people, which is larger than the Rest of Qld average of 2.4.
Frequently Asked Questions - Households
Local Schools & Education
Educational outcomes in Bentley Park fall within the lower quartile nationally, indicating opportunities for improvement in qualification attainment
The area has lower university qualification rates at 14.8%, compared to the Australian average of 30.4%. This gap presents both a challenge and an opportunity for targeted education initiatives. Bachelor degrees are most common (11.1%), followed by graduate diplomas (1.9%) and postgraduate qualifications (1.8%). Vocational credentials are prominent, with 43.8% of residents aged 15+ holding them - advanced diplomas at 11.0% and certificates at 32.8%.
Educational participation is high, with 35.6% of residents currently enrolled in formal education. This includes 13.9% in primary education, 11.5% in secondary education, and 3.4% pursuing tertiary education.
Frequently Asked Questions - Education
Schools Detail
Nearby Services & Amenities
Transport
Transport servicing is low compared to other areas nationally based on assessment of service frequency, route connectivity and accessibility
Bentley Park has 18 operational public transport stops, all of which are bus stops. These stops are served by five distinct routes that collectively facilitate 378 weekly passenger trips. The accessibility of these services is deemed good, with residents typically residing 311 meters from the nearest stop.
On average, there are 54 daily trips across all routes, equating to around 21 weekly trips per individual stop.
Frequently Asked Questions - Transport
Transport Stops Detail
Health
Bentley Park's residents are extremely healthy with younger cohorts in particular seeing very low prevalence of common health conditions
Analysis of health metrics shows strong performance throughout Bentley Park, with younger cohorts particularly seeing very low prevalence of common health conditions. The rate of private health cover was found to be relatively low at approximately 50% of the total population (~4650 people), compared to the national average of 55.3%.
The most common medical conditions in the area were mental health issues and asthma, impacting 7.4% and 7.0% of residents respectively, while 74.9% declared themselves completely clear of medical ailments, compared to 71.7% across Rest of Qld. The area has 10.0% of residents aged 65 and over (929 people), which is lower than the 15.7% in Rest of Qld.
Frequently Asked Questions - Health
Cultural Diversity
In terms of cultural diversity, Bentley Park records figures broadly comparable to the national average, as found in AreaSearch's assessment of a number of language and cultural background related metrics
Bentley Park's cultural diversity aligns with the broader regional average, with 86.9% of its residents being citizens, 82.1% born in Australia, and 85.5% speaking English only at home. Christianity is the dominant religion, practiced by 49.7% of Bentley Park's population. The most significant deviation from regional averages is seen in the 'Other' religious category, comprising 2.0% of Bentley Park's population compared to 1.5% across the rest of Queensland.
In terms of ancestry, the top three groups are Australian (24.4%), English (22.4%), and Other (15.4%). Notably, Australian Aboriginal (8.5%) and New Zealand (1.1%) ethnicities are overrepresented in Bentley Park compared to regional averages of 6.7% and 0.8%, respectively. Samoan ethnicity is also slightly higher at 0.5%.
Frequently Asked Questions - Diversity
Age
Bentley Park hosts a very young demographic, ranking in the bottom 10% of areas nationwide
Bentley Park's median age is 32 years, which is lower than the Rest of Qld average of 41 and substantially under the Australian median of 38. Compared to Rest of Qld, Bentley Park has a higher concentration of residents aged 25-34 (17.3%) but fewer residents aged 65-74 (6.1%). Between the 2021 Census and the present day, the percentage of residents aged 25 to 34 has grown from 14.8% to 17.3%. Meanwhile, the percentage of residents aged 5 to 14 has declined from 18.2% to 15.8%, and the percentage of residents aged 45 to 54 has dropped from 12.8% to 11.4%. By 2041, demographic modeling suggests Bentley Park's age profile will change significantly. The 25 to 34 cohort is projected to grow by 37%, adding 600 residents to reach a total of 2,213. Conversely, both the 5 to 14 and 15 to 24 age groups are expected to decrease in number.
