Chart Color Schemes
This analysis uses ABS Statistical Areas Level 2 (SA2) boundaries, which can materially differ from Suburbs and Localities (SAL) even when sharing similar names.
SA2 boundaries are defined by the Australian Bureau of Statistics and are designed to represent communities for statistical reporting (e.g., census and ERP).
Suburbs and Localities (SAL) represent commonly-used suburb/locality names (postal-style areas) and may use different geographic boundaries. For comprehensive analysis, consider reviewing both boundary types if available.
est. as @ -- *
ABS ERP | -- people | --
2021 Census | -- people
Sales Activity
Curious about local property values? Filter the chart to assess the volume and appreciation (including resales) trends and regional comparisons, or scroll to the map below view this information at an individual property level.
Find a Recent Sale
Sales Detail
Population
An assessment of population growth drivers in Kanimbla - Mooroobool reveals an overall ranking slightly below national averages considering recent, and medium term trends
Kanimbla - Mooroobool's population is around 10,399 as of November 2025. This reflects an increase of 436 people since the 2021 Census, which reported a population of 9,963. The change was inferred from the estimated resident population of 10,319 in June 2024 and an additional 59 validated new addresses since the Census date. This level of population equates to a density ratio of 1,354 persons per square kilometer, above the average seen across national locations assessed by AreaSearch. Population growth was primarily driven by overseas migration contributing approximately 58.5% of overall population gains during recent periods.
AreaSearch adopts ABS/Geoscience Australia projections for each SA2 area, released in 2024 with a base year of 2022. For areas not covered and years post-2032, Queensland State Government's SA2 area projections are adopted, released in 2023 based on 2021 data. These state projections do not provide age category splits; hence proportional growth weightings aligned with ABS Greater Capital Region projections are applied where utilised. Moving forward, demographic trends suggest a population increase just below the median of regional areas nationally, with an expected expansion by 759 persons to 2041 based on the latest annual ERP population numbers, reflecting a gain of 6.5% in total over the 17 years.
Frequently Asked Questions - Population
Development
Residential development activity is lower than average in Kanimbla - Mooroobool according to AreaSearch's national comparison of local real estate markets
Kanimbla - Mooroobool has seen approximately 14 new homes approved annually. Over the past five financial years, from FY21 to FY25, around 70 homes were approved, with another 11 approved so far in FY26. On average, about three new residents arrive per year for each dwelling constructed during these years.
This suggests supply is lagging demand, potentially leading to increased buyer competition and pricing pressures. The average construction value of new homes is $510,000, which is higher than regional norms due to quality-focused development. In FY26, there have been $370,000 in commercial approvals, indicating limited commercial development activity. Compared to the rest of Queensland, Kanimbla - Mooroobool has significantly less development activity, at 61.0% below the regional average per person. This scarcity of new dwellings typically strengthens demand and prices for existing properties.
The area's population density is approximately 1029 people per dwelling approval, indicating an established market. According to AreaSearch's latest quarterly estimate, Kanimbla - Mooroobool is forecasted to gain around 679 residents by 2041. If current development rates continue, housing supply may not keep pace with population growth, potentially increasing competition among buyers and supporting stronger price growth.
Frequently Asked Questions - Development
Infrastructure
Kanimbla - Mooroobool has strong levels of nearby infrastructure activity, ranking in the top 30% nationally
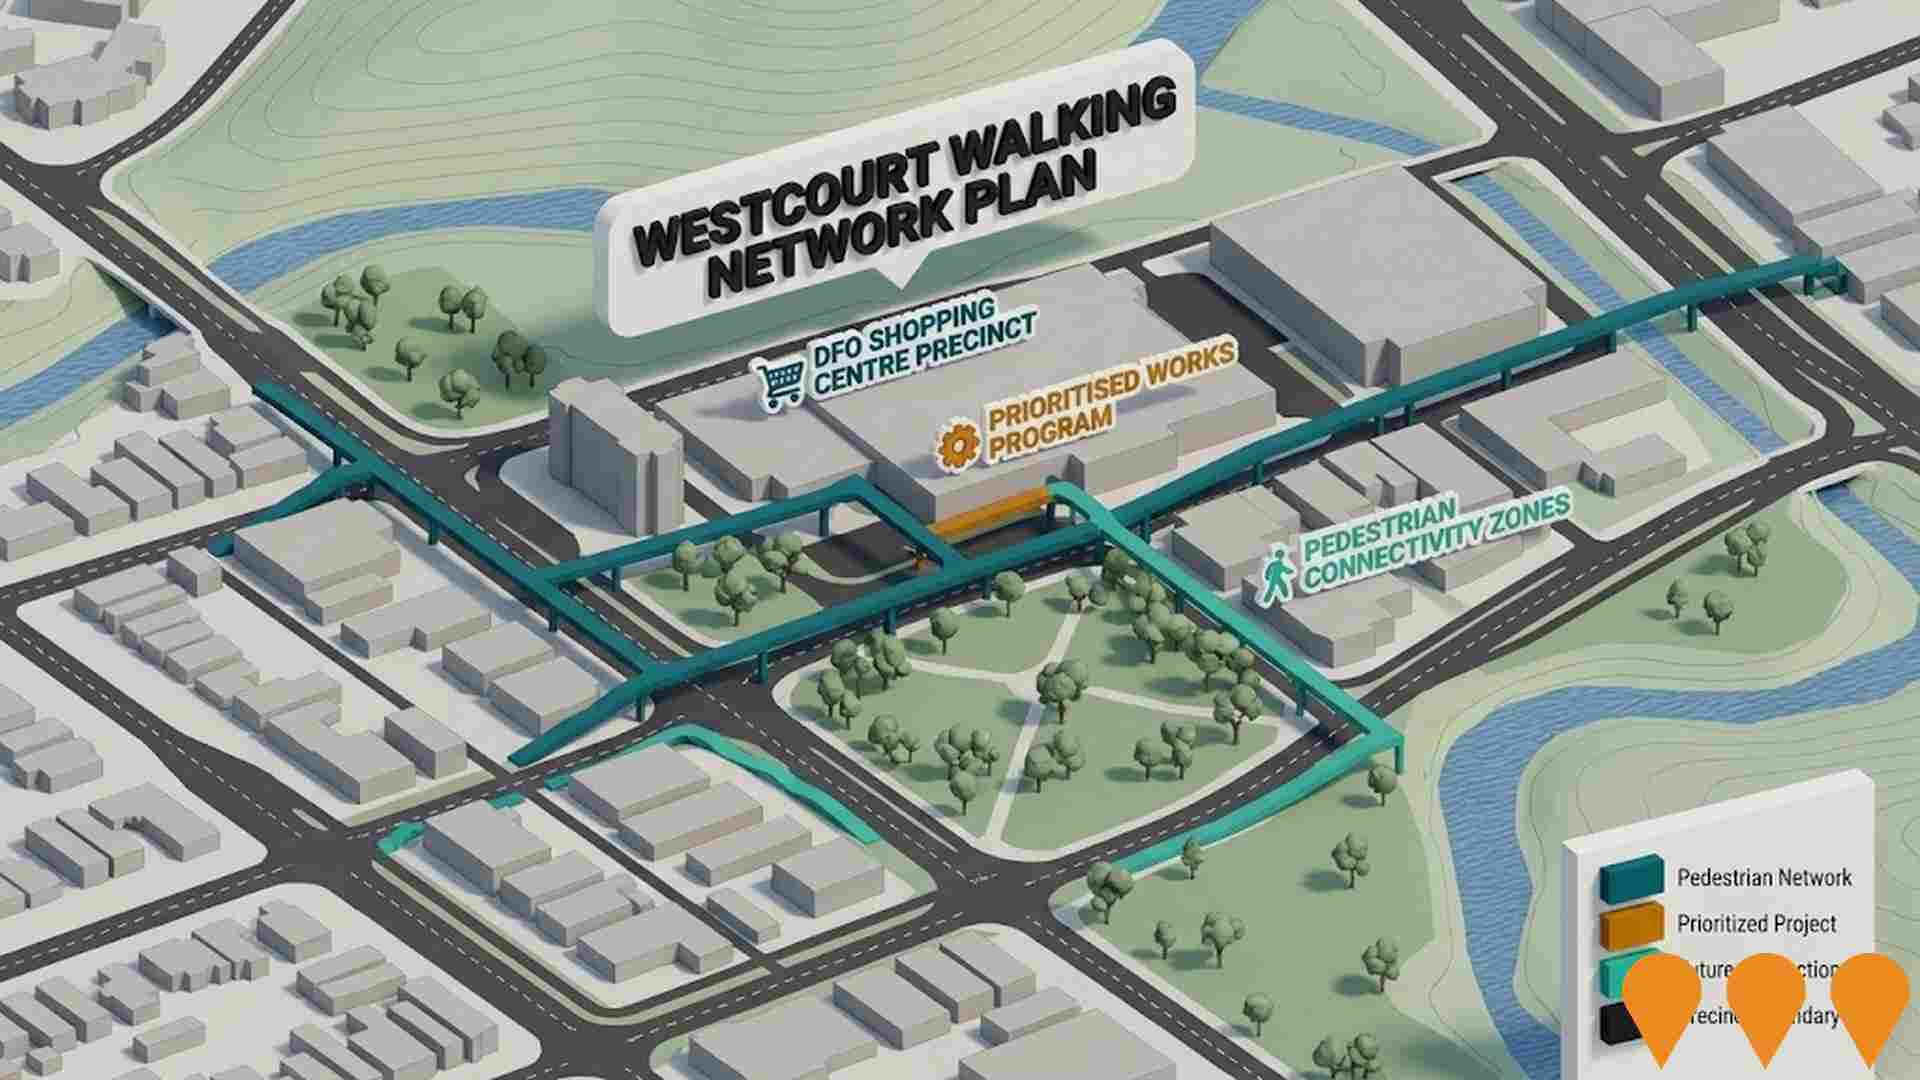
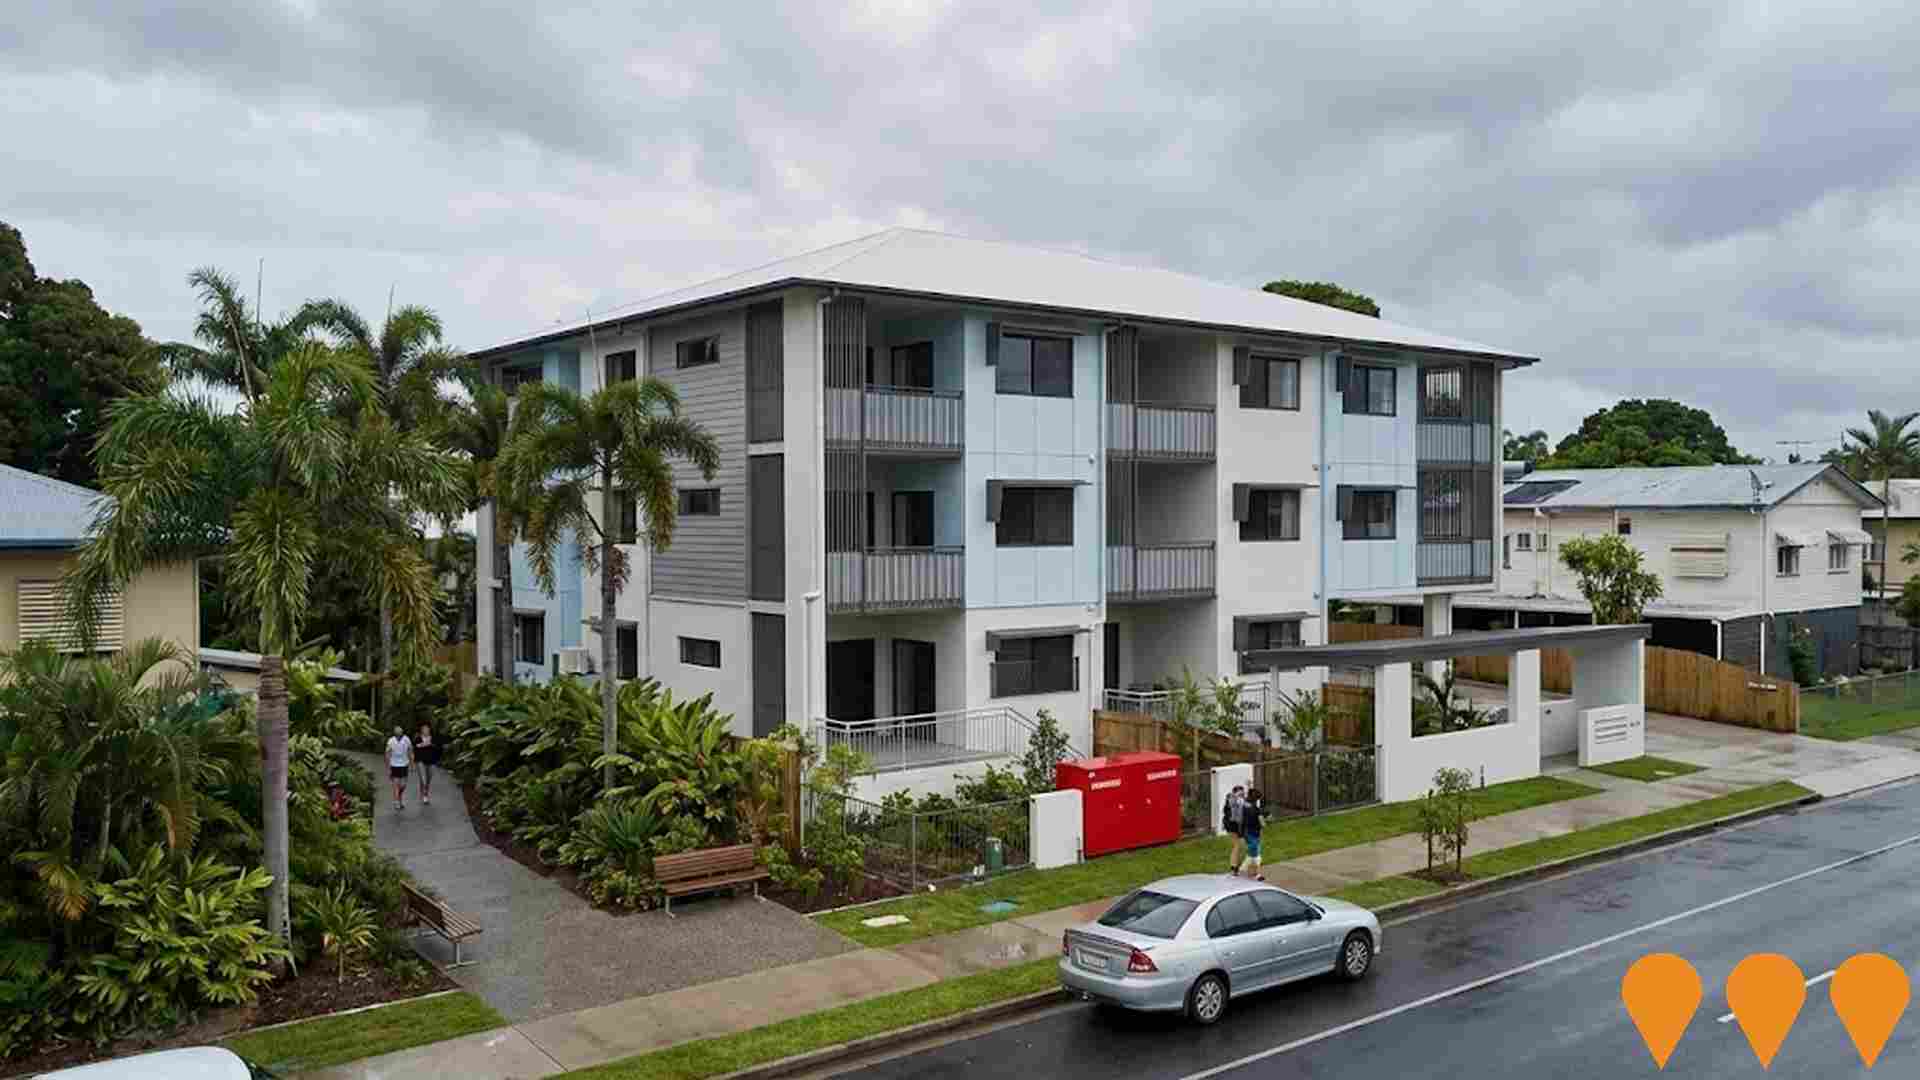
Changes to local infrastructure significantly impact an area's performance. AreaSearch has identified 18 projects likely to affect the area. Key projects include Far North Private Hospital, 164 & 172 Hoare Street and 10-30 Pease Street Residential Development, Stan Williams Park Upgrades, Manoora Infill Housing Development. The following list details those most relevant.
Professional plan users can use the search below to filter and access additional projects.
INFRASTRUCTURE SEARCH
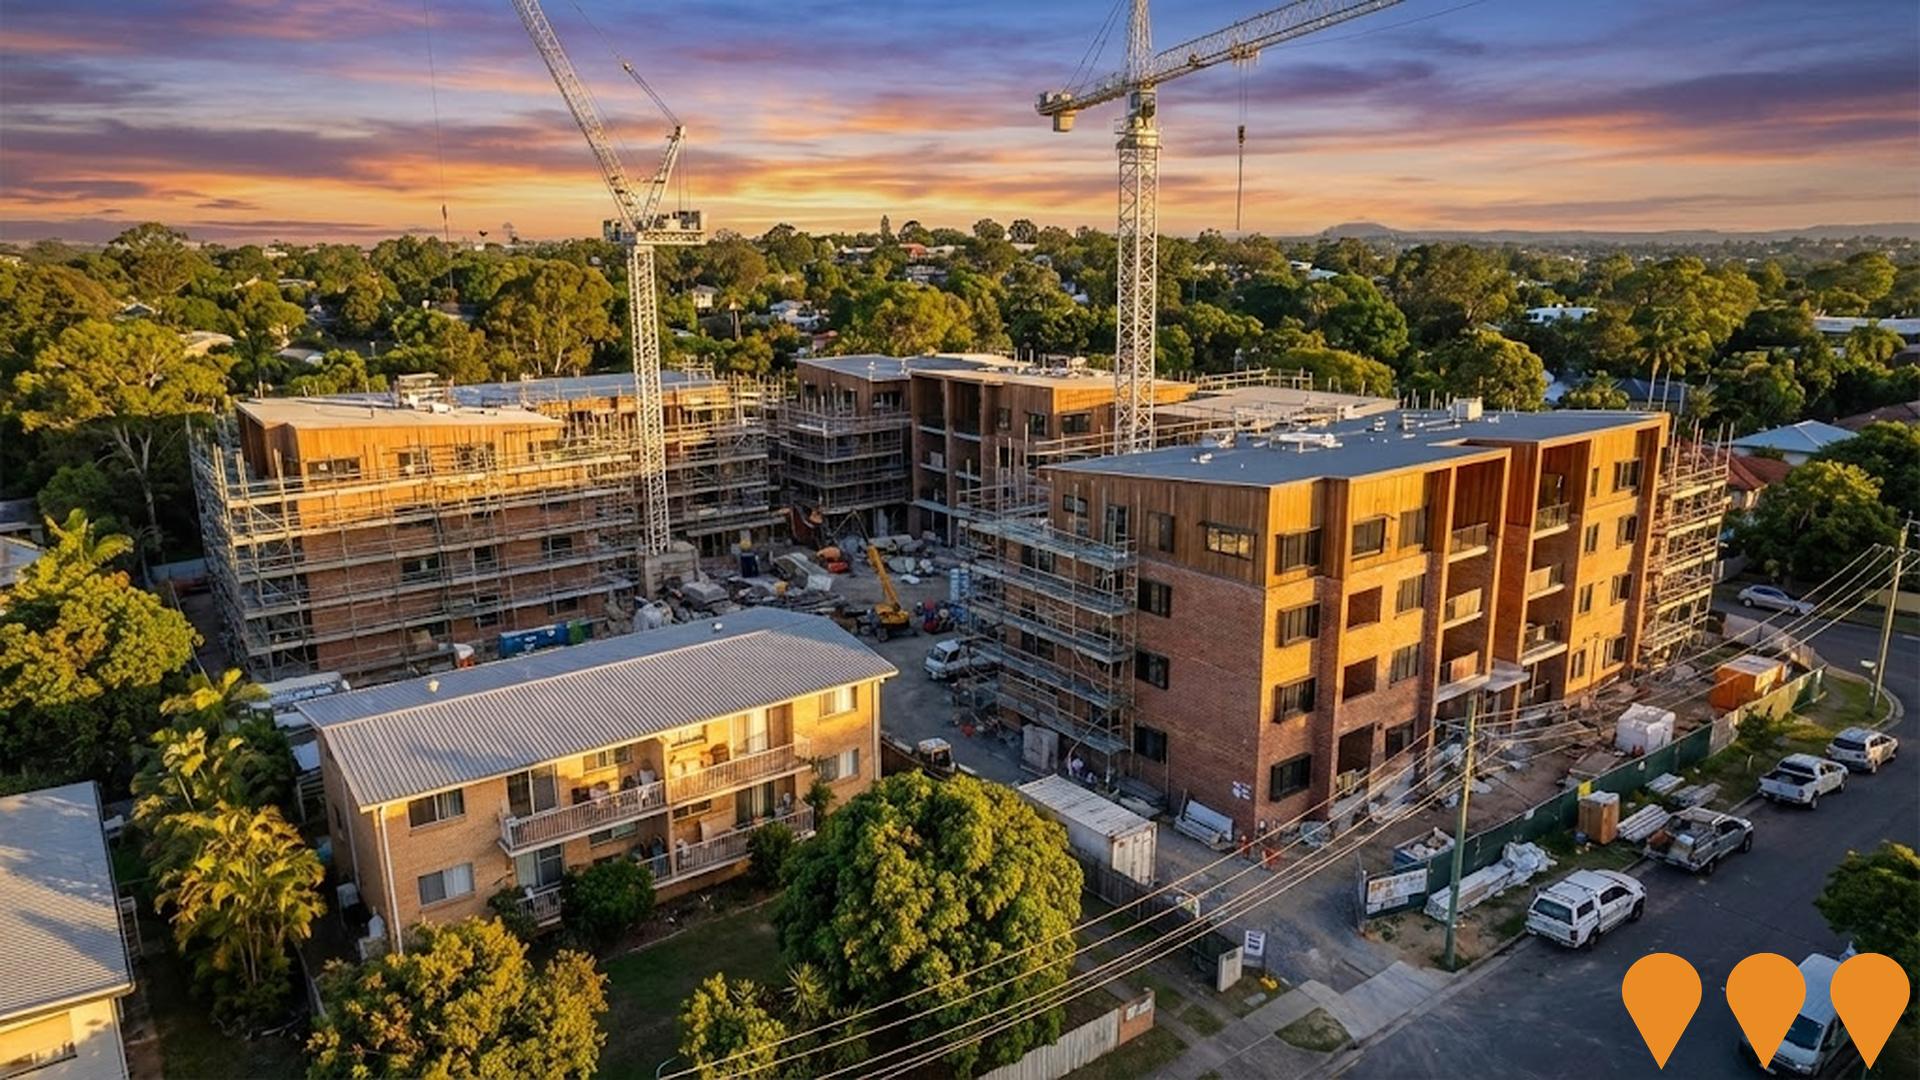
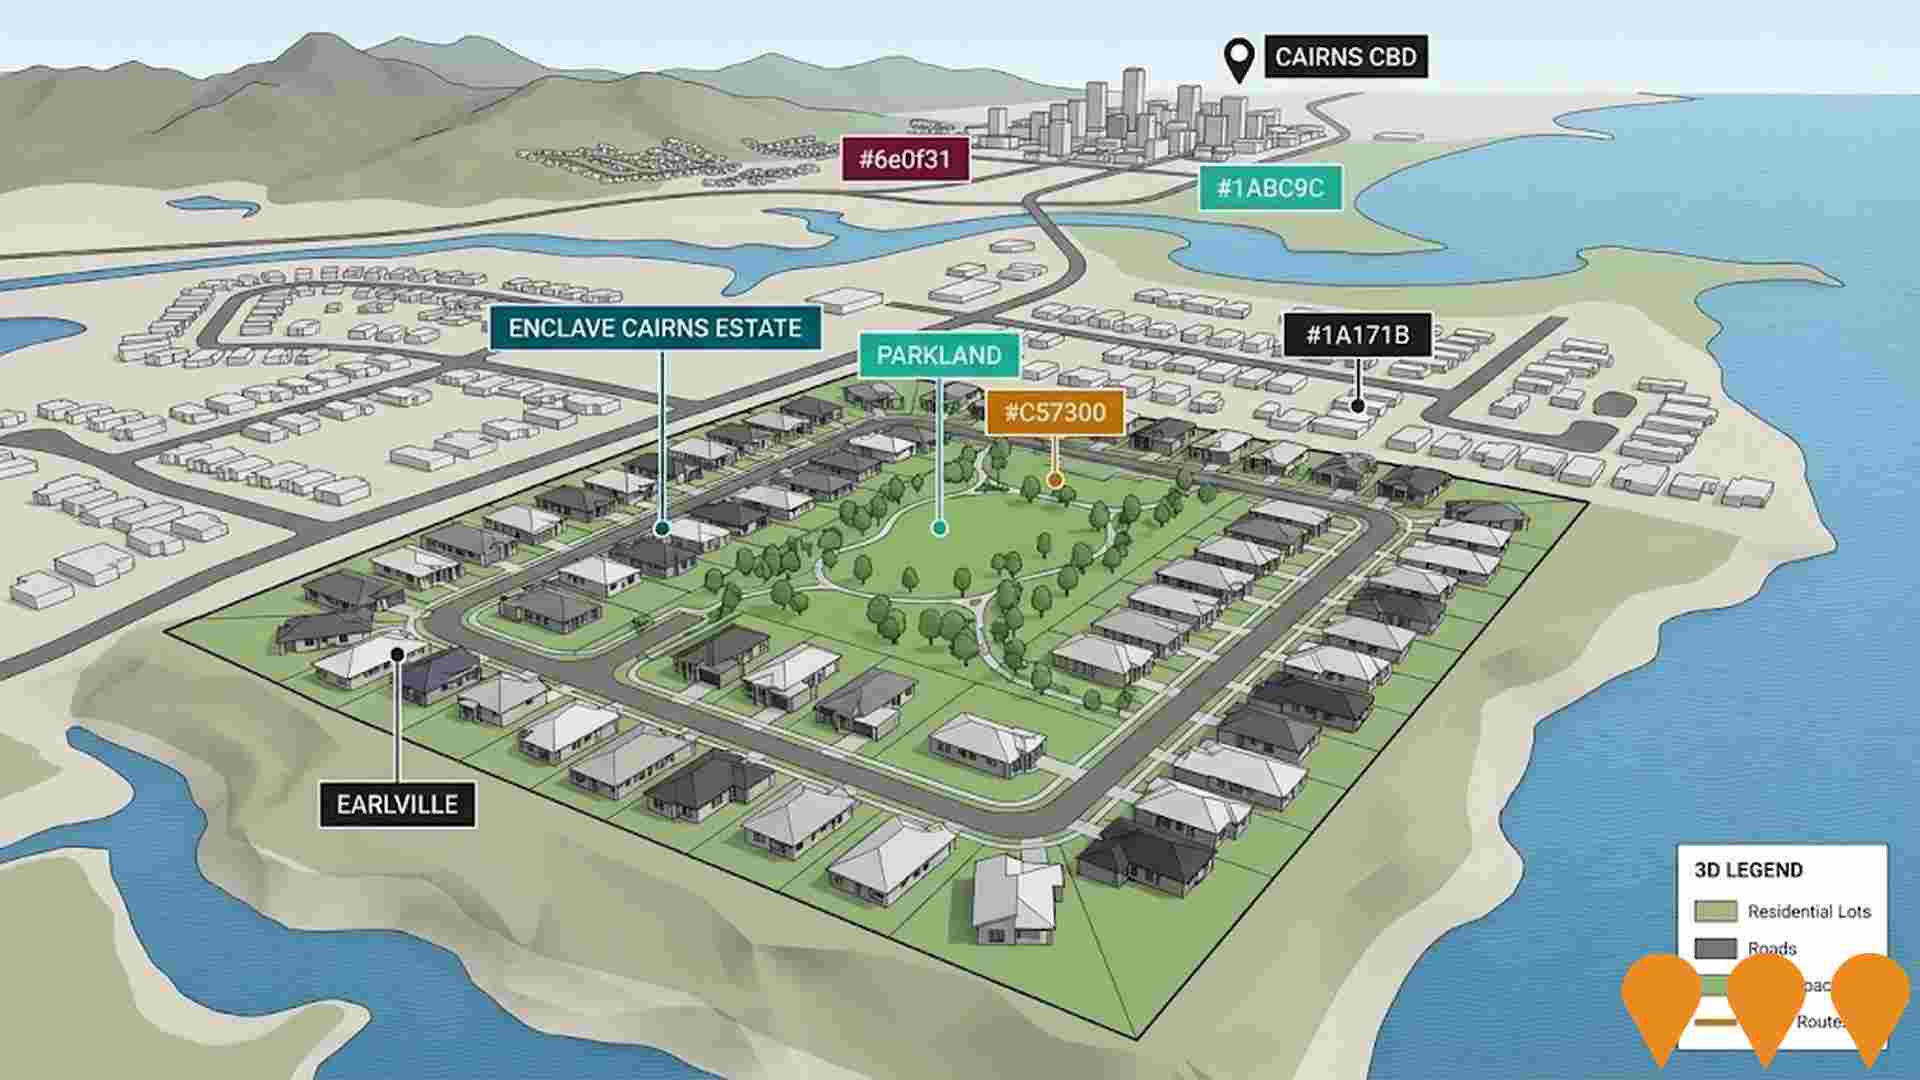
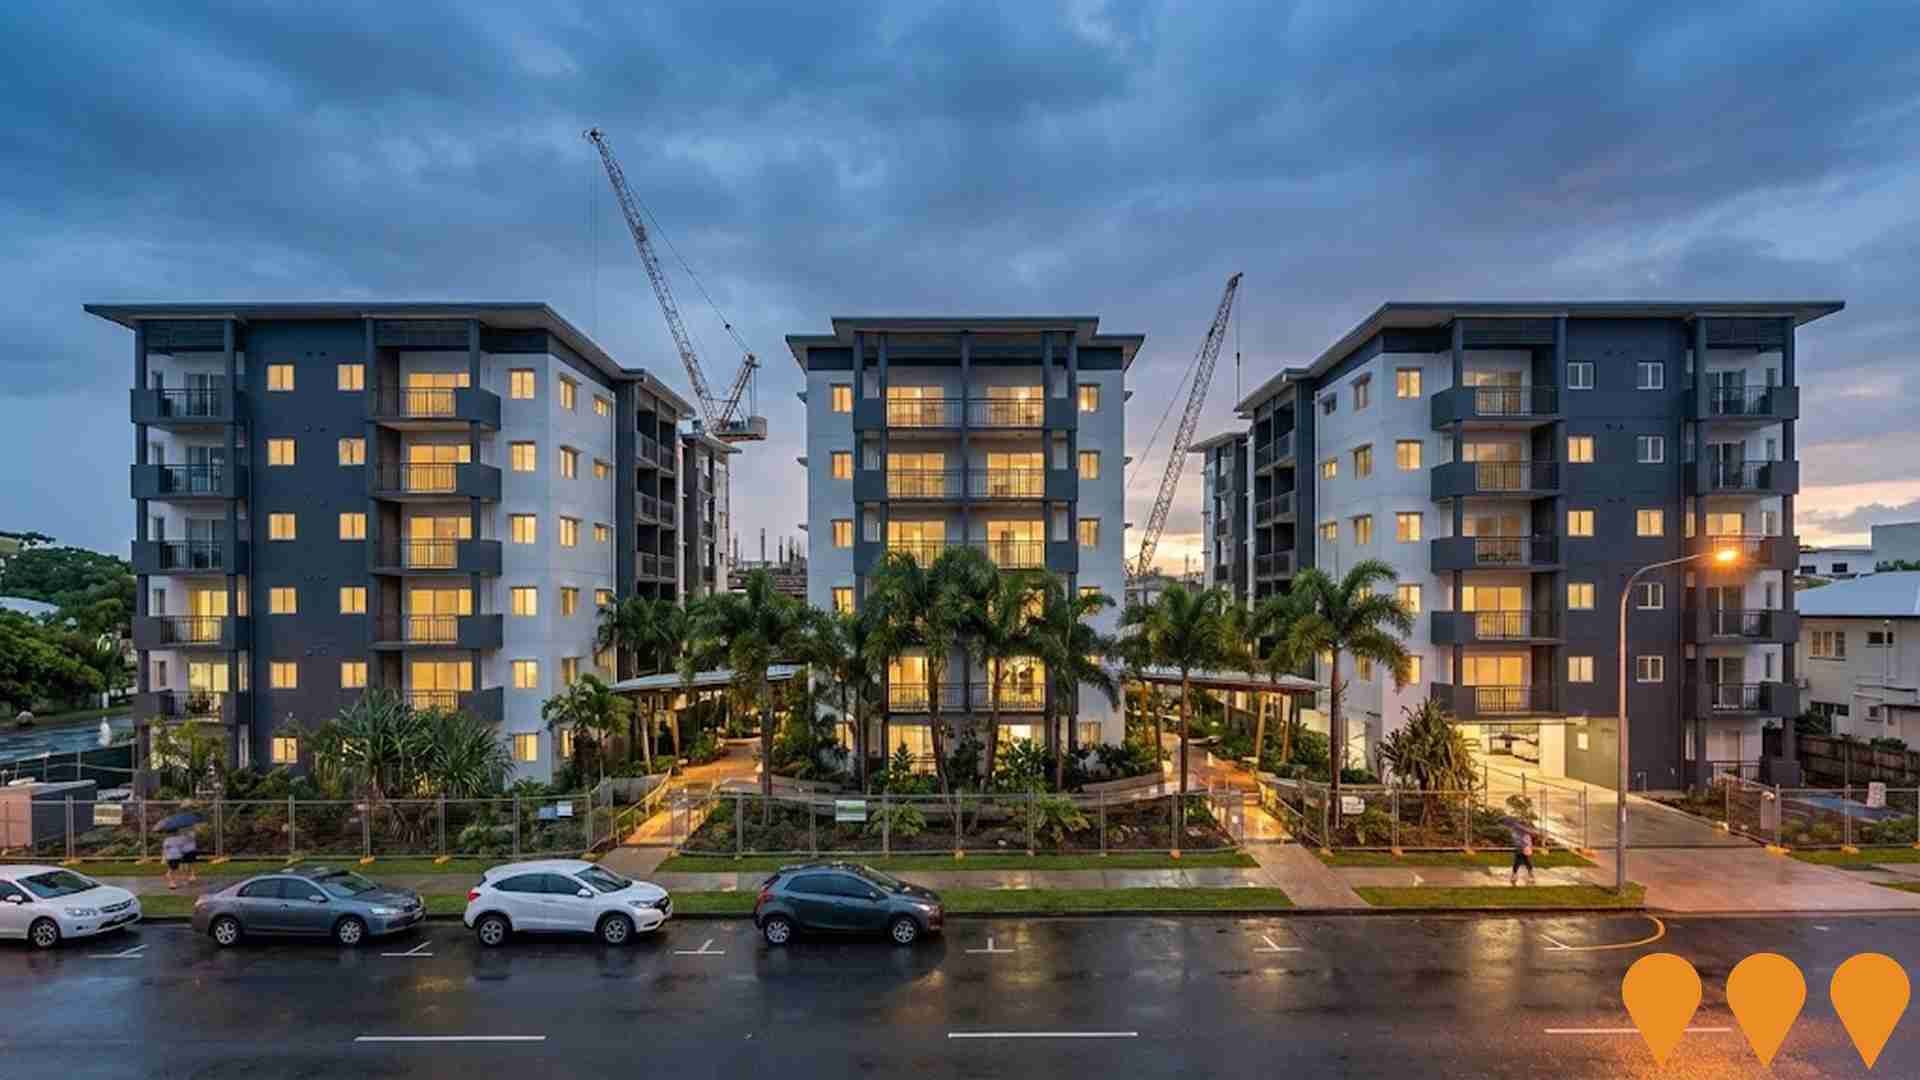
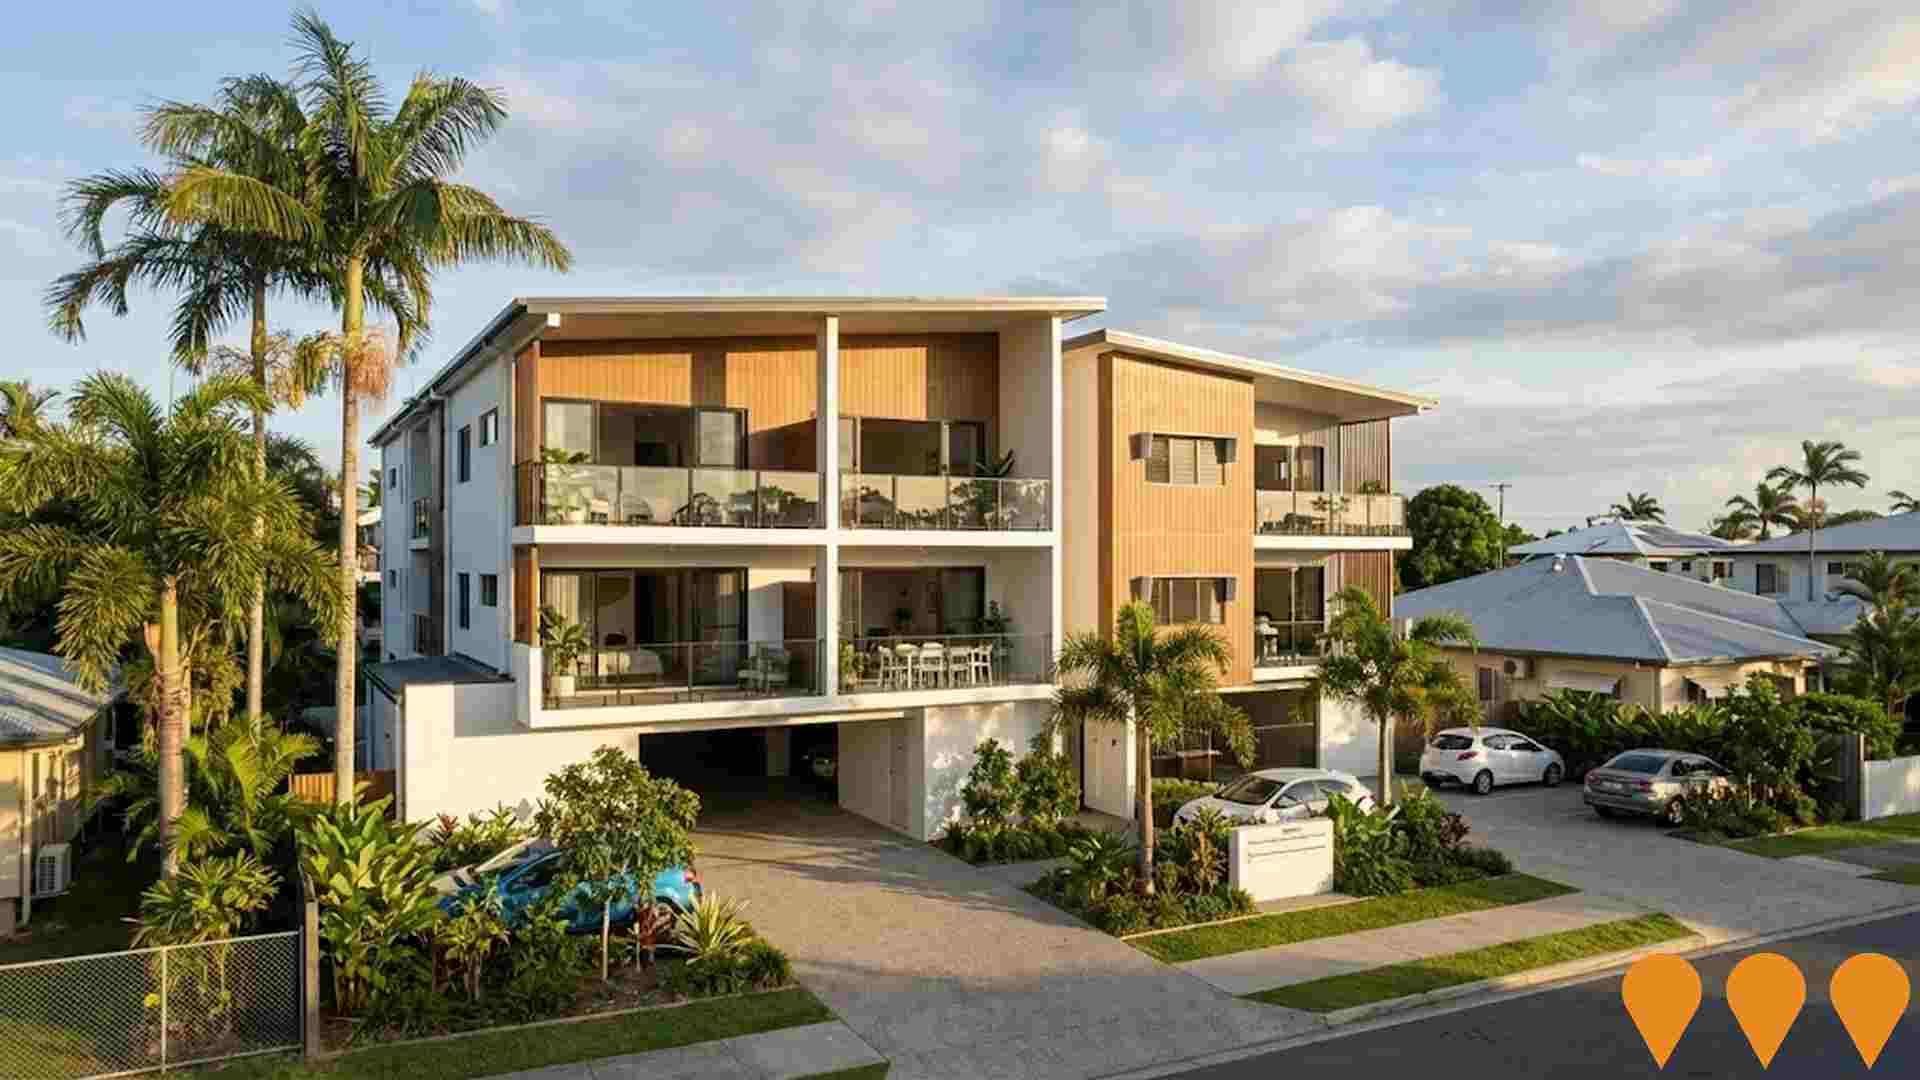
 Denotes AI-based impression for illustrative purposes only, not to be taken as definitive under any circumstances. Please follow links and conduct other investigations from the project's source for actual imagery. Developers and project owners wishing us to use original imagery please Contact Us and we will do so.
Frequently Asked Questions - Infrastructure
Far North Private Hospital
New 148-bed private hospital in Cairns South delivering acute medical, surgical, maternity, oncology, rehabilitation and mental health services to Far North Queensland. Stage 1 (88 beds) is under construction with completion expected mid-2027.

Raintrees Shopping Centre Redevelopment
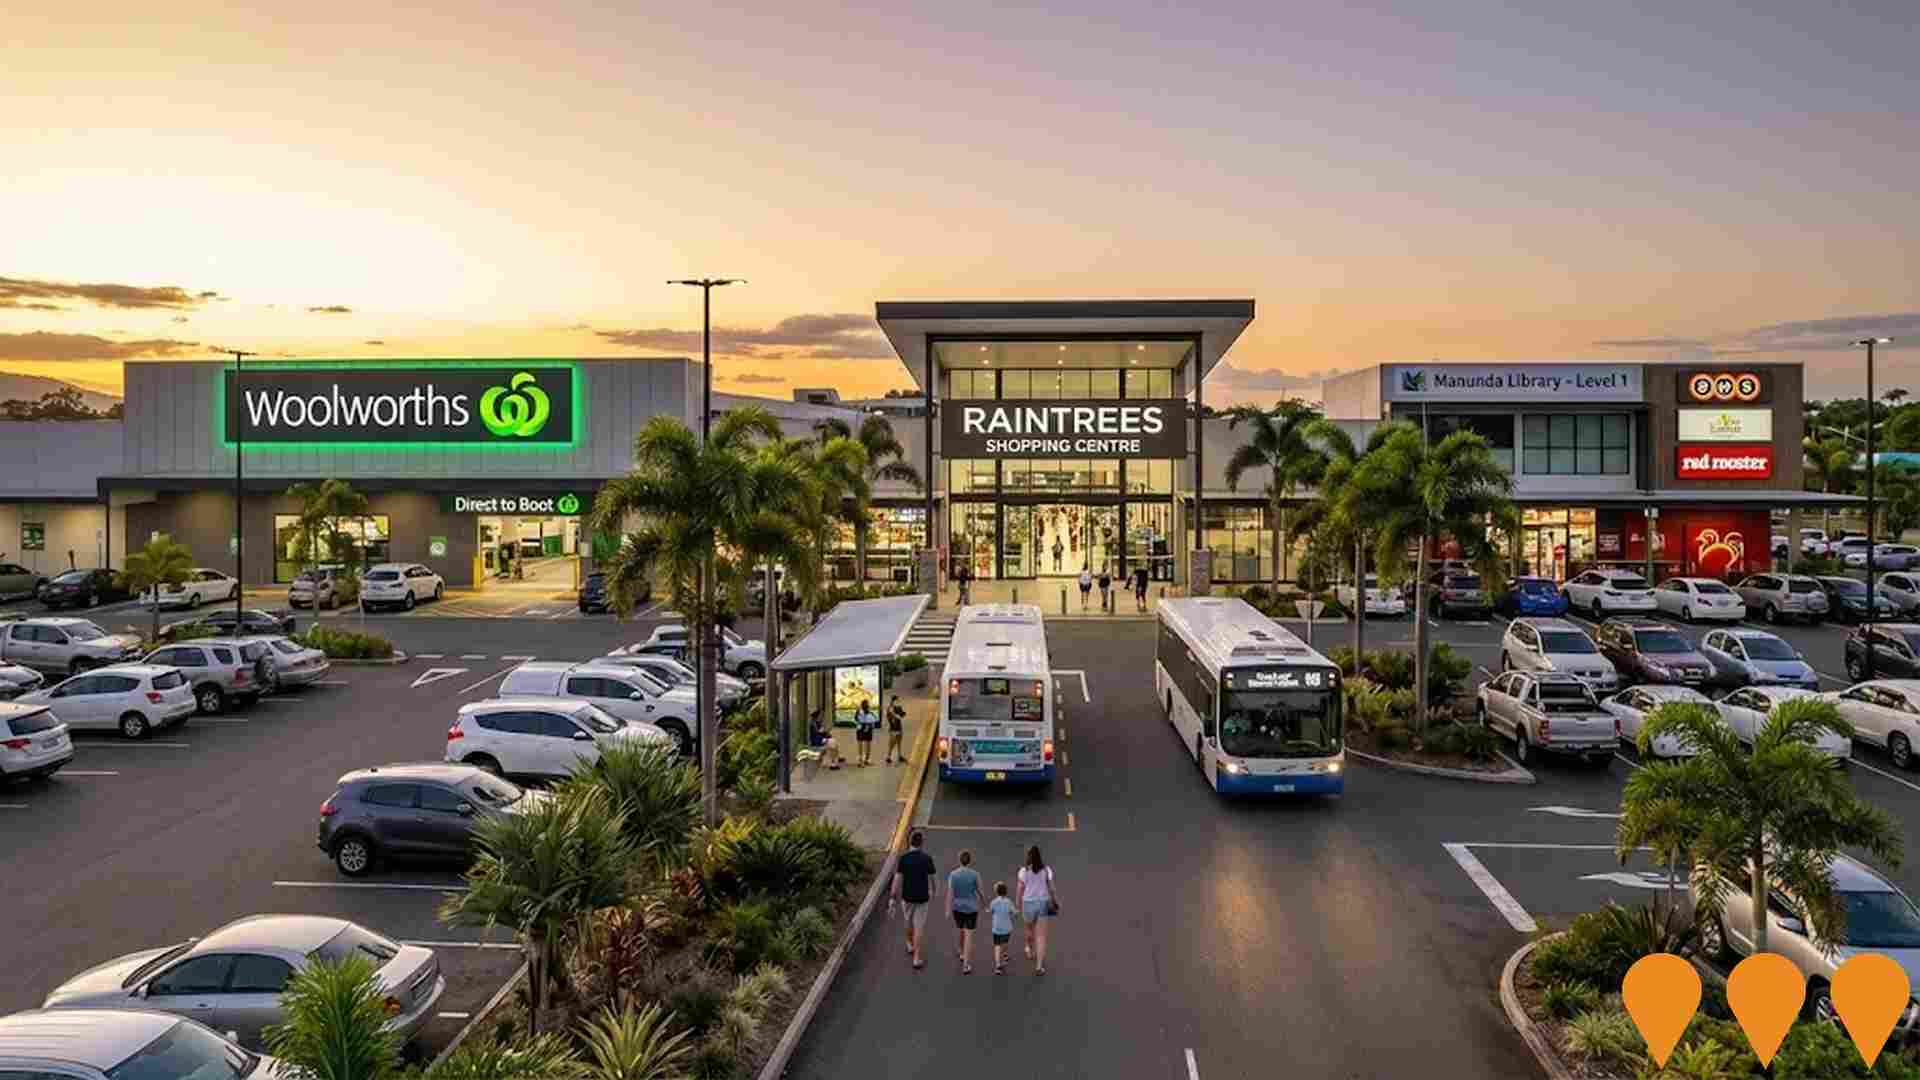
A multi-million dollar redevelopment of the sub-regional shopping centre comprising expansion and relocation of Woolworths supermarket, creation of a new retail mall with specialty stores, updates to existing entrances and carparking facilities, and relocation of Manunda Library to Level 1. The centre occupies 6.43 hectares with 687 carparks, serving the extensive residential population 4km south-west of Cairns CBD. Major tenants include Woolworths, Woolworths Petrol Plus, Red Rooster, Lincraft, BWS, Australia Post, and numerous local specialty stores. The new Woolworths store features an online delivery hub serving the wider north Queensland region and opened in August 2023, with the overall redevelopment completing in 2024.
Kamerunga to Woree Transmission Line Replacement Project
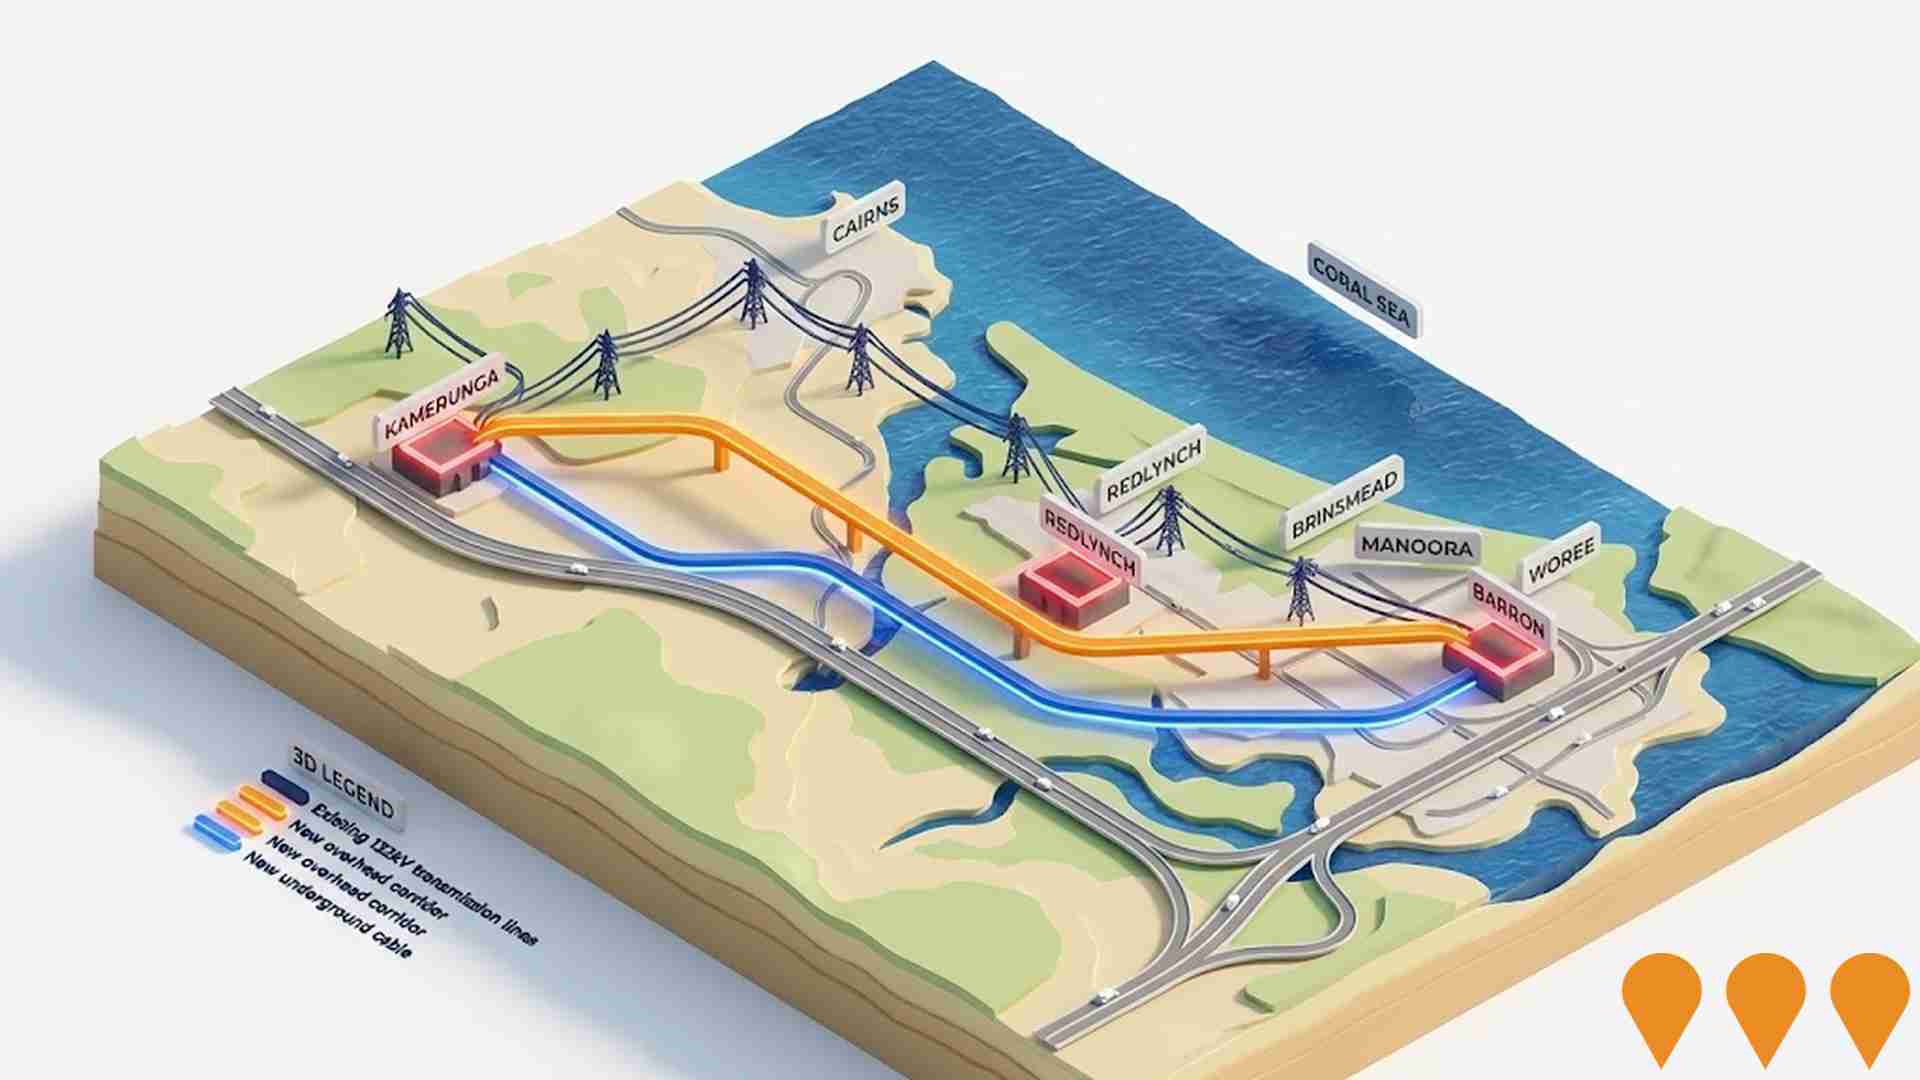
Replacement of aging 132kV transmission infrastructure to ensure safe, secure, and reliable electricity supply for northern Cairns. The project includes a 4.1km overhead transmission line between Kamerunga and Redlynch, a 10.4km underground transmission cable from Redlynch to Woree Substation, and a new substation in Barron to replace the existing Kamerunga Substation. Infrastructure originally built in the 1960s-1970s has reached end of technical service life.
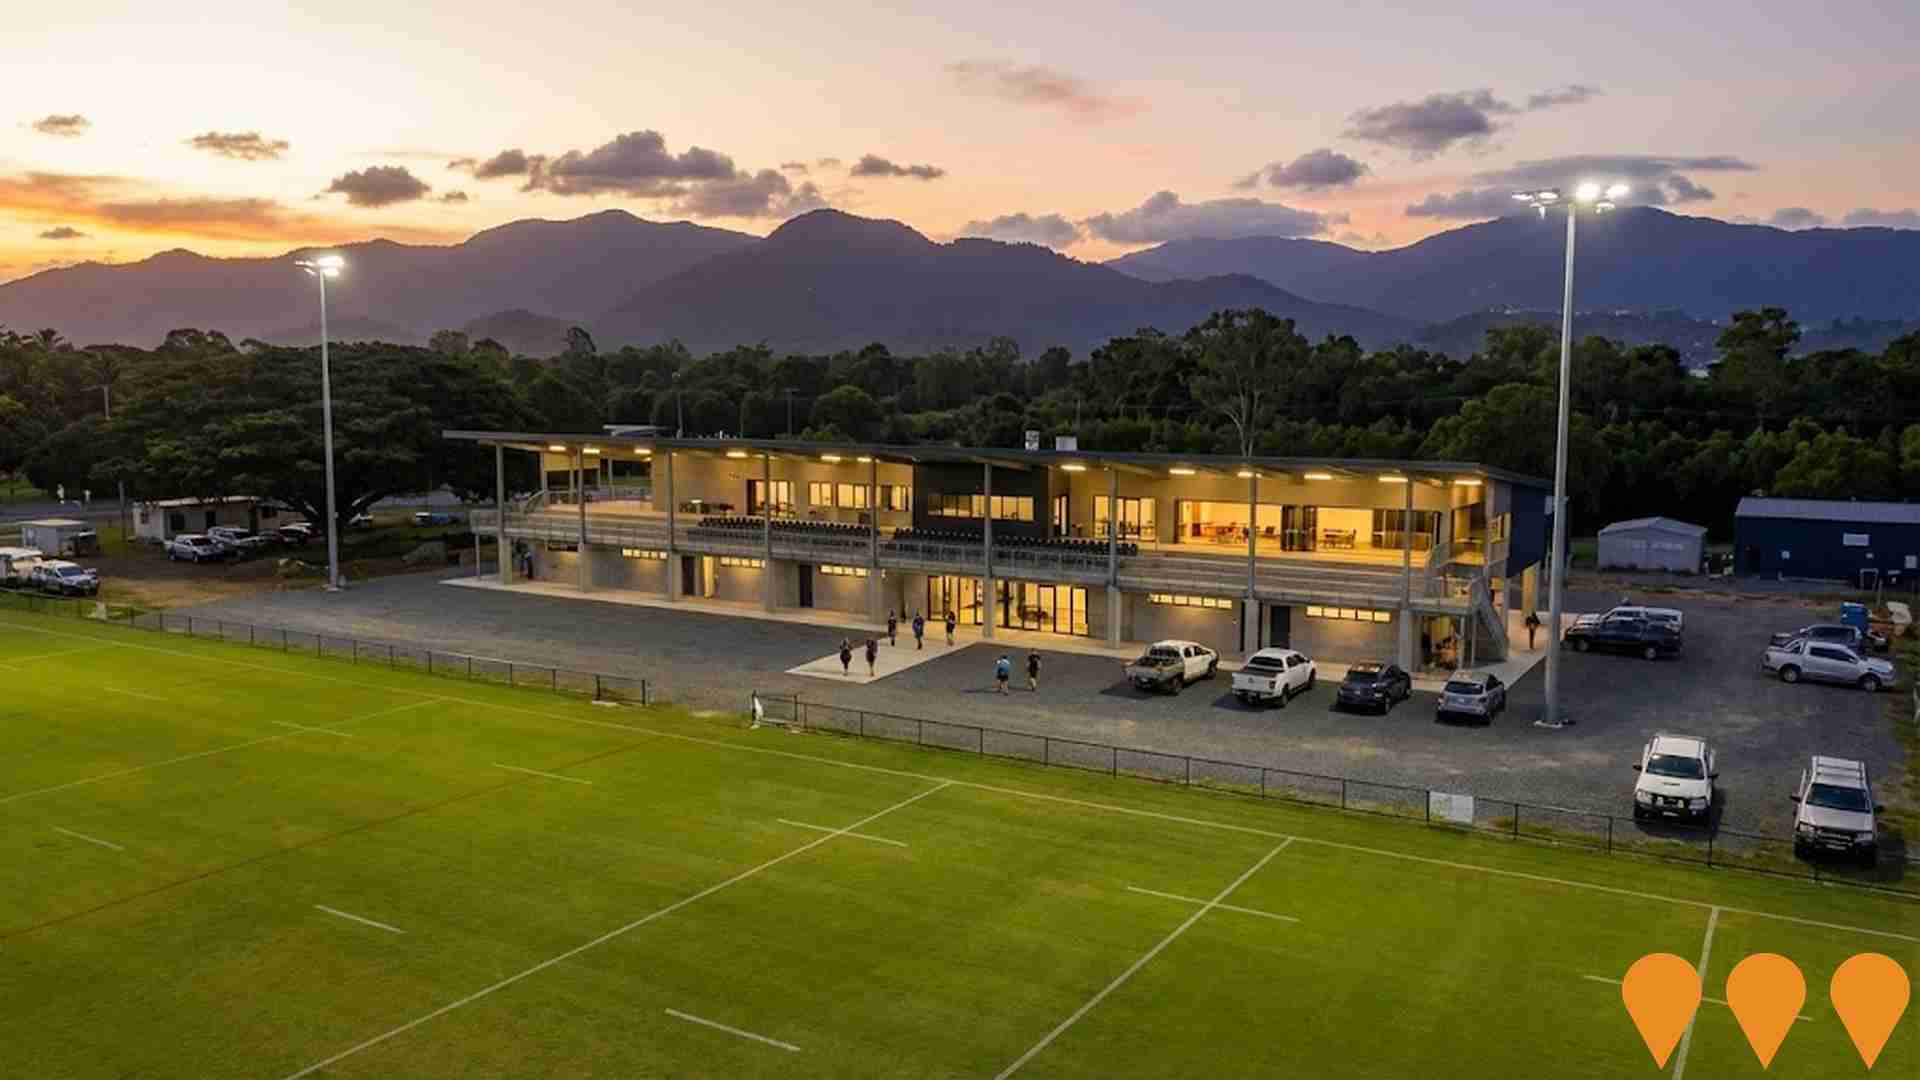
Stan Williams Park Upgrades
An $18 million two-stage redevelopment transforming Stan Williams Park into a premier sports and community facility in Far North Queensland. Stage 1 ($12M) completed mid-2025 features a two-level grandstand with 560 seats, modern changing rooms, gym, conference rooms, bar and kitchen facilities, and 2,500 sqm undercover spectator area. Stage 2 ($6M) approved by Queensland Government in June 2025 will add terraced seating, electronic scoreboard, advanced lighting, junior change rooms, and enhanced field facilities. The venue hosts state-level rugby league competitions and serves multiple sports and community programs.
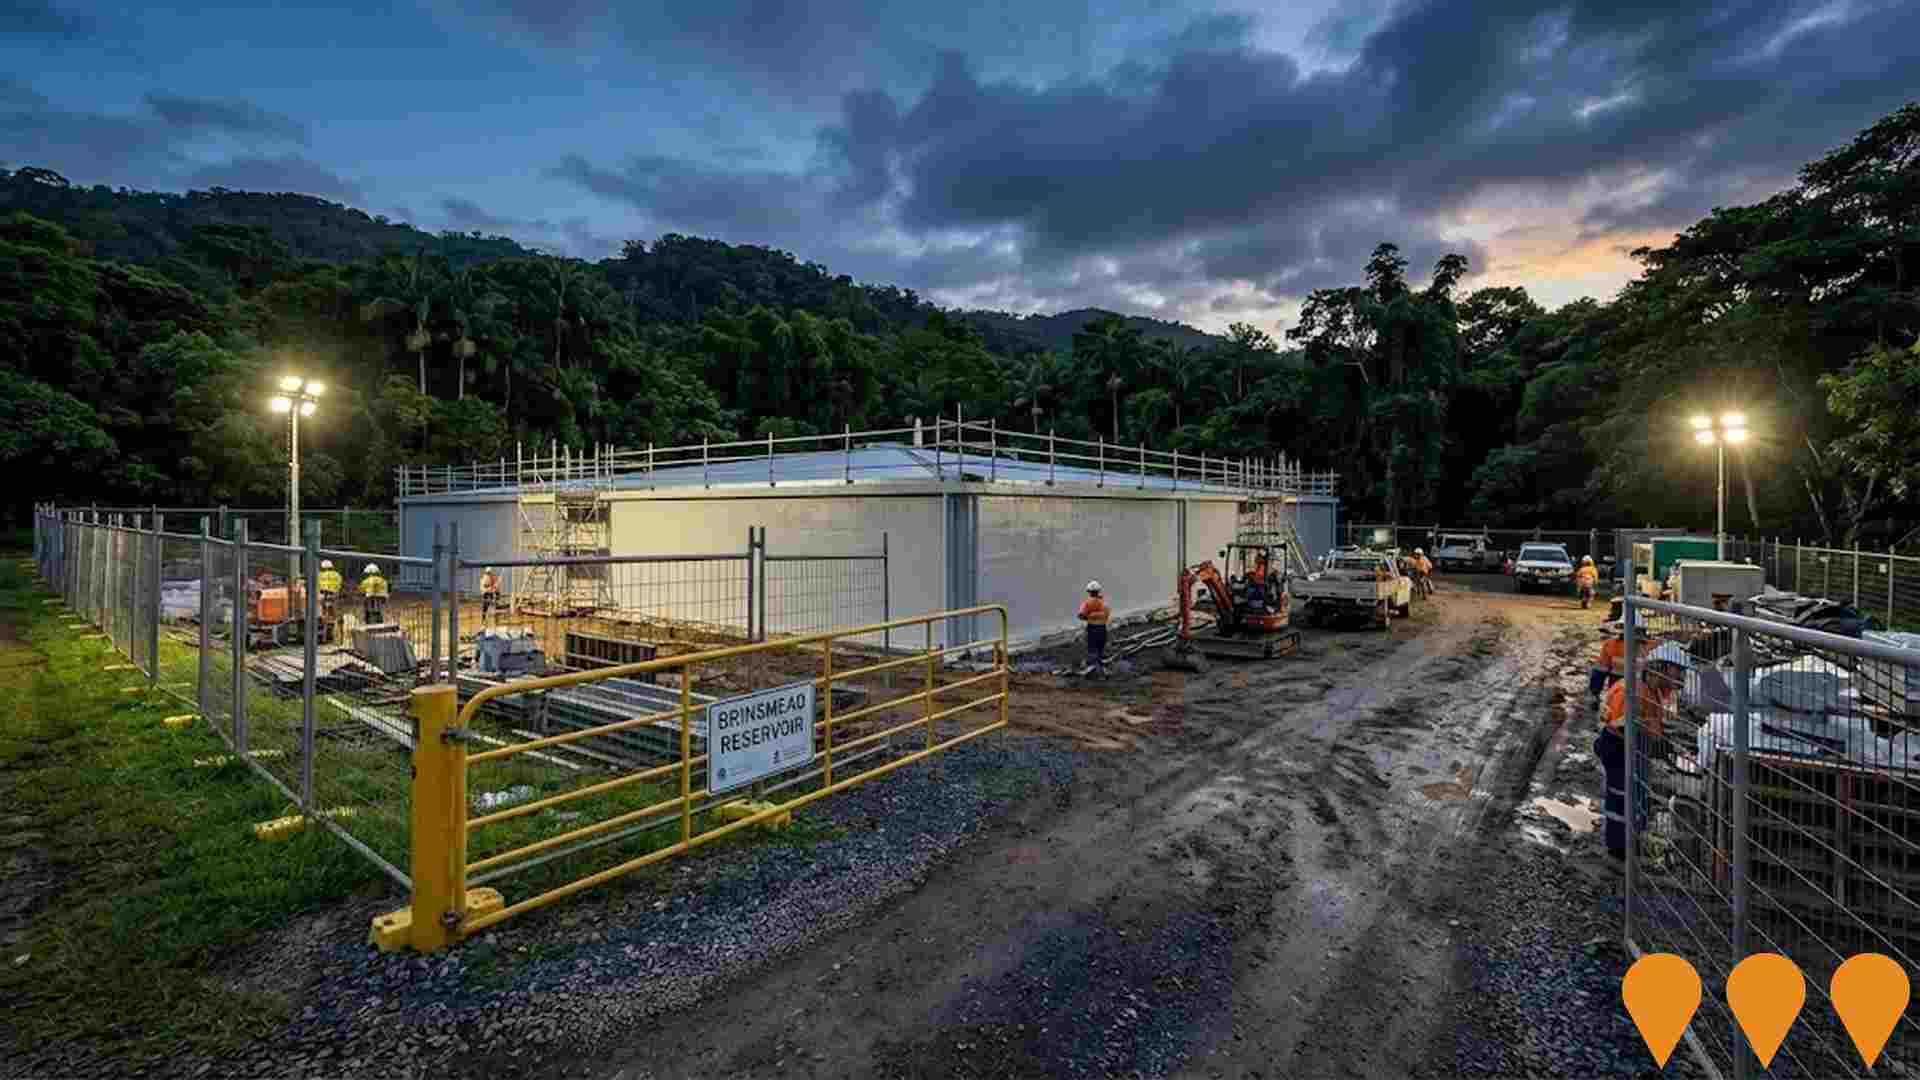
Cairns Reservoirs Remediation Package 2
Remediation works across nine reservoirs at eight sites in Cairns, including Mayer Street, Panguna, Bayview Large, Barron View, Runnymede, Brinsmead, Dempsey Street A and B, and Crest Close. The project involves concrete repairs, internal coatings, roof replacements, access upgrades, and road repairs to enhance water security and extend asset longevity.
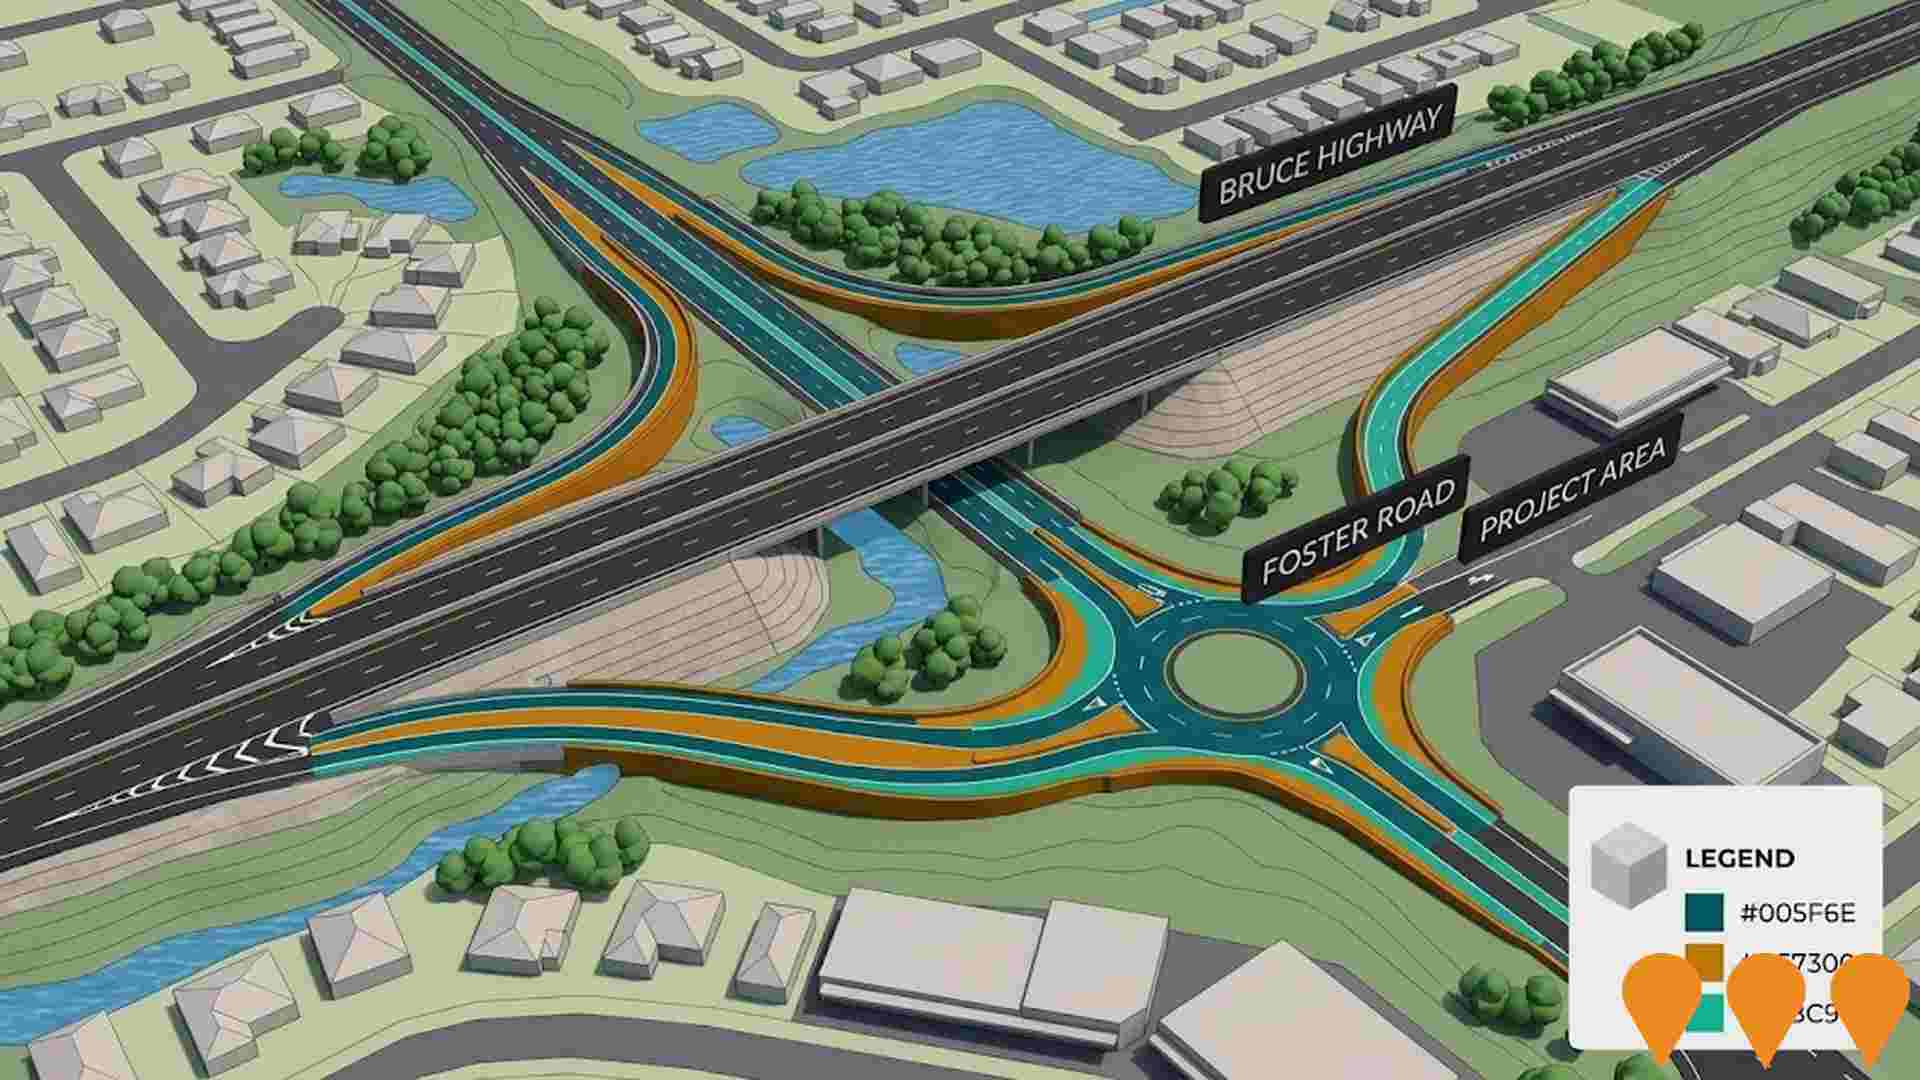
Bruce Highway Cairns Southern Access Corridor Stage 5 - Foster Road
Grade separation upgrade at Bruce Highway and Foster Road intersection. Part of broader Bruce Highway Upgrade Program with revised project cost of $550 million. Will reduce traffic congestion, improve safety and capacity, and reduce travel time as part of Cairns transport connectivity improvements.
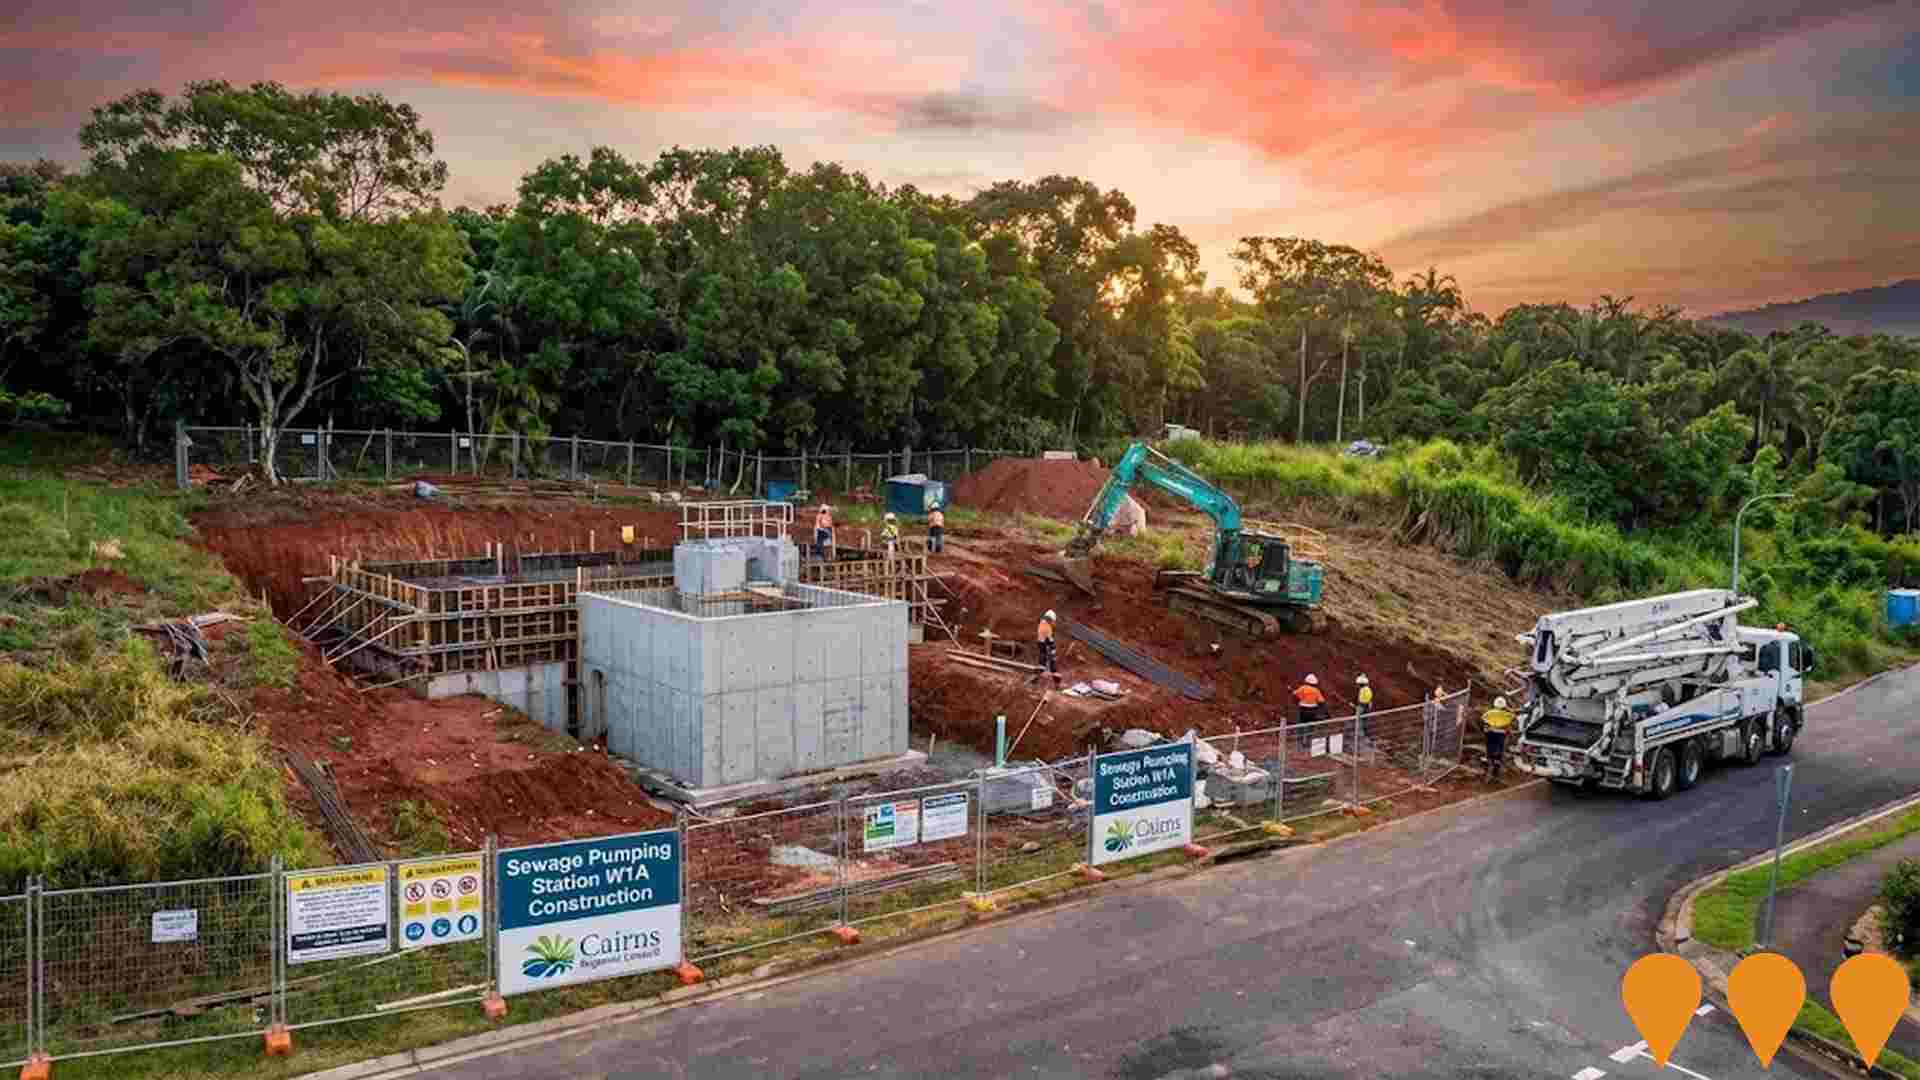
Sewage Pumping Station W1A
Construction of a new sewage pumping station to replace the existing 1976 SPSW1 structure. The project addresses structural deterioration and safety concerns while improving wastewater management capacity for the Whiterock catchment. The replacement station will ensure continued reliable sewerage services to the community with improved onsite safety and accessibility.
Bayview Heights to White Rock Underground Cable Project
Essential maintenance works on 2.7km of 275kV underground high voltage transmission cables installed in 1997, running between Bayview Heights and White Rock transition stations. The project includes vegetation management with removal of approximately 385 trees posing risks to underground cables, refurbishment of two cable joint bay sites near Alpinia Terrace and Amazon Close, easement restoration with planting of approximately 24,000 compatible plant species, installation of new amenities including water bubblers, park benches and shade structures along Crowley Creek walking path, and realignment and repair of sections of the walking path. Works are being delivered in partnership with local contractors including Cairns Conservation Services and ETS Infrastructure Management. The project is critical to maintaining reliable power supply for Cairns and Far North Queensland region.

Employment
Employment conditions in Kanimbla - Mooroobool remain below the national average according to AreaSearch analysis
Kanimbla - Mooroobool has a skilled workforce with essential services sectors well represented. The unemployment rate is 4.6%.
As of September 2025, there are 5,431 residents employed, with an unemployment rate of 4.6%, which is 0.5% higher than the Rest of Qld's rate of 4.1%. Workforce participation stands at 63.5%, slightly higher than the Rest of Qld's 59.1%. Employment is concentrated in health care & social assistance, retail trade, and accommodation & food services. Notably, employment in health care & social assistance is at 1.2 times the regional average, while agriculture, forestry & fishing shows lower representation at 0.9% compared to the regional average of 4.5%.
Over the year to September 2025, labour force levels decreased by 1.8%, and employment declined by 3.4%, leading to a rise in unemployment by 1.5 percentage points. In contrast, Rest of Qld saw employment grow by 1.7% over the same period. State-level data as of 25-Nov shows Queensland's employment contracted by 0.01%, with an unemployment rate of 4.2%. National employment forecasts from May-25 project a growth of 6.6% over five years and 13.7% over ten years. Applying these projections to Kanimbla - Mooroobool's employment mix suggests local employment should increase by 6.7% over five years and 14.0% over ten years, assuming constant population projections.
Frequently Asked Questions - Employment
Income
Income levels sit below national averages according to AreaSearch assessment
According to AreaSearch's aggregation of the latest postcode level ATO data released for financial year 2022, Kanimbla - Mooroobool SA2 had a median income among taxpayers of $48,770. The average income stood at $60,655. This is lower than average on a national basis, with Rest of Qld having levels of $50,780 and $64,844 respectively. Based on Wage Price Index growth of 13.99% since financial year 2022, current estimates for September 2025 would be approximately $55,593 (median) and $69,141 (average). From the Census conducted in August 2021, household, family and personal incomes all rank modestly in Kanimbla - Mooroobool, between the 45th and 47th percentiles. Income analysis reveals that 34.4% of the population, comprising 3,577 individuals, fall within the $1,500 - 2,999 income range, mirroring the region where 31.7% occupy this bracket. After housing expenses, 85.6% of income remains for other expenses. The area's SEIFA income ranking places it in the 5th decile.
Frequently Asked Questions - Income
Housing
Kanimbla - Mooroobool is characterized by a predominantly suburban housing profile, with above-average rates of outright home ownership
Kanimbla - Mooroobool's dwelling structure, as per the latest Census, consisted of 82.9% houses and 17.1% other dwellings (semi-detached, apartments, 'other' dwellings). This compares to Non-Metro Qld's 68.4% houses and 31.6% other dwellings. Home ownership in Kanimbla - Mooroobool was at 31.7%, with mortgaged dwellings at 39.0% and rented ones at 29.3%. The median monthly mortgage repayment was $1,625, higher than Non-Metro Qld's average of $1,517. The median weekly rent figure was $345, compared to Non-Metro Qld's $315. Nationally, Kanimbla - Mooroobool's mortgage repayments were lower at $1,625 than the Australian average of $1,863, and rents were less at $345 than the national figure of $375.
Frequently Asked Questions - Housing
Household Composition
Kanimbla - Mooroobool has a typical household mix, with a higher-than-average median household size
Family households constitute 72.9% of all households, including 30.7% couples with children, 27.0% couples without children, and 13.9% single parent families. Non-family households account for the remaining 27.1%, with lone person households at 23.4% and group households comprising 3.8% of the total. The median household size is 2.6 people, larger than the Rest of Qld average of 2.4.
Frequently Asked Questions - Households
Local Schools & Education
Kanimbla - Mooroobool faces educational challenges, with performance metrics placing it in the bottom quartile of areas assessed nationally
Educational qualifications in Kanimbla-Mooroobool trail regional benchmarks, with 23.2% of residents aged 15+ holding university degrees compared to the national average of 30.4%. Bachelor degrees are most prevalent at 17.0%, followed by postgraduate qualifications (3.6%) and graduate diplomas (2.6%). Vocational credentials are also common, with 37.7% of residents aged 15+ holding such qualifications – advanced diplomas account for 11.0% and certificates for 26.7%. Educational participation is high, with 30.9% of residents currently enrolled in formal education.
This includes 10.7% in primary education, 10.3% in secondary education, and 4.0% pursuing tertiary education.
Frequently Asked Questions - Education
Schools Detail
Nearby Services & Amenities
Transport
Transport servicing is low compared to other areas nationally based on assessment of service frequency, route connectivity and accessibility
Transport analysis shows 15 active transport stops operating within Kanimbla - Mooroobool. These stops serve a mix of bus routes, totaling 9 individual routes. Collectively, they provide 918 weekly passenger trips.
Transport accessibility is rated good, with residents typically located 387 meters from the nearest stop. Service frequency averages 131 trips per day across all routes, equating to approximately 61 weekly trips per individual stop.
Frequently Asked Questions - Transport
Transport Stops Detail
Health
The level of general health in Kanimbla - Mooroobool is notably higher than the national average with both young and old age cohorts seeing low prevalence of common health conditions
Kanimbla - Mooroobool shows superior health outcomes for both youth and elderly residents, with low prevalence rates for common health conditions. Approximately half (50%) of its total population (~5,199 people) has private health cover, lower than the national average of 55.3%.
The most prevalent medical issues are arthritis and mental health problems, affecting 6.6% and 6.6% of residents respectively. Conversely, 73.1% report no medical ailments, compared to 71.7% in Rest of Qld. The area has a higher proportion of seniors aged 65 and over at 17.2% (1,788 people), compared to the Rest of Qld's 15.7%. Despite this, health outcomes among seniors are notably strong, mirroring those of the general population.
Frequently Asked Questions - Health
Cultural Diversity
The level of cultural diversity witnessed in Kanimbla - Mooroobool was found to be above average when compared nationally for a number of language and cultural background related metrics
Kanimbla-Mooroobool has a higher cultural diversity than most local areas, with 27.3% of its population born overseas and 23.6% speaking languages other than English at home. Christianity is the predominant religion in Kanimbla-Mooroobool, accounting for 51.6% of the population. Hinduism, however, is more prevalent here compared to the rest of Queensland, making up 4.5% versus 1.3%.
The top three ancestry groups are English (22.2%), Australian (21.0%), and Other (17.4%). Some ethnic groups show notable differences: Samoan at 0.5% in Kanimbla-Mooroobool compared to 0.3% regionally, Australian Aboriginal at 5.0% versus 6.7%, and Filipino at 2.1% versus 1.8%.
Frequently Asked Questions - Diversity
Age
Kanimbla - Mooroobool's population is slightly older than the national pattern
Kanimbla - Mooroobool has a median age of 40, close to Rest of Qld's figure of 41 but exceeding the national norm of 38. The 45-54 age group is strongly represented at 14.0%, compared to Rest of Qld, while the 75-84 cohort is less prevalent at 5.4%. Post the 2021 Census, the 25-34 age group grew from 10.9% to 12.4%, and the 75-84 cohort increased from 4.2% to 5.4%. Conversely, the 5-14 cohort declined from 13.9% to 11.7%, and the 35-44 group dropped from 13.5% to 12.5%. By 2041, demographic modeling suggests Kanimbla - Mooroobool's age profile will significantly evolve, led by a 29% growth in the 25-34 group (373 people), reaching 1,666 from 1,292. Population declines are projected for the 45-54 and 5-14 cohorts.
