Chart Color Schemes
This analysis uses ABS Statistical Areas Level 2 (SA2) boundaries, which can materially differ from Suburbs and Localities (SAL) even when sharing similar names.
SA2 boundaries are defined by the Australian Bureau of Statistics and are designed to represent communities for statistical reporting (e.g., census and ERP).
Suburbs and Localities (SAL) represent commonly-used suburb/locality names (postal-style areas) and may use different geographic boundaries. For comprehensive analysis, consider reviewing both boundary types if available.
est. as @ -- *
ABS ERP | -- people | --
2021 Census | -- people
Sales Activity
Curious about local property values? Filter the chart to assess the volume and appreciation (including resales) trends and regional comparisons, or scroll to the map below view this information at an individual property level.
Find a Recent Sale
Sales Detail
Population
Population growth drivers in Redlynch are above average based on AreaSearch's ranking of recent, and medium to long-term trends
Redlynch's population is approximately 14,814 as of November 2025. This figure reflects a growth of 1,030 people since the 2021 Census, which recorded a population of 13,784. The increase is inferred from ABS data showing an estimated resident population of 14,757 in June 2024 and the addition of 414 validated new addresses post-Census. This results in a density ratio of 249 persons per square kilometer. Over the past decade, Redlynch has shown consistent growth with a compound annual growth rate of 1.5%, outperforming its SA4 region. Interstate migration contributed significantly to population growth, accounting for approximately 58.8% of overall gains.
AreaSearch uses ABS/Geoscience Australia projections for each SA2 area released in 2024, based on 2022 data. For areas not covered by this data and years post-2032, Queensland State Government's SA2 area projections from 2023, using 2021 data, are adopted. State projections lack age category splits; thus proportional growth weightings aligned with ABS Greater Capital Region projections (released in 2023, based on 2022 data) are applied. Future population dynamics project an above median growth for Australia's regional areas, with Redlynch expected to increase by 2,052 persons to 2041, reflecting a total increase of 13.4% over the 17-year period.
Frequently Asked Questions - Population
Development
AreaSearch assessment of residential development activity positions Redlynch among the top 25% of areas assessed nationwide
Redlynch has received approximately 118 dwelling approvals annually. Over the past five financial years, from FY21 to FY25, around 590 homes were approved, with an additional 50 approved in FY26 so far. On average, each new home attracts about 1.6 new residents per year over these five years.
The average construction cost of new properties is $255,000, which is below the regional average, indicating more affordable housing options. This financial year has seen around $24.8 million in commercial approvals, suggesting steady commercial investment activity. Compared to the rest of Queensland, Redlynch shows moderately higher new home approvals, with 15.0% above the regional average per person over the five-year period, offering reasonable buyer options while sustaining existing property demand.
The majority of new developments consist of standalone homes (98.0%) and a smaller proportion of attached dwellings (2.0%), maintaining the area's traditional low-density character with a focus on family homes. With around 148 people per approval, Redlynch reflects a developing area. Population forecasts indicate that Redlynch will gain approximately 1,993 residents by 2041, based on the latest AreaSearch quarterly estimate. Given current construction levels, housing supply is expected to meet demand adequately, creating favourable conditions for buyers and potentially enabling growth that could exceed current forecasts.
Frequently Asked Questions - Development
Infrastructure
Redlynch has very high levels of nearby infrastructure activity, ranking in the top 20% nationally
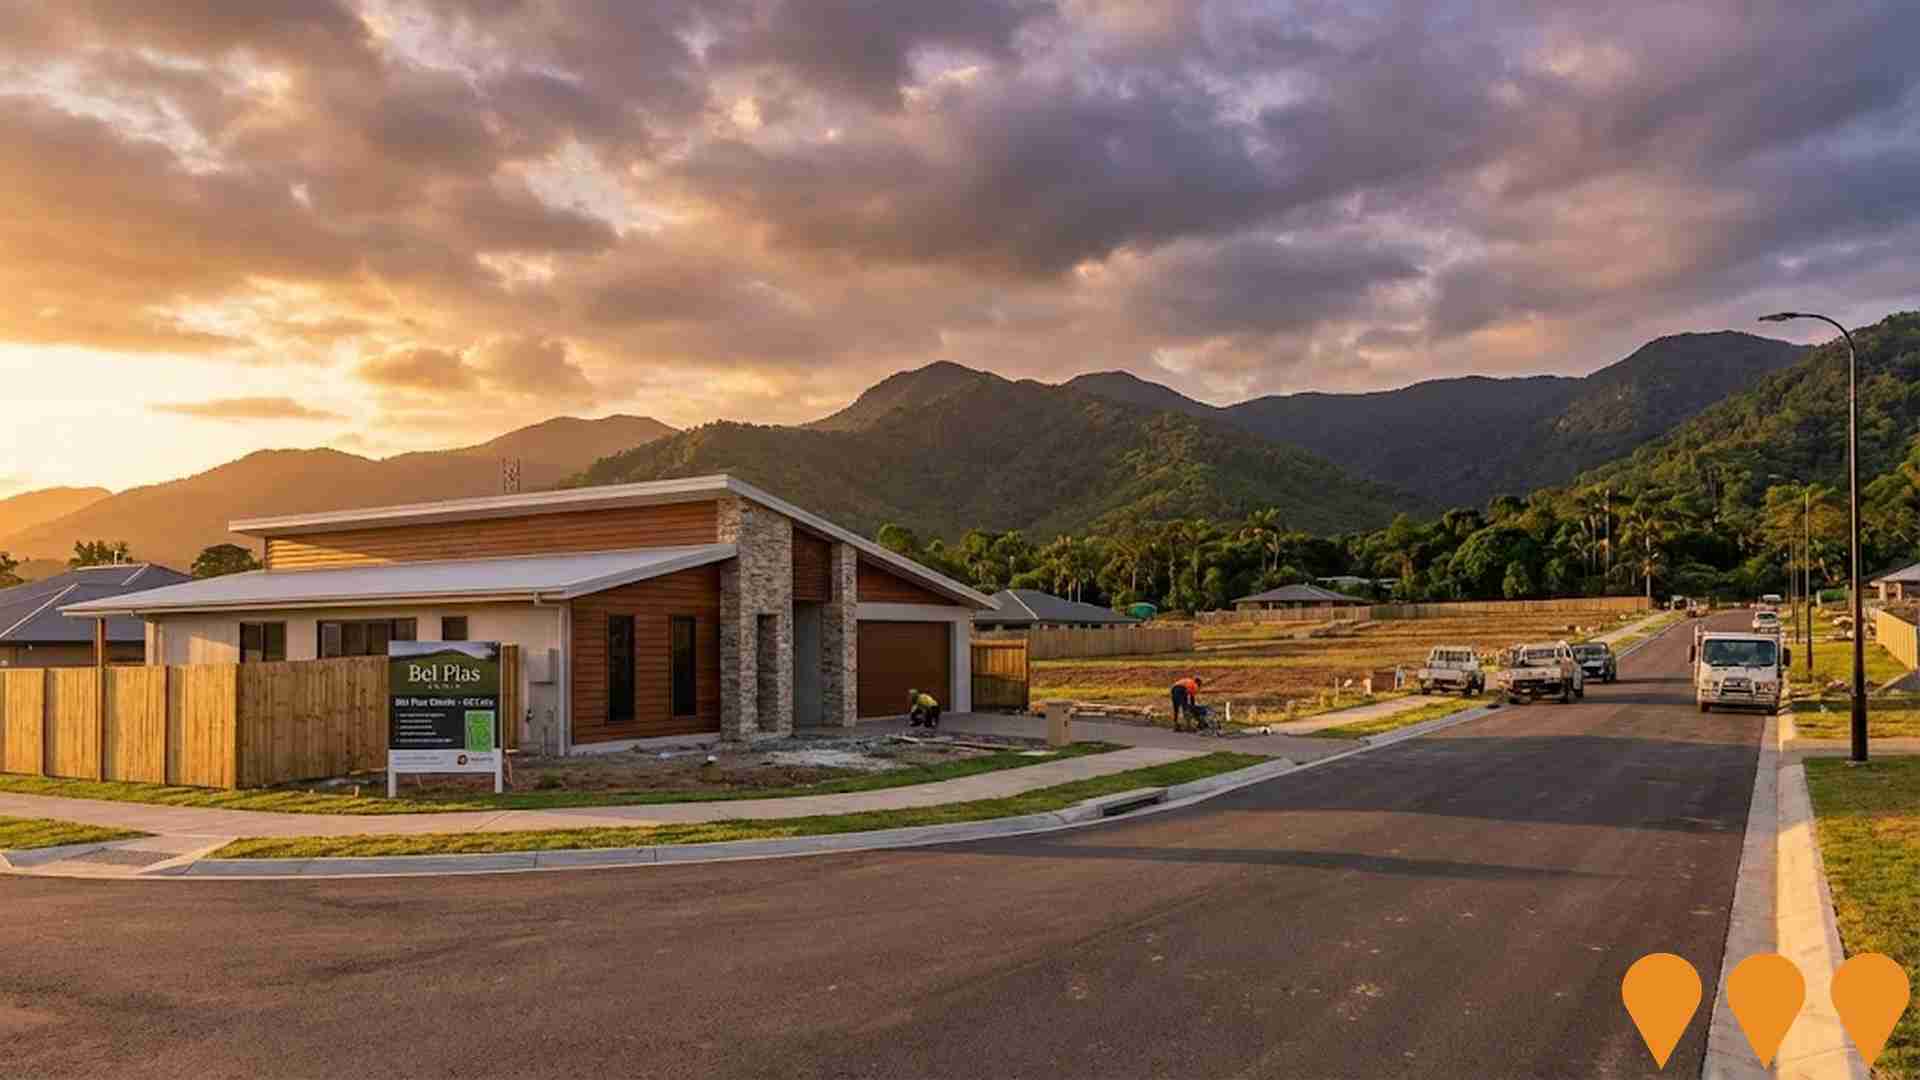
Changes to local infrastructure significantly impact an area's performance. AreaSearch has identified 53 projects likely to affect this region. Notable initiatives include Cairns Western Arterial Road Duplication, Bel Plas Estate, Larsen Place Estate, and Currunda Creek Development. The following list details those expected to have the most relevance.
Professional plan users can use the search below to filter and access additional projects.
INFRASTRUCTURE SEARCH
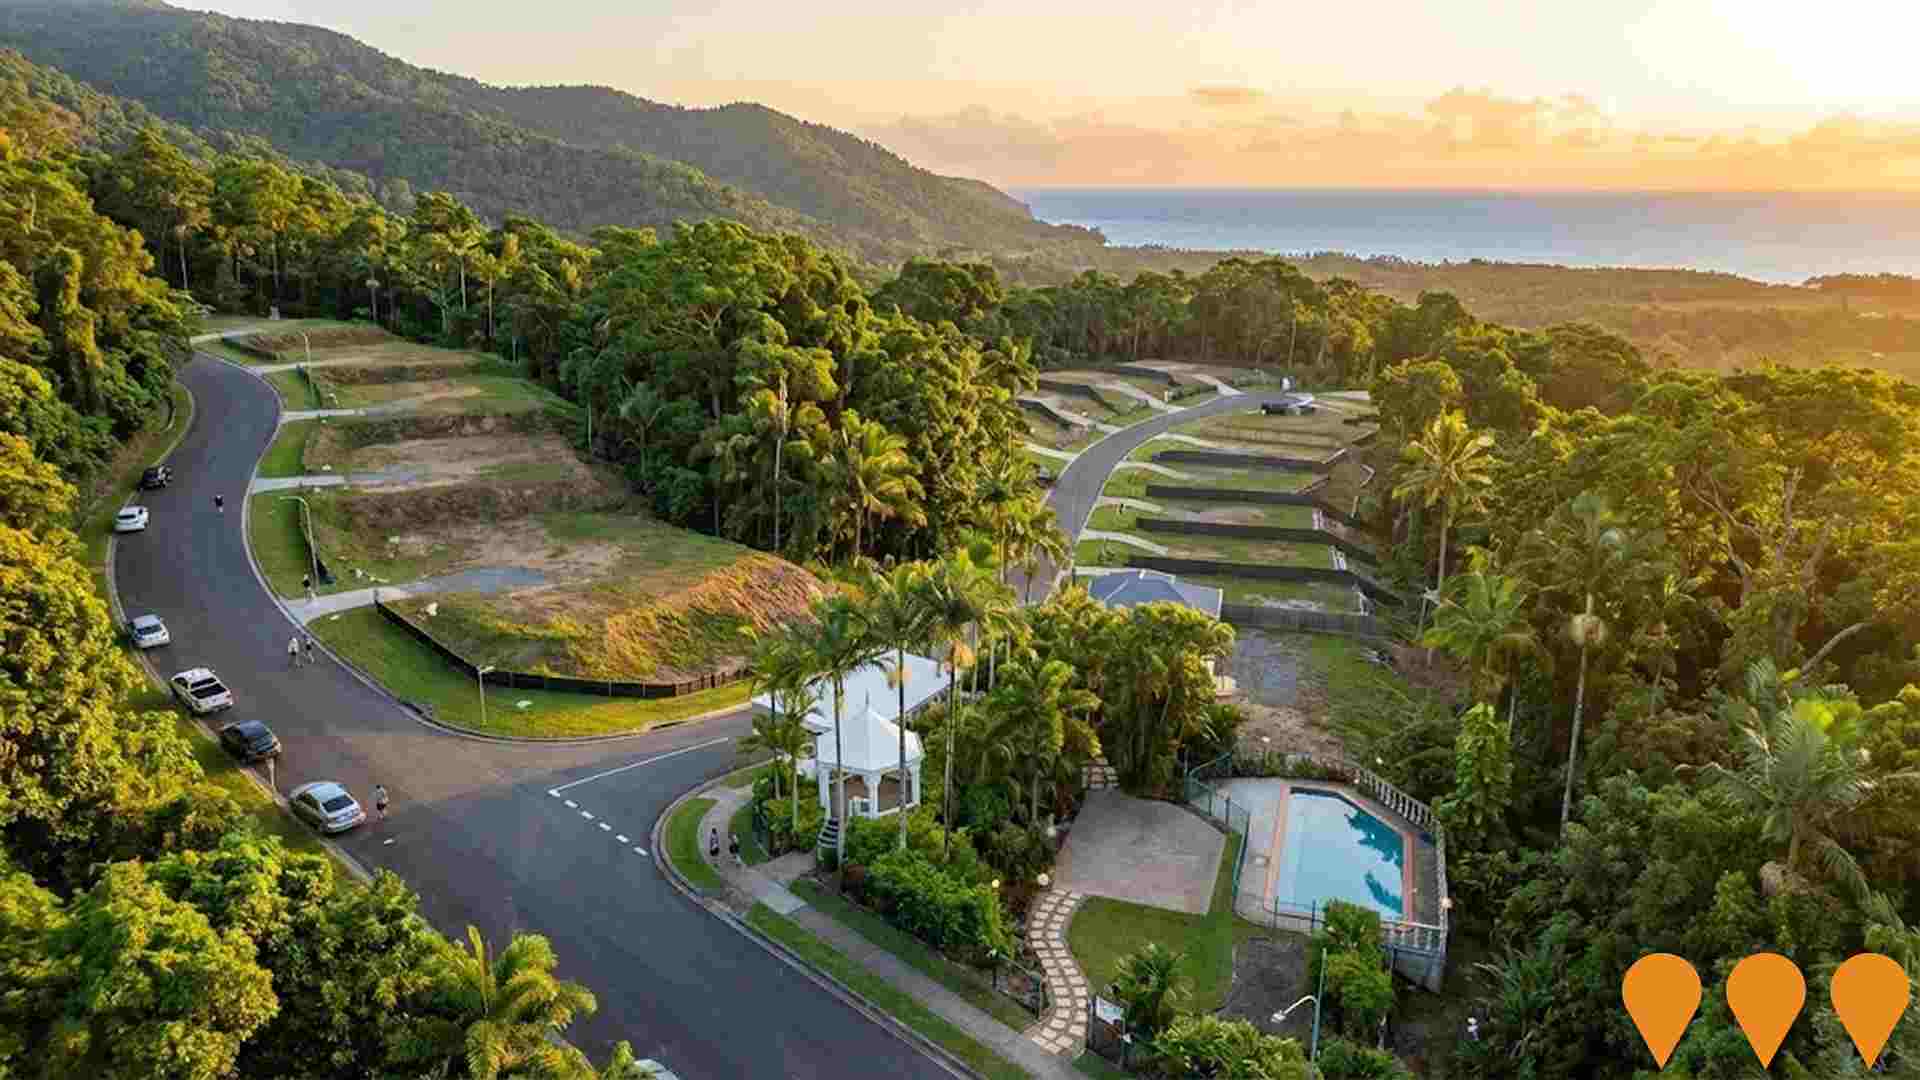
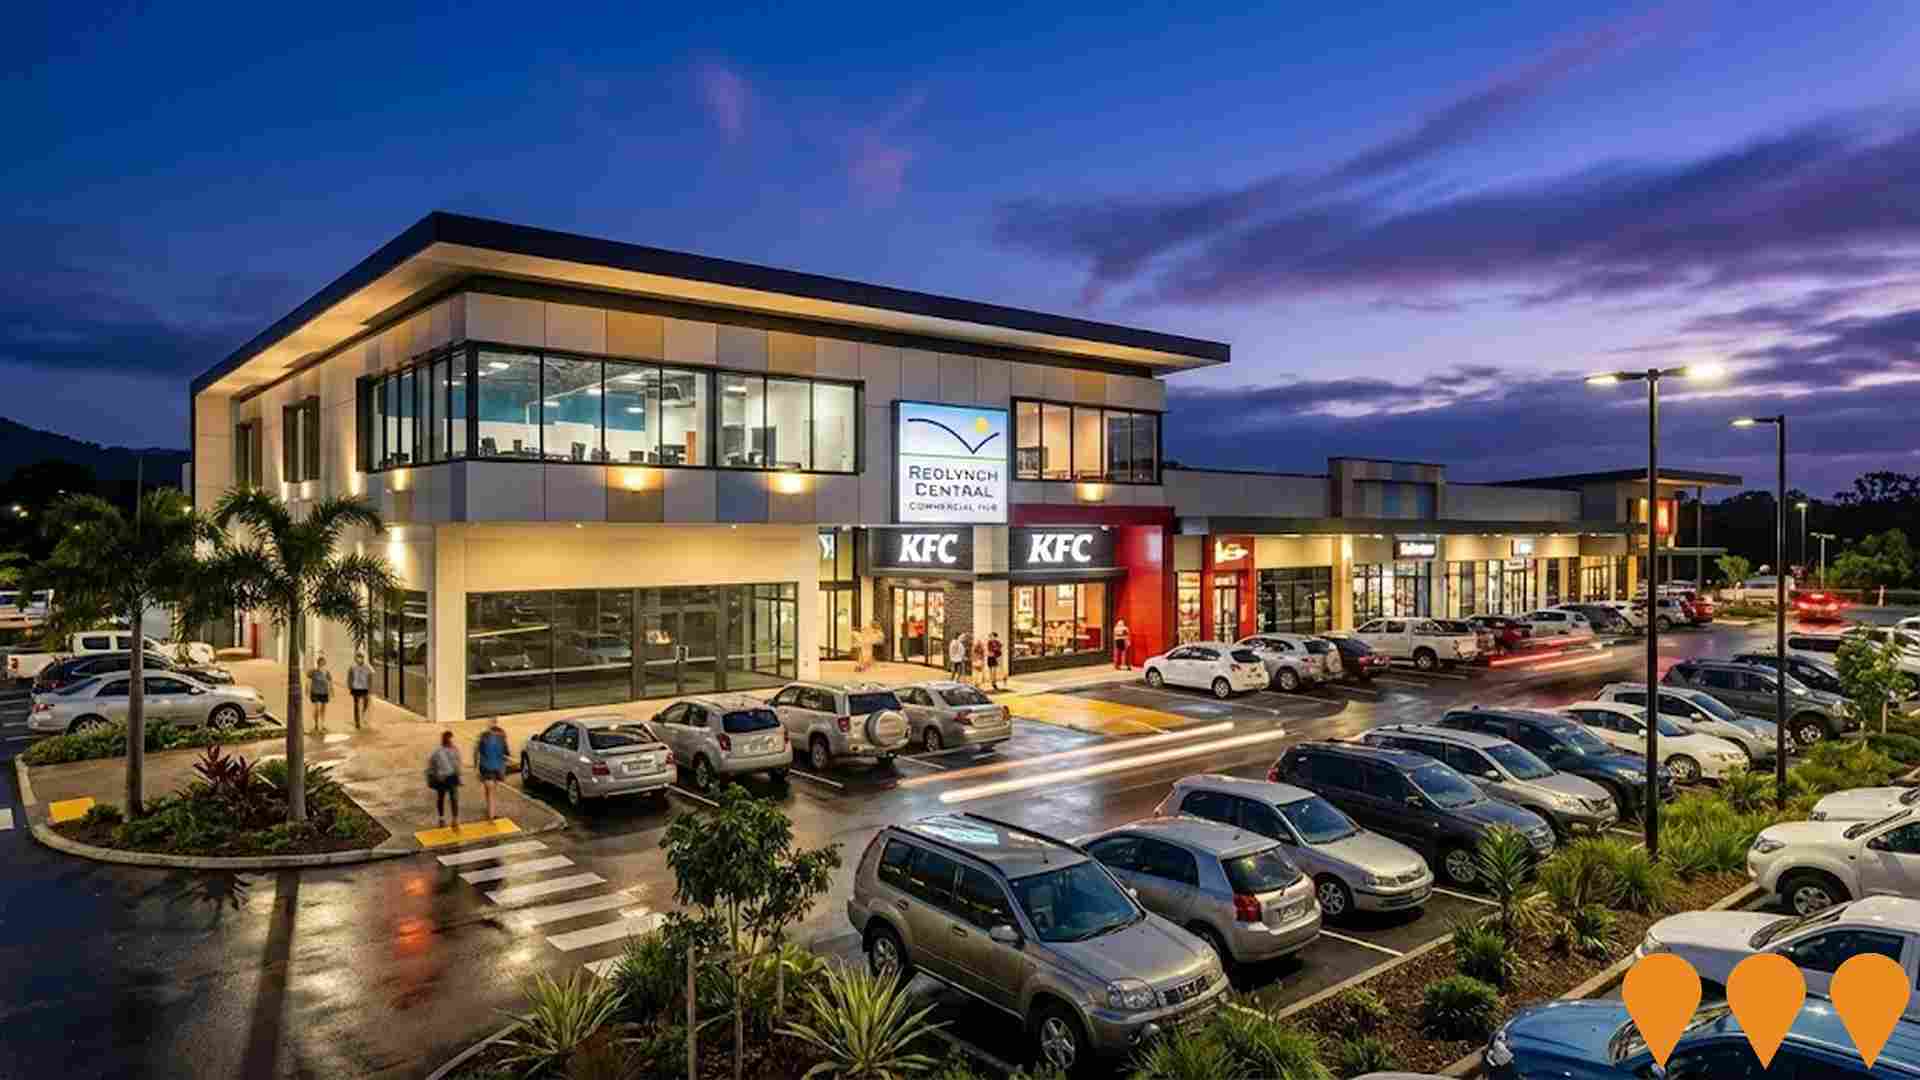
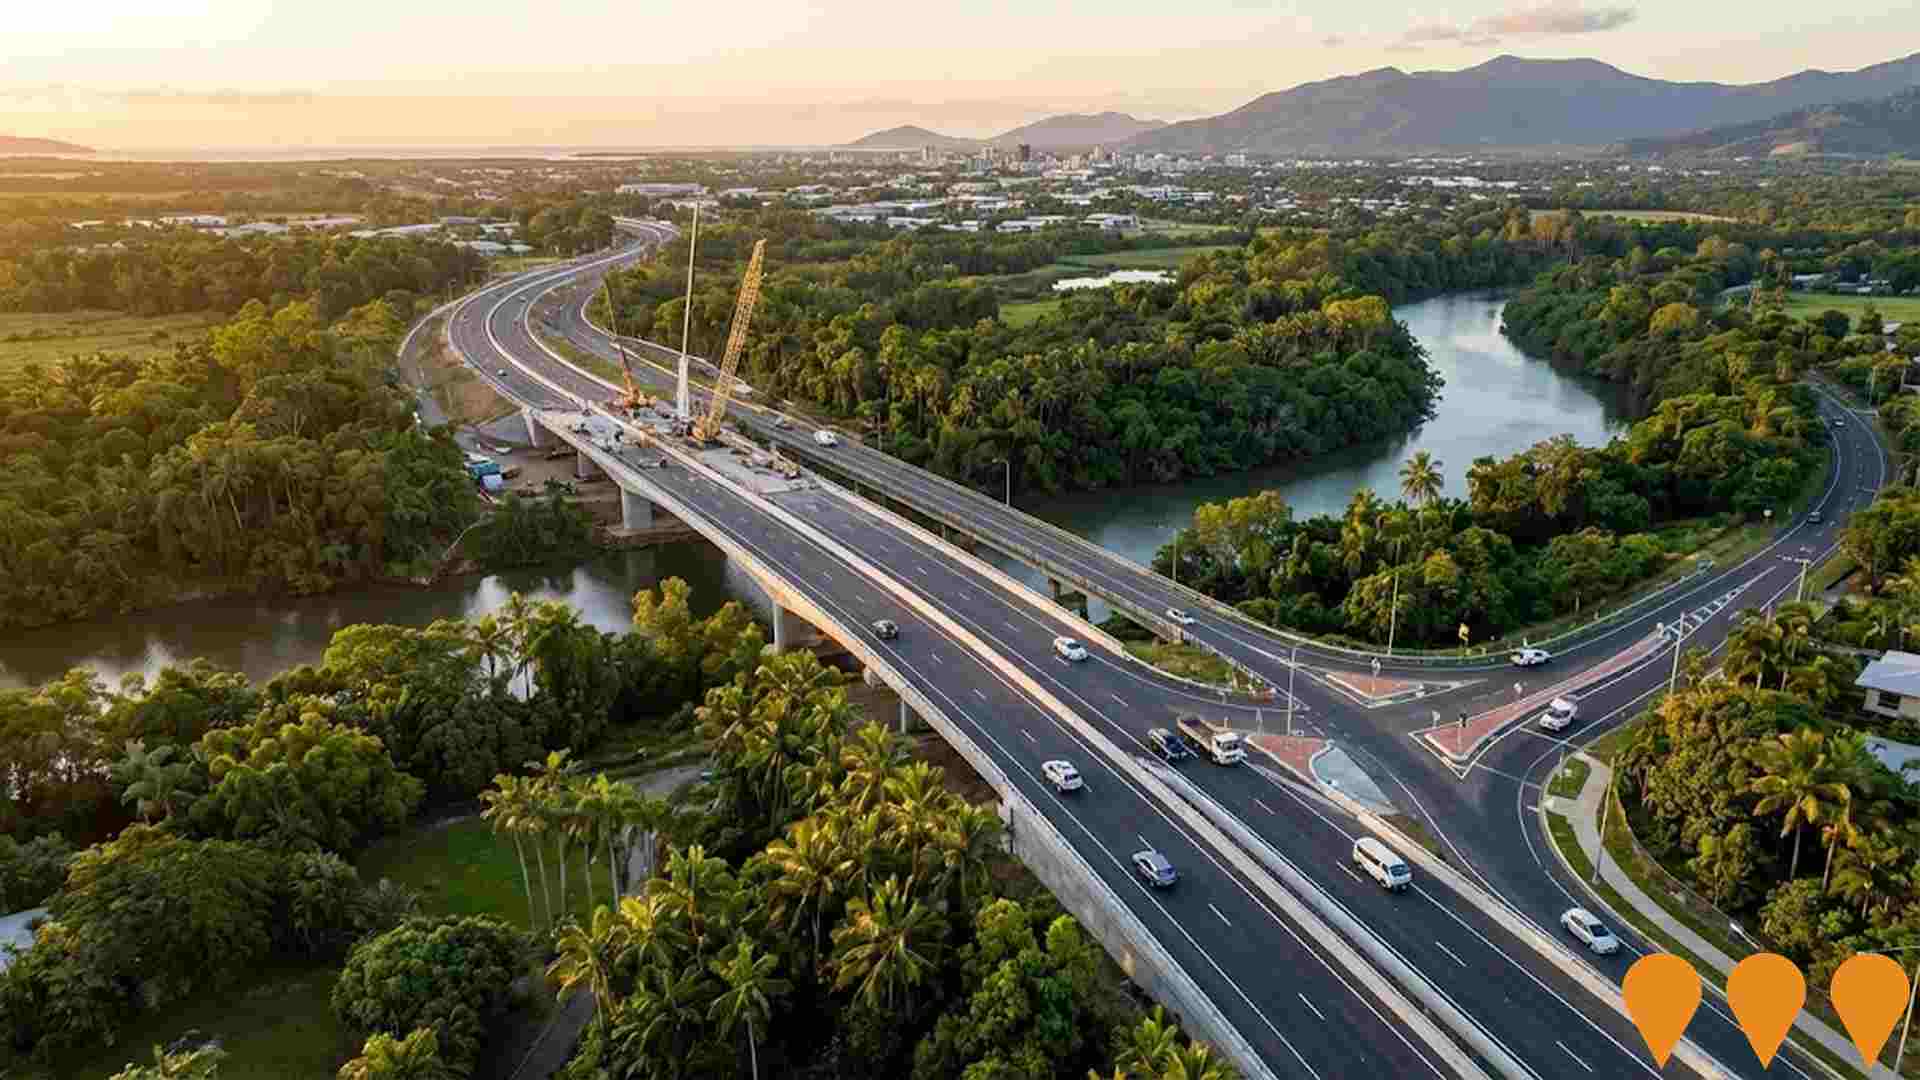
 Denotes AI-based impression for illustrative purposes only, not to be taken as definitive under any circumstances. Please follow links and conduct other investigations from the project's source for actual imagery. Developers and project owners wishing us to use original imagery please Contact Us and we will do so.
Frequently Asked Questions - Infrastructure
Cairns Western Arterial Road Duplication
A $300 million project to upgrade the Cairns Western Arterial Road to a four-lane dual carriageway between Redlynch Connector Road and Captain Cook Highway. Includes duplication of the Redlynch rail overpass, a new four-lane bridge over the Barron River at Kamerunga, intersection upgrades, and enhanced active transport facilities. Delivered in three stages by the Queensland Department of Transport and Main Roads. Jointly funded by the Australian Government ($240M) and Queensland Government ($60M). Construction on Stage 1 commenced August 2024 and is progressing well as of December 2025.
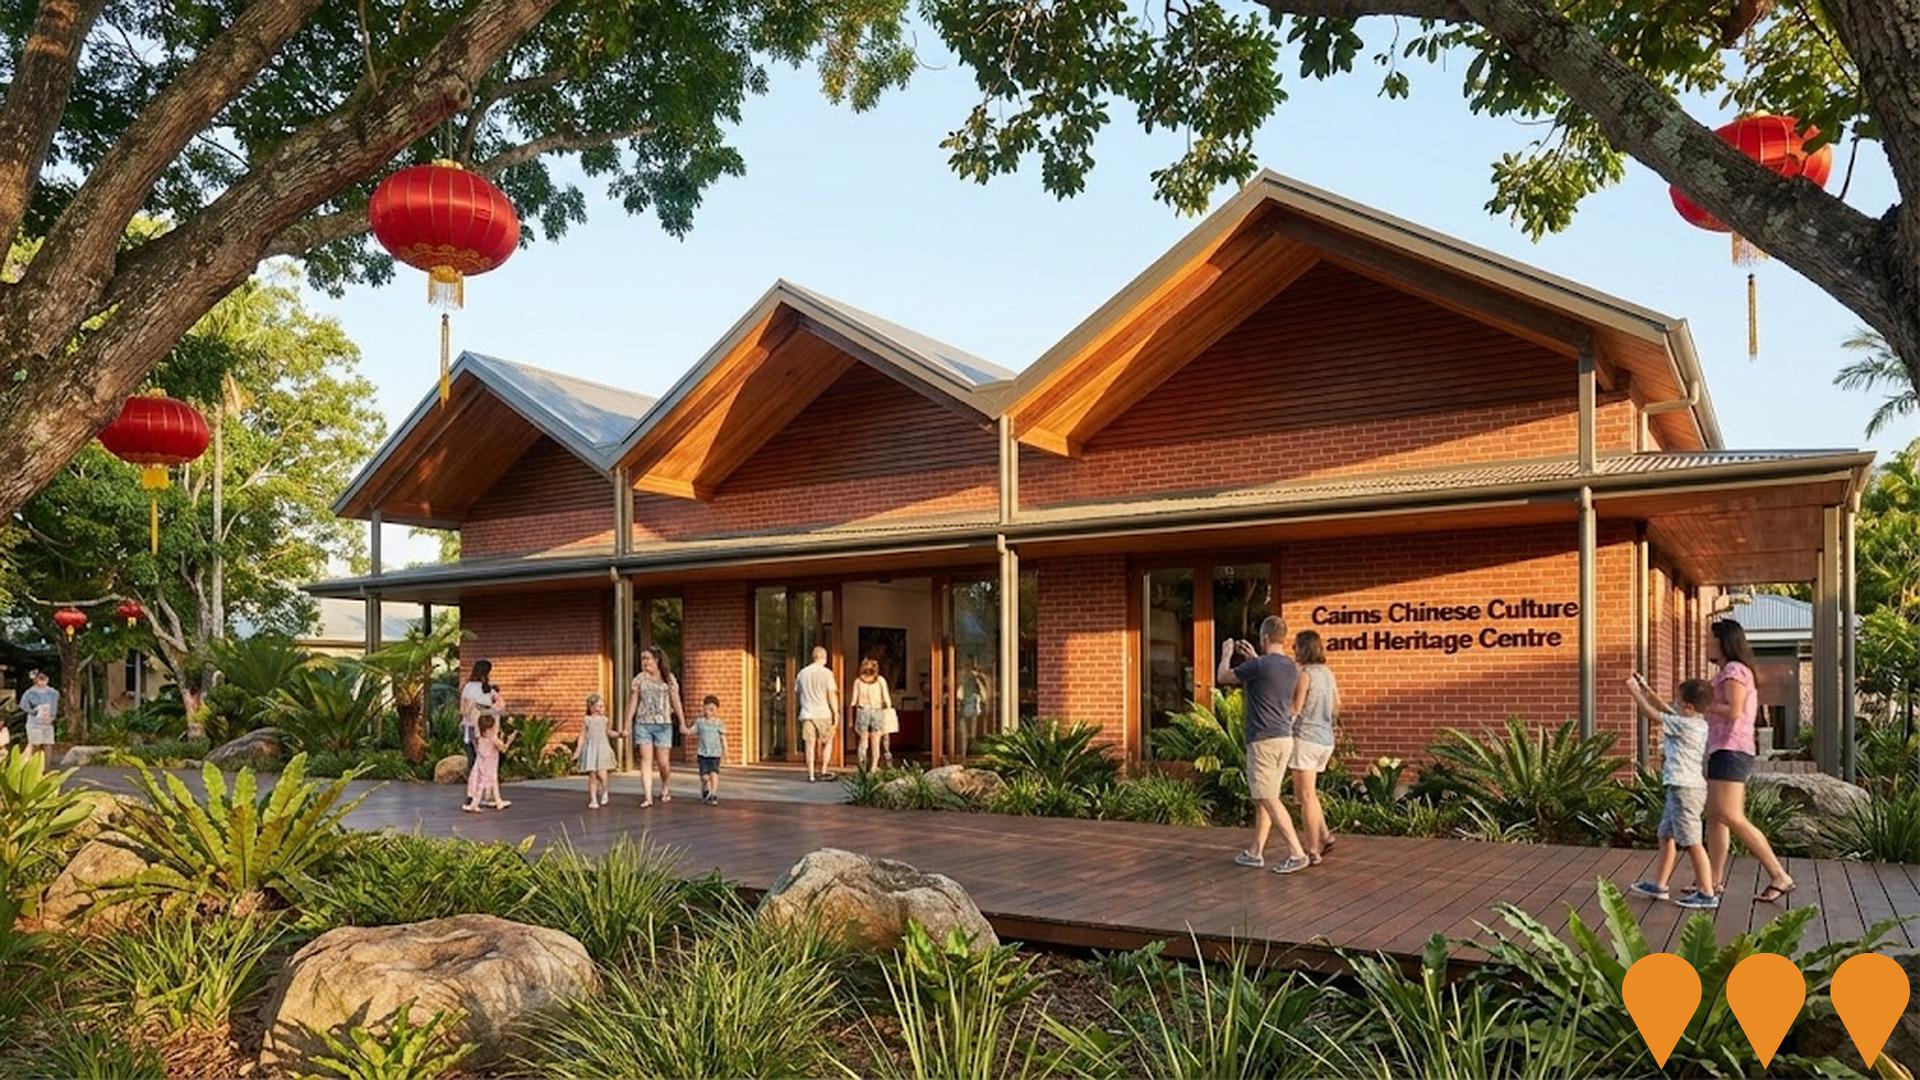
Cairns Chinese Culture and Heritage Centre
A purpose-built centre on Greenslopes Street, opposite the Chinese Friendship Gardens, to house the nationally significant Lit Sung Goong Temple artefact collection. The centre, developed by the Cairns and District Chinese Association Inc. (CADCAI), will also serve as a hub for community performing arts, research, education, celebrations, and festivals. The Cairns Regional Council approved a 30-year lease for the land in August 2024 to assist CADCAI in securing funding for construction. Stage 1 construction was anticipated to begin by July 1, 2025, with an approximate total project value between $5M and $10M.
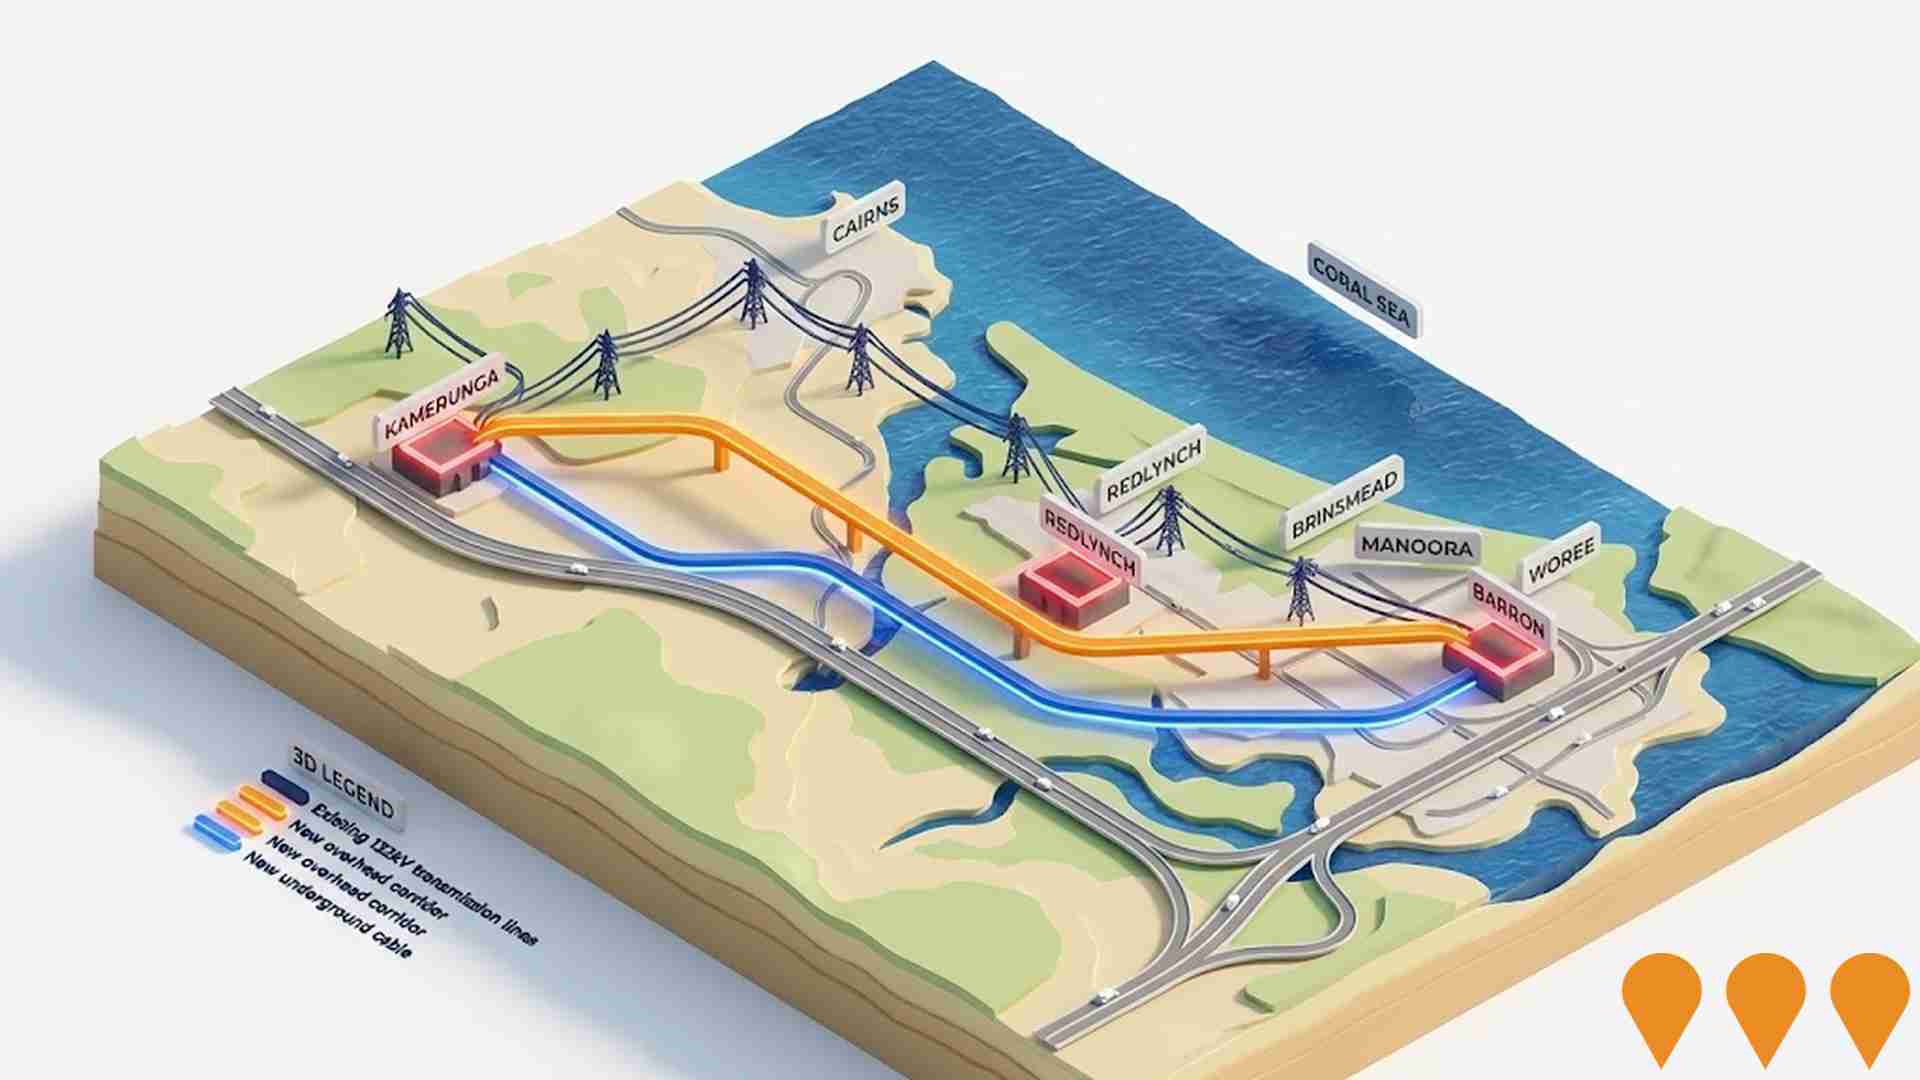
Kamerunga to Woree Transmission Line Replacement Project
Replacement of aging 132kV transmission infrastructure to ensure safe, secure, and reliable electricity supply for northern Cairns. The project includes a 4.1km overhead transmission line between Kamerunga and Redlynch, a 10.4km underground transmission cable from Redlynch to Woree Substation, and a new substation in Barron to replace the existing Kamerunga Substation. Infrastructure originally built in the 1960s-1970s has reached end of technical service life.
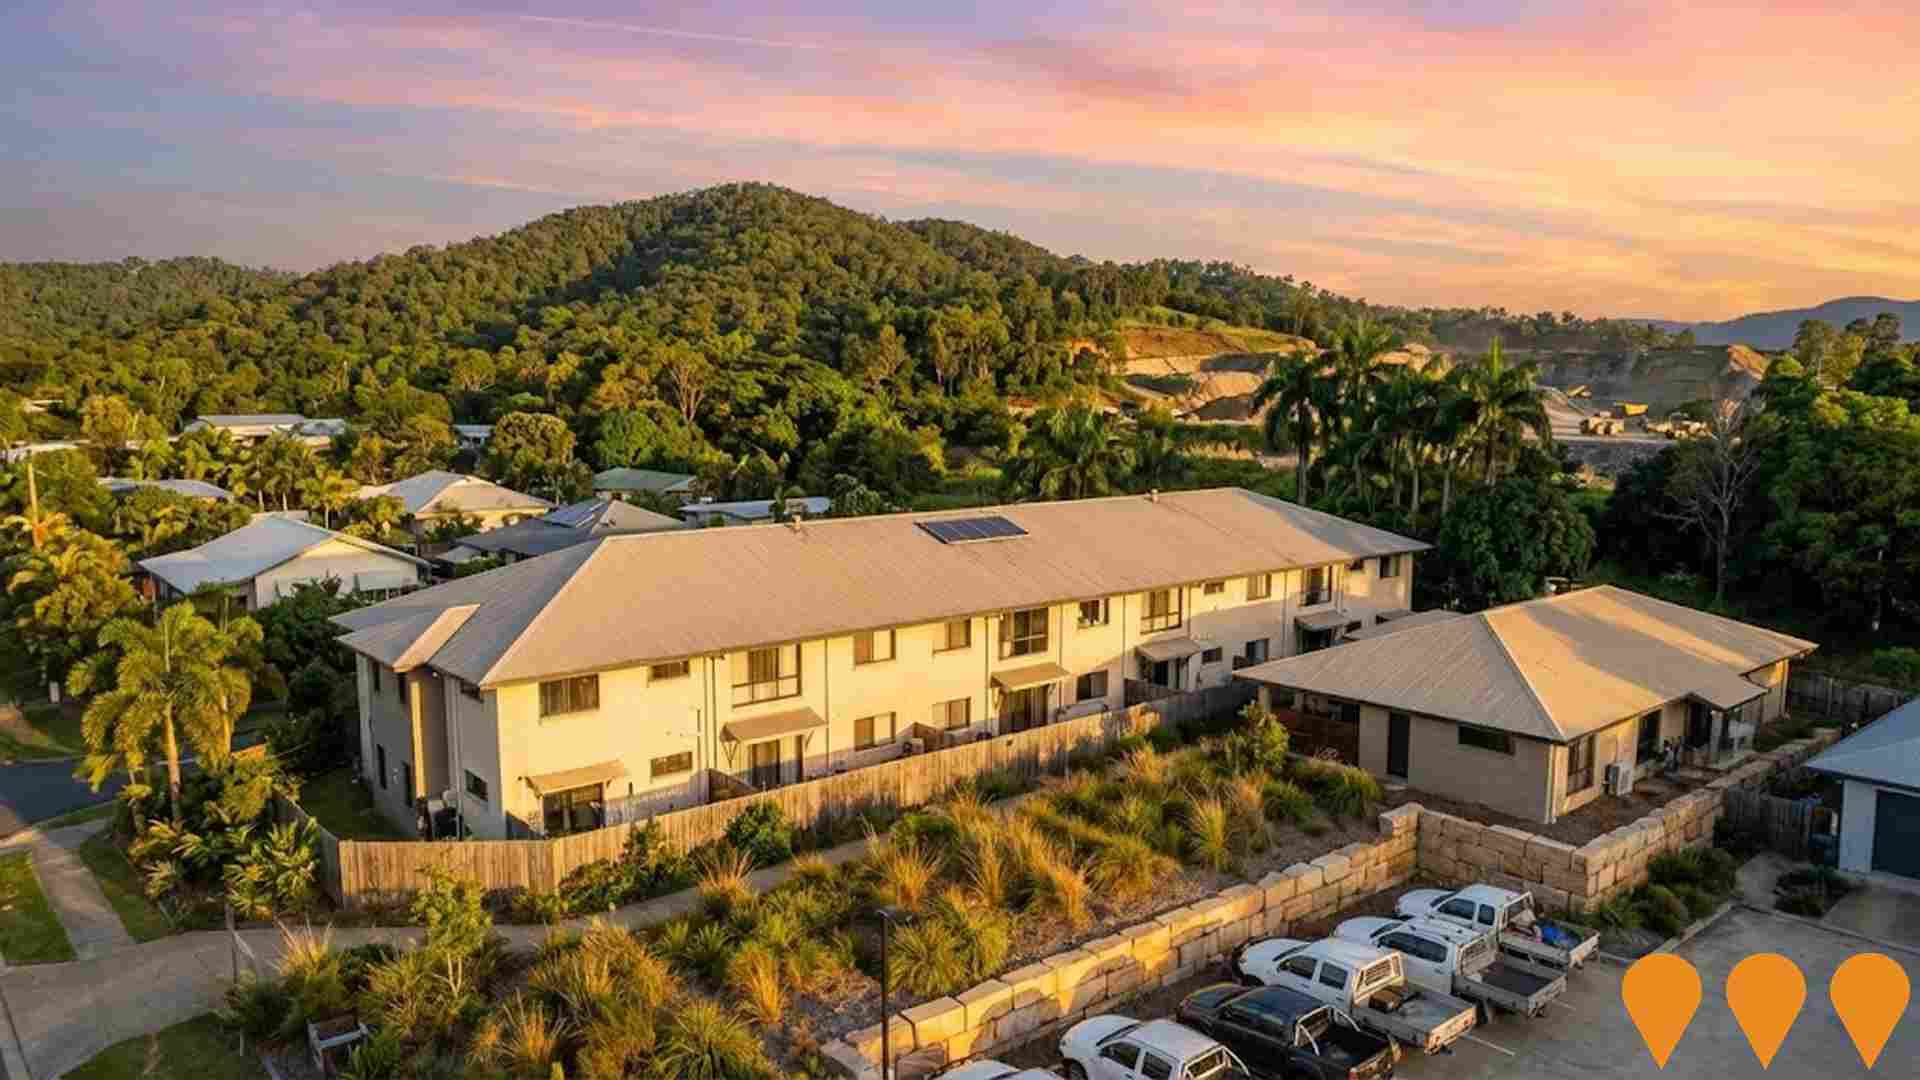
Currunda Creek Development
Low-impact trades and services development providing storage facilities, light industry, vehicle storage, bulk landscape supplies, and commercial services to support the Redlynch community. The project involves subdividing the eastern precinct into 4 lots on 8 hectares adjacent to Boral Quarry, creating over 120 permanent jobs while preserving the western precinct's vegetation.
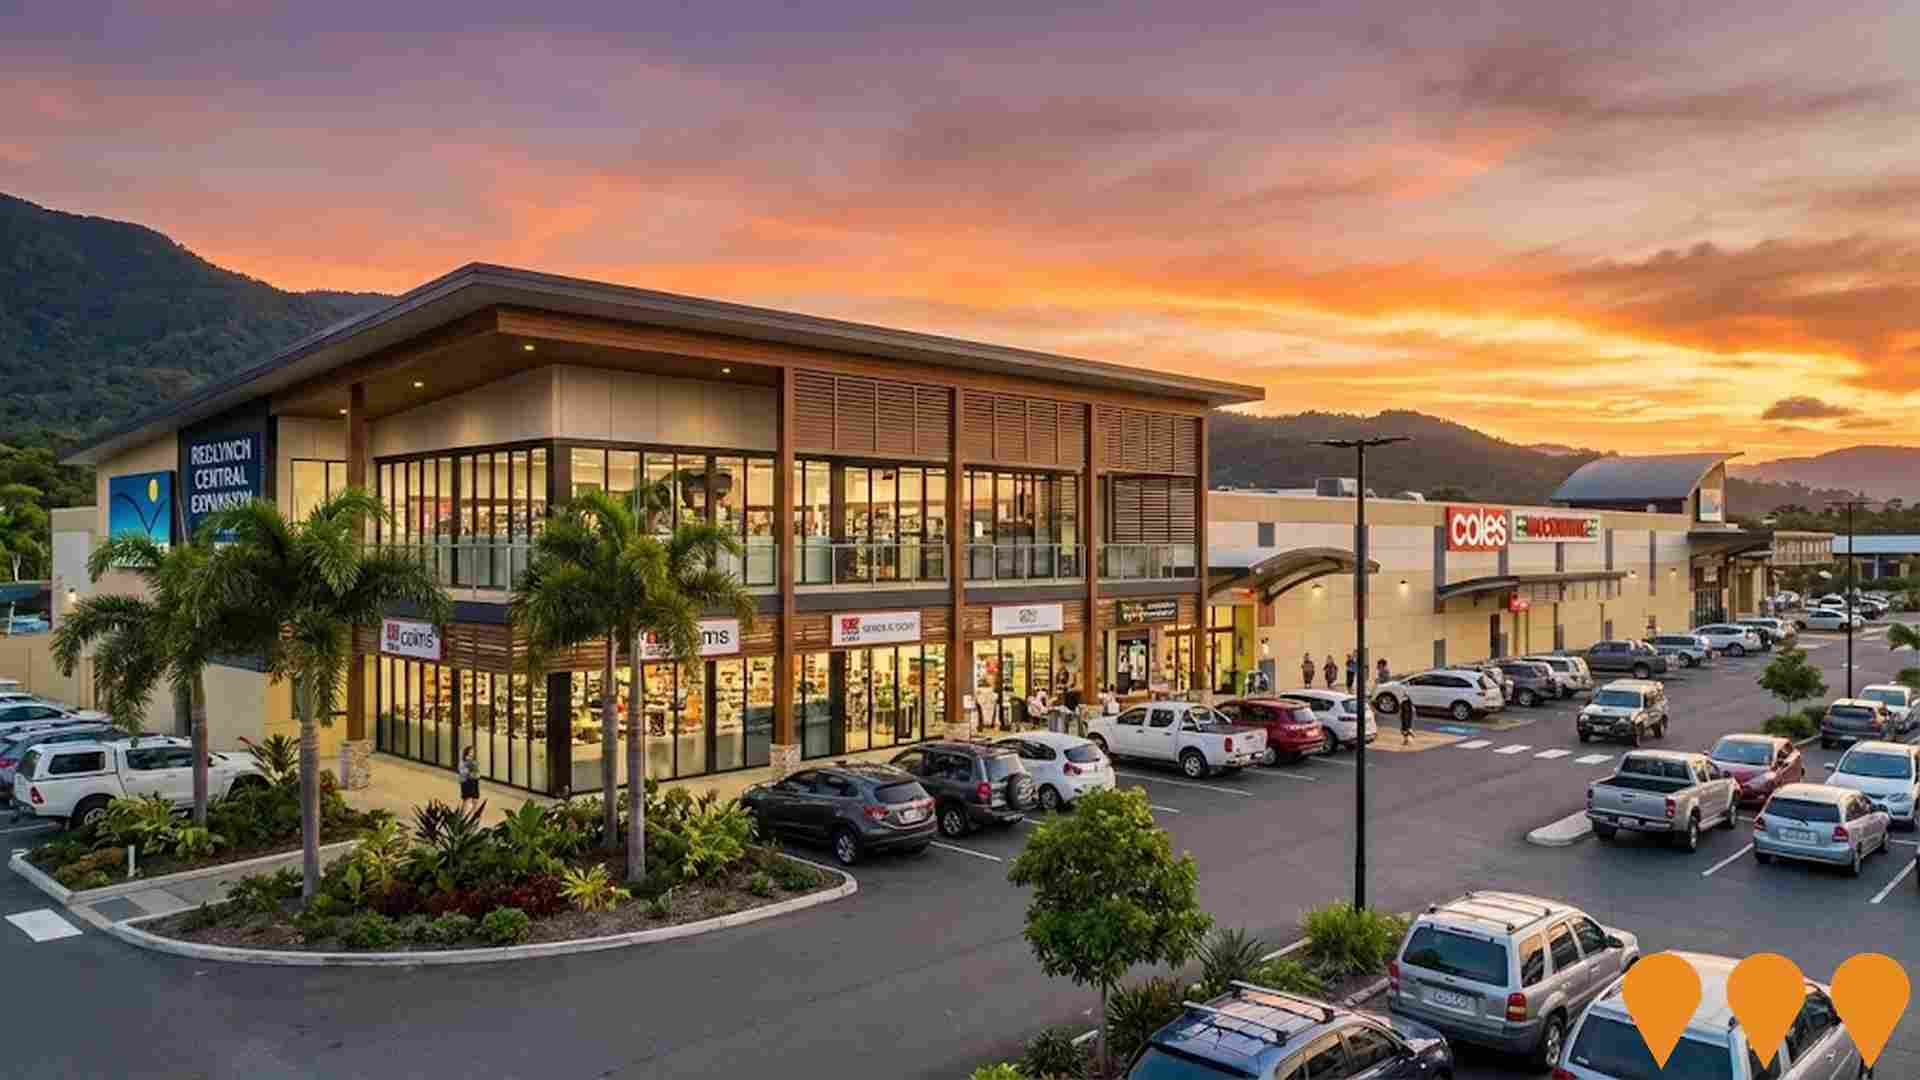
Redlynch Central Shopping Centre Expansion (Stage 3)
The $10 million Stage 3 expansion of Redlynch Central Shopping Centre involves constructing a new two-storey building attached to the Coles supermarket end of the centre. It will add an additional 1200 square metres of space, including 500 square metres of retail space on the ground floor and 700 square metres on the first floor, attracting new specialty stores. Construction commenced in April 2025.
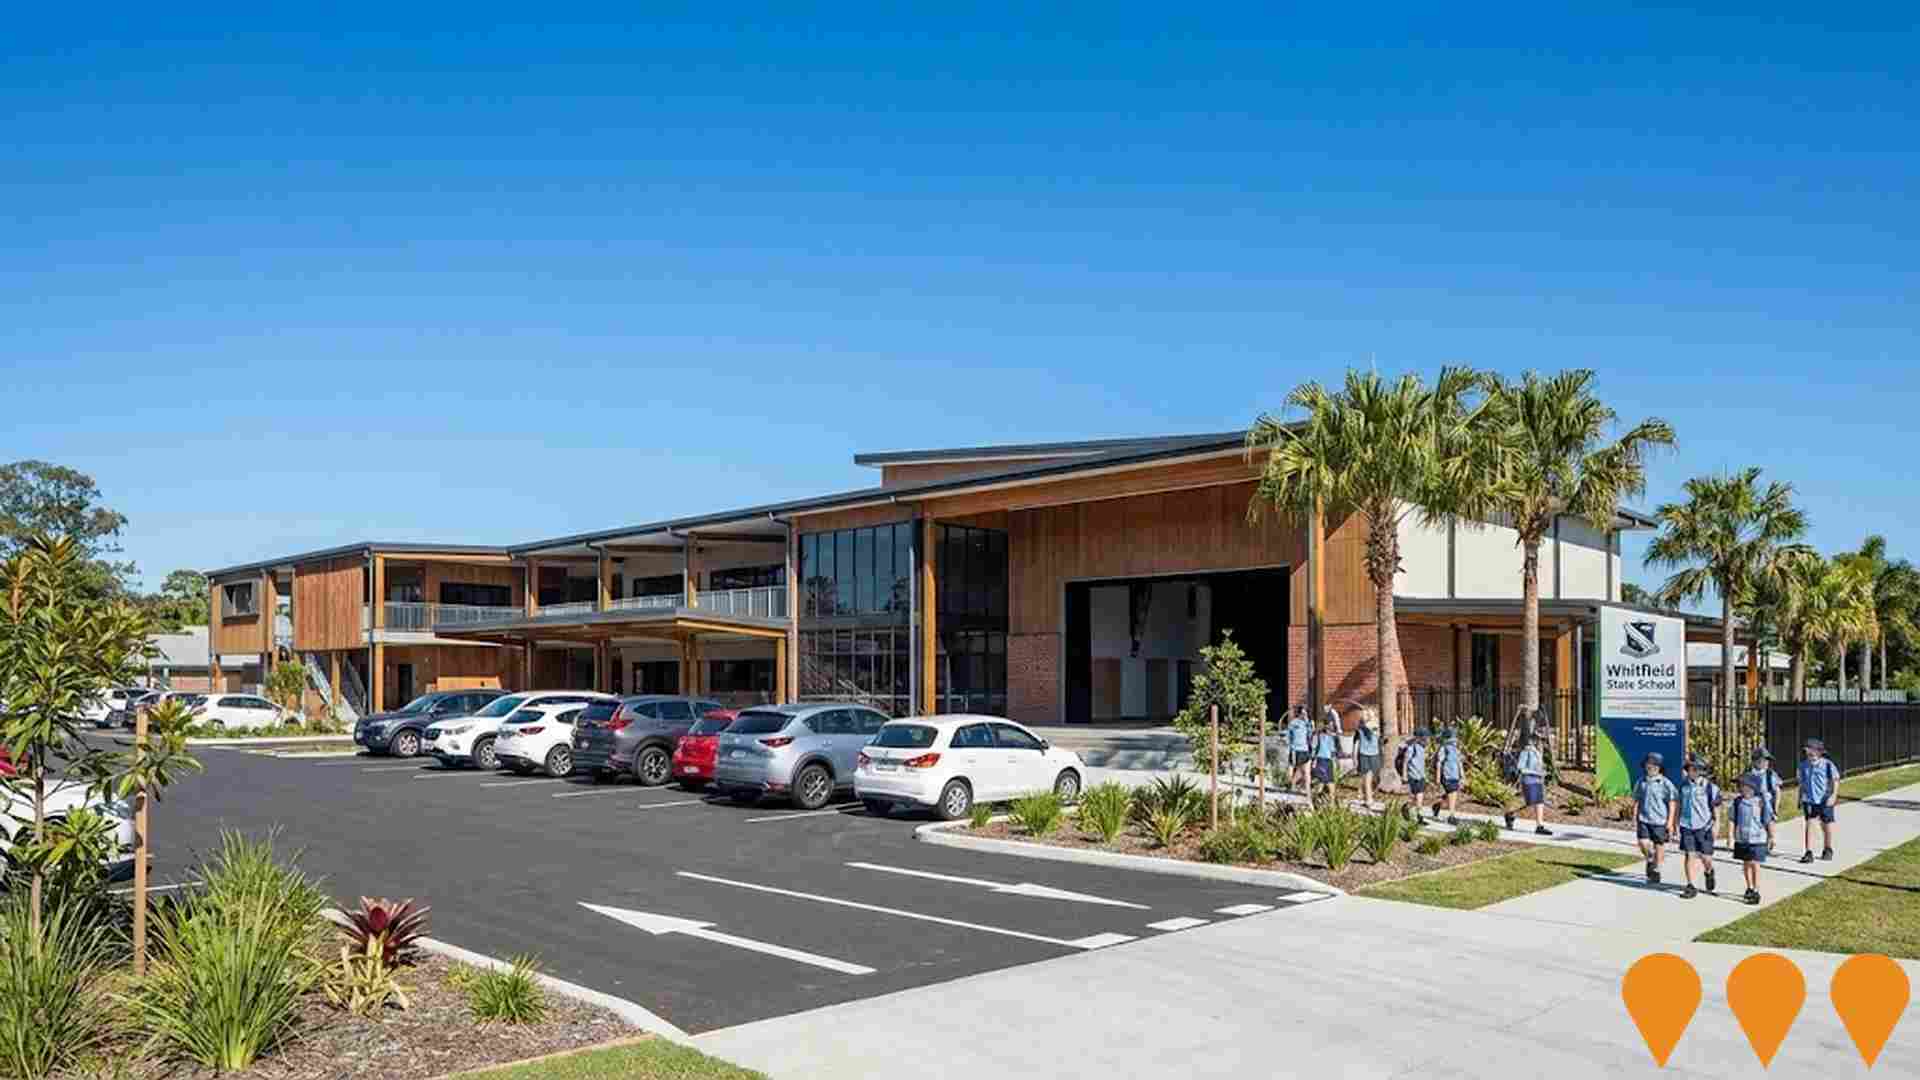
Whitfield State School Performing Arts Centre
A $13 million Performing Arts and Music Centre with a performance stage, green room, storage, and flexible learning areas for both school and community use. It will also address the need for additional car parking and improve the school's street presence.
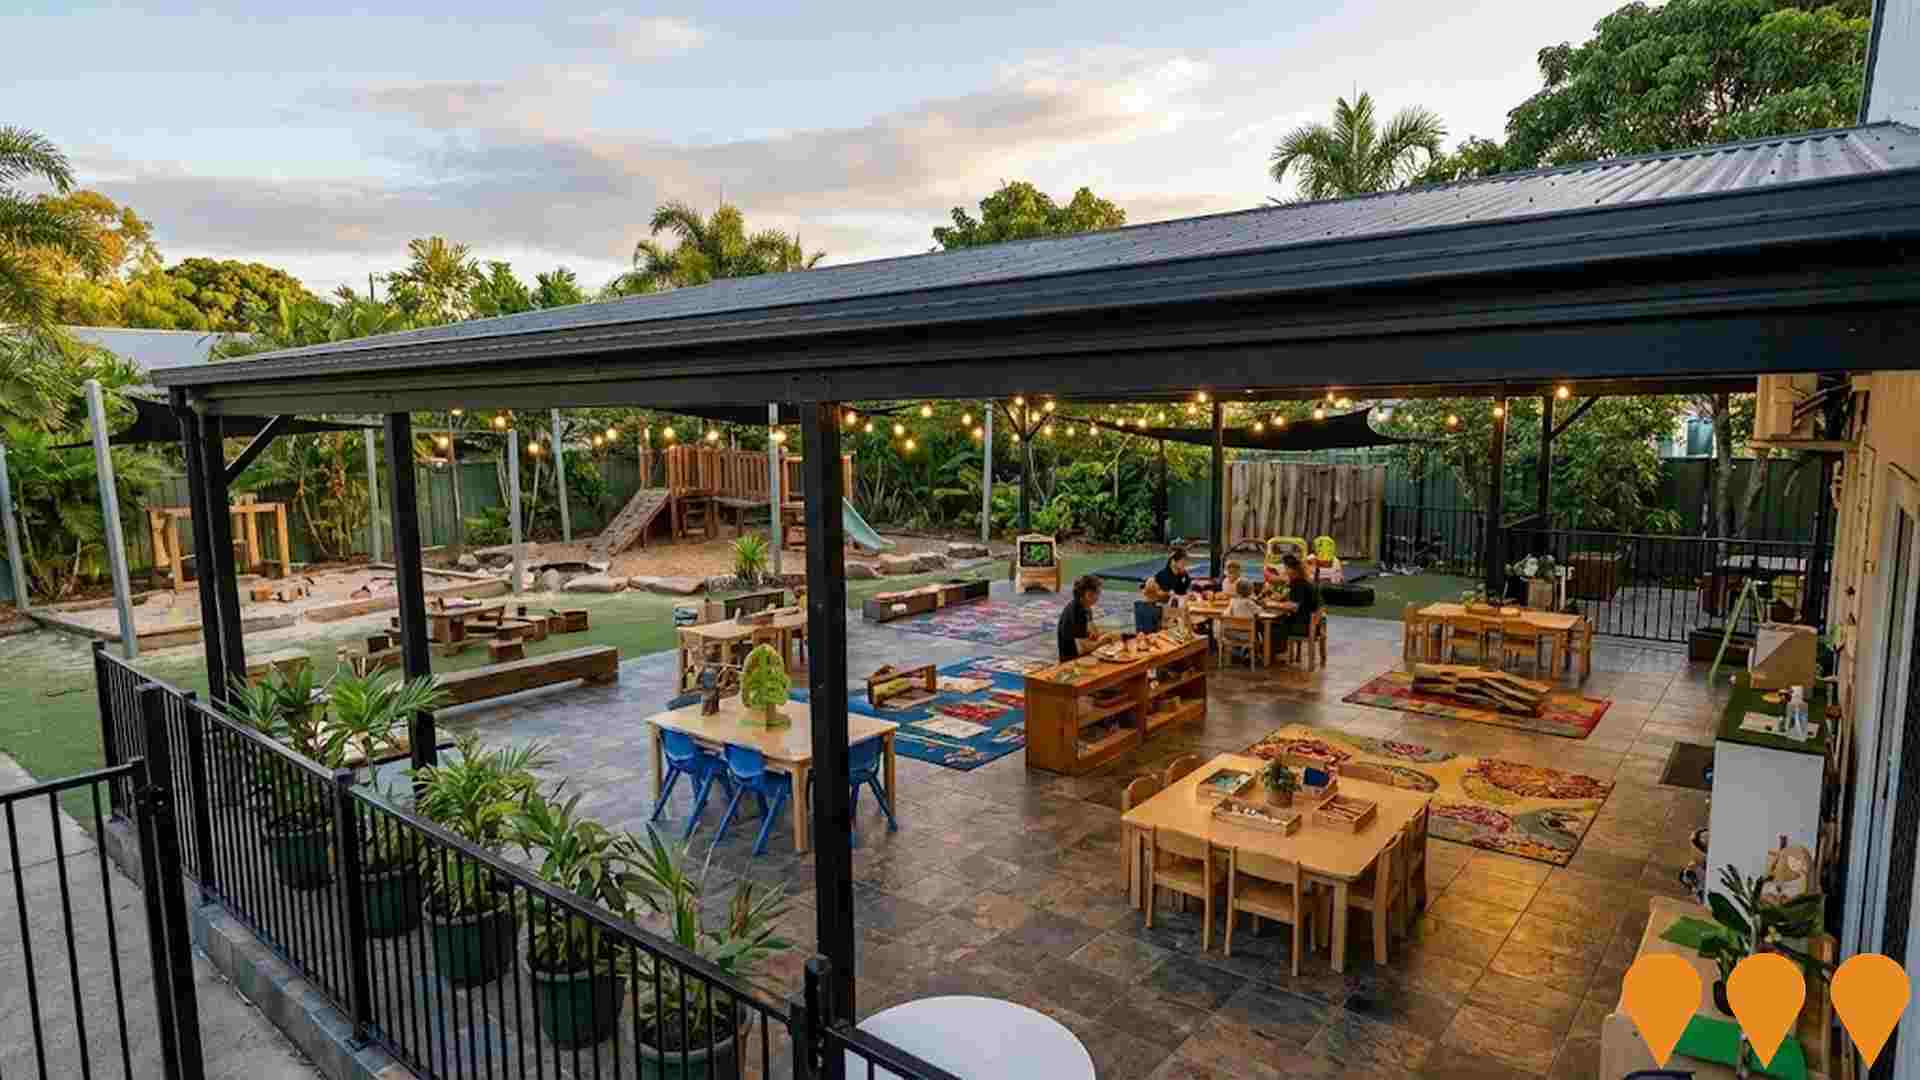
Early Learning Centre - 15-17 Marino St
Ultra-modern double-decker early learning centre designed to set a new benchmark for childcare facilities in Cairns, accommodating up to 120 children with innovative learning spaces.
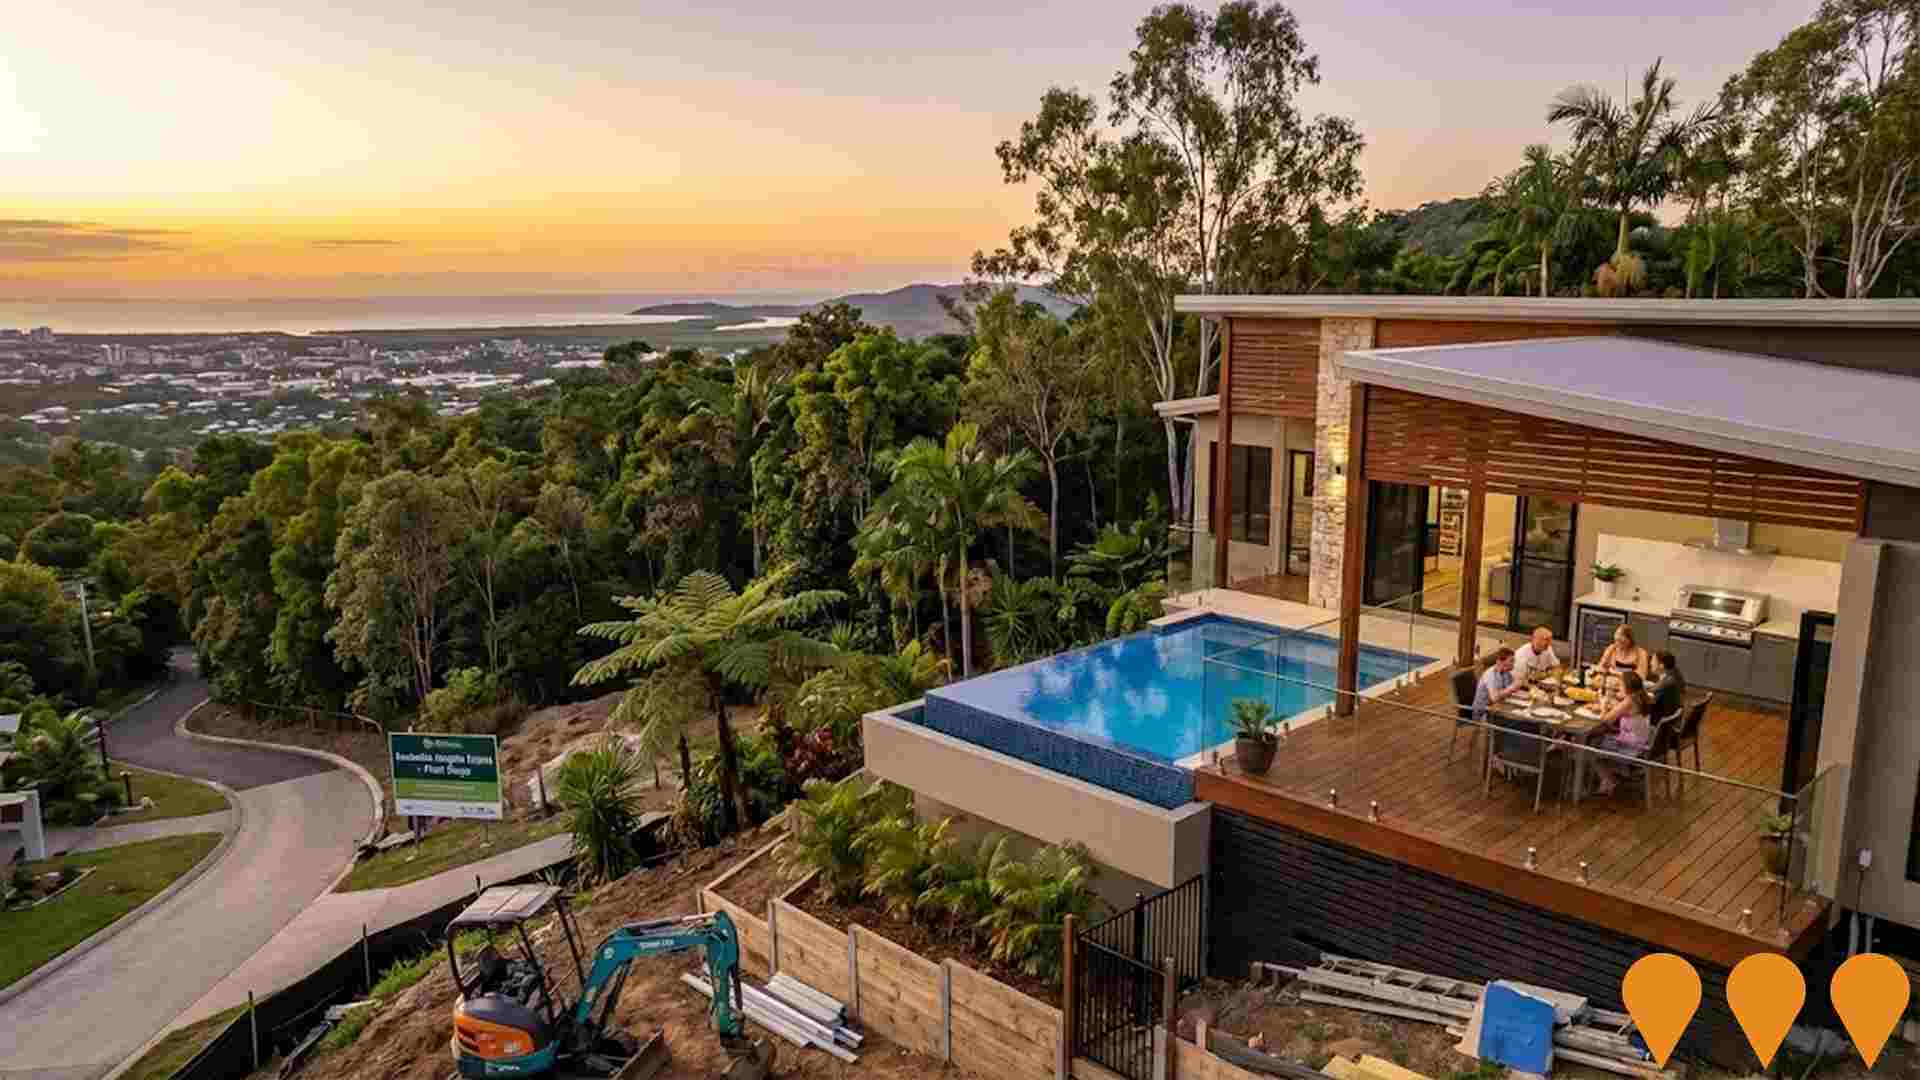
Kanimbla Heights Estate
Kanimbla Heights Estate is a long running masterplanned hillside residential subdivision in Kanimbla, Cairns. The estate has been delivered in multiple stages since the early 2000s, with civil works and lot creation now focused on the final elevated stages around Stage 24. Lots are engineered for steep terrain with drainage networks and slope stability works to manage high rainfall, and most sites offer city and inlet views while remaining within about 10 minutes of the Cairns CBD, airport and major shopping centres. Current marketing emphasises premium, last remaining land releases with level or split level building pads targeting detached houses on generous blocks.
Employment
Employment conditions in Redlynch rank among the top 10% of areas assessed nationally
Redlynch has a skilled workforce with an unemployment rate of 1.7% as of September 2025. It has 8,546 residents employed, with an unemployment rate 2.4% lower than the Rest of Qld's rate of 4.1%.
Workforce participation is high at 71.4%, compared to Rest of Qld's 59.1%. Key industries are health care & social assistance, education & training, and retail trade. Health care & social assistance employs 1.2 times the regional level, while agriculture, forestry & fishing employs only 2.2% of local workers, below Rest of Qld's 4.5%. Over the year to September 2025, labour force levels decreased by 1.7%, and employment declined by 2.4%, leading to a rise in unemployment rate by 0.6 percentage points.
In contrast, Rest of Qld saw employment growth of 1.7% and labour force growth of 2.1%. State-level data to 25-Nov shows QLD employment contracted by 0.01%, with an unemployment rate of 4.2%. Jobs and Skills Australia projects national employment to expand by 6.6% over five years and 13.7% over ten years, but growth rates vary between sectors. Applying these projections to Redlynch's employment mix suggests local employment should increase by 6.7% over five years and 13.9% over ten years.
Frequently Asked Questions - Employment
Income
Income analysis reveals strong economic positioning, with the area outperforming 60% of locations assessed nationally by AreaSearch
The Redlynch SA2's median income among taxpayers was $51,505 and average income stood at $63,678 in financial year 2022, according to the latest ATO data aggregated by AreaSearch. These figures compare to Rest of Qld's median income of $50,780 and average income of $64,844 respectively. Based on Wage Price Index growth of 13.99% since financial year 2022, current estimates for Redlynch would be approximately $58,711 (median) and $72,587 (average) as of September 2025. Census 2021 income data shows household, family and personal incomes in Redlynch rank highly nationally, between the 75th and 77th percentiles. Income brackets indicate that the largest segment comprises 37.7% earning $1,500 - 2,999 weekly (5,584 residents), consistent with broader trends across the surrounding region showing 31.7% in the same category. Higher earners represent a substantial presence with 30.4% exceeding $3,000 weekly. Housing accounts for 13.8% of income while strong earnings rank residents within the 79th percentile for disposable income. The area's SEIFA income ranking places it in the 6th decile.
Frequently Asked Questions - Income
Housing
Redlynch is characterized by a predominantly suburban housing profile, with ownership patterns similar to the broader region
In Redlynch, as per the latest Census evaluation, 91.2% of dwellings were houses with the remaining 8.9% comprising semi-detached homes, apartments, and other dwelling types. This differs from Non-Metro Qld where 80.8% of dwellings are houses and 19.2% are other types. Home ownership in Redlynch stood at 27.1%, with mortgaged dwellings at 51.4% and rented ones at 21.5%. The median monthly mortgage repayment was $1,800, above Non-Metro Qld's average of $1,733. Weekly rent in Redlynch averaged $420 compared to Non-Metro Qld's $390. Nationally, Redlynch's mortgage repayments were lower than the Australian average of $1,863, while rents were substantially higher at $420 versus the national figure of $375.
Frequently Asked Questions - Housing
Household Composition
Redlynch features high concentrations of family households, with a higher-than-average median household size
Family households constitute 81.1% of all households, including 42.6% couples with children, 26.0% couples without children, and 11.9% single parent families. Non-family households account for the remaining 18.9%, with lone person households at 16.0% and group households comprising 3.0%. The median household size is 2.9 people, larger than the Rest of Qld average of 2.5.
Frequently Asked Questions - Households
Local Schools & Education
The educational profile of Redlynch exceeds national averages, with above-average qualification levels and academic performance metrics
The area's educational profile is notable regionally, with university qualification rates at 28.0% of residents aged 15+, surpassing the Rest of Qld average of 20.6% and the SA4 region average of 21.1%. Bachelor degrees are most prevalent at 19.5%, followed by postgraduate qualifications (5.0%) and graduate diplomas (3.5%). Vocational credentials are also prominent, with 39.0% of residents aged 15+ holding them - advanced diplomas at 12.7% and certificates at 26.3%.
Educational participation is high, with 35.3% currently enrolled in formal education. This includes 12.7% in primary education, 12.1% in secondary education, and 4.5% pursuing tertiary education.
Frequently Asked Questions - Education
Schools Detail
Nearby Services & Amenities
Transport
Transport servicing is low compared to other areas nationally based on assessment of service frequency, route connectivity and accessibility
Redlynch has 26 active public transport stops, all of which are bus stops. These stops are served by three different routes that together facilitate 351 weekly passenger trips. The accessibility of these services is considered limited, with residents on average located 1195 meters from the nearest stop.
On a daily basis, there are approximately 50 trips across all routes, which translates to about 13 weekly trips per individual stop.
Frequently Asked Questions - Transport
Transport Stops Detail
Health
Redlynch's residents boast exceedingly positive health performance metrics with younger cohorts in particular seeing very low prevalence of common health conditions
Redlynch's health outcomes data shows excellent results, with younger age groups having particularly low prevalence rates for common health conditions.
Private health cover stands at approximately 51% of the total population (~7,584 people), slightly lower than the average SA2 area. Mental health issues and arthritis are the most prevalent medical conditions in Redlynch, affecting 7.2% and 6.1% of residents respectively. A total of 74.8% of residents report being completely clear of medical ailments, compared to 73.1% across Rest of Qld. The area has a lower proportion of seniors aged 65 and over at 12.8% (1,903 people), compared to the Rest of Qld's 16.7%. Despite this, health outcomes among seniors require more attention than those in the broader population.
Frequently Asked Questions - Health
Cultural Diversity
In terms of cultural diversity, Redlynch records figures broadly comparable to the national average, as found in AreaSearch's assessment of a number of language and cultural background related metrics
Redlynch exhibited above-average cultural diversity, with 23.1% of its population born overseas and 12.4% speaking a language other than English at home. Christianity was the predominant religion in Redlynch, comprising 48.2%. Judaism was overrepresented compared to the rest of Queensland, making up 0.1% versus 0.2%.
The top three ancestry groups were English (28.2%), Australian (24.7%), and Other (9.3%). Notably, Korean (0.6%) and German (4.5%) were slightly overrepresented compared to regional averages of 0.4% and 4.3%, respectively. New Zealand was equally represented at 0.9%.
Frequently Asked Questions - Diversity
Age
Redlynch's population is slightly younger than the national pattern
The median age in Redlynch is 38 years, which is slightly below Rest of Qld's average of 41 but aligns with Australia's median age of 38. The percentage of the population aged 5-14 is 15.5%, higher than Rest of Qld's figure, while the 65-74 cohort makes up 7.5%. According to post-2021 Census data, the 15-24 age group has increased from 12.1% to 13.9%, but the 5-14 cohort has decreased from 17.4% to 15.5%. By 2041, population forecasts indicate significant demographic shifts in Redlynch. Notably, the 25-34 age group is projected to grow by 39%, adding 548 people and reaching a total of 1,963 from its current figure of 1,414. Conversely, the 5-14 and 15-24 cohorts are expected to experience population declines.
