Chart Color Schemes
This analysis uses ABS Statistical Areas Level 2 (SA2) boundaries, which can materially differ from Suburbs and Localities (SAL) even when sharing similar names.
SA2 boundaries are defined by the Australian Bureau of Statistics and are designed to represent communities for statistical reporting (e.g., census and ERP).
Suburbs and Localities (SAL) represent commonly-used suburb/locality names (postal-style areas) and may use different geographic boundaries. For comprehensive analysis, consider reviewing both boundary types if available.
est. as @ -- *
ABS ERP | -- people | --
2021 Census | -- people







The median house price in North Ryde - East Ryde is $2.62m, with units at $848k. House values have moved 2.6% a year compounded over five years.
Curious about local property values? Filter the chart to assess the volume and appreciation (including resales) trends and regional comparisons, or scroll to the map below view this information at an individual property level.

Find a Recent Sale

Sales Detail
North Ryde - East Ryde has an estimated 16,639 residents, up from 15,622 at the 2021 Census — a change of 1,017 people, or 6.5%. Growth has averaged 1.5% a year over five years. Overseas migration accounts for 76.9% of that increase. That puts 2,675 residents on each square kilometre. Population is estimated from ABS Estimated Resident Population releases and GNAF address data, re-based from the 2021 Census and updated annually.
Detail
According to research conducted by AreaSearch, the resident count of North Ryde - East Ryde stands at roughly 16,639 as of Aug 2026. This represents an addition of 1,017 people (6.5%) compared to the 2021 Census tally of 15,622 people. This demographic movement is calculated utilizing the ABS estimated resident population figure of 16,577 recorded as of June 2025 alongside 75 validated new addresses identified following the Census date. With these numbers, population density reaches 2,675 persons per square kilometer, situating the precinct within the top quartile among nationwide areas examined by AreaSearch.
Over the preceding ten years, North Ryde - East Ryde has exhibited steady demographic expansion via a 2.7% compound annual growth rate, exceeding the broader SA3 area. Inbound overseas migration served as the principal catalyst for local population expansion, generating roughly 76.9% of total demographic additions in recent times. SA2 geographic modeling by AreaSearch incorporates ABS/Geoscience Australia projections published in 2024 using 2022 as the base year, while areas absent from that dataset utilize NSW State Government SA2 forecasts issued in 2022 using 2021 as the base year. Age-specific cohort growth rates from these combined series are further applied to every territory across the 2032 to 2041 period. Looking toward demographic trajectories ahead, the locality is slated for substantial expansion placing it within the nation's highest quartile, projected to expand by 5,275 persons to 2041 under latest annual ERP benchmarks, which translates to a total cumulative increase of 31.3% throughout the 16 years.
Frequently Asked Questions - Population
623 new dwellings have been approved in North Ryde - East Ryde over the past five years, an average of 124 a year. That places the area in the 82nd percentile for residential development activity nationally, about 7 approvals per 1,000 residents a year. Of the 123 dwellings approved in the latest reporting year, 34% were detached houses and the rest townhouses or apartments. Figures come from ABS building approvals aggregated to this SA2 boundary and are updated monthly as the ABS releases them.
Detail
Residential building approvals in North Ryde - East Ryde have averaged approximately 124 per annum, totaling 623 approved dwellings over the preceding 5 financial years (between FY-22 and FY-26). Incoming resident flows have averaged 1.9 people annually for every home delivered across the prior 5 financial years (between FY-22 and FY-26), establishing sound equilibrium between supply pipeline and demographic demand to sustain steady market conditions. In addition, newly approved dwellings reflect an average expected construction cost of $571,000, moderately higher than broader regional averages and reflective of higher-specification building activity.
Non-residential development remains moderate, supported by $9.8 million in commercial building approvals lodged during the current financial year. Per capita residential construction volume in North Ryde - East Ryde sits 15.0% below Greater Sydney levels, although nationwide comparisons position it in the 77th percentile of evaluated markets. Compositionally, recent approvals divide into 34.0% detached houses and 66.0% townhouses or apartments. This pivot toward higher-density dwelling types provides more accessible price points for incoming buyers, appealing to downsizers, property investors, and first-home purchasers. This profile forms a distinct shift away from the established built landscape (where houses currently constitute 62.0%), reflecting diminishing greenfield land opportunities alongside changing residential preferences and affordability dynamics. Accounting for roughly 138 people per dwelling approval, the precinct demonstrates distinct urban expansion traits. Projecting forward, demographic forecasts indicate that North Ryde - East Ryde will welcome 5,213 residents through to 2041 based on the most recent AreaSearch quarterly estimate. If ongoing construction volumes fail to accelerate, housing supply could trail population expansion, creating upward pressure on residential pricing through heightened purchaser competition.
Frequently Asked Questions - Development
Development applications around North Ryde - East Ryde
Loading development applications…
| Lodged | Address | Description | Type | Distance | Status |
|---|
SOURCE: Planning portals and council registers, compiled by AreaSearch. Distance & bearing measured from the suburb midpoint.
AreaSearch tracks 5 current infrastructure and development projects inside North Ryde - East Ryde, worth an estimated $5.57 billion. A further 162 sit in the immediately surrounding suburbs, taking the tracked pipeline within reach of the area to $83.6 billion. 42 are already under construction and 79 are due for completion within three years. The pipeline spans residential development, communities, precincts & urban renewal and transport & logistics. Records are compiled from Infrastructure Australia, state agencies, council planning portals and public announcements, reviewed and updated daily, then ranked by proximity, construction stage, completion horizon and project scale.
Detail
Urban development, capital works, and planning strategies exert significant influence on surrounding precinct outcomes. AreaSearch has documented 38 major initiatives holding potential local implications, highlighted by the 24-storey Lachlan's Line Building A, the Triniti Lighthouse Build-to-Rent scheme, Project Mars Data Centre (12 Mars Road), and the wider Lachlan's Line Precinct.
Professional plan users can use the search below to filter and access additional projects.
INFRASTRUCTURE SEARCH
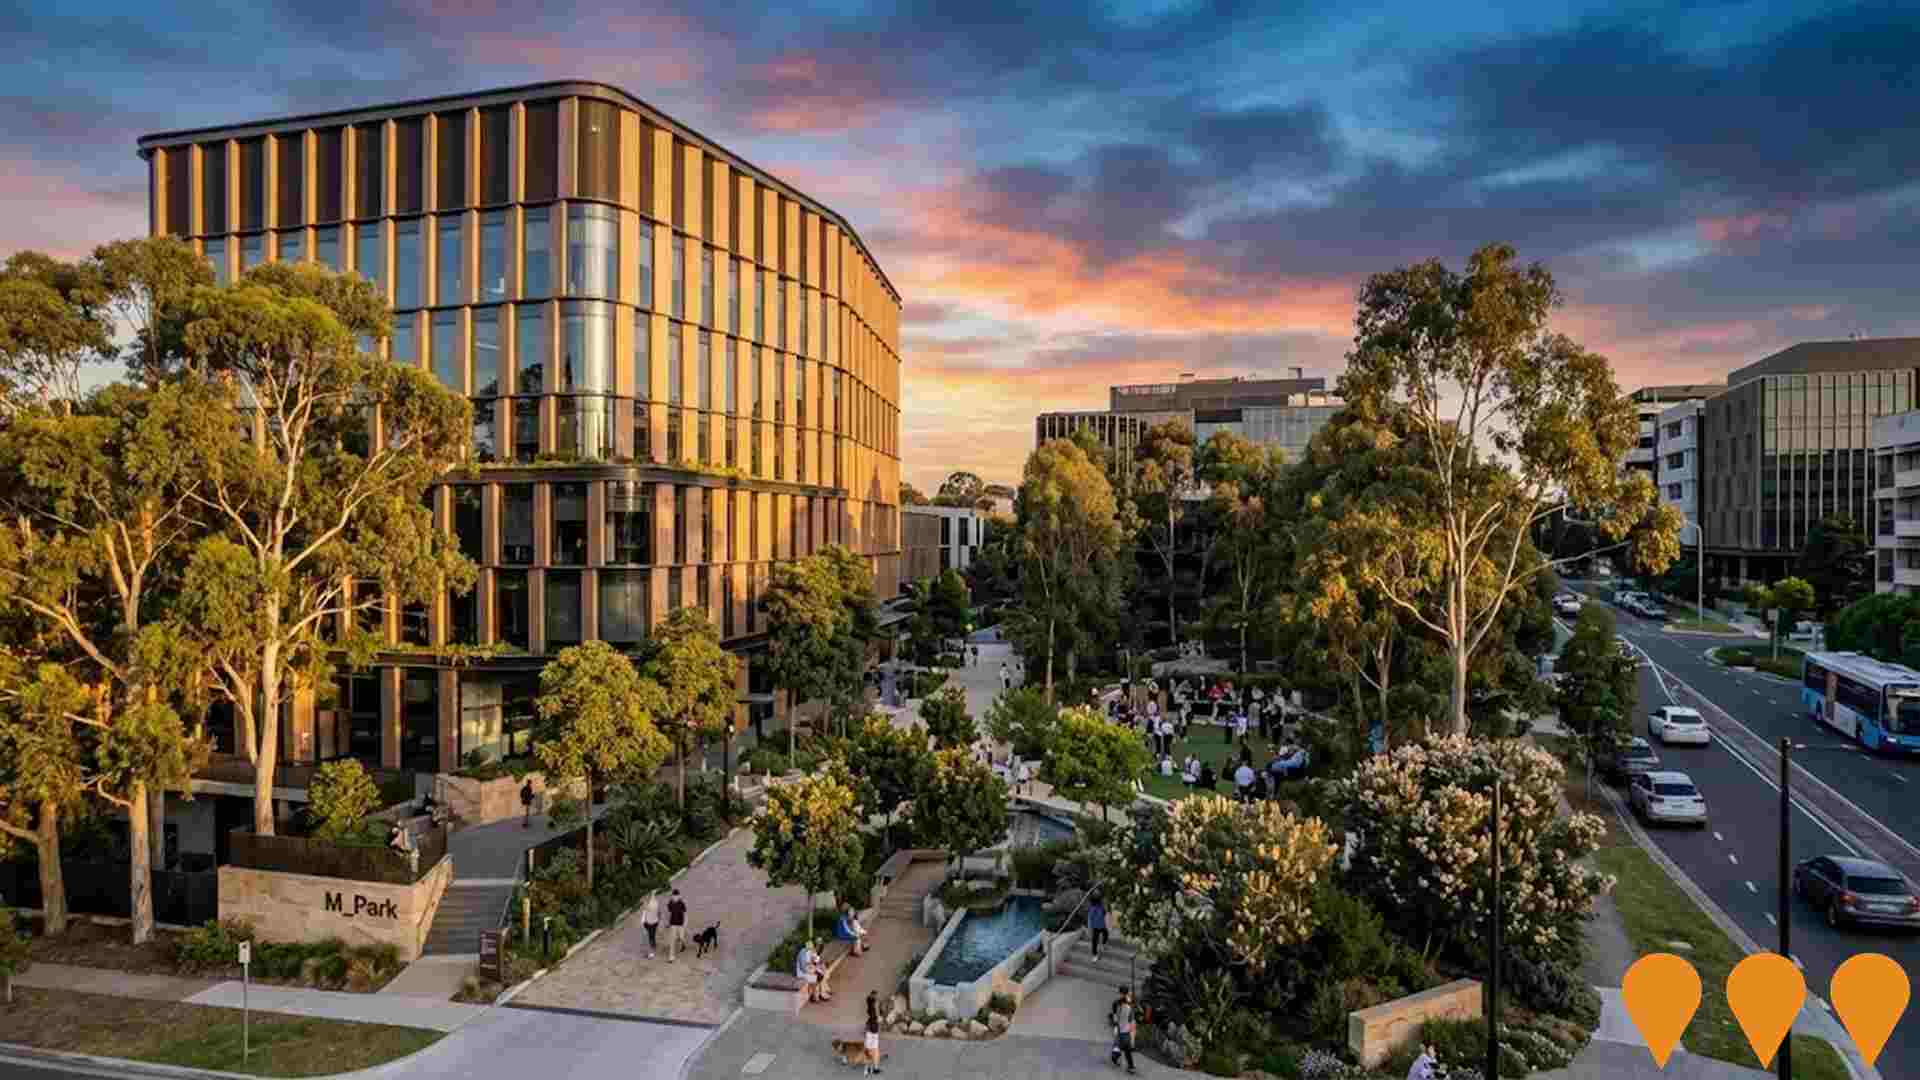
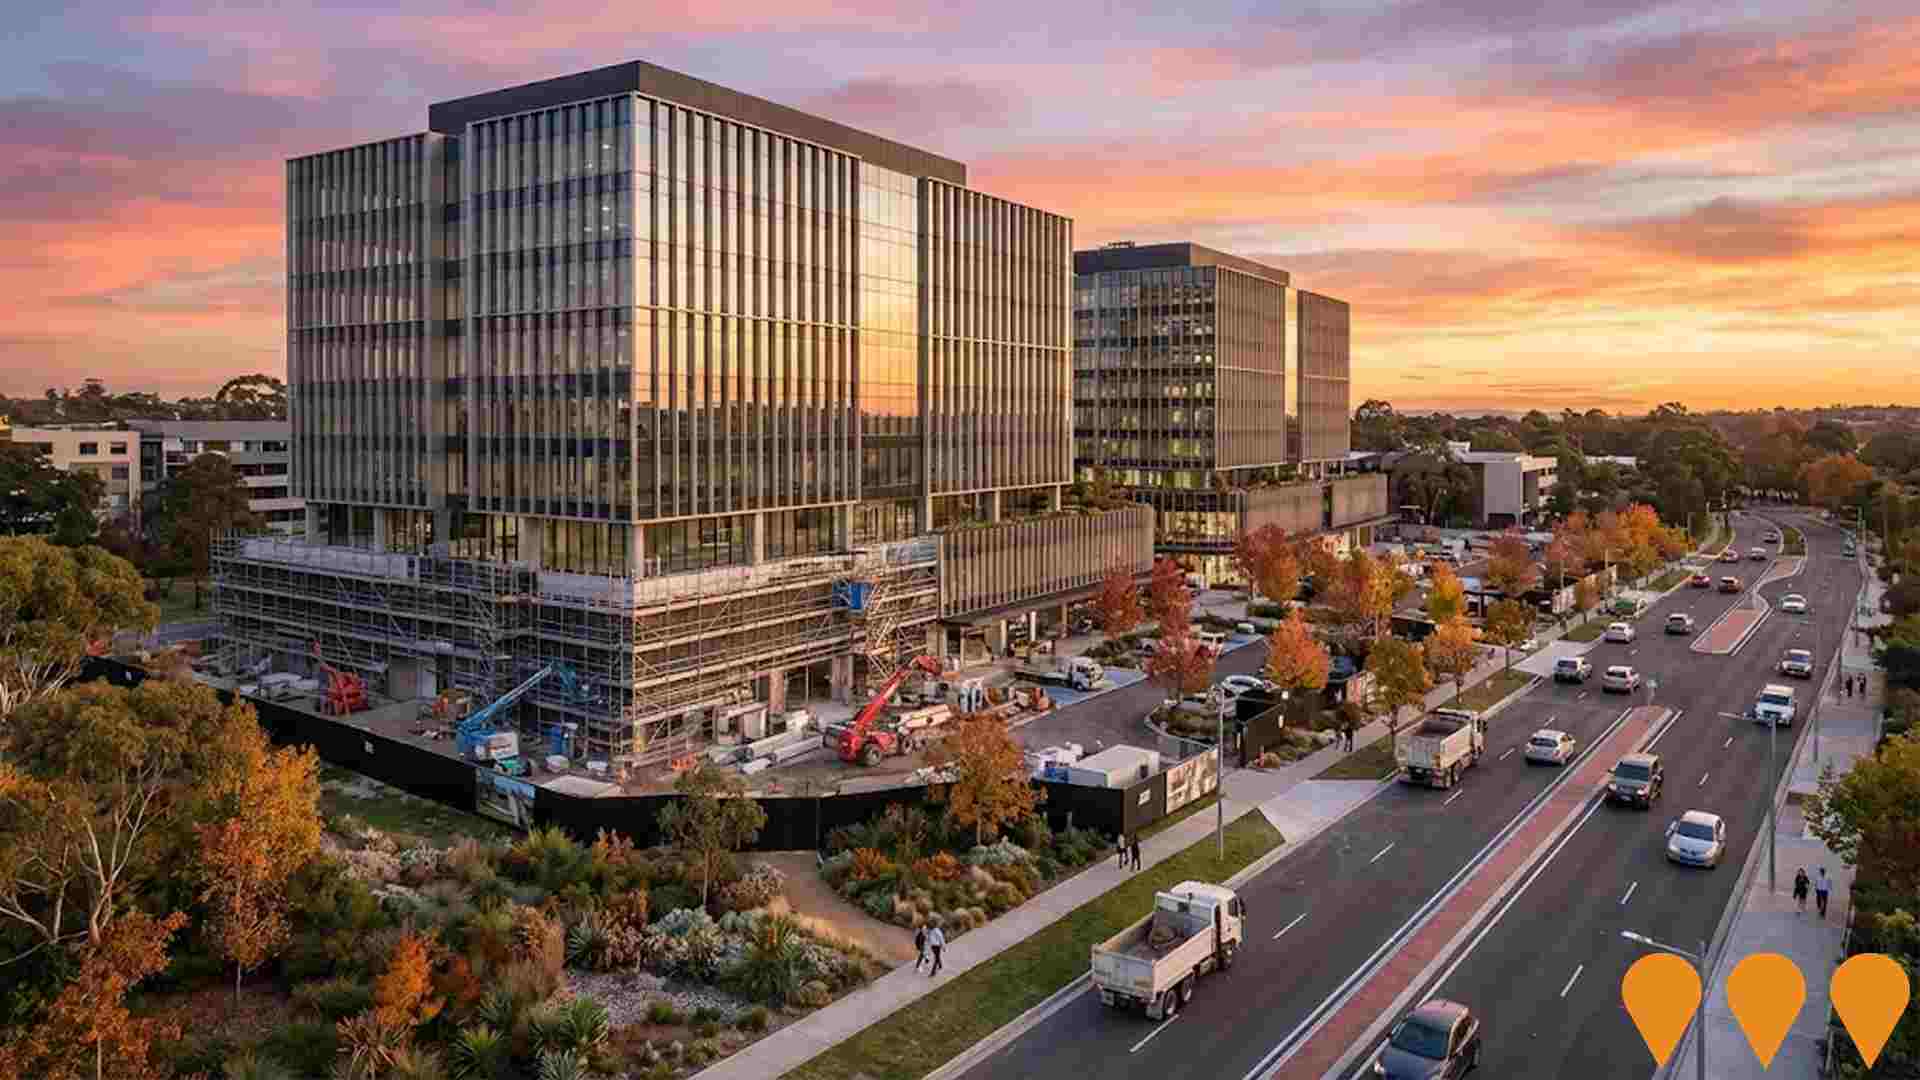
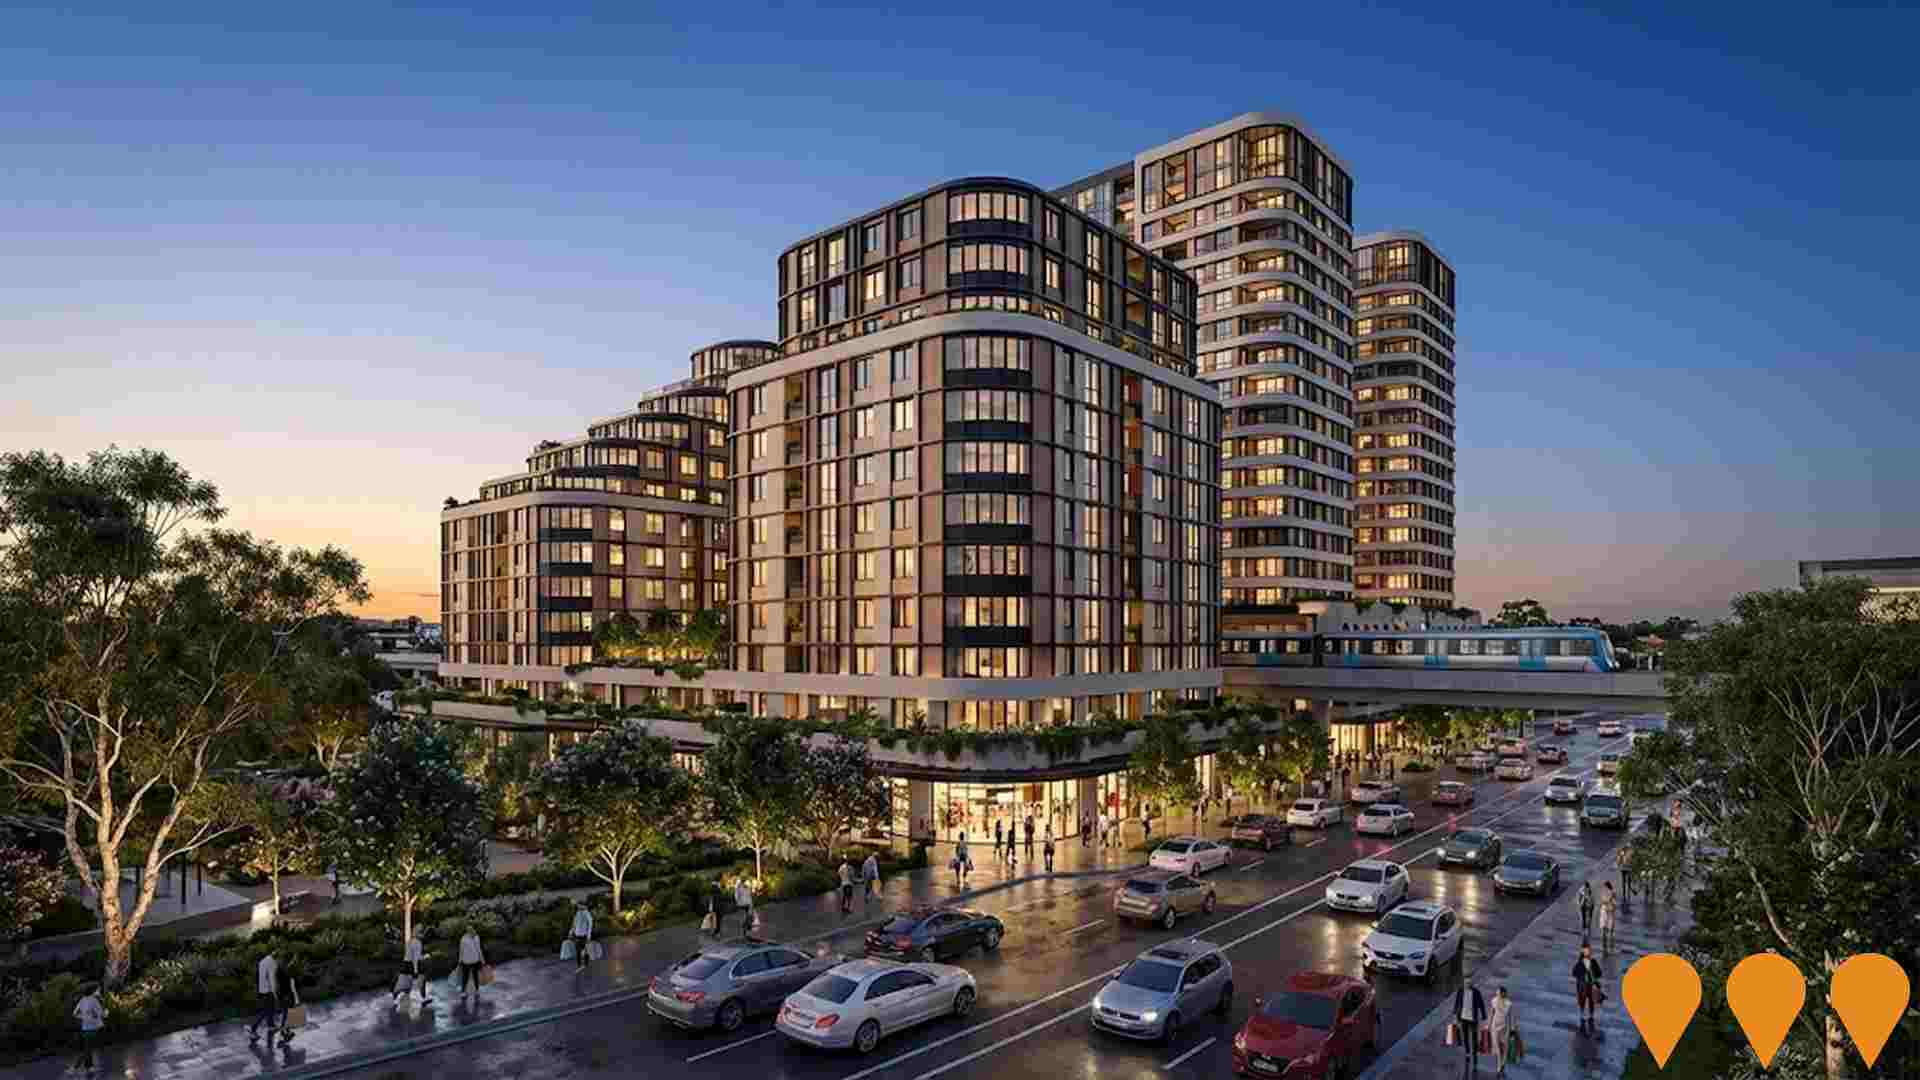
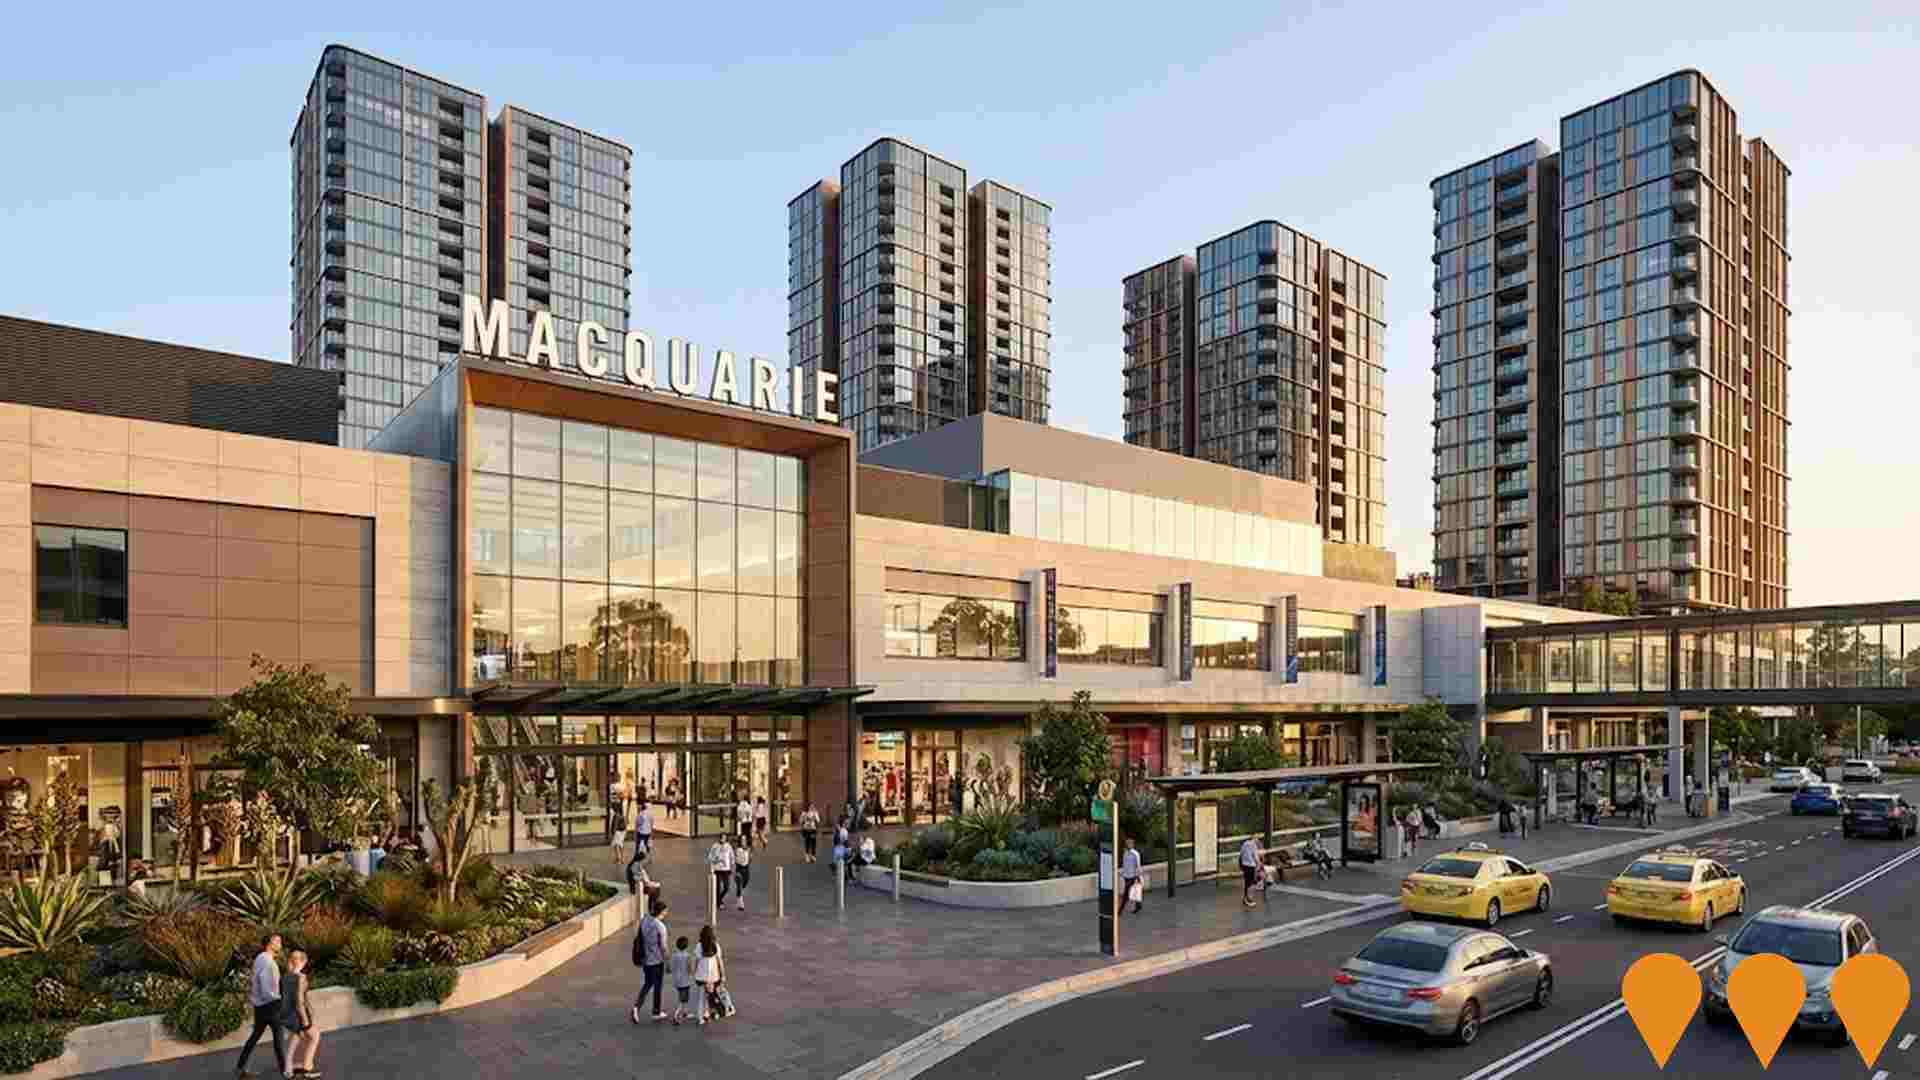
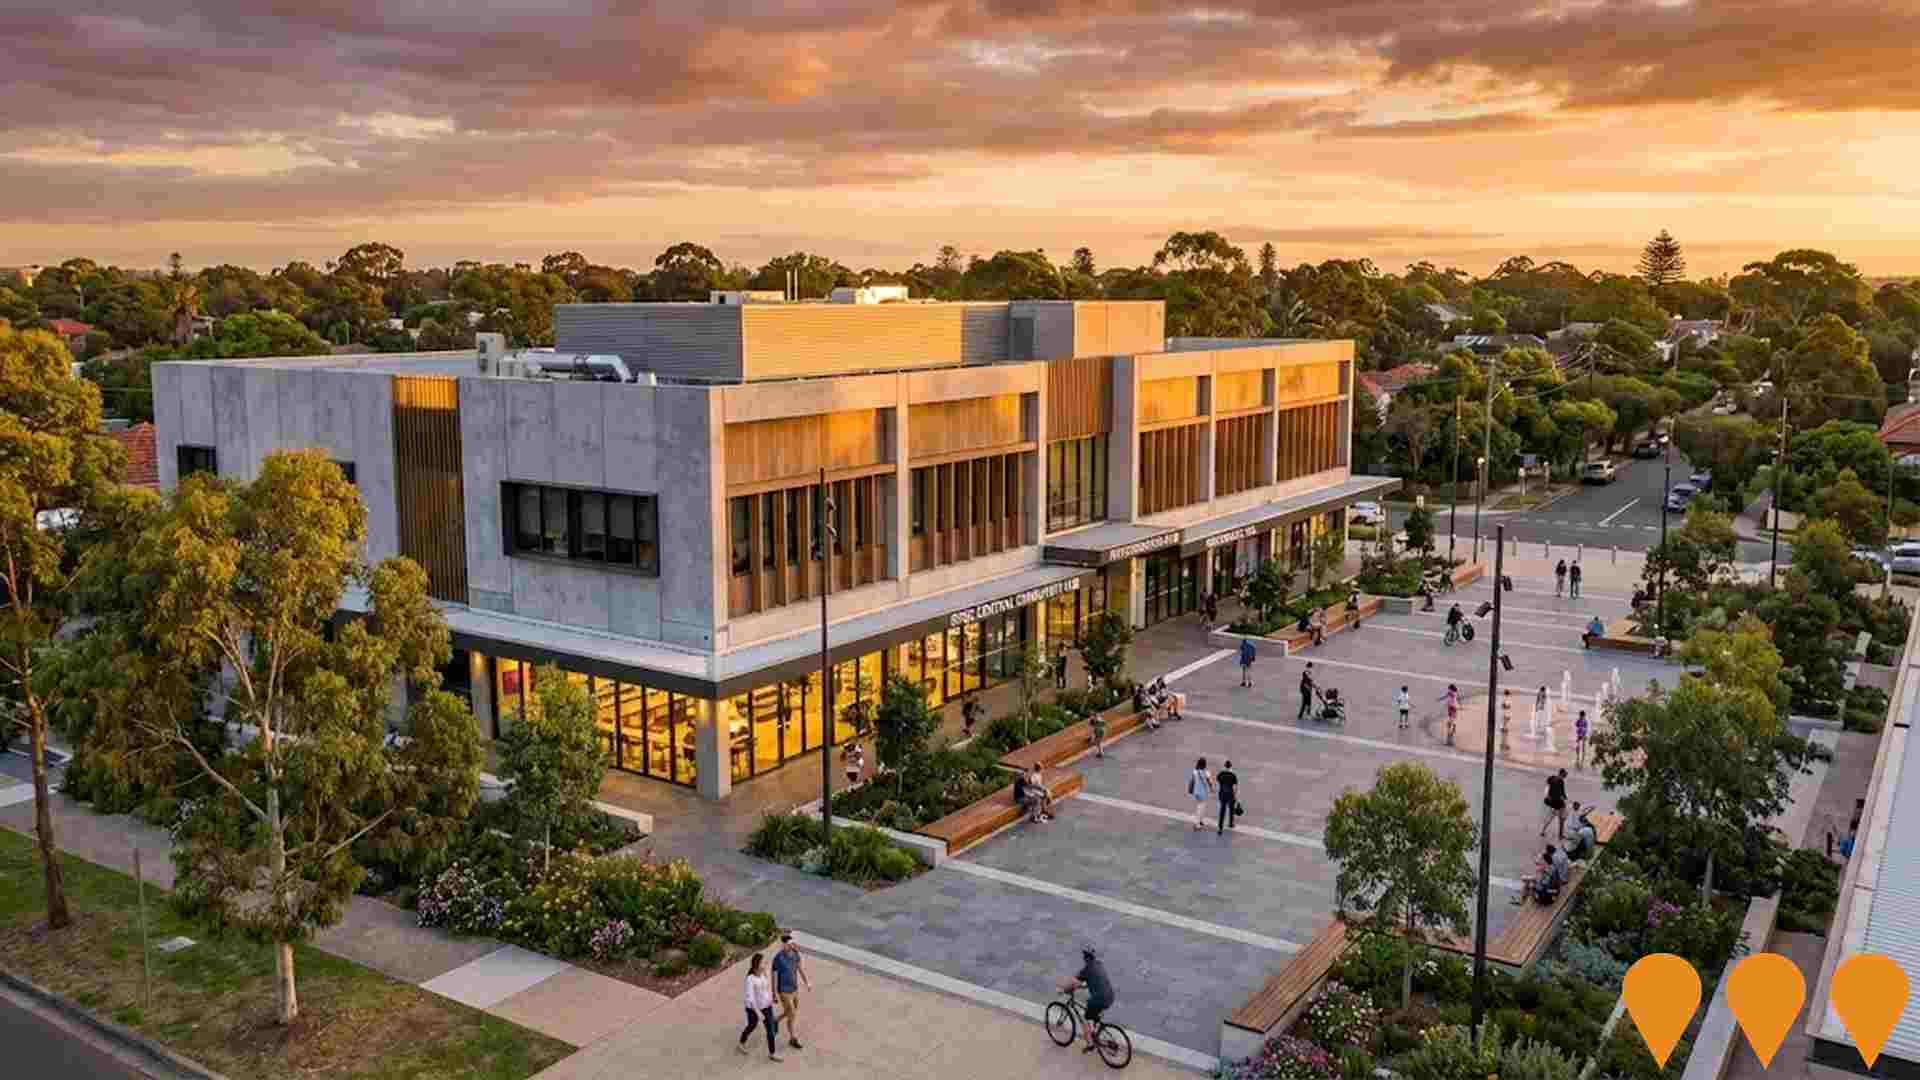
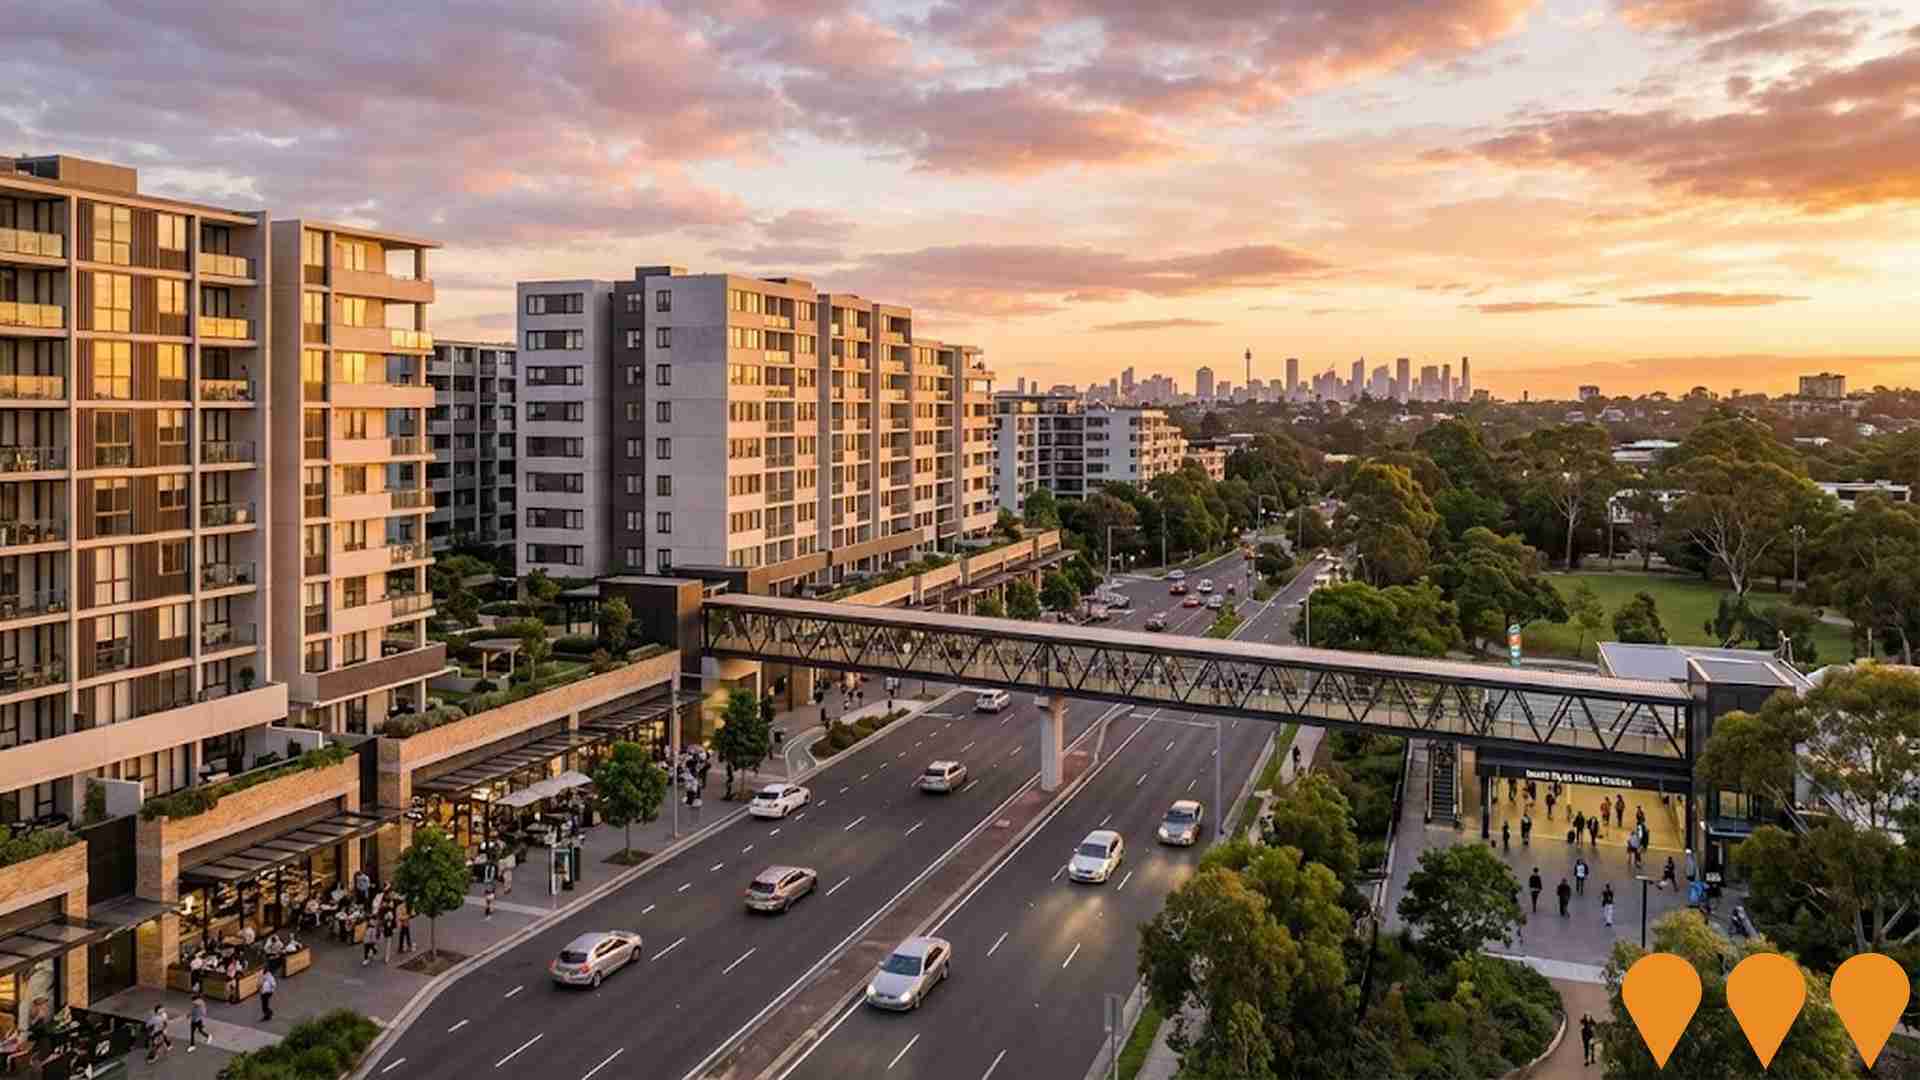
 Denotes AI-based impression for illustrative purposes only, not to be taken as definitive under any circumstances. Please follow links and conduct other investigations from the project's source for actual imagery. Developers and project owners wishing us to use original imagery please Contact Us and we will do so.
Frequently Asked Questions - Infrastructure
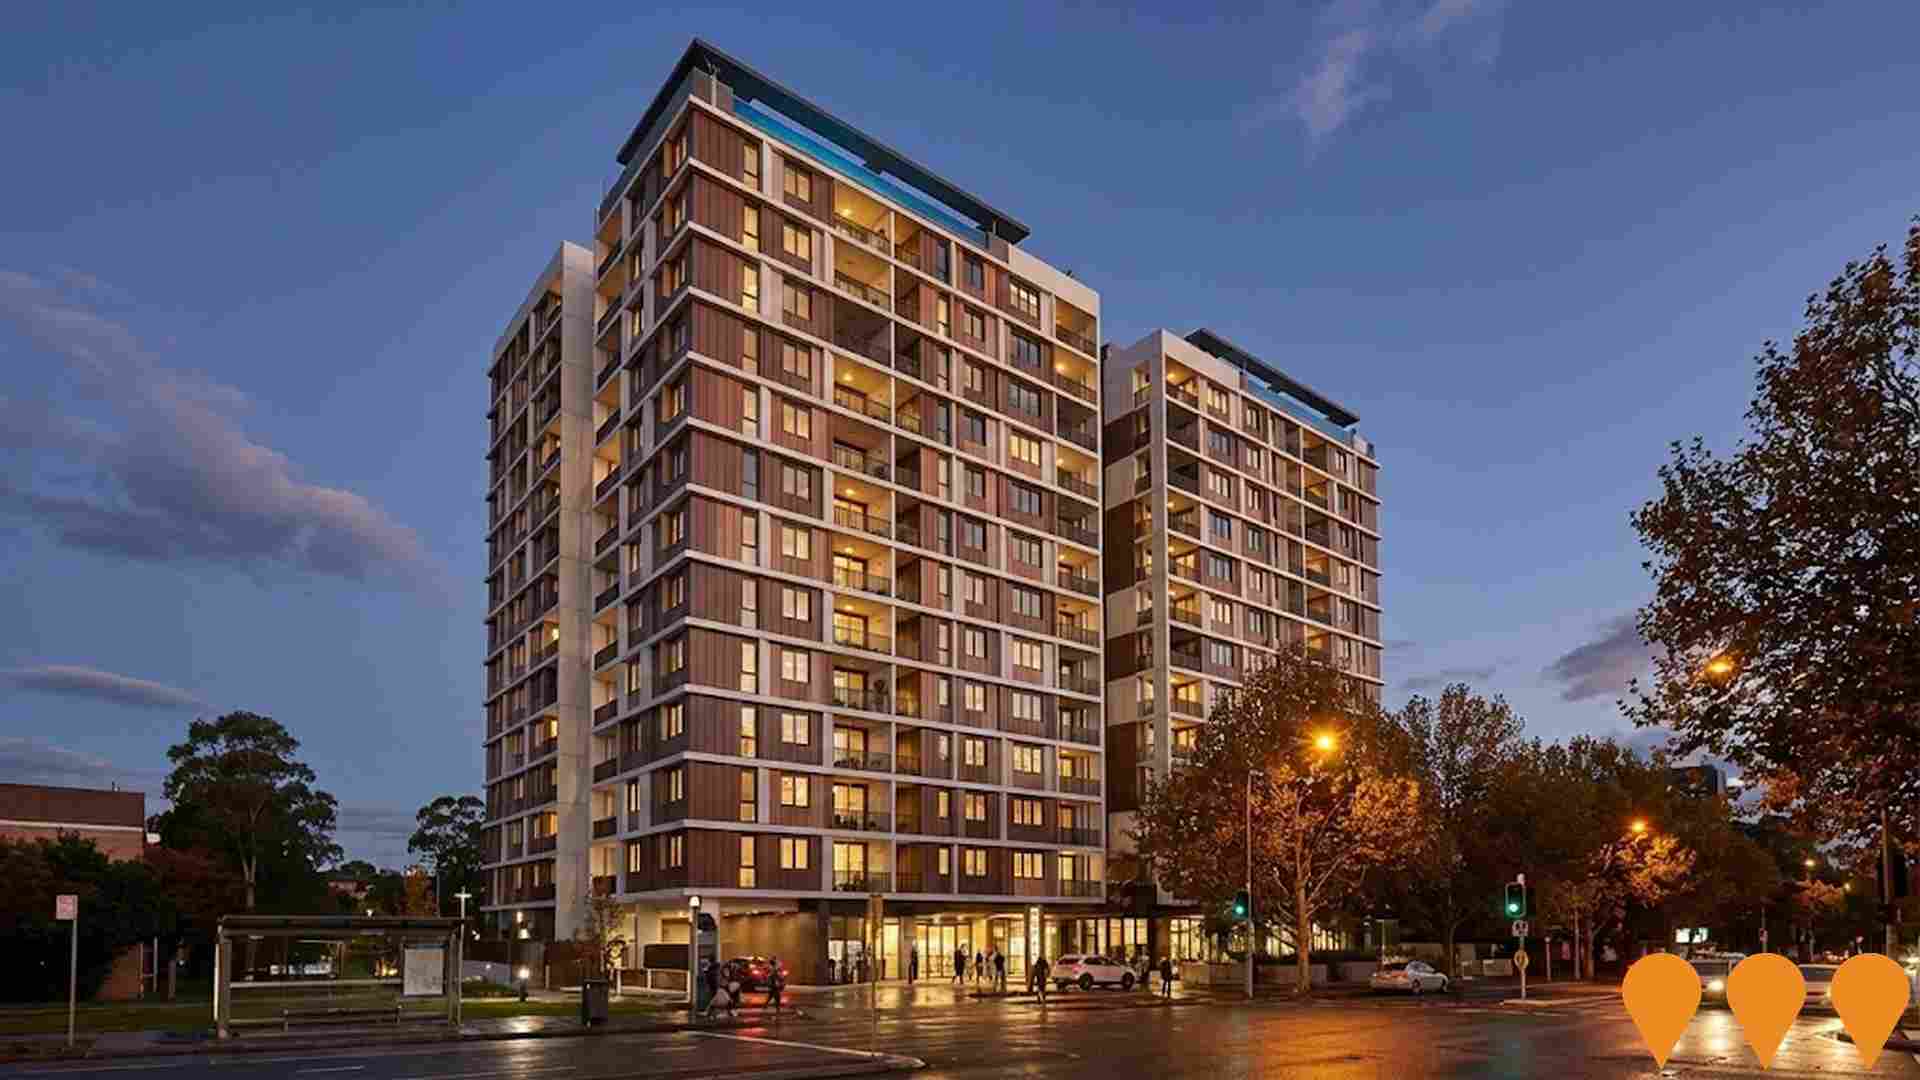
Triniti Lighthouse Build-to-Rent
State significant build-to-rent development comprising 510 rental apartments across three mixed-use buildings ranging from 9 to 20 storeys with ground floor retail and commercial space, communal resident amenities and basement parking. The project was approved by the NSW Independent Planning Commission on 10 July 2025. As of August 2026, no post-approval or construction documents have been published on the NSW Planning Portal and the project remains in the approved phase awaiting further implementation.
Cottonwood Crescent Precinct
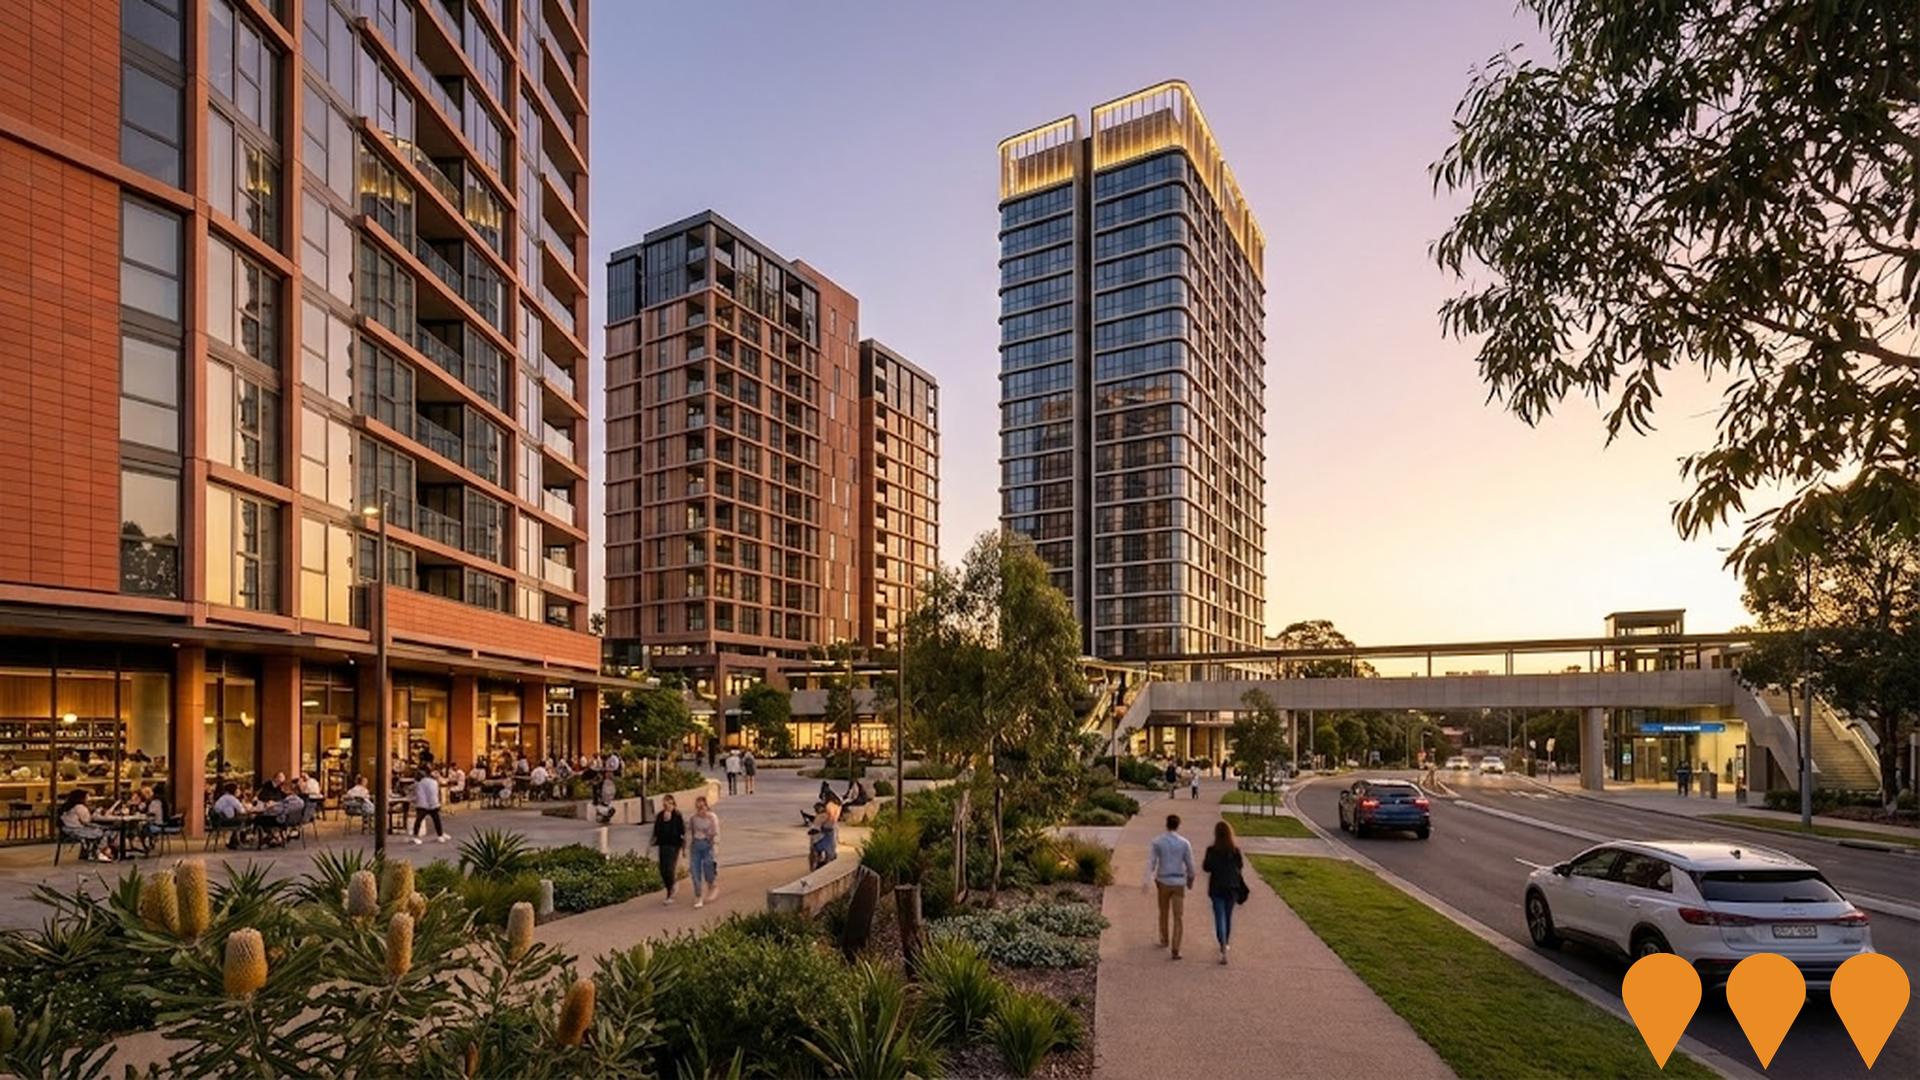
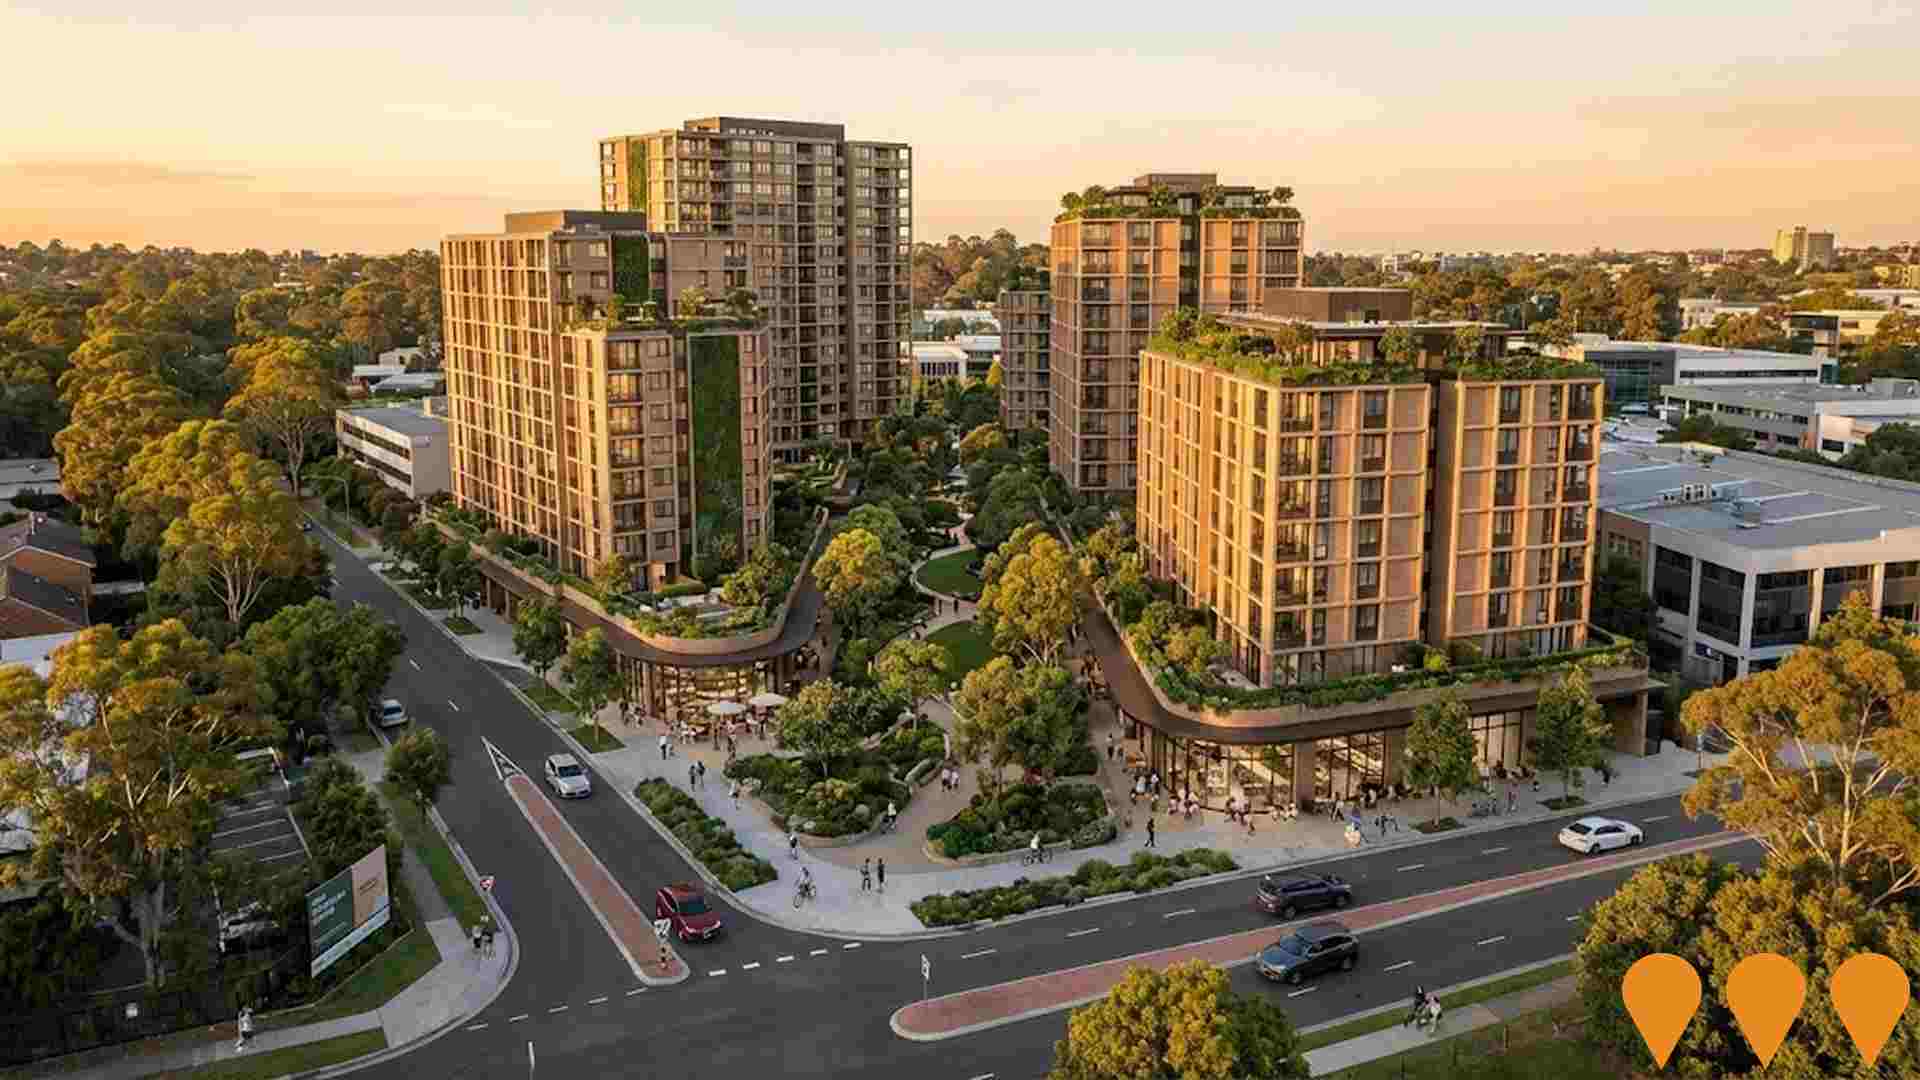
Large-scale mixed-use precinct in Macquarie Park undergoing major transformation from multiple developers. The flagship project is 88 Waterloo (15-21 Cottonwood Crescent) by Billbergia and Legacy Property - two residential towers of 60 and 52 storeys delivering 858 apartments (including 60 affordable), declared State Significant via the Housing Delivery Authority in August 2025 and currently under SSD assessment ahead of public exhibition. Construction is targeted for 2027 with completion by 2030. At 14-16 Cottonwood Crescent, Legacy Property is seeking a further modification for a 21-storey, 126-apartment tower valued at $118.5M.Meriton's Viciniti development on Cottonwood Crescent (approximately 200 apartments) is completed. The precinct is positioned opposite Macquarie University Metro Station and Macquarie Centre, within one of NSW's eight Transport Oriented Development Accelerated Precincts.
North Ryde Station Precinct - Lachlan's Line
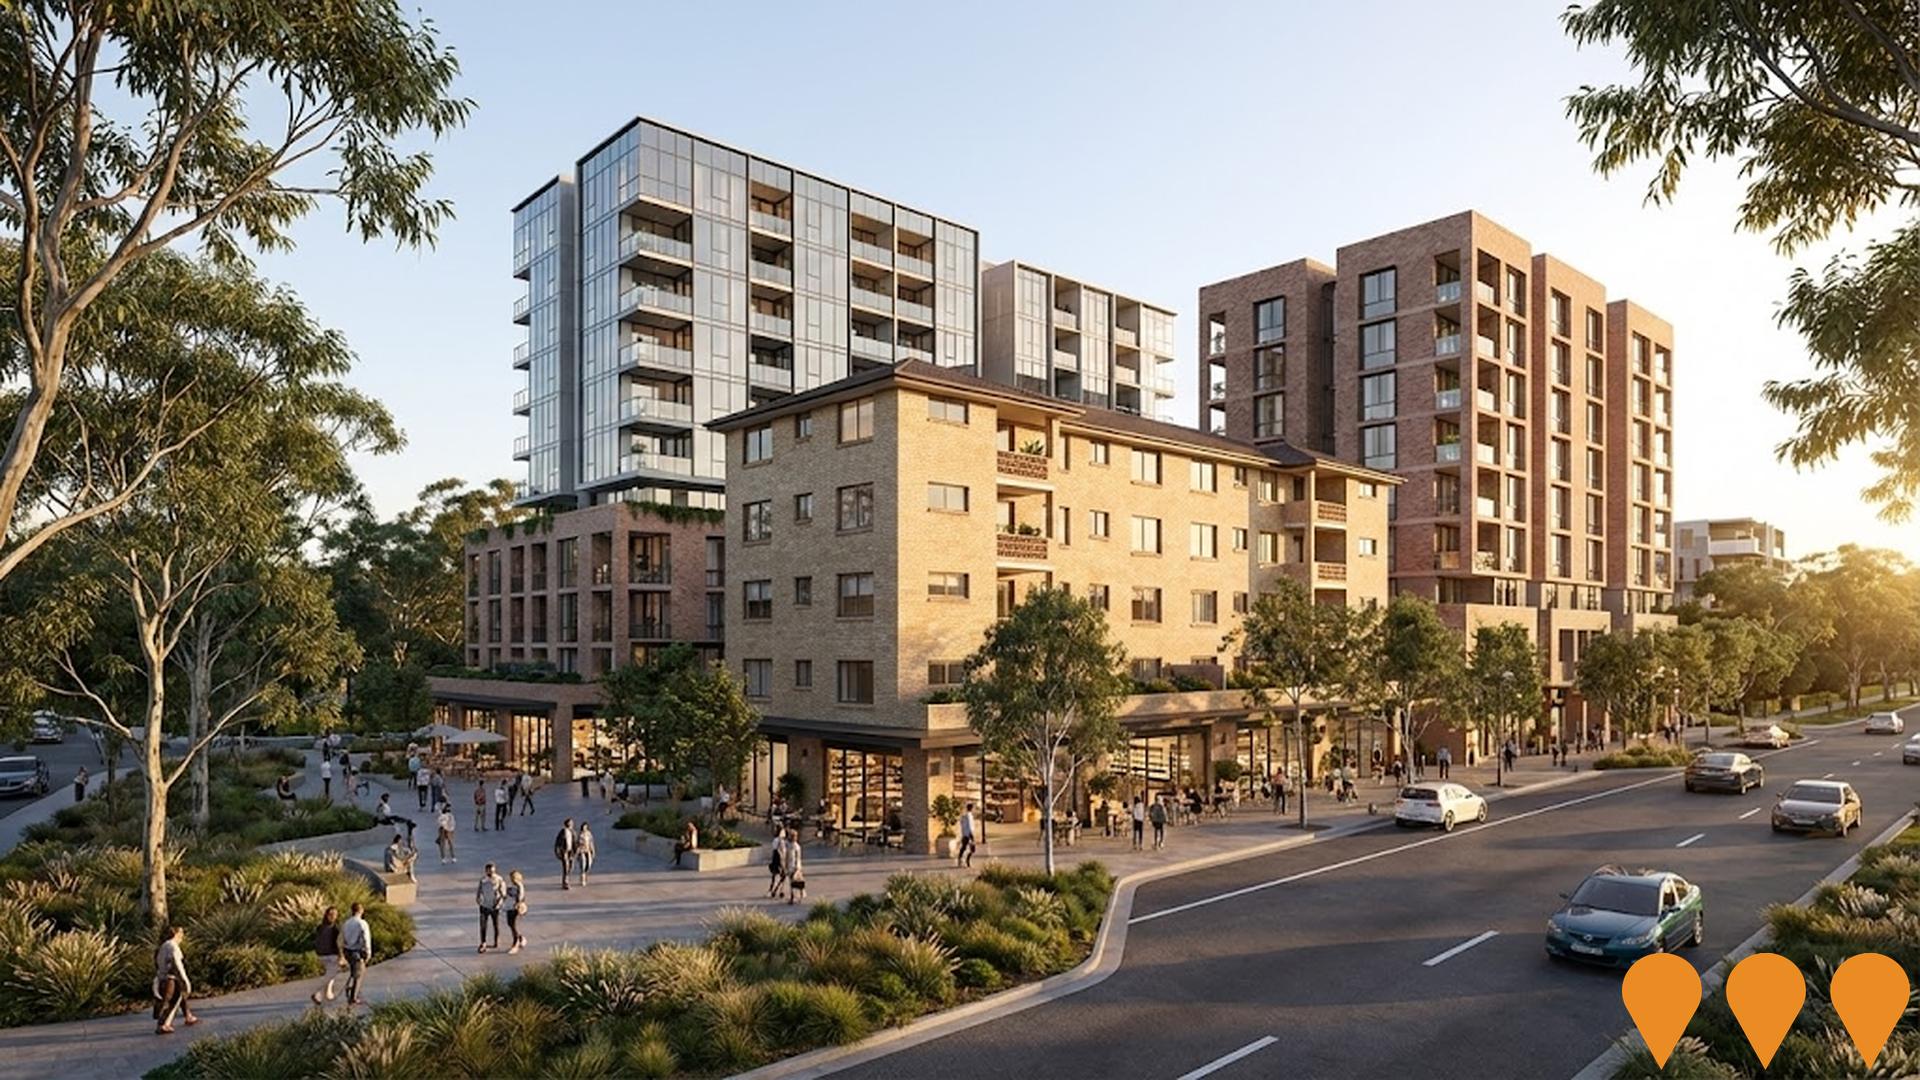
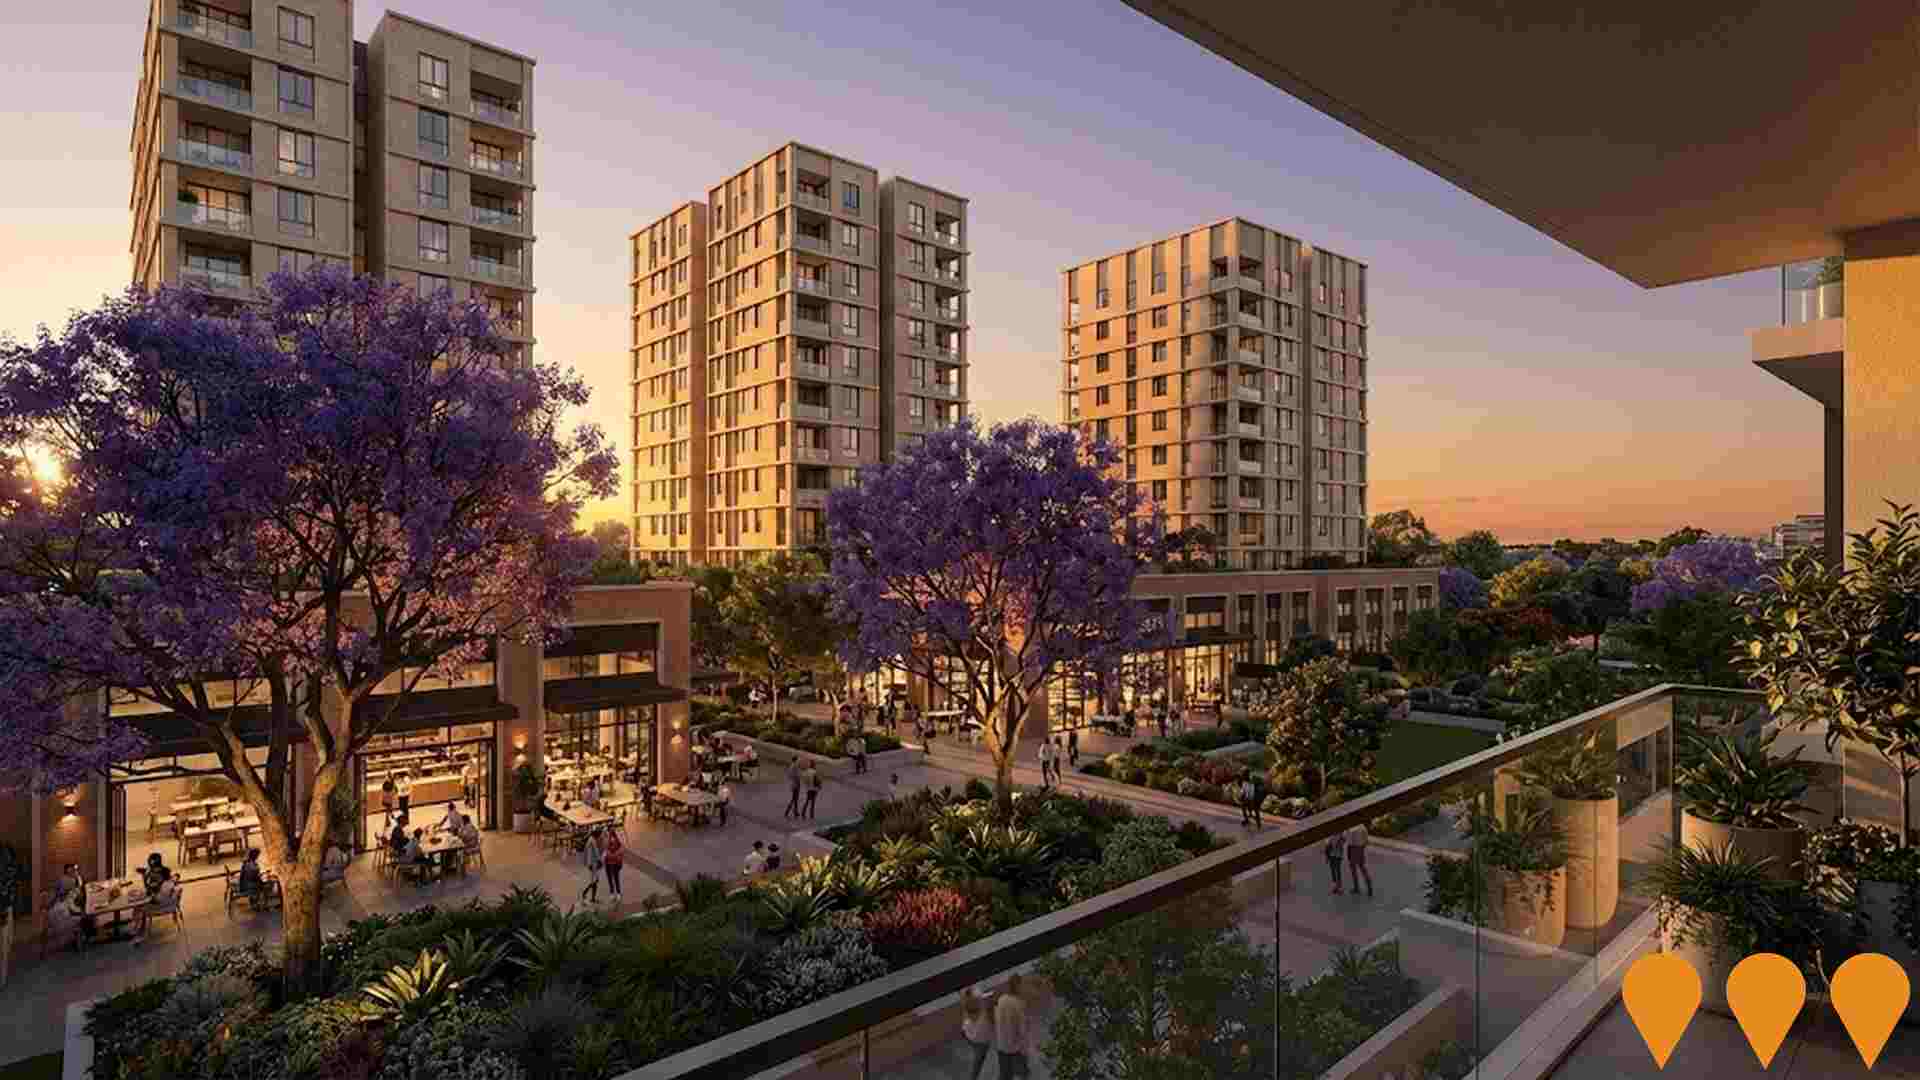
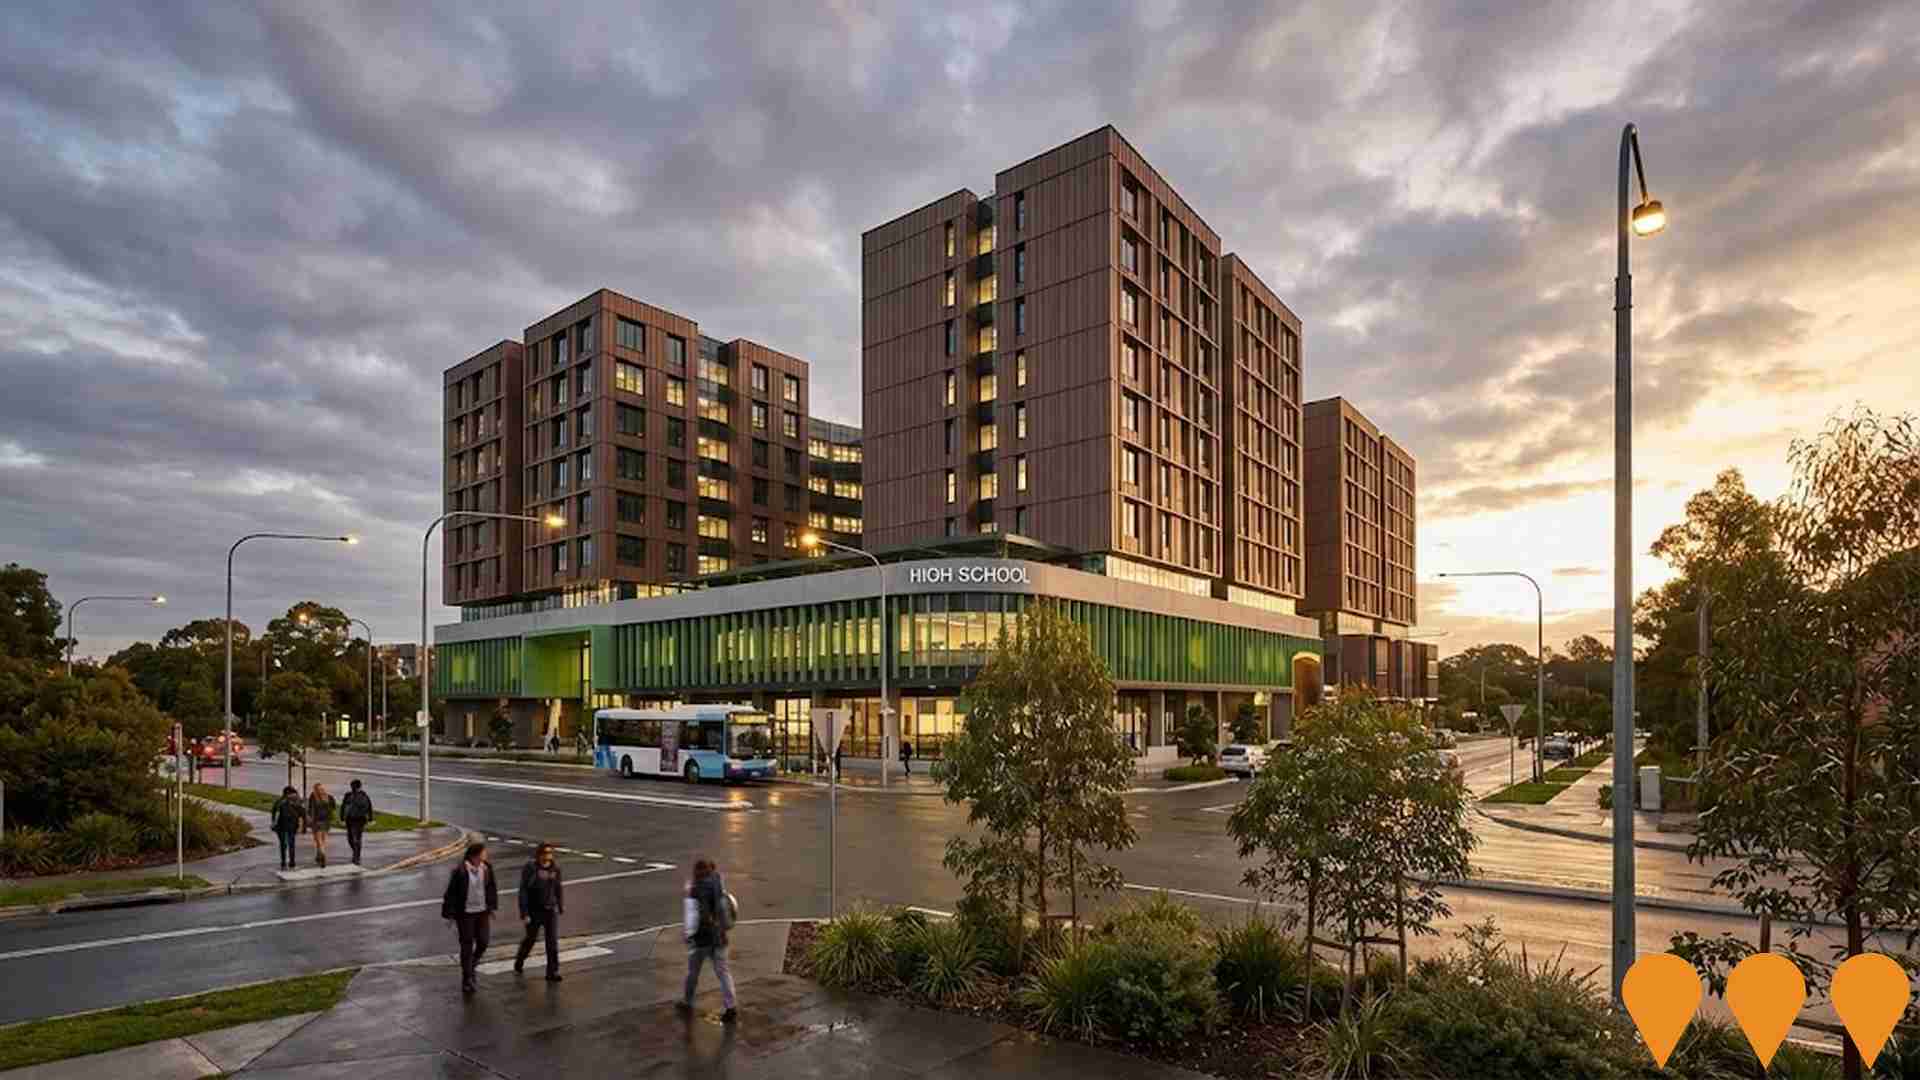
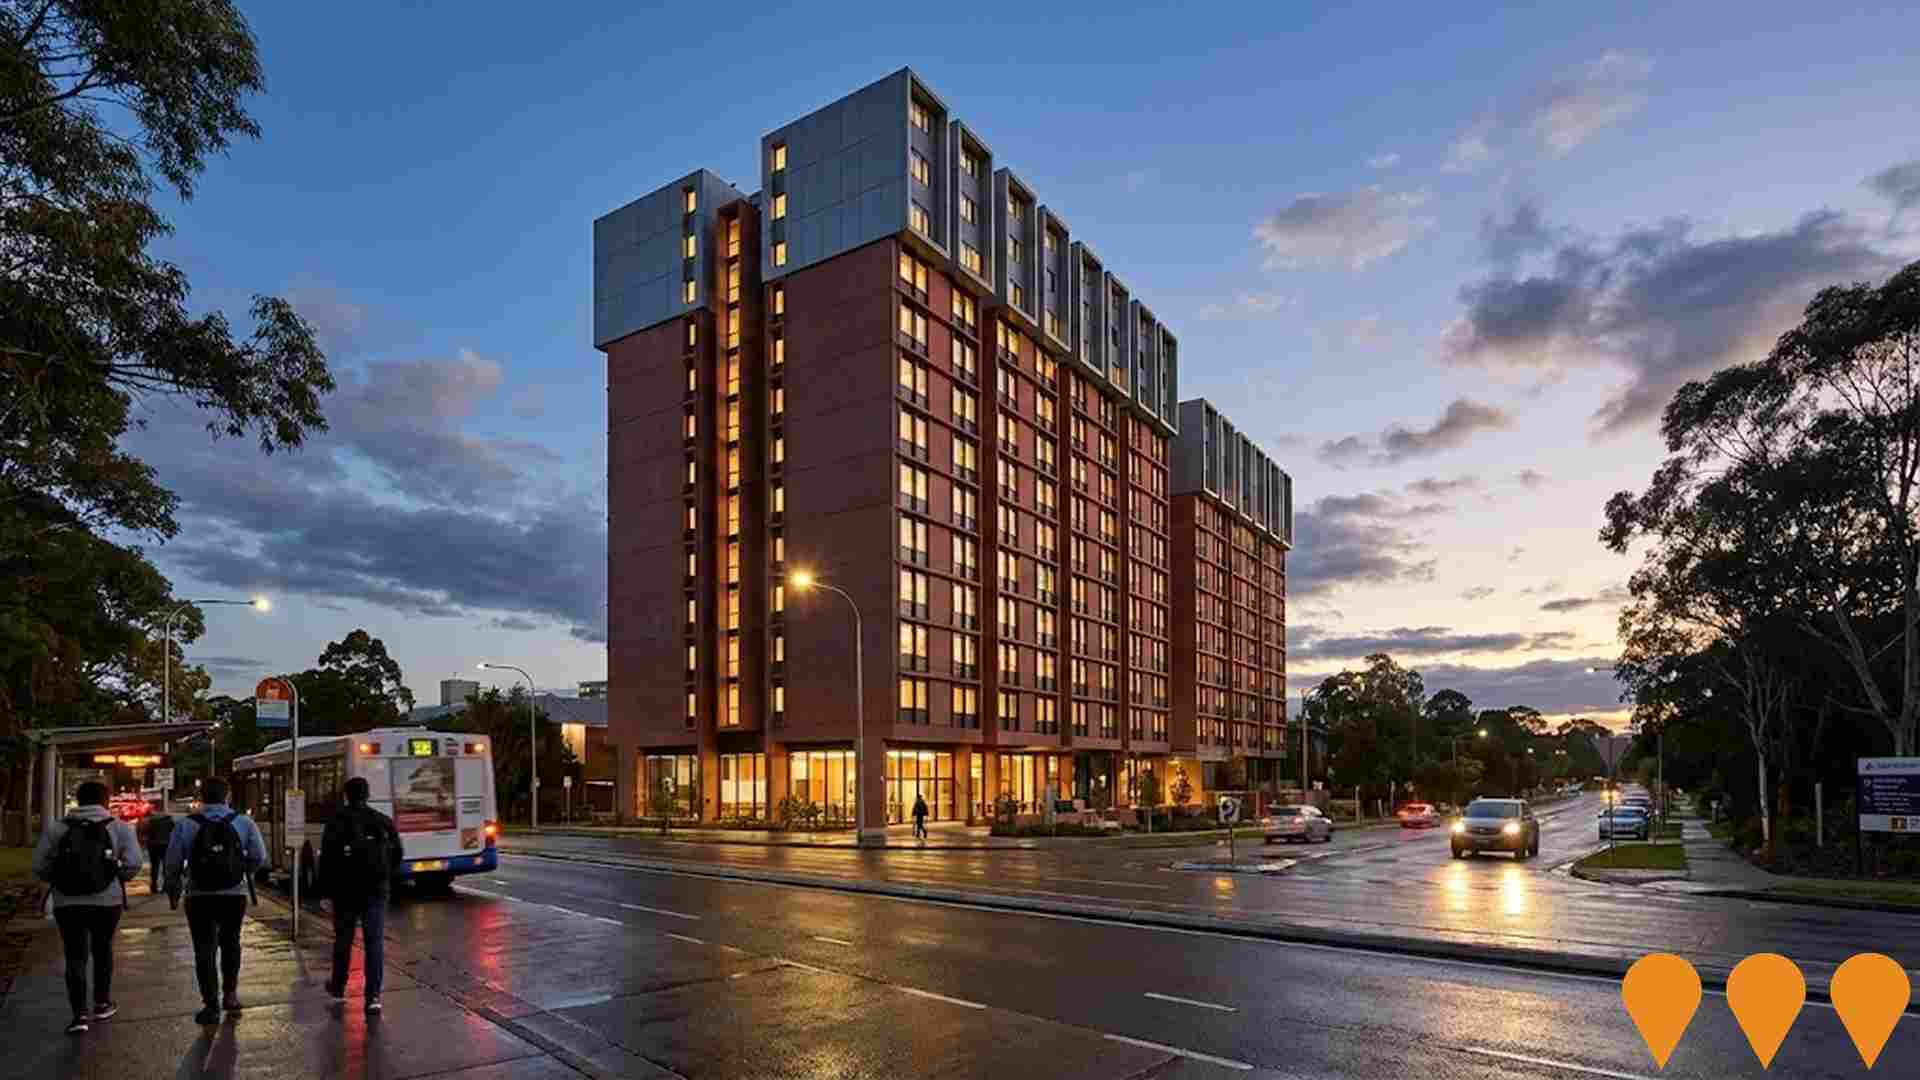
NSW Government and Landcom led mixed-use urban renewal precinct around North Ryde Metro station. Lachlan's Line forms the northern part of the precinct and includes housing, local retail, public open space and community facilities. The precinct was rezoned in 2013 and is approved as a residential and commercial State Significant Development. It is planned to provide about 2700 homes near two metro stations, a bus interchange and the M2 Motorway. The latest major update is the approved Landcom and Link Wentworth Lot 117 affordable housing project at 6 Halifax Street, comprising 135 affordable apartments in a 14 storey building, with work expected to begin in 2025/26 or 2026 and residents moving in from 2028.
124-126 Epping Road Mixed-Use Development
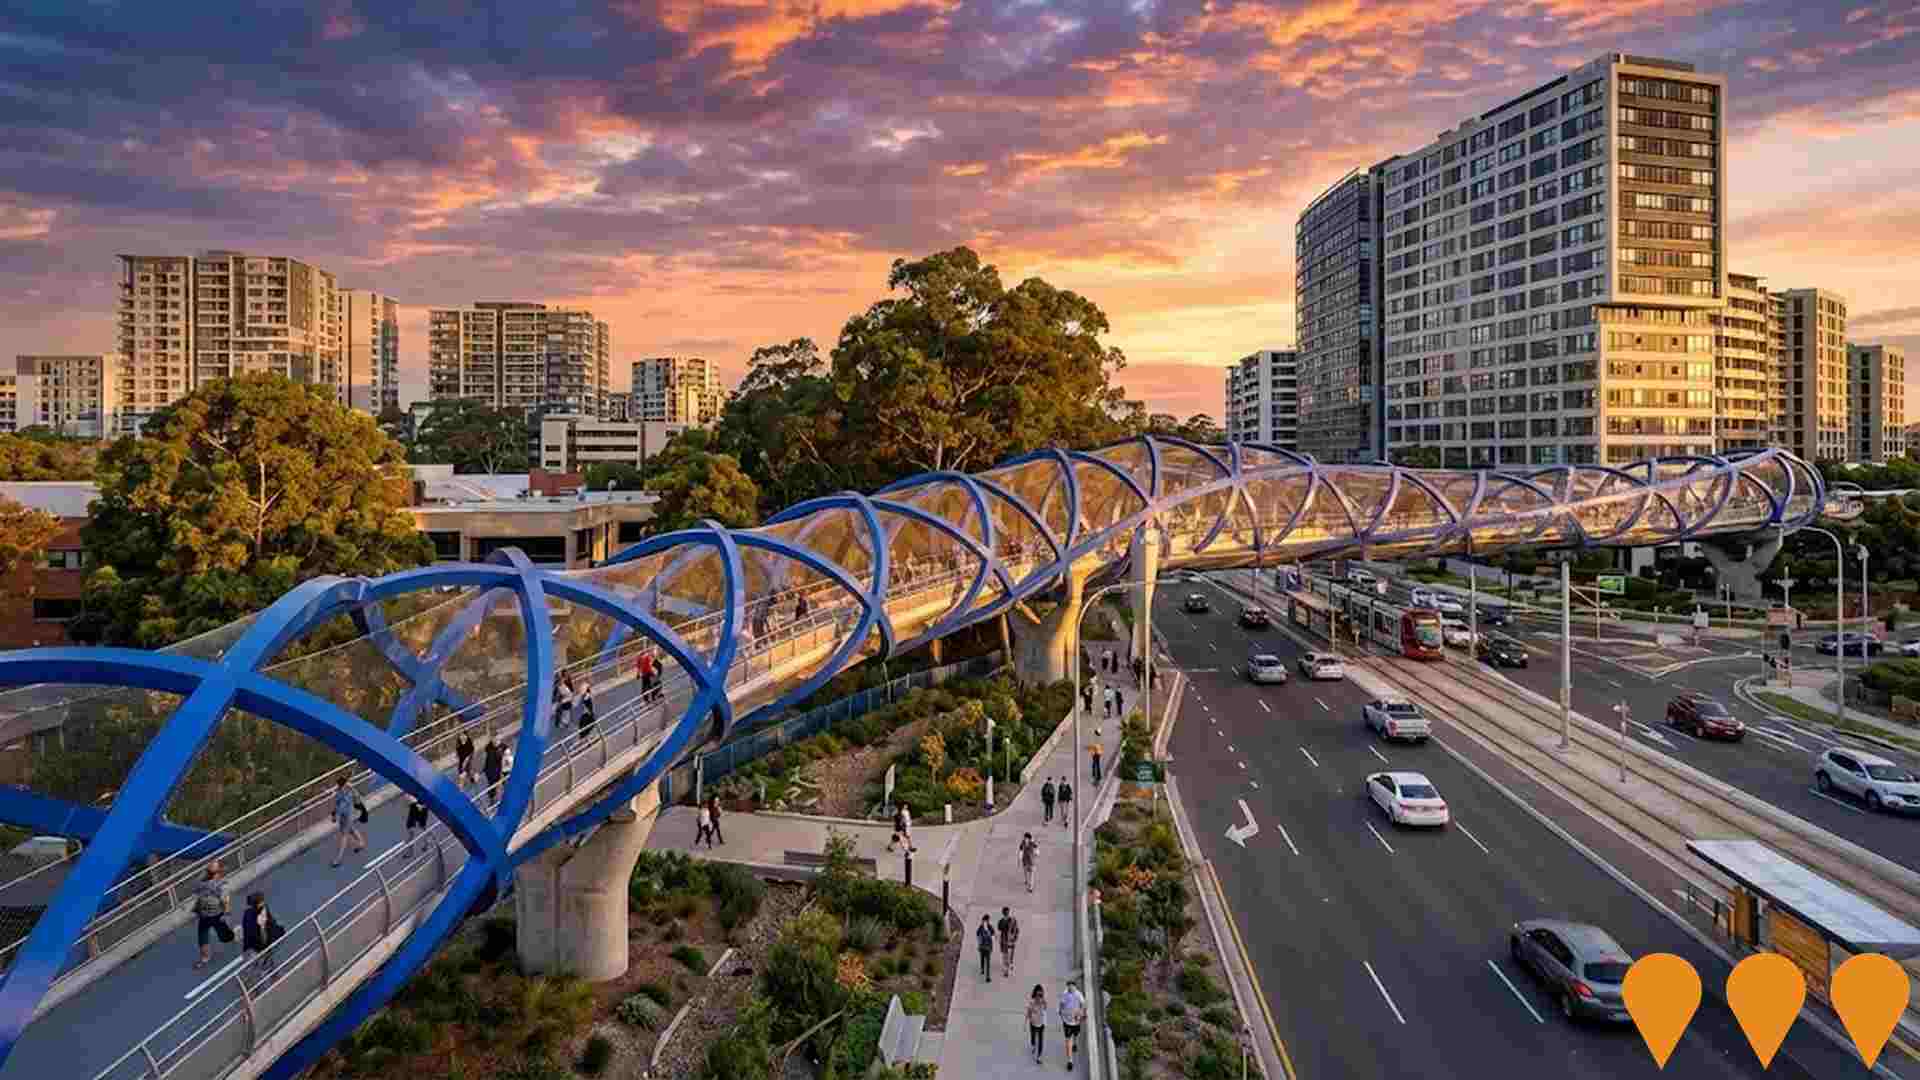
Mixed-use development involving demolition of existing structures and construction of three buildings comprising 78 residential apartments across five low-rise floors, ground floor commercial tenancies including neighbourhood shops, food and drink premises, health consulting rooms and a medical centre. Includes basement parking for 161 vehicles, 55 bicycle storage spaces, communal and private open spaces, landscaping, and site infrastructure upgrades including a new substation. DA approved by the Sydney North Planning Panel (LDA2020/0293) with a capital investment value of $32.6 million.Currently in pre-construction phase.
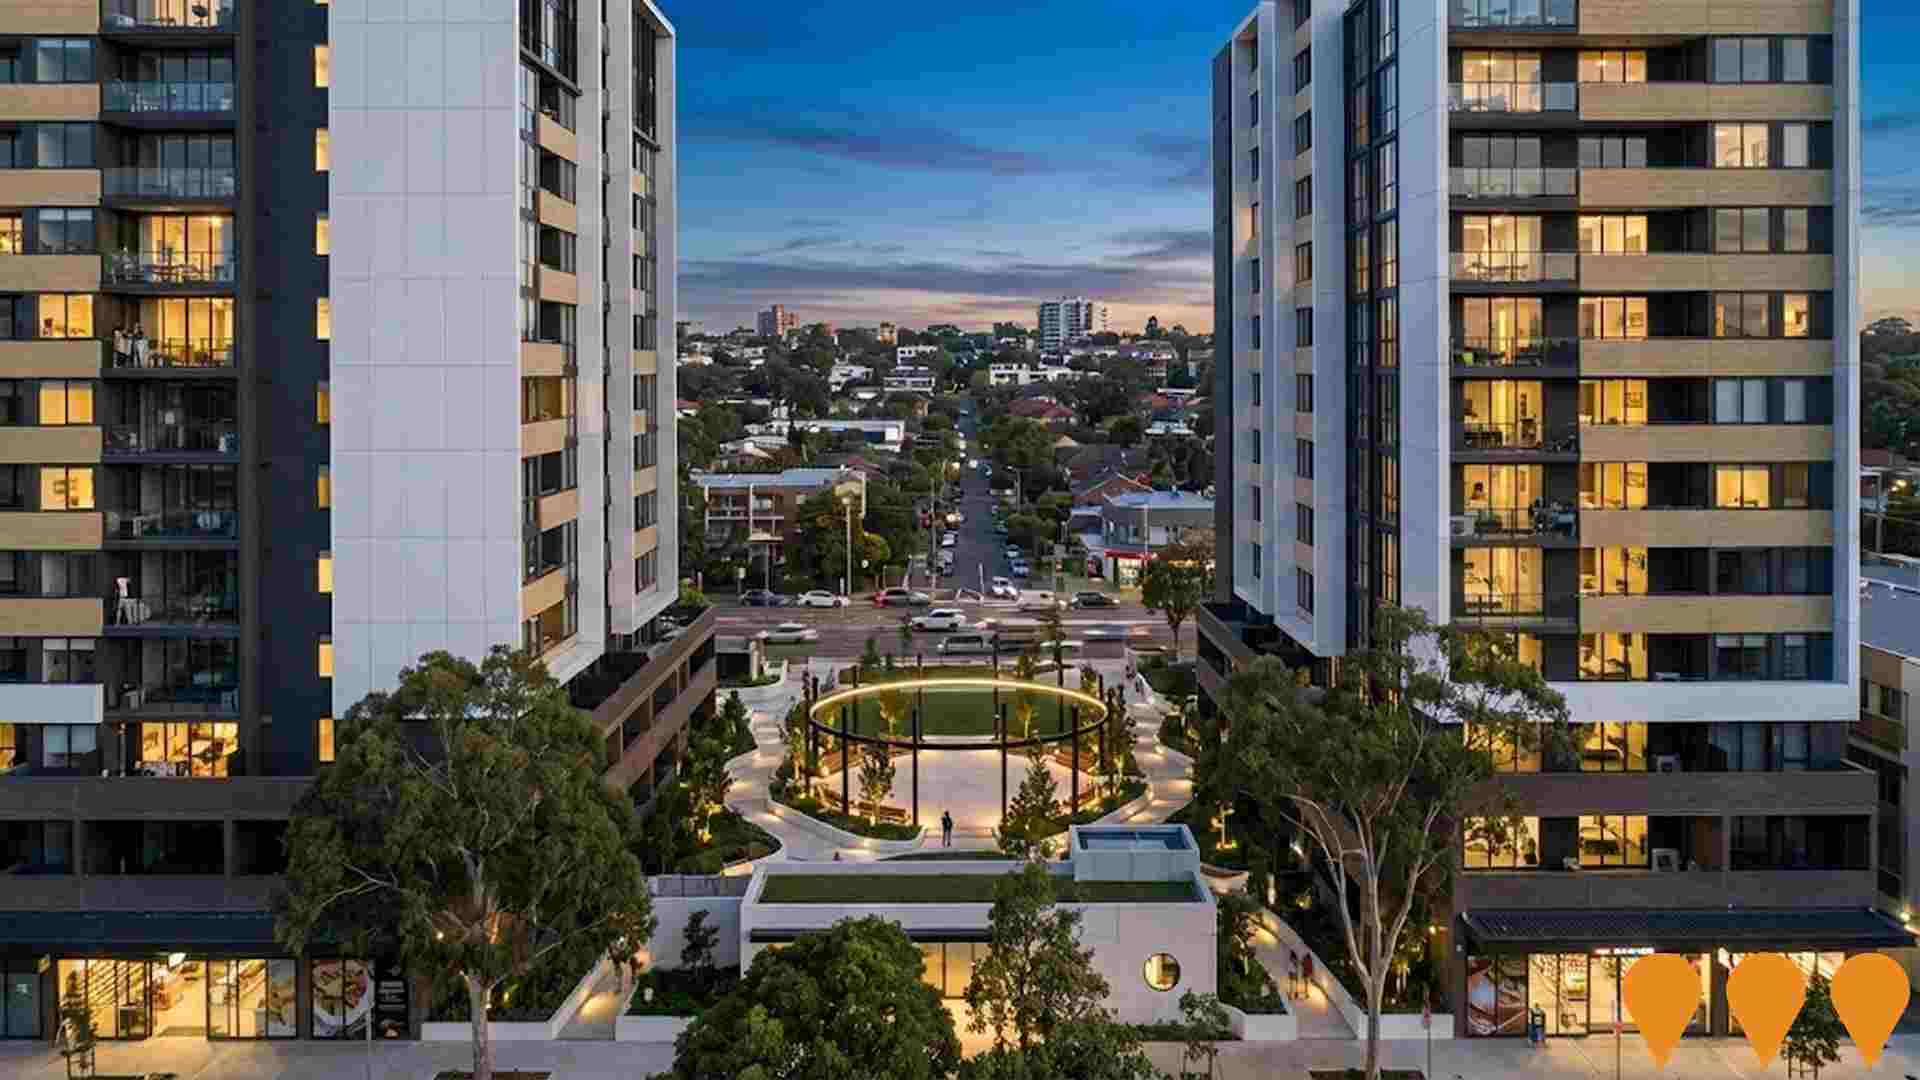
The Macquarie Collection - 3 Halifax Street
The Macquarie Collection is a high-density residential development within the Lachlan's Line precinct. It features two 24-storey towers, with Building B containing 266 apartments. The design by AJC Architects focuses on vertical living with a central urban backyard, podium-level greenery, and sustainable architectural elements. The project is located 600 metres from North Ryde Metro Station.
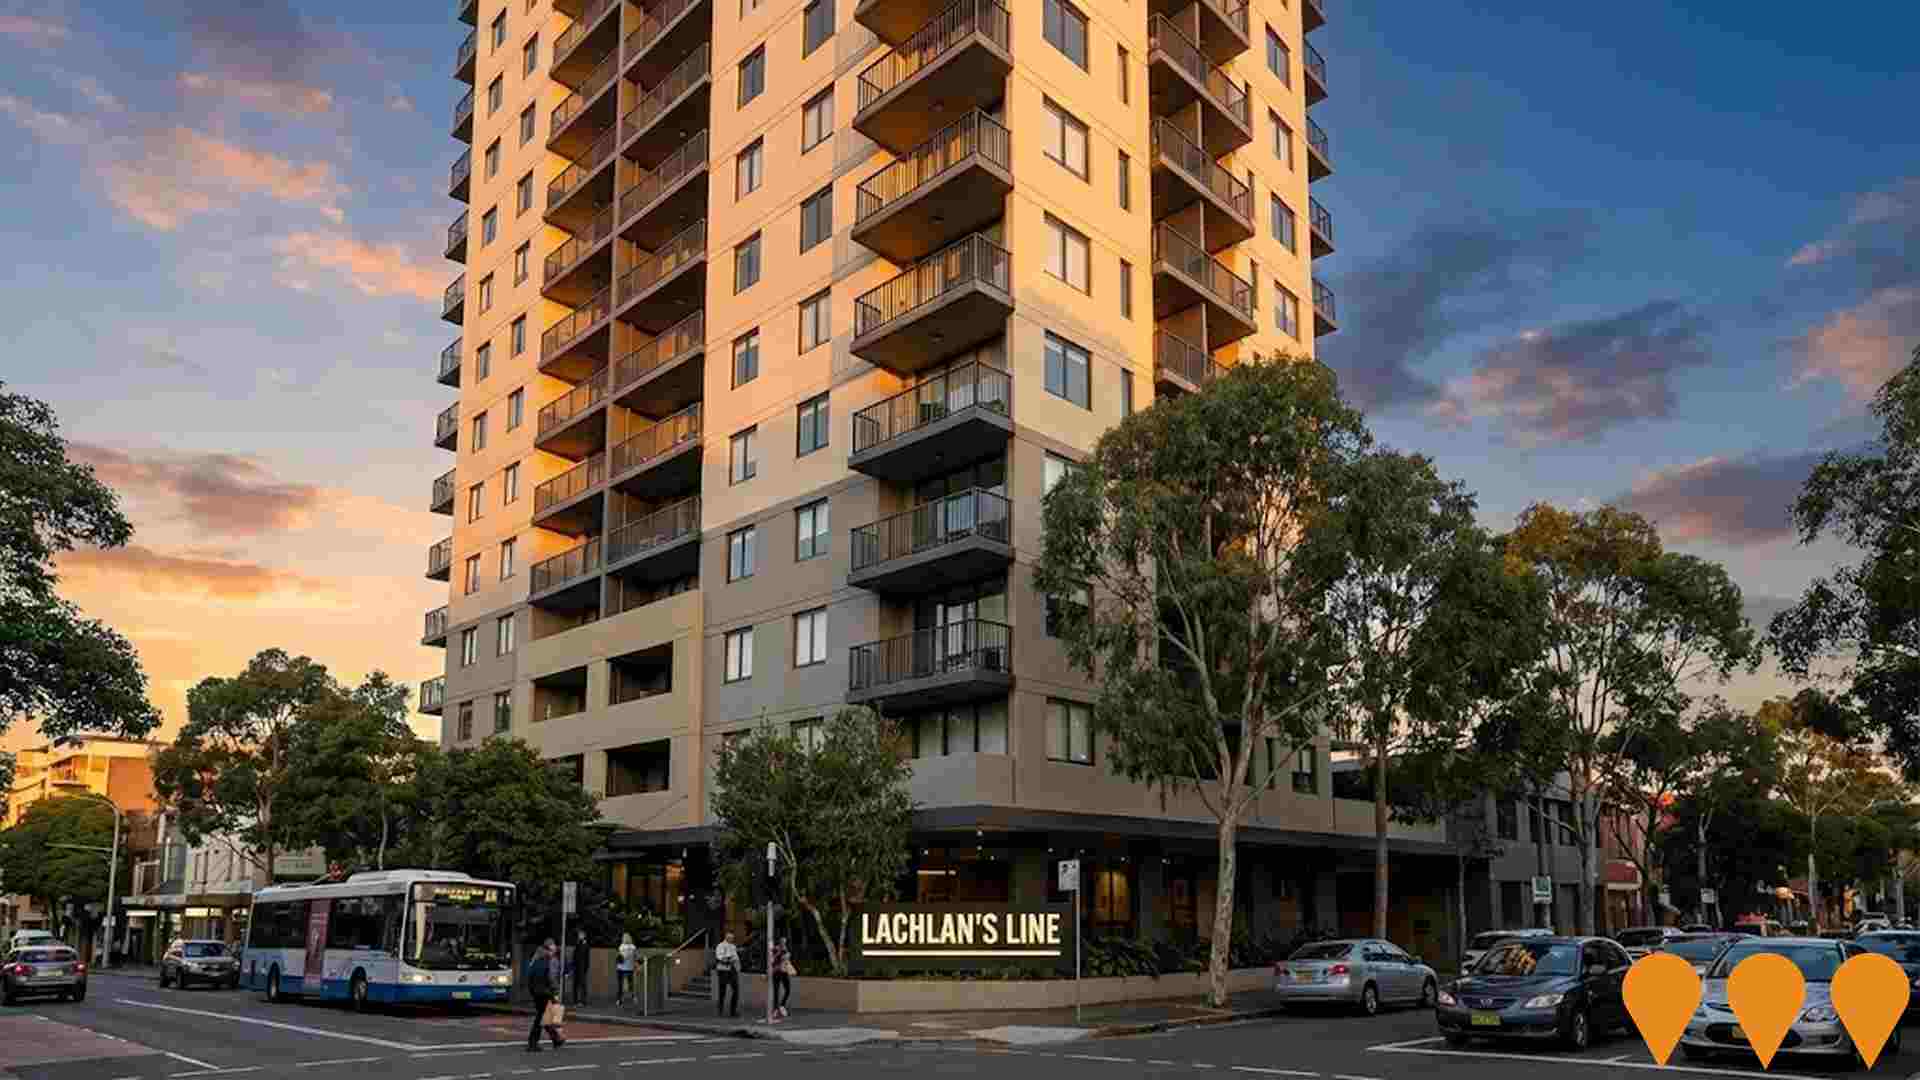
Lachlan's Line Building A (24-storey)
The Macquarie Collection (Building A) is a 24-storey residential tower within the Lachlan's Line precinct. Developed by Landmark Group and designed by AJC Architects, the tower comprises 234 apartments and five basement levels with 245 parking spaces. The project is a major component of the transit-oriented urban renewal at Macquarie Park, featuring sustainable design, landscaped communal areas, and direct connectivity to the North Ryde Metro. Construction is in advanced stages with completion targeted for late 2026.
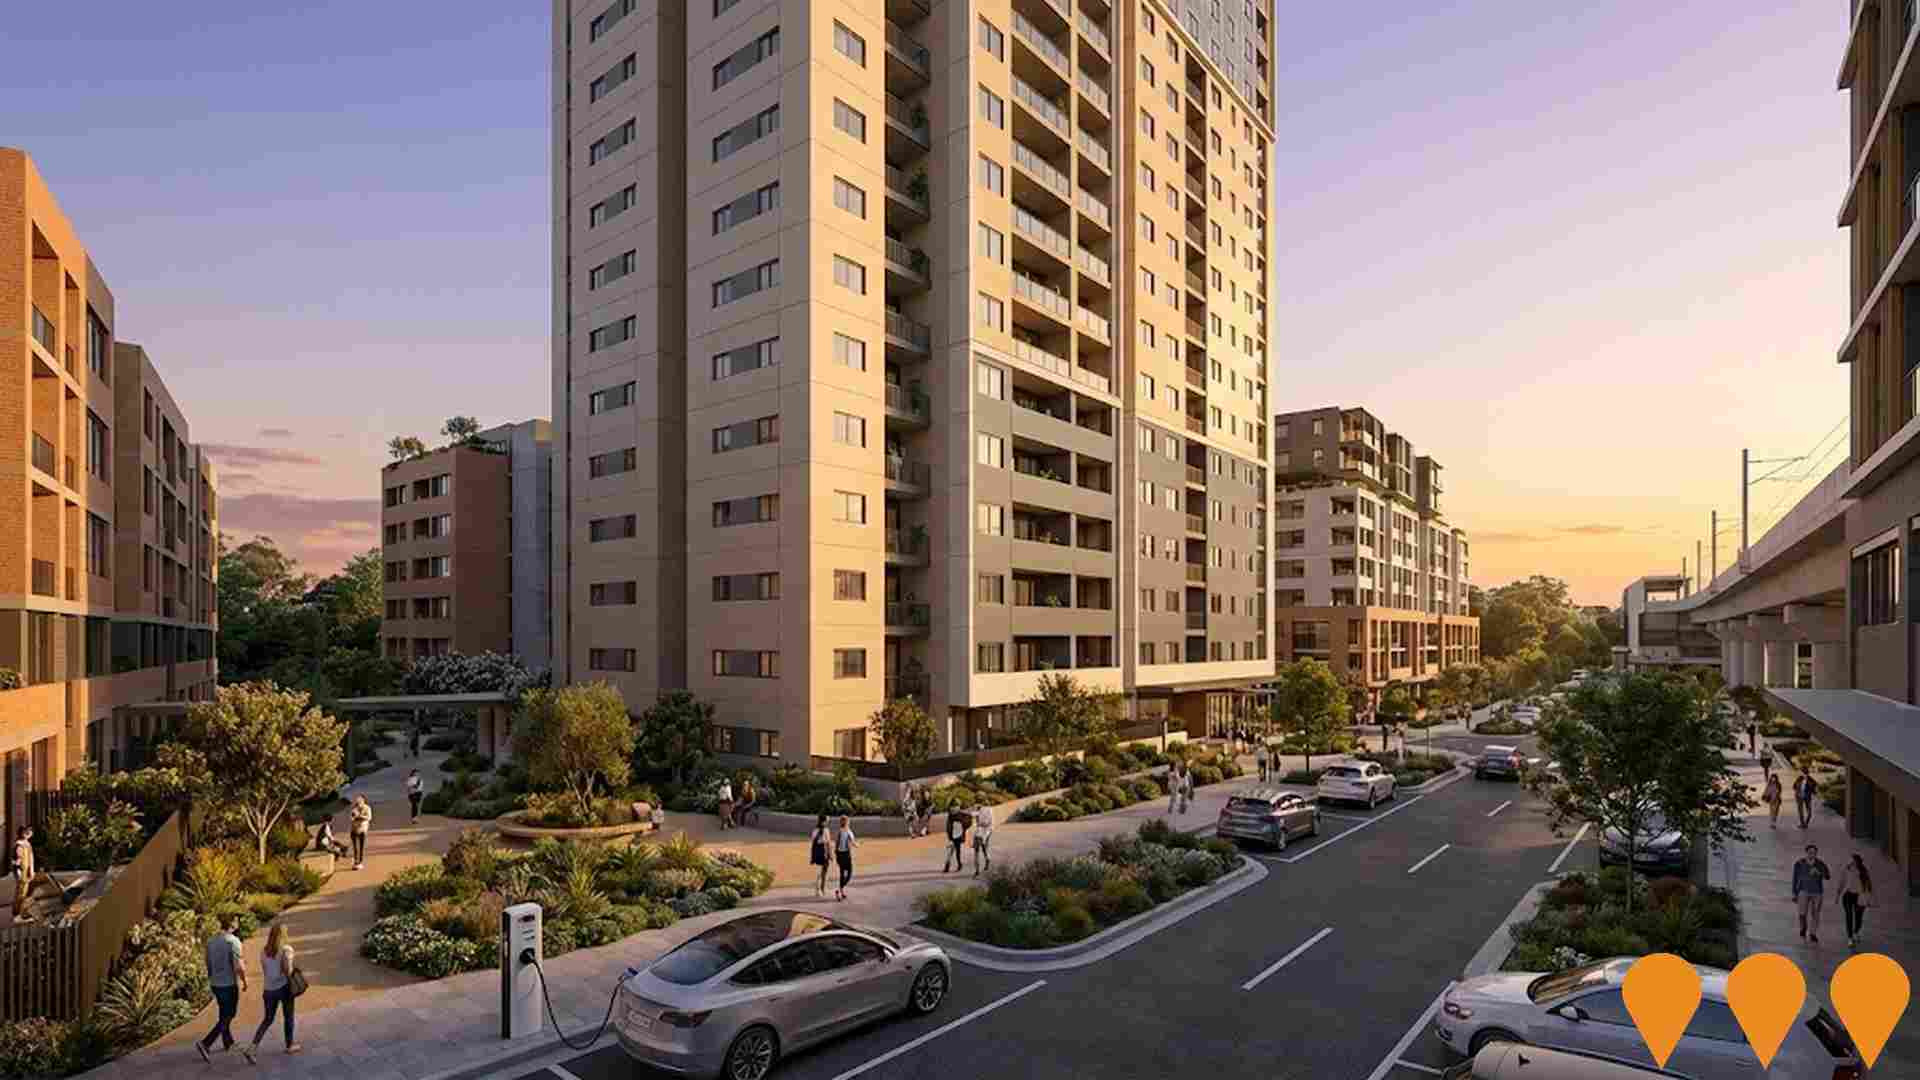
Julius Avenue Data Centre
A six-storey data centre (approx. 36,648 sqm GFA) proposed for 6-8 Julius Avenue, North Ryde, within the Macquarie Park Technology Precinct. The facility will house 12 data halls delivering an IT load of 115.2MW and a peak power draw of 170MW, with an ancillary five-storey office building, enclosed generator gantry with 72 diesel backup generators, and a new Ausgrid 132kV subtransmission switching station. The $1.58 billion State Significant Development application (SSD-80018208) progressed to Response to Submissions stage on the NSW Planning Portal as of late 2025.Community and environmental objections have centred on the removal of 509 trees including old-growth habitat adjacent to Lane Cove National Park. Construction is projected to generate over 3,400 direct jobs, with approximately 50 permanent operational staff.
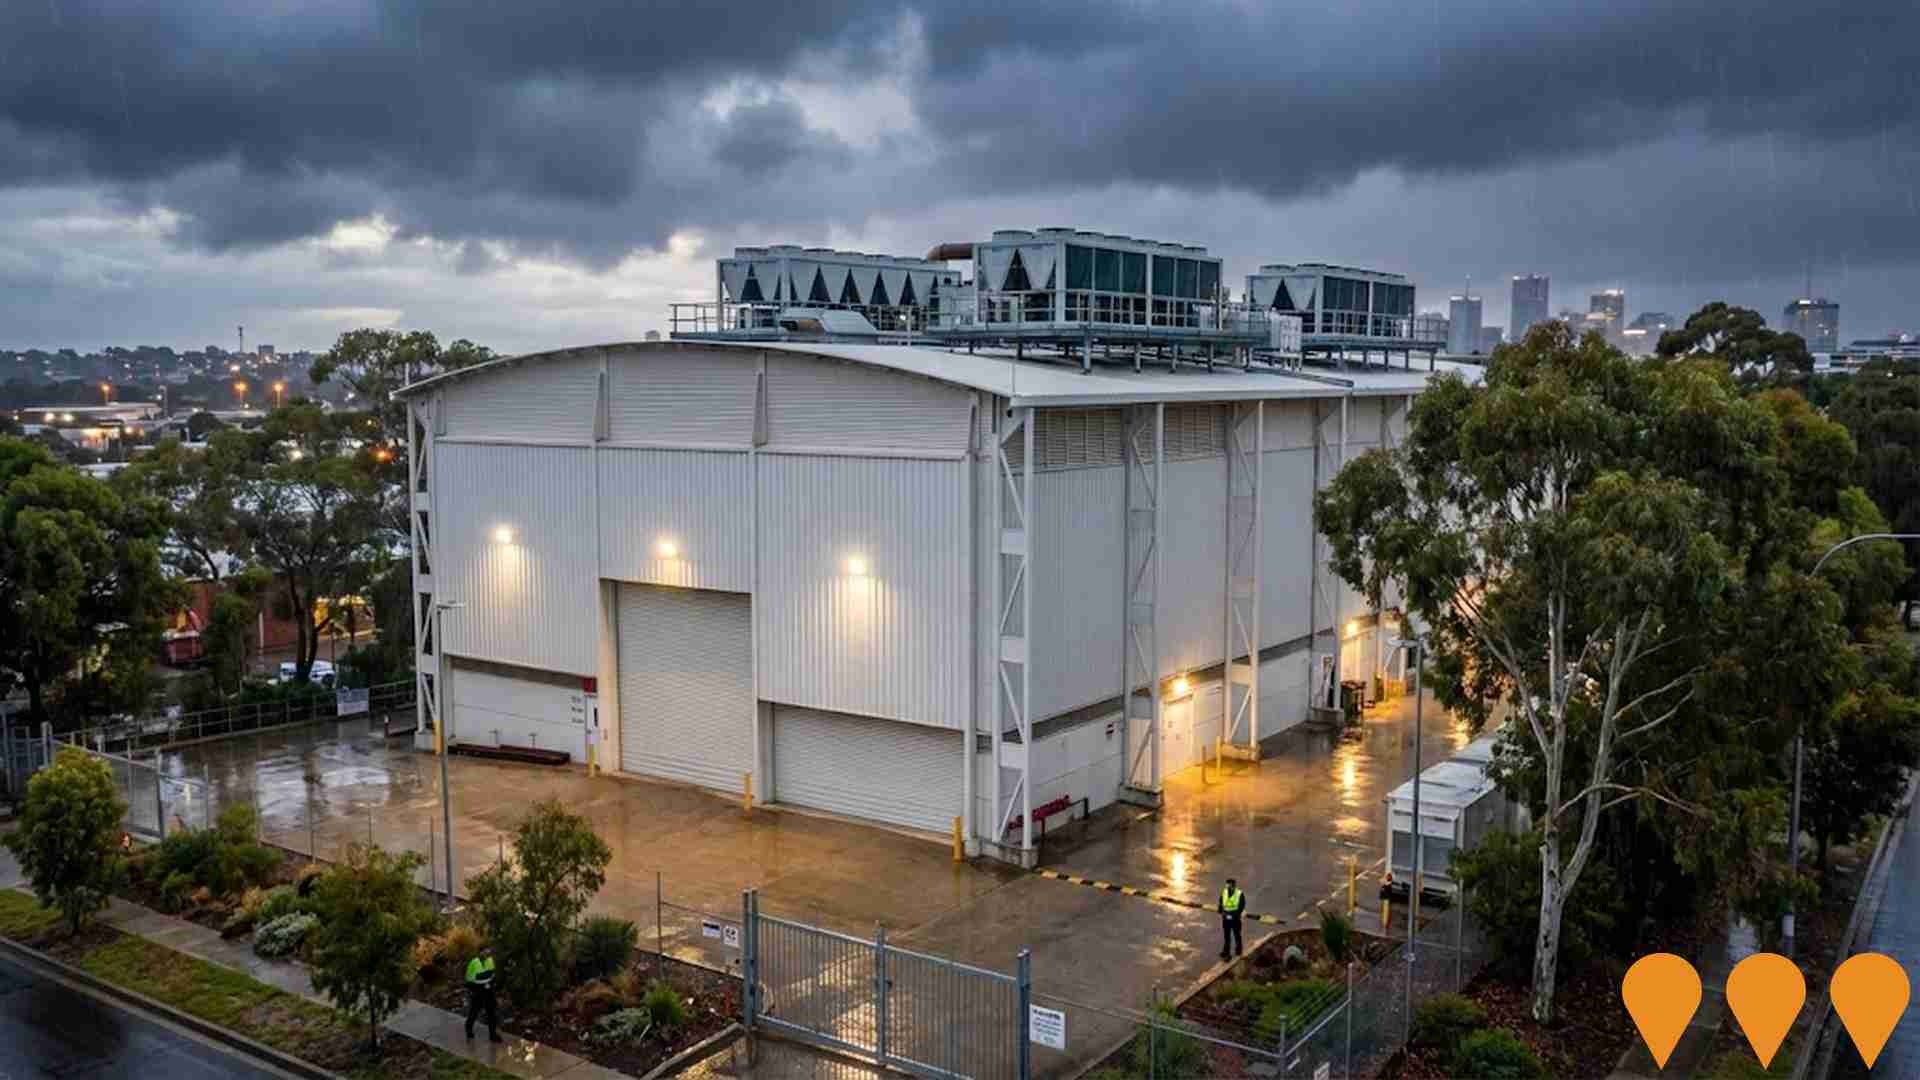
M_Park Macquarie Technology Centre
Stockland's approximately $2 billion M_Park is a multi-stage life sciences and technology innovation precinct in the Macquarie Park Innovation District. Stage 1 includes three premium commercial buildings, a data centre, retail and hospitality, and a 2,500 sqm public park. Building 11 is operational with tenants including CHEP, Demant and WiSE Medical, while Buildings 15 and 17, including Johnson & Johnson's new Australian headquarters, are in the final stages of construction.



10,060 residents of North Ryde - East Ryde are employed, from a labour force of 10,328. Unemployment sits at 2.6%, with participation at 74.5%. Weighted for its industry mix, the area's sectors are forecast to grow about 7.2% nationally over five years. That reflects industry composition only and makes no allowance for local population growth. The working-day population is estimated at 17,988, about 108% of the resident population, so the area draws in more workers than it sends out. Unemployment and labour force come from ABS Small Area Labour Markets, updated quarterly; the industry and occupation profile is from the 2021 Census.
Detail
The local labour market in North Ryde - East Ryde features a well-credentialed talent pool, highlighted by strong concentration in the technology industry, a low jobless rate of 2.6%, and 0.7% annual growth in total employment. As of March 2026, employed residents total 10,060, keeping unemployment 1.5% beneath the 4.1% recorded for Greater Sydney, while local workforce engagement remains exceptionally high at 74.5% compared to 68.9% across Greater Sydney. Census returns showed 57.5% of working residents operating from home, an outcome influenced by prevailing Covid-19 health restrictions. Resident employment demonstrates high concentrations across professional & technical services, health care & social assistance, and finance & insurance.
Industry specialization is most pronounced in professional & technical fields, where the local representation is 1.5 times the regional benchmark. Conversely, construction represents an undersized segment, engaging 6.1% of the North Ryde - East Ryde labour pool against 8.6% across Greater Sydney. A local employment ratio of 0.8 workers for each resident at the Census indicates a healthy availability of jobs in the immediate area. AreaSearch evaluation of SALM and ABS statistics shows that during the 12 months to March 2026, resident employment rose by 0.7% alongside a 0.8% expansion in the labour force, resulting in a 0.2 percentage points increase in the local unemployment rate. Across Greater Sydney over the identical timeframe, employment increased by 1.9%, the labour supply rose by 1.9%, and unemployment declined slightly. National employment projections released by Jobs and Skills Australia in Mar-26 provide additional context regarding future sector demand across North Ryde - East Ryde over five and ten-year horizons. Across Australia, workforce size is projected to grow by 6.6% over five years and 13.7% over ten years, though individual industry trajectories vary. Weighting these sectoral estimates against the resident employment structure points to potential local job gains of 7.2% over five years and 14.5% over ten years (representing an indicative weighting model that excludes specific local demographic projections).
Frequently Asked Questions - Employment
Median household income in North Ryde - East Ryde is $2,439 a week (about $127,000 a year), with median personal income at $1,054 a week. ATO records put median taxable income at $63,974 a year against an average of $82,809. Household income is from the 2021 Census; taxable income is from ATO Taxation Statistics for the latest financial year available, indexed forward using the ABS Wage Price Index.
Detail
ATO taxation statistics aggregated at postcode level by AreaSearch for financial year 2023 show the North Ryde - East Ryde SA2 generating a median taxpayer income of $63,974 alongside an average of $82,809. These metrics sit high on a nationwide scale, comparing favorably with Greater Sydney's median of $60,817 and average of $83,003. Applying a 10.32% increase in line with the Wage Price Index since financial year 2023 brings estimated current figures to roughly $70,576 for the median and $91,355 for the average as of March 2026. Data from the 2021 Census confirms that individual, family, and household earnings within North Ryde - East Ryde rank in the 82nd to 89th percentiles nationwide.
The single largest income bracket comprises 28.0% of earners making $1,500 - 2,999 weekly (4,658 residents), aligning with the 30.9% regional proportion in that tier. Affluence is highlighted by 41.5% of households earning more than $3,000 per week, reinforcing strong local spending power. While accommodation costs account for 16.5% of total earnings, robust household revenue sustains disposable income levels at the 87th percentile, positioning the district within the 9th decile on the SEIFA income index.
Frequently Asked Questions - Income
North Ryde - East Ryde had 5,503 occupied dwellings at the 2021 Census, 62% detached houses and 28% apartments. 34% are owned with a mortgage, 35% rented and 31% owned outright. At that Census the median rent was $521 a week and the median mortgage repayment $2,800 a month, a total housing cost higher than 92% of areas nationally. Rent absorbs 21.4% of household income here and mortgage repayments 26.5%. Dwelling stock, tenure and housing costs are 2021 Census measures — the only source that counts dwellings at this boundary size.
Detail
At the time of the latest Census, the North Ryde - East Ryde housing stock consisted of 61.8% houses and 38.2% other dwellings (including semi-detached properties, apartments, and alternative accommodation forms), compared to 55.9% houses and 44.1% other dwellings throughout the Sydney metro area. Full home ownership stood higher than the metropolitan benchmark at 31.0%, while the remaining tenure split consisted of properties under a mortgage (34.2%) and rental accommodations (34.8%). Typical monthly mortgage expenses reached $2,800, well above the Sydney metro median of $2,427, while typical weekly rental costs registered at $521 against $470 across metropolitan Sydney.
On a national basis, local mortgage outlays substantially exceed the Australian figure of $1,863, with median rent tracking far above the $375 recorded nationwide.
Frequently Asked Questions - Housing
North Ryde - East Ryde counted 5,503 households at the 2021 Census, an estimated 5,861 today, averaging 2.7 people each. 40% are couples with children, more than in 78% of areas nationally, against 26% couples without children. 21% of households are people living alone, and families average 1.3 children. Household and family composition is measured only by the Census, so these are 2021 figures.
Detail
The local household structure is predominantly family-based, accounting for 75.2% of total dwellings and consisting of couples with children (39.5%), childless couples (26.0%), and single parent families (8.6%). Non-family living arrangements account for the other 24.8% of households, led by single-person residences at 21.0% and shared group dwellings at 3.7%. Typical household size stands at 2.7 people, matching the average recorded across Greater Sydney.
Frequently Asked Questions - Households
50.9% of adults in North Ryde - East Ryde hold a university qualification, including 31.6% with a bachelor degree and 16.4% with postgraduate qualifications, higher than 83% of areas nationally. A further 12.7% hold a vocational qualification. 5 schools serve the area, with 1,013 enrolment places and an average ICSEA of 1,108 against a national benchmark of 1,000. Qualifications come from the 2021 Census; school enrolments, ICSEA and results come from ACARA's current release.
Detail
Formal qualifications across North Ryde - East Ryde track well above state and national standards, with 50.9% of persons aged 15+ holding a higher education credential compared to 30.4% in Australia and 32.2% in NSW. This educational standing establishes a strong foundation for participation in the knowledge economy. The largest tertiary cohort holds bachelor degrees at 31.6%, followed by postgraduate degrees (16.4%) and graduate diplomas (2.9%). Vocational training encompasses 22.9% of the population aged 15+, comprising advanced diplomas (10.2%) along with certificate qualifications (12.7%). Current student involvement is substantial, with 29.9% of residents actively undertaking formal study.
This group is distributed across primary education (9.5%), tertiary study (7.6%), and secondary education (7.1%).
Frequently Asked Questions - Education
Schools Detail
Public transport in North Ryde - East Ryde reaches 123 stops on 44 routes, timetabled for about 4,200 services a week. The typical home sits about 150 m from its nearest stop. Buses carry the largest share of public transport commuters. Households keep an average of 1.1 vehicles. Stop and service counts are built from operators' published GTFS timetables and refresh with each timetable release; vehicle ownership is from the 2021 Census.
Detail
Public transport connectivity across North Ryde - East Ryde is delivered via 123 active stops primarily catering to bus travel. Network operations encompass 44 routes that together run 4,193 passenger trips each week. Commuter access is strong, with typical walking distances to the nearest transit point averaging 147 meters. In this largely residential territory, outward journeys dominate travel patterns, led by private vehicles at 76%, rail services at 10%, and buses at 7%. Household vehicle availability averages 1.1 cars per dwelling, while 57.5% of working residents reported working from home during the 2021 Census under prevailing COVID-19 settings.
Network scheduling delivers an average of 599 daily trips across all operational corridors, translating to roughly 34 trips per week for each transit stop. The accompanying mapping highlights the 100 closest transit stops relative to the geographical central point.
Frequently Asked Questions - Transport
Transport Stops Detail
76.2% of residents in North Ryde - East Ryde report no long-term health condition, a healthier profile than 96% of areas nationally. 4.8% need daily assistance with core activities, and 60.8% hold private health cover. The standardised death rate runs at 3.3 per 1,000 residents. Health conditions, assistance needs and insurance are 2021 Census measures; the death rate comes from current ABS releases.
Detail
Analysis by AreaSearch indicates favorable overall health measures throughout North Ryde - East Ryde, evidenced by low chronic disease rates and reduced mortality metrics across all age segments. Private health insurance participation is elevated, covering roughly 61% of residents (10,116 people) compared to the national benchmark of 55.7%. The two most prevalent health issues recorded locally are mental health conditions and asthma, affecting 6.0 and 5.9% of the community, respectively. Meanwhile, 76.2% of residents reported having no long-term medical conditions, exceeding the 74.6% benchmark observed across Greater Sydney. Seniors aged 65 and over constitute 16.6% of the population (2,762 people), higher than the 15.5% share across Greater Sydney.
While elderly cohorts display robust vitality, their relative health indicators place lower on a nationwide scale than those of the broader local demographic.
Frequently Asked Questions - Health
45.5% of North Ryde - East Ryde residents were born overseas and 44.7% speak a language other than English at home, more culturally diverse than 87% of areas nationally. The largest reported ancestries are Chinese (17.6%) and Australian (15.8%). Ancestry, language and country of birth are counted only by the Census, so these are 2021 figures.
Detail
Cultural variety is pronounced throughout North Ryde - East Ryde, where 44.7% of the populace uses a non-English language in domestic settings and 45.5% were born overseas. Christianity represents the most widely held faith, accounting for 49.7% of local residents. The most noticeable deviation above regional norms occurs in Judaism, which represents 0.9% of local inhabitants compared to 0.8% across Greater Sydney. Looking at parental lineage, the primary heritage groups across North Ryde - East Ryde are Chinese at 17.6% (exceeding the regional share of 8.4%), Australian at 15.8%, and English at 15.6%.
Other cultural backgrounds show distinctive local variances relative to greater regional figures: Korean ancestry accounts for 3.1% (compared to 1.1% regionally), Russian background stands at 0.7% (against 0.4%), and Lebanese heritage represents 1.0% (contrasting with 2.6%).
Frequently Asked Questions - Diversity
The median resident of North Ryde - East Ryde is 38. 25.6% of residents are aged 15 to 34. Age cohorts are not raw Census counts: the Census split is re-based to the latest ABS population estimates and state projections.
Detail
The age distribution of North Ryde - East Ryde closely mirrors the Greater Sydney profile across major age categories, showing a maximum variation of 2.8 percentage points. The median age is estimated at 38 as at August 2026, retaining its 2021 Census level and sitting 1 year older than Greater Sydney's Census benchmark of 37. The most prominent change since the Census appears within the senior demographic (65+), which grew from 15.0% to an estimated 16.6% of the population. Looking forward to 2041, senior cohorts are expected to drive the vast majority of local expansion, increasing by 1,630 residents (59%) to a total of 4,392.
Frequently Asked Questions - Age
Data & MethodBoundaries, Sources & Method for North Ryde - East Ryde
9 of 14 data sections on this page were updated within the last 12 months — the newest current to Sep 2026.
Everything is aggregated to the SA2 boundary shown above, on a 2021 Census baseline. Only 3 sections — housing, households and cultural diversity — still wait on the 2026 Census.
The ledger — source, cycle and currency by section
| Section | Source & update cycle | Currency |
|---|---|---|
| Updated within the last 12 months 9 sections | ||
| Population | ABS, GNAF, Geoscience Australia Annual (ABS ERP) | Aug 2026 2 months ago headline measures · 2021 Census baseline |
| Re-based to the ABS Estimated Resident Population (June 2025 release) and updated with new dwellings from GNAF address data. Current to Aug 2026, with the 2021 Census supplying the small-area baseline. | ||
| Age profile | ABS, Geoscience Australia, State governments Annual | Aug 2026 2 months ago headline measures · 2021 Census baseline |
| Age cohorts are re-based to the latest ABS population estimates and state projections, current to Aug 2026. Each cohort is held as a Census baseline and a current estimate. | ||
| Development & approvals | ABS, GNAF Monthly (ABS approvals) | Aug 2026 2 months ago headline measures · Jul 2026 baseline |
| Property sales & rents | Valuer General, Rental Board, ABS Weekly sales, quarterly rents | Sep 2026 last month all 21 measures |
| Sales from the state Valuer General register, refreshed weekly, and rents from quarterly rental bond lodgements. Both are read live each time this page loads, current to Sep 2026. | ||
| Infrastructure projects | Infrastructure Australia, State agencies, Local governments Daily | Aug 2026 2 months ago all 5 projects tracked here |
| Project pipeline maintained continuously from Infrastructure Australia, state agencies, local government and public announcements. Records are added and revised daily; this area was last updated Aug 2026. | ||
| Employment | ABS, DEWR, JSA Quarterly (ABS SALM) | Mar 2026 7 months ago headline measures · 2021 Census baseline |
| Unemployment and labour force from ABS Small Area Labour Markets, current to Mar 2026. The growth outlook applies Department of Employment (now Jobs and Skills Australia) forecasts for all 19 industry divisions to the local industry mix, so it measures sector composition rather than local expansion and makes no allowance for population growth. Job demand comes from the same agency via its Internet Vacancy Index; industry and occupation structure from the 2021 Census. | ||
| Education | ABS, ACARA Annual (ACARA) | Sep 2026 last month headline measures · 2021 Census baseline |
| Transport | ABS, State Transport Departments Each timetable release | Jul 2026 3 months ago headline measures · 2021 Census baseline |
| Services & amenities | Provider directories, ACECQA Continuous | Sep 2026 last month all 14 measures |
| Annual and financial-year sources 2 sections | ||
| Income | ABS, ATO Annual (ATO) | FY 2023 3 years ago headline measures · 2021 Census baseline |
| ATO taxable income statistics for FY 2023, indexed forward using the Wage Price Index. Census household income provides the distribution detail. | ||
| Health | ABS, ATO Annual | 2024 2 years ago headline measures · 2021 Census baseline |
| Census-measured — next update: 2026 Census 3 sections No more current small-area source exists for these, so they are labelled as Census-measured rather than implied to be current. | ||
| Housing | ABS 5-yearly (Census) | 2021 Census next update 2026 all 30 measures |
| Households | ABS 5-yearly (Census) | 2021 Census next update 2026 all 18 measures |
| Cultural diversity | ABS, Geoscience Australia 5-yearly (Census) | 2021 Census next update 2026 all 44 measures |
"Currency" is the most recent release feeding that section. Where the Census supplies the structural baseline underneath a current headline figure, the row says so.
How the numbers are built
Population
The Census provides the small-area baseline, aggregated from mesh blocks to this boundary. It is then re-based to the ABS Estimated Resident Population (June 2025 release), and new dwellings built since Census night are counted from address data — 75 validated new addresses here. The headline figure is therefore a current estimate for Aug 2026, not a 2021 count (15,622 at the 2021 Census → 16,639 now). Annual growth rates are compound (CAGR), not simple averages.
Age profile
Cohort shares are not raw Census counts. Every cohort is held as a pair — the Census baseline and a current estimate — and the split is re-based using ERP and state population projections, current to Aug 2026. Median age is the Census median plus modelled change since. Charts that show both are labelled "2021 Census vs Current Estimate".
Property sales
Sourced from the state valuation authority's sales register — current, not Census, and refreshed weekly. Medians are calculated from settled transactions in the period shown; periods with very low transaction counts are flagged or suppressed, because a handful of sales can move a median substantially.
Rents
Derived from state rental bond lodgement data, by dwelling type and bedroom count. Bonds are lodged at the start of a new tenancy, so this reflects new lettings, not the whole rented stock.
Development & infrastructure
Building approvals come from current ABS releases; development applications are collected from council and state planning portals; the infrastructure pipeline is compiled from Infrastructure Australia and local government sources. Applications are matched to this boundary by address or coordinates, so very recent lodgements may not yet appear.
Employment & income
Industry and occupation structure comes from the Census, but the headline labour-market indicators do not. Unemployment and labour force are derived from ABS Small Area Labour Markets (quarterly). The employment outlook applies Department of Employment forecasts for all 19 industry divisions to this area's own industry mix (the agency is now Jobs and Skills Australia), as does the Internet Vacancy Index used for job demand. Because it is weighted on industry composition alone, that outlook carries no allowance for local population growth — in fast-growing areas the real rise in local jobs will typically be higher. Income combines Census household income with ATO taxable-income statistics for FY 2023, indexed forward using the Wage Price Index.
Education, transport & amenities
School enrolments, ICSEA and performance come from ACARA's current release, not the Census. Public transport stops and service frequency are derived from GTFS timetable feeds published by state transport departments. Services and amenities are proximity and count scores built from provider directories, refreshed on their own cycle. The Census contributes only the travel-to-work and qualification measures.
Rankings and benchmarks. Where we rank this area, the comparison set is every area of the same boundary type — suburbs against suburbs, SA2s against SA2s. Benchmarks compare this area against its greater capital city region and the national figure for the same measure and period.
Limits worth knowing. Small areas carry larger error margins, and the ABS introduces small random adjustments to Census counts to protect confidentiality — so totals may not sum exactly. Estimates re-based from regional data describe the area's expected trajectory, not a direct count of it. Figures are indicative for research and are not financial, planning or valuation advice.
Cross-check us. The Census baseline for this boundary is at ABS 2021 Census QuickStats (126021501). QuickStats reports 2021 only — the figures on this page are more current wherever the ledger shows a later date.