Chart Color Schemes
This analysis uses ABS Statistical Areas Level 2 (SA2) boundaries, which can materially differ from Suburbs and Localities (SAL) even when sharing similar names.
SA2 boundaries are defined by the Australian Bureau of Statistics and are designed to represent communities for statistical reporting (e.g., census and ERP).
Suburbs and Localities (SAL) represent commonly-used suburb/locality names (postal-style areas) and may use different geographic boundaries. For comprehensive analysis, consider reviewing both boundary types if available.
est. as @ -- *
ABS ERP | -- people | --
2021 Census | -- people
Sales Activity
Curious about local property values? Filter the chart to assess the volume and appreciation (including resales) trends and regional comparisons, or scroll to the map below view this information at an individual property level.
Find a Recent Sale
Sales Detail
Population
Population growth drivers in South Melbourne are above average based on AreaSearch's ranking of recent, and medium to long-term trends
South Melbourne's population was approximately 13,022 as of November 2025. This figure represents an increase of 1,329 people, a rise of 11.4% since the 2021 Census which recorded a population of 11,693. The change is inferred from the estimated resident population of 12,916 in June 2024 and an additional 429 validated new addresses since the Census date. This results in a population density ratio of 6,889 persons per square kilometer, placing South Melbourne in the top 10% of national locations assessed by AreaSearch. South Melbourne's growth rate exceeded the national average of 8.9%, and that of the state, indicating it as a growth leader in the region. Overseas migration was the primary driver of population gains during recent periods.
AreaSearch adopts ABS/Geoscience Australia projections for each SA2 area, released in 2024 with a base year of 2022. For areas not covered by this data, AreaSearch uses VIC State Government's Regional/LGA projections from 2023, adjusted using weighted aggregation methods to SA2 levels. Growth rates by age group are applied across all areas for the years 2032 to 2041. Based on projected demographic shifts, South Melbourne is forecasted to experience significant population growth. By 2041, the area is expected to increase by 4,028 persons, reflecting a total increase of 30.1% over the 17-year period, as per the latest annual ERP population numbers.
Frequently Asked Questions - Population
Development
Recent residential development output has been above average within South Melbourne when compared nationally
South Melbourne averaged approximately 231 new dwelling approvals annually over the past five financial years, totalling 1,157 homes. As of FY-26 so far, 246 approvals have been recorded. Between FY-21 and FY-25, an average of 0.1 new residents arrived per year per new home, indicating supply meeting or surpassing demand. The average construction value of these dwellings was $250,000, under regional levels.
In FY-26, commercial development approvals totalled $171.0 million, suggesting robust local business investment. Compared to Greater Melbourne, South Melbourne shows 61.0% higher building activity per person. Recent construction comprises 4.0% detached houses and 96.0% townhouses or apartments. The location has approximately 1626 people per dwelling approval, demonstrating an established market. Population forecasts indicate South Melbourne will gain 3,922 residents through to 2041. With current construction levels, housing supply should adequately meet demand, creating favourable conditions for buyers while potentially enabling growth that exceeds current forecasts.
Population forecasts indicate South Melbourne will gain 3,922 residents through to 2041 (from the latest AreaSearch quarterly estimate). With current construction levels, housing supply should adequately meet demand, creating favourable conditions for buyers while potentially enabling growth that exceeds current forecasts.
Frequently Asked Questions - Development
Infrastructure
South Melbourne has very high levels of nearby infrastructure activity, ranking in the top 20% nationally
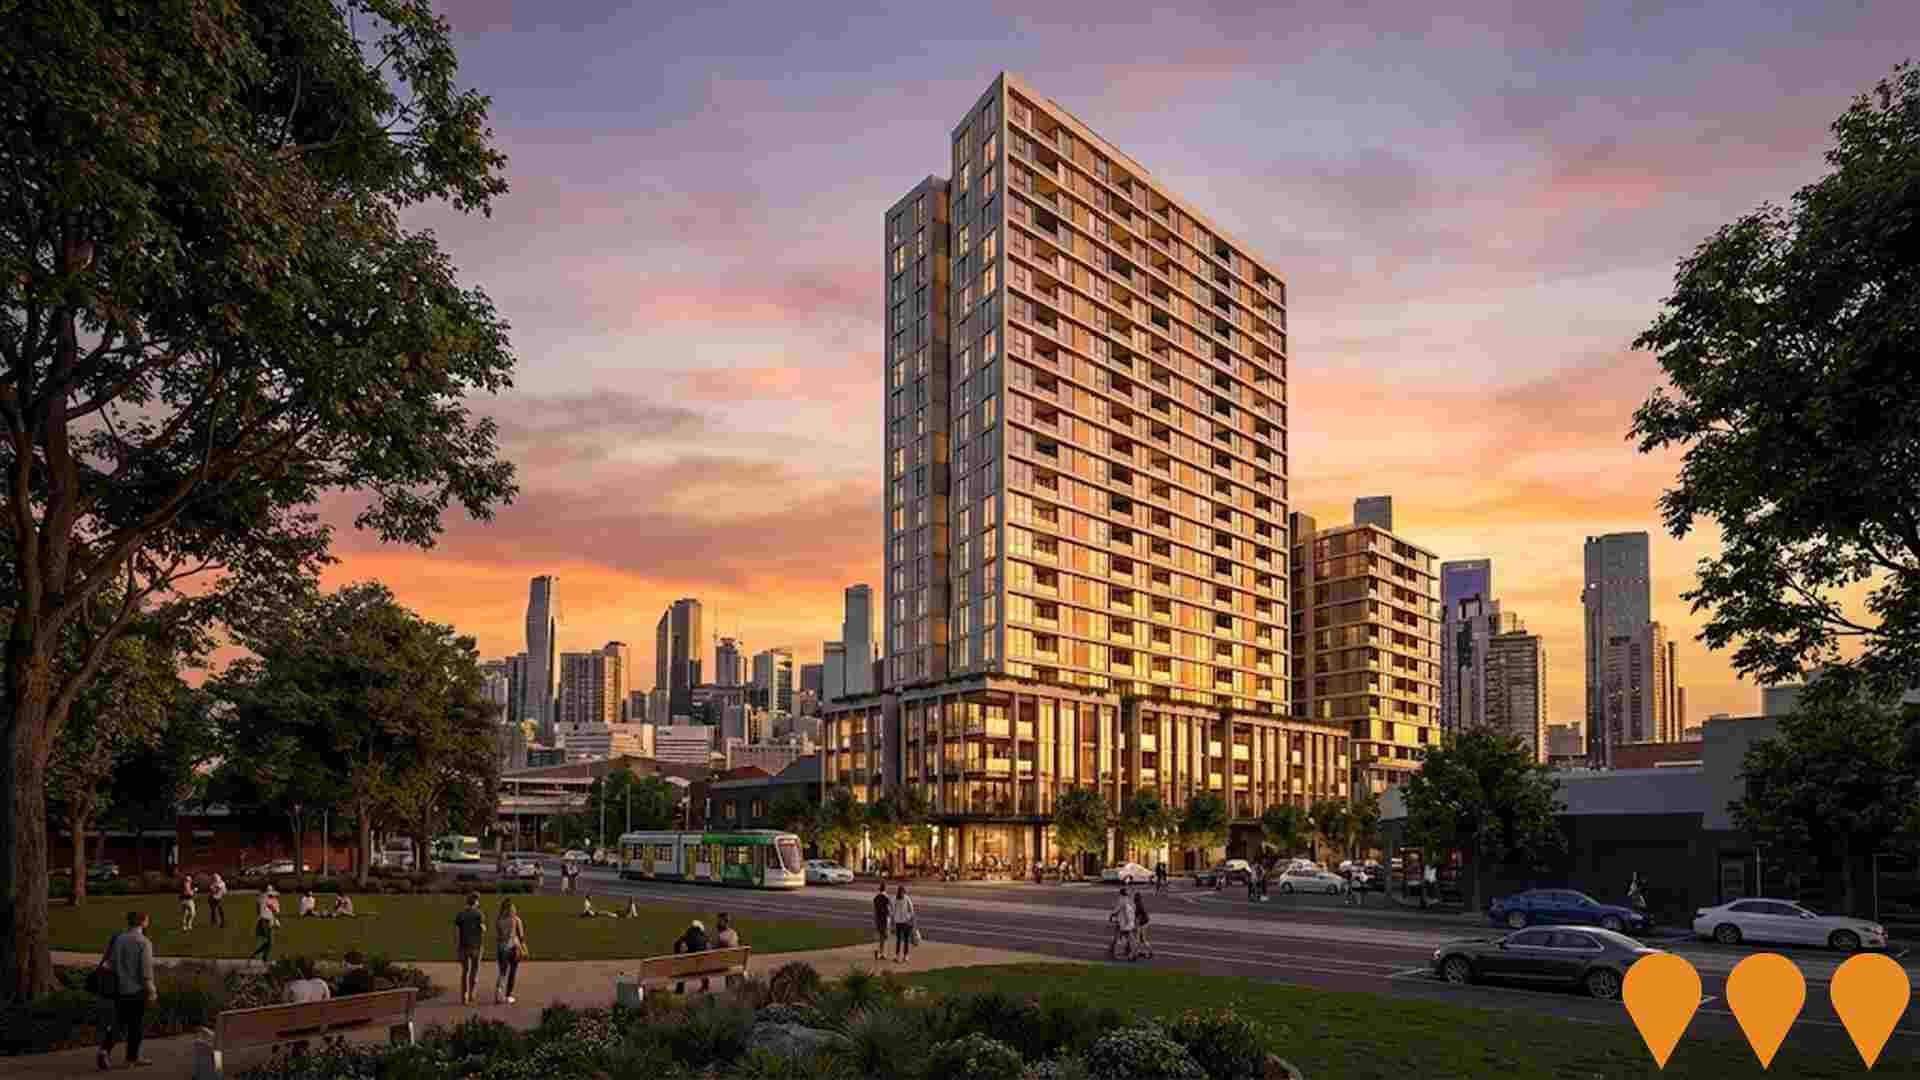
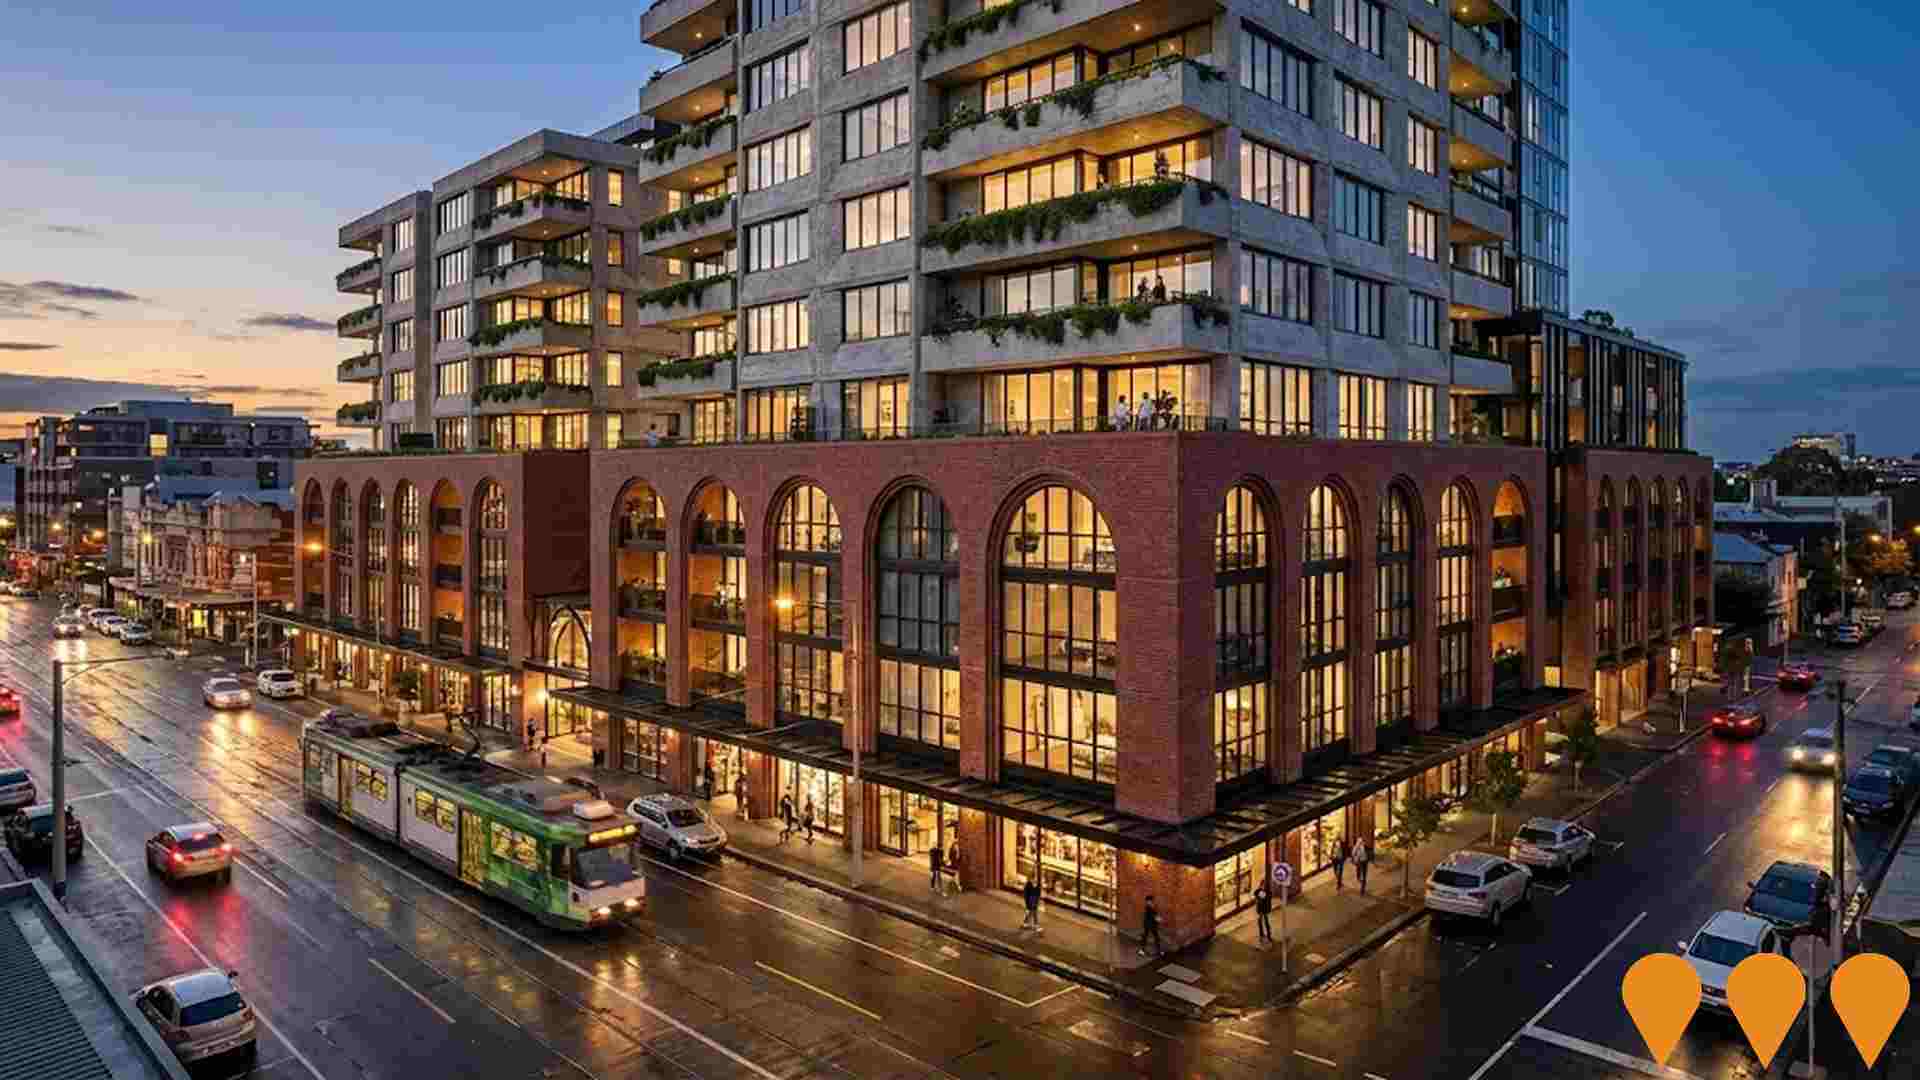
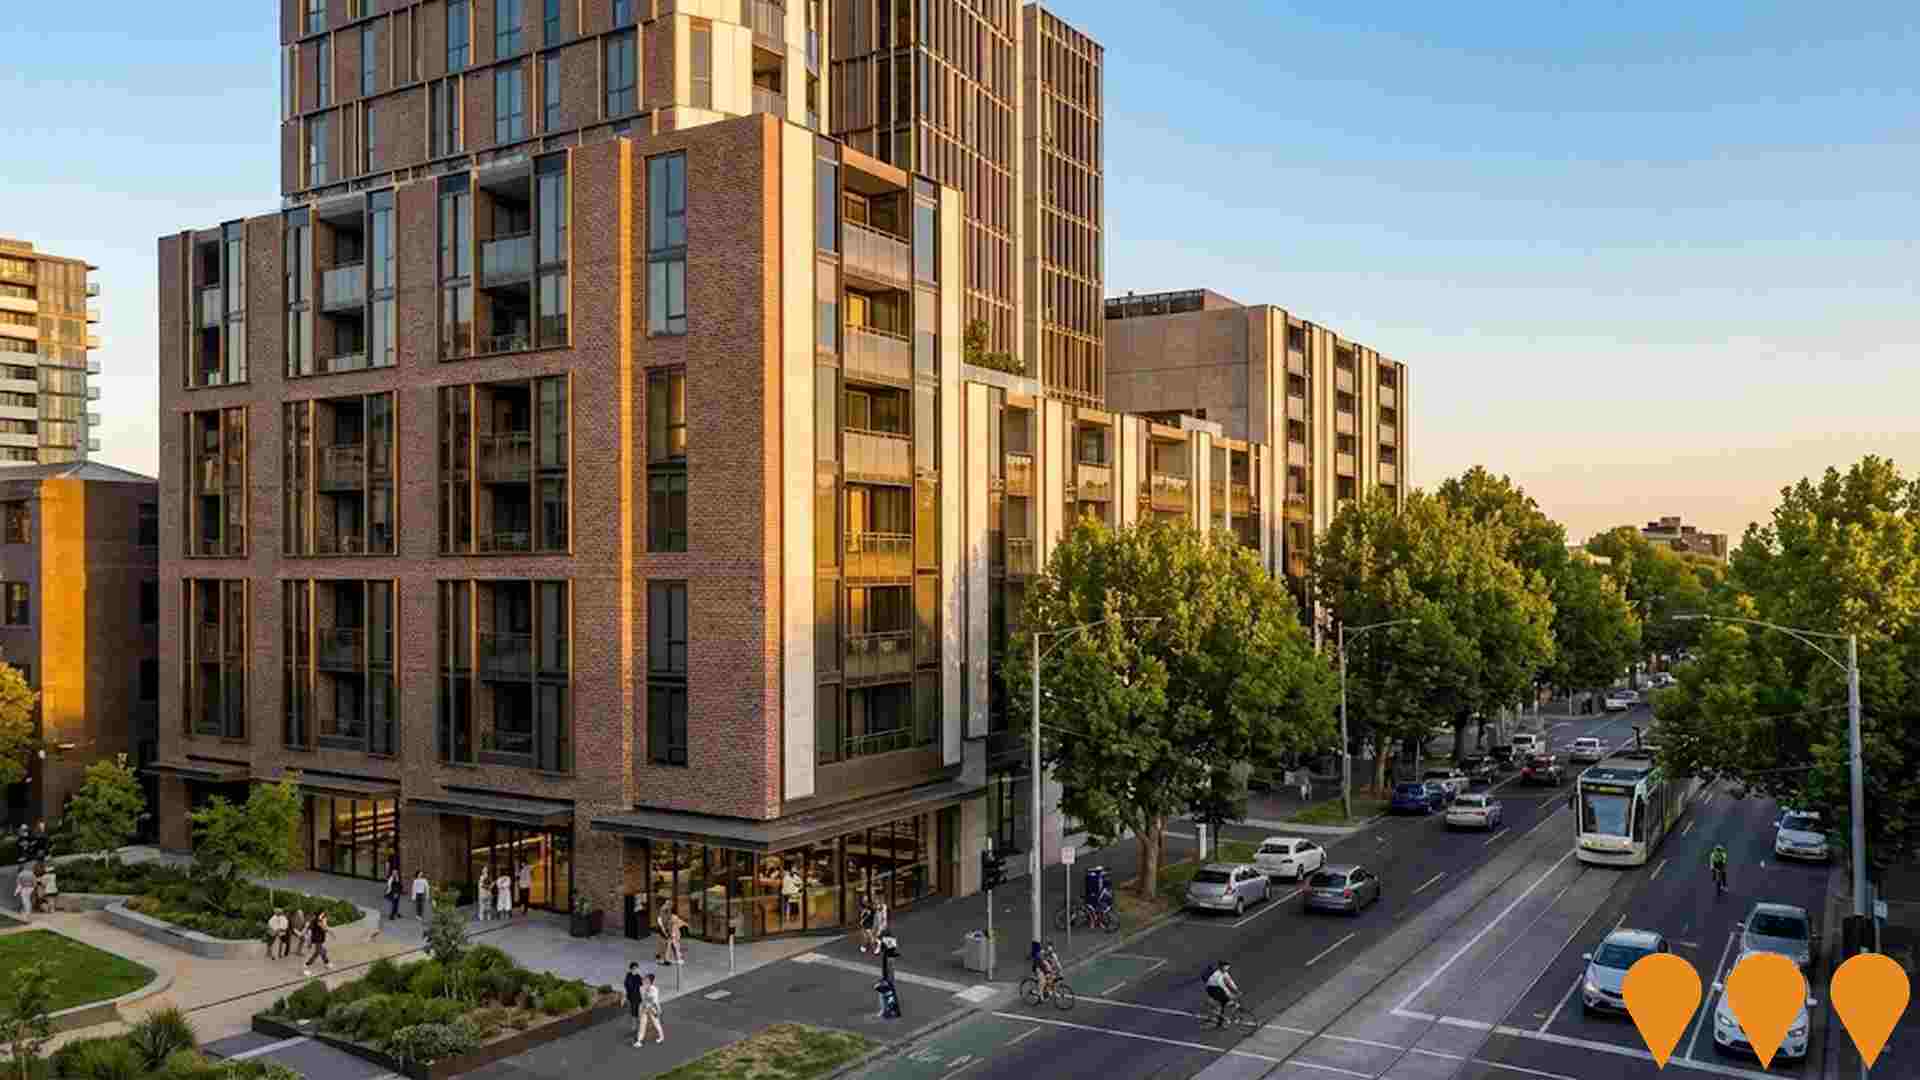
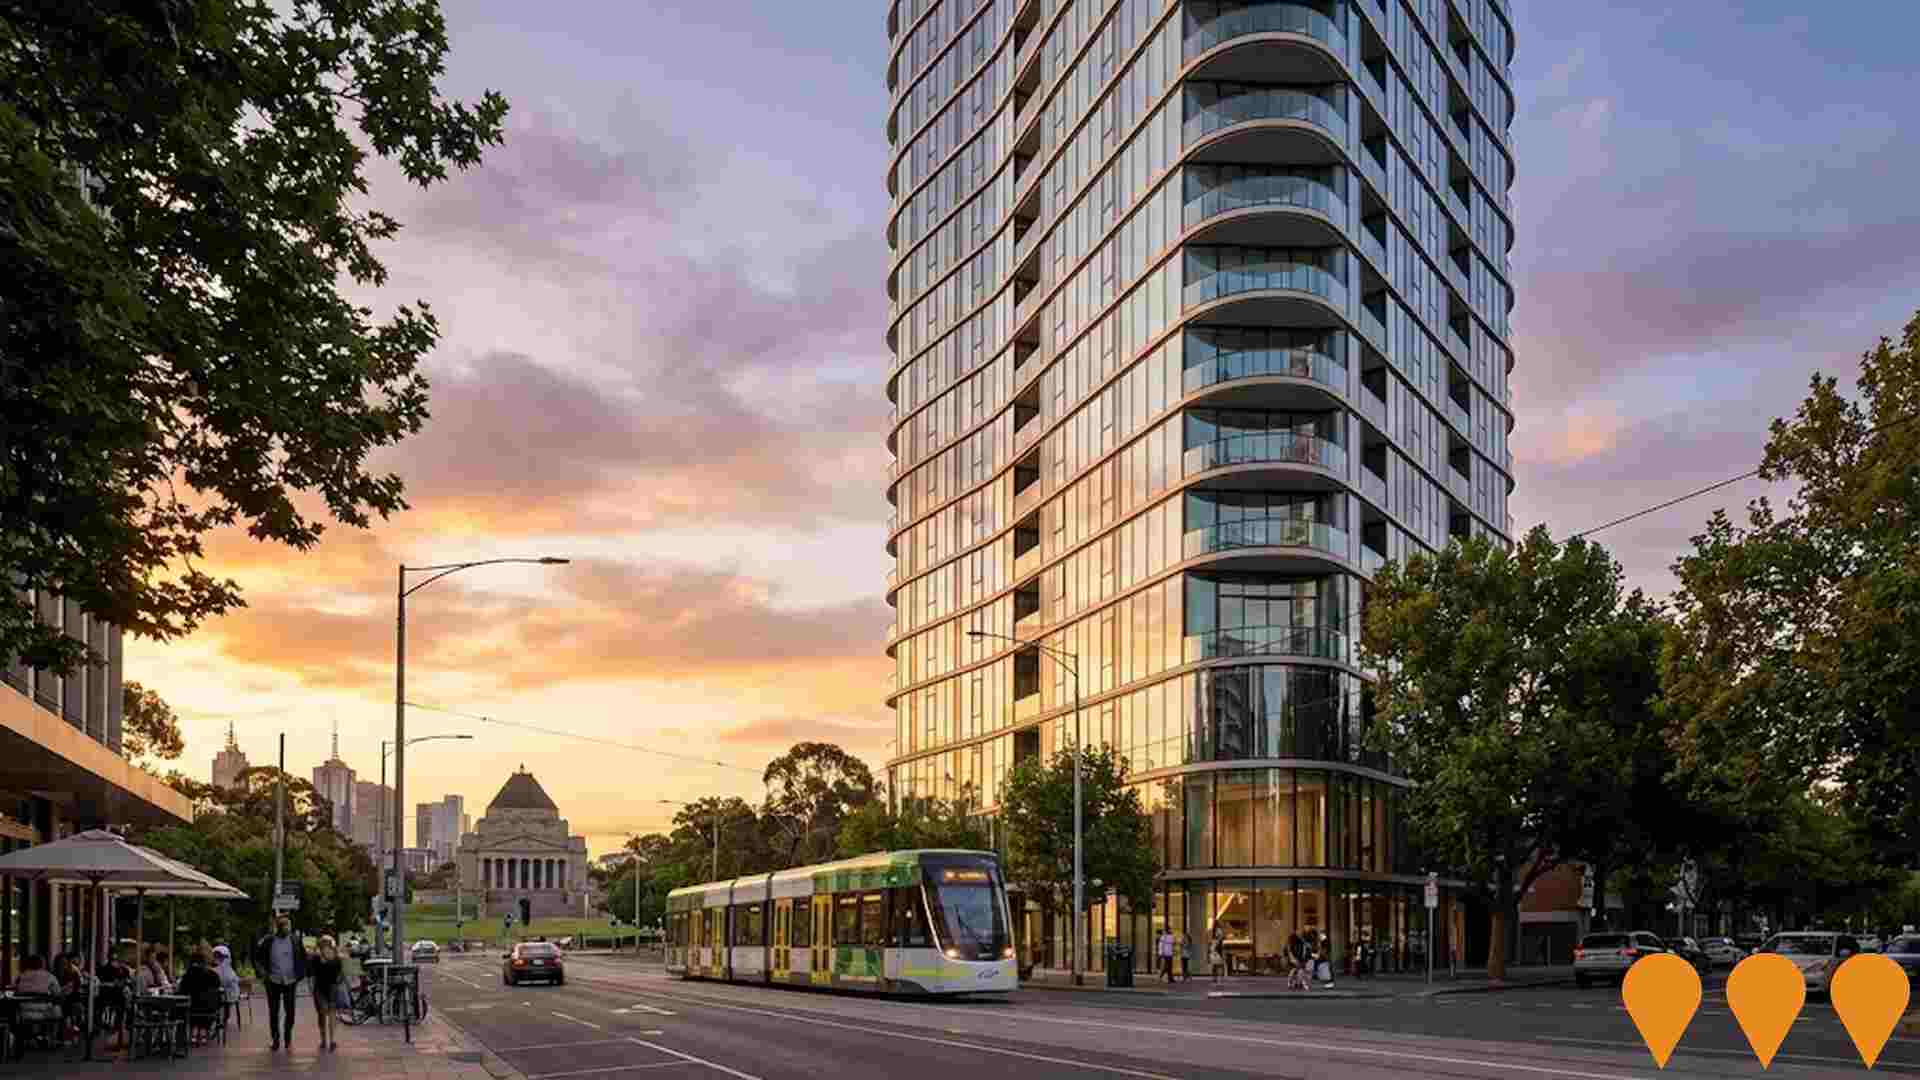
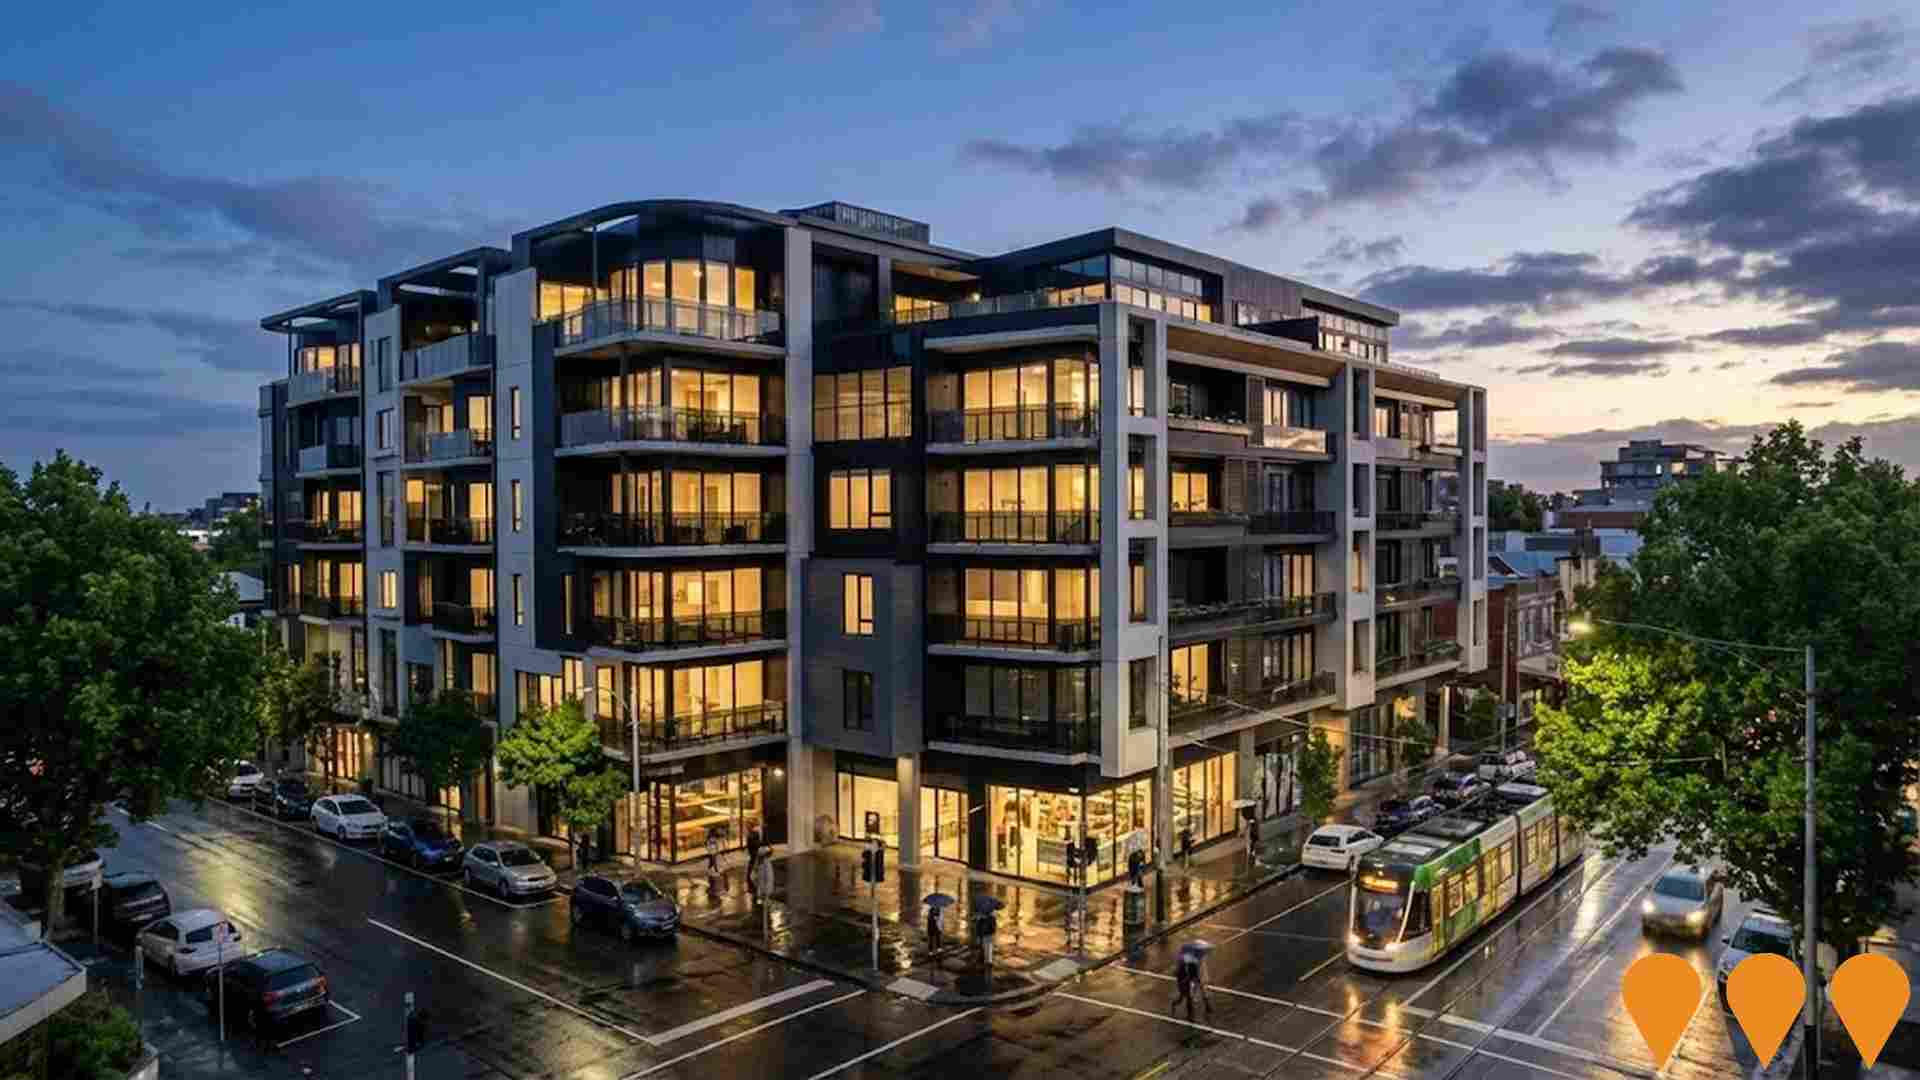
Changes to local infrastructure significantly influence an area's performance. AreaSearch identified 43 projects that may impact this region. Notable initiatives include South Melbourne Town Hall Restoration, Emerald Hill Housing and Health Precinct, Verde Arts Precinct, and 122 Moray Street development. The following details those most likely to be relevant.
Professional plan users can use the search below to filter and access additional projects.
INFRASTRUCTURE SEARCH
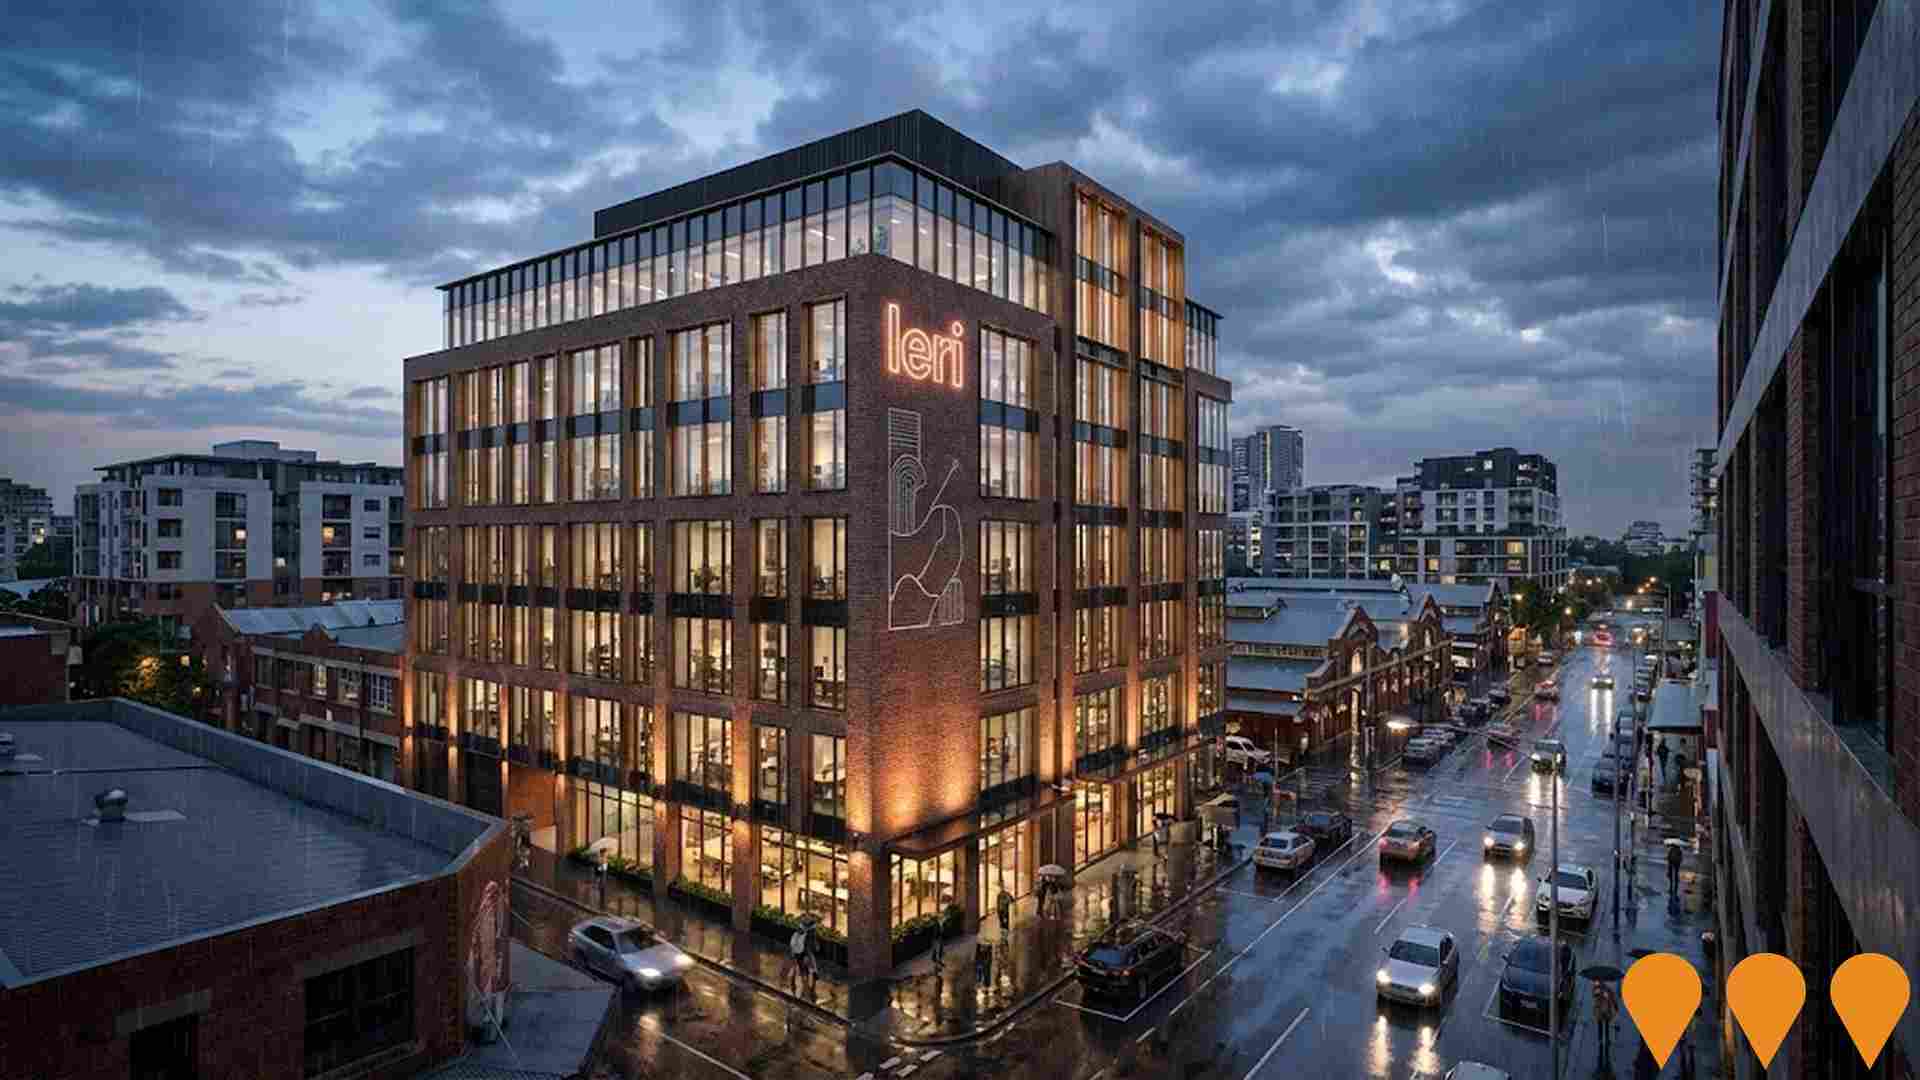
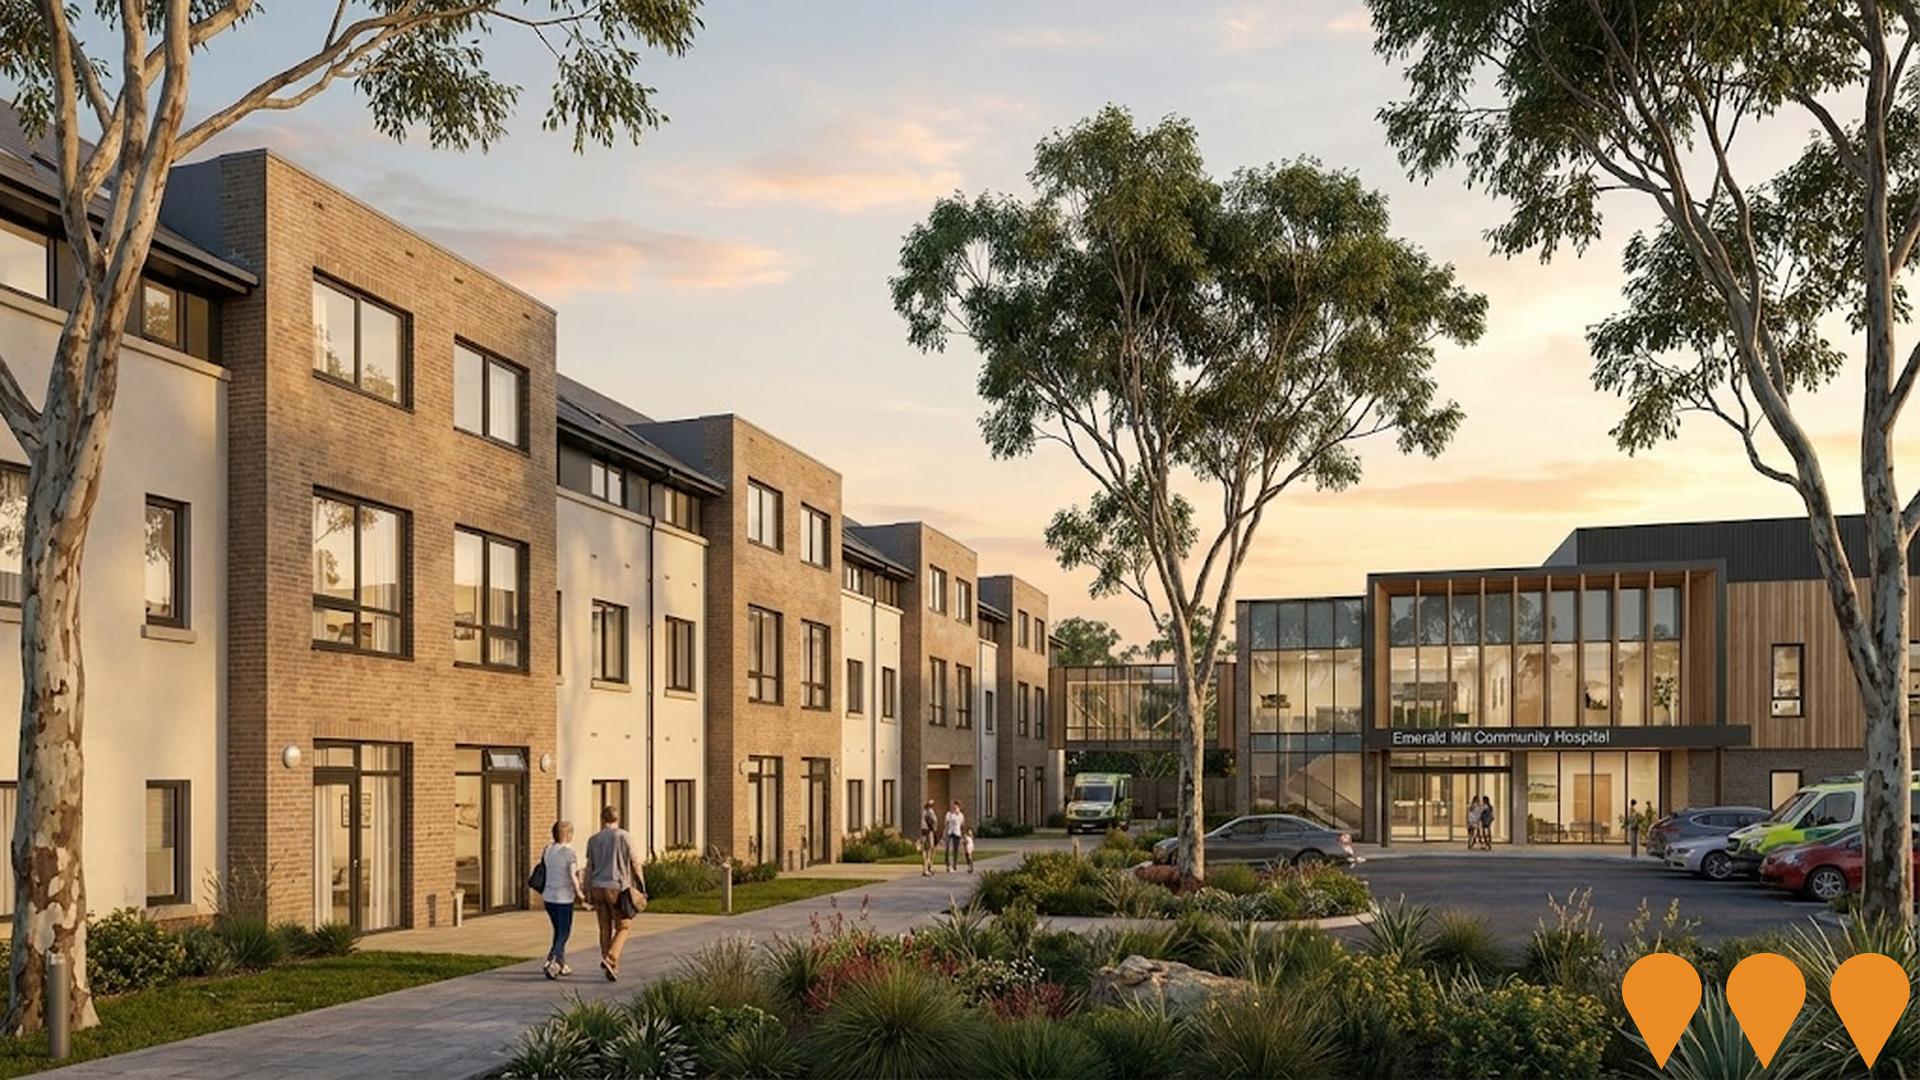
 Denotes AI-based impression for illustrative purposes only, not to be taken as definitive under any circumstances. Please follow links and conduct other investigations from the project's source for actual imagery. Developers and project owners wishing us to use original imagery please Contact Us and we will do so.
Frequently Asked Questions - Infrastructure
Emerald Hill Housing and Health Precinct
Redevelopment of the former Emerald Hill Court public housing site into a mixed-use precinct delivering approximately 430 new social and affordable homes together with a new 60-bed community hospital providing urgent care, dialysis, mental health, rehabilitation, allied health and community health services.
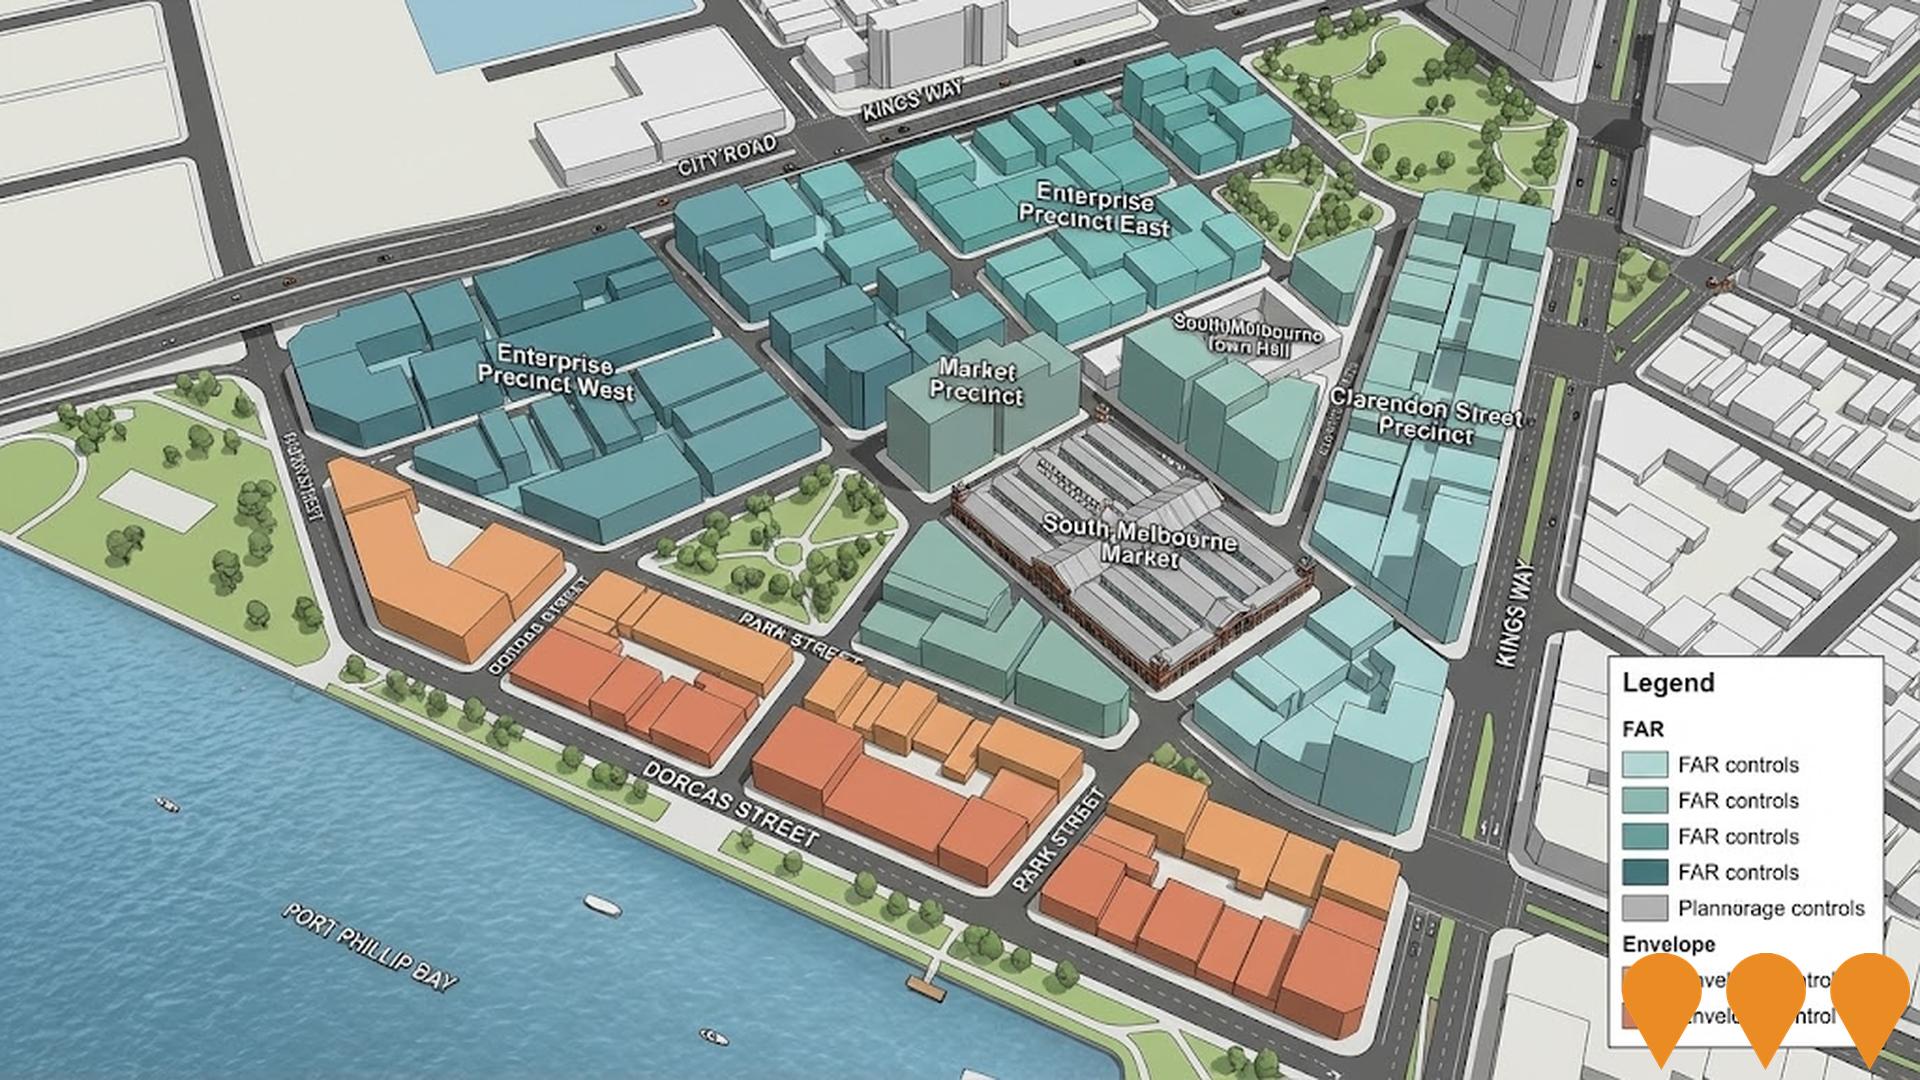
Future South Melbourne Structure Plan
The Future South Melbourne Structure Plan (adopted 2024) provides the long-term planning framework for South Melbourne over the next 20 years (2024-2044). It guides growth, built form, public realm improvements, transport, sustainability and community infrastructure in response to significant residential and employment growth expected in Fishermans Bend and surrounding areas.
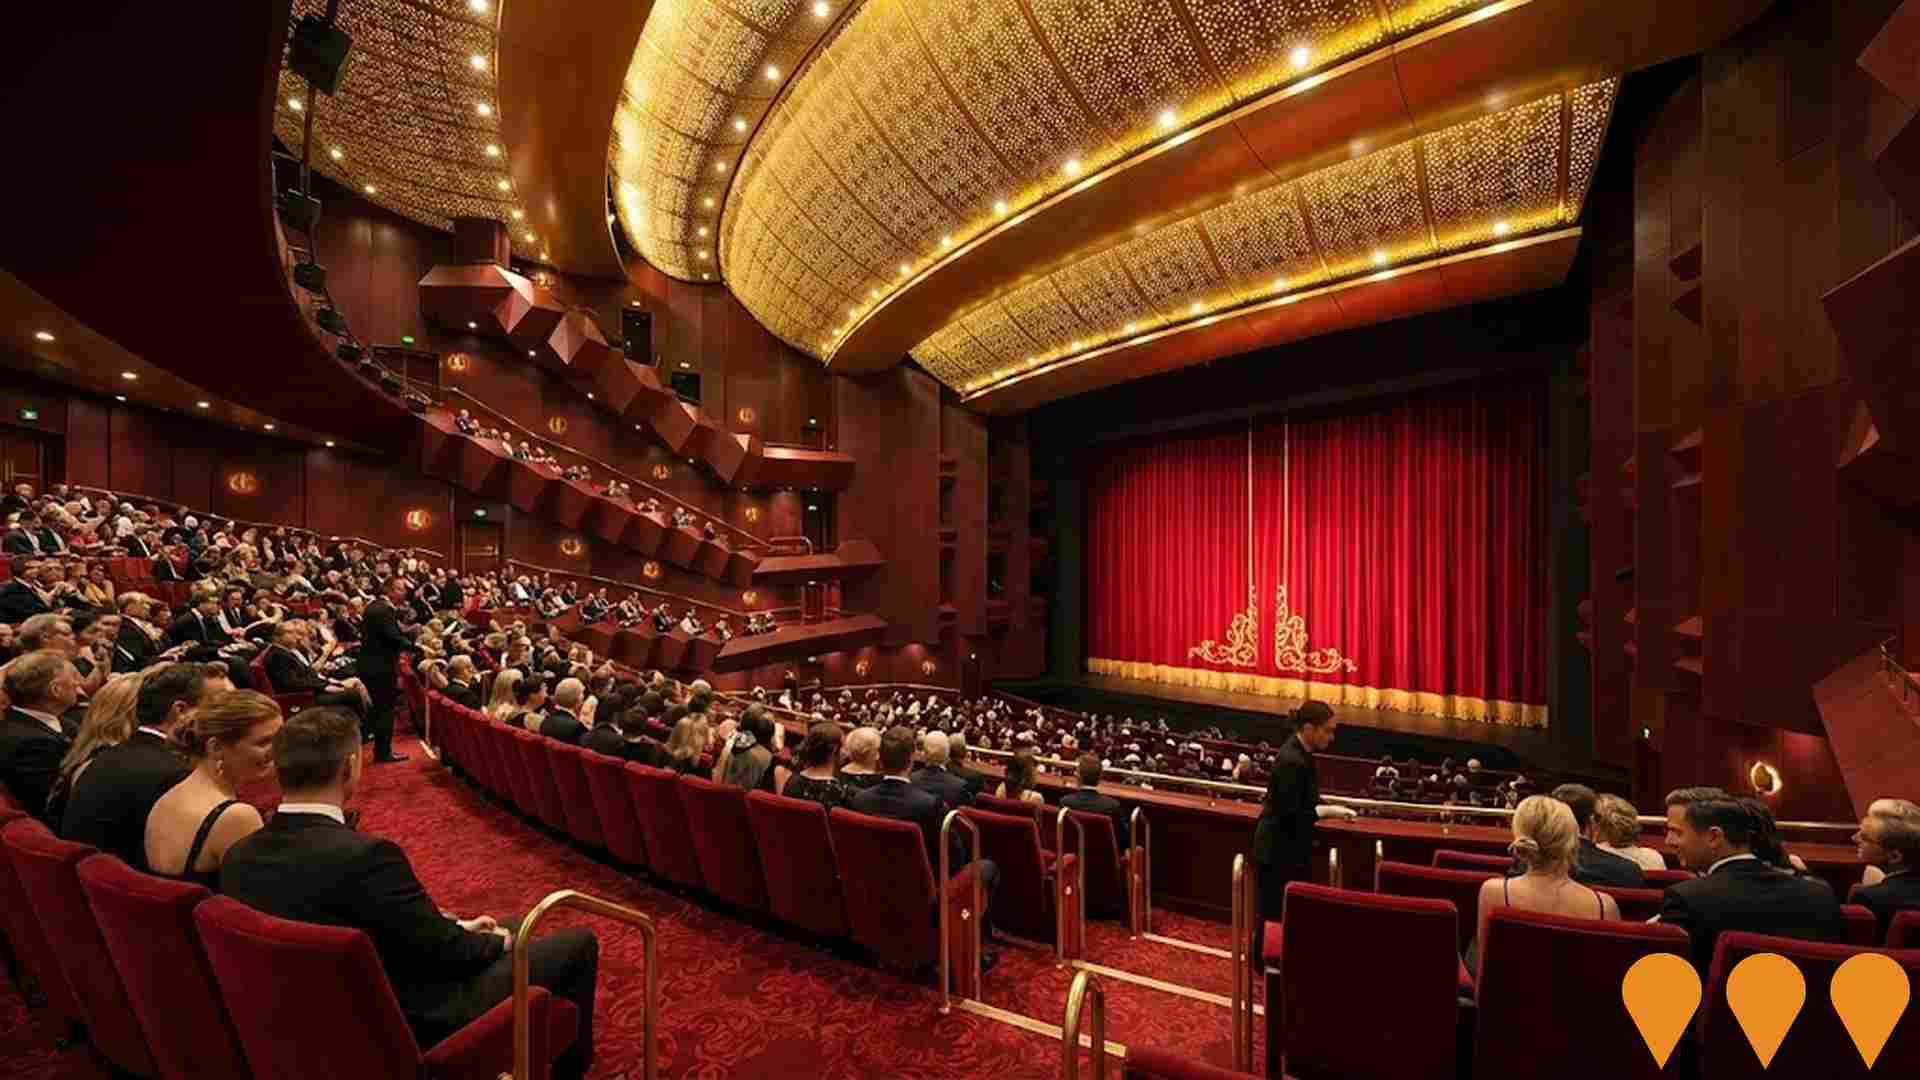
Arts Centre Melbourne State Theatre Upgrades
The refurbishment of the heritage-listed State Theatre at Arts Centre Melbourne involves significant upgrades including improved accessibility with new seating and lifts, enhanced acoustics, modernized theatre technology such as lighting and broadcast infrastructure, better air-conditioning and flooring for comfort, expanded back-of-house facilities like loading dock and rehearsal spaces, and new food and beverage areas. This is the first major upgrade since 1984, aiming to bring the venue to contemporary standards.
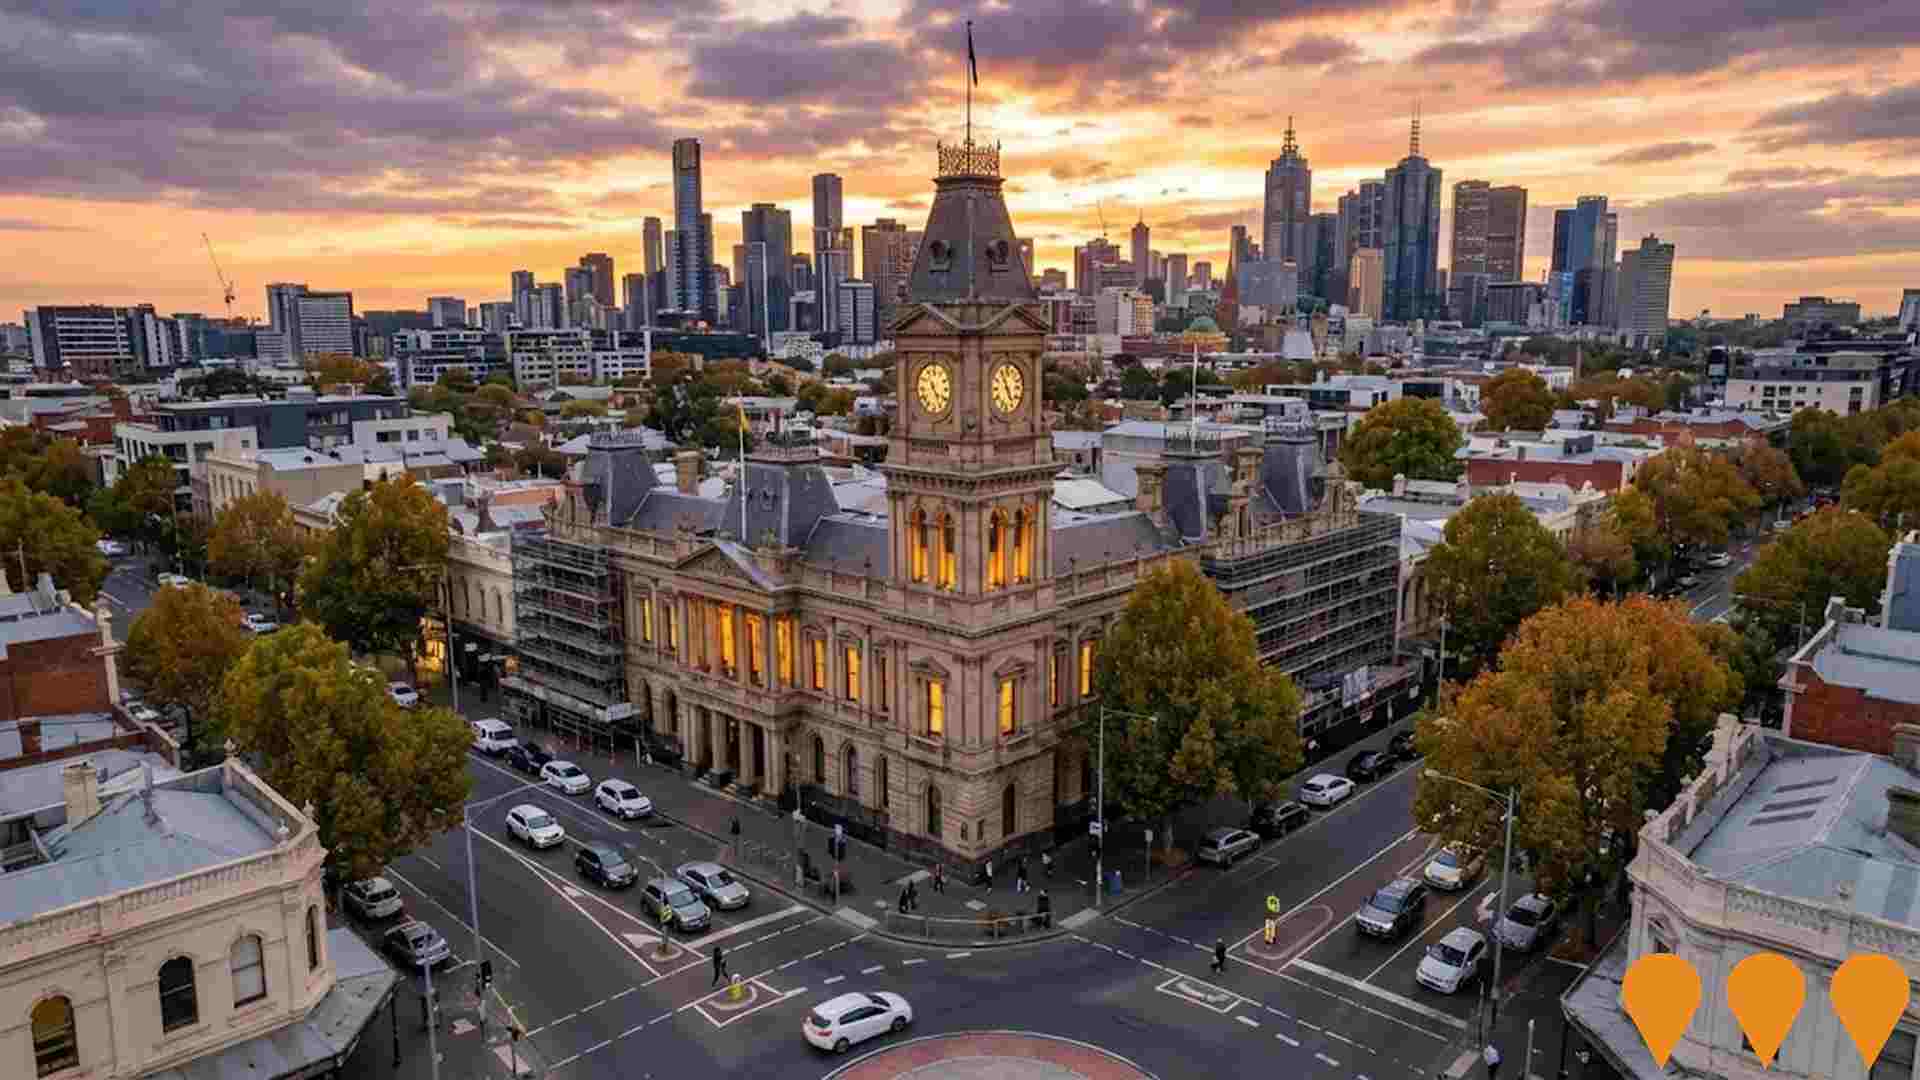
South Melbourne Town Hall Restoration
Major restoration and renewal of the historic South Melbourne Town Hall to preserve its heritage, ensure structural safety, and transform it into a vibrant cultural and community hub, including performance venues and facilities for the Australian National Academy of Music.
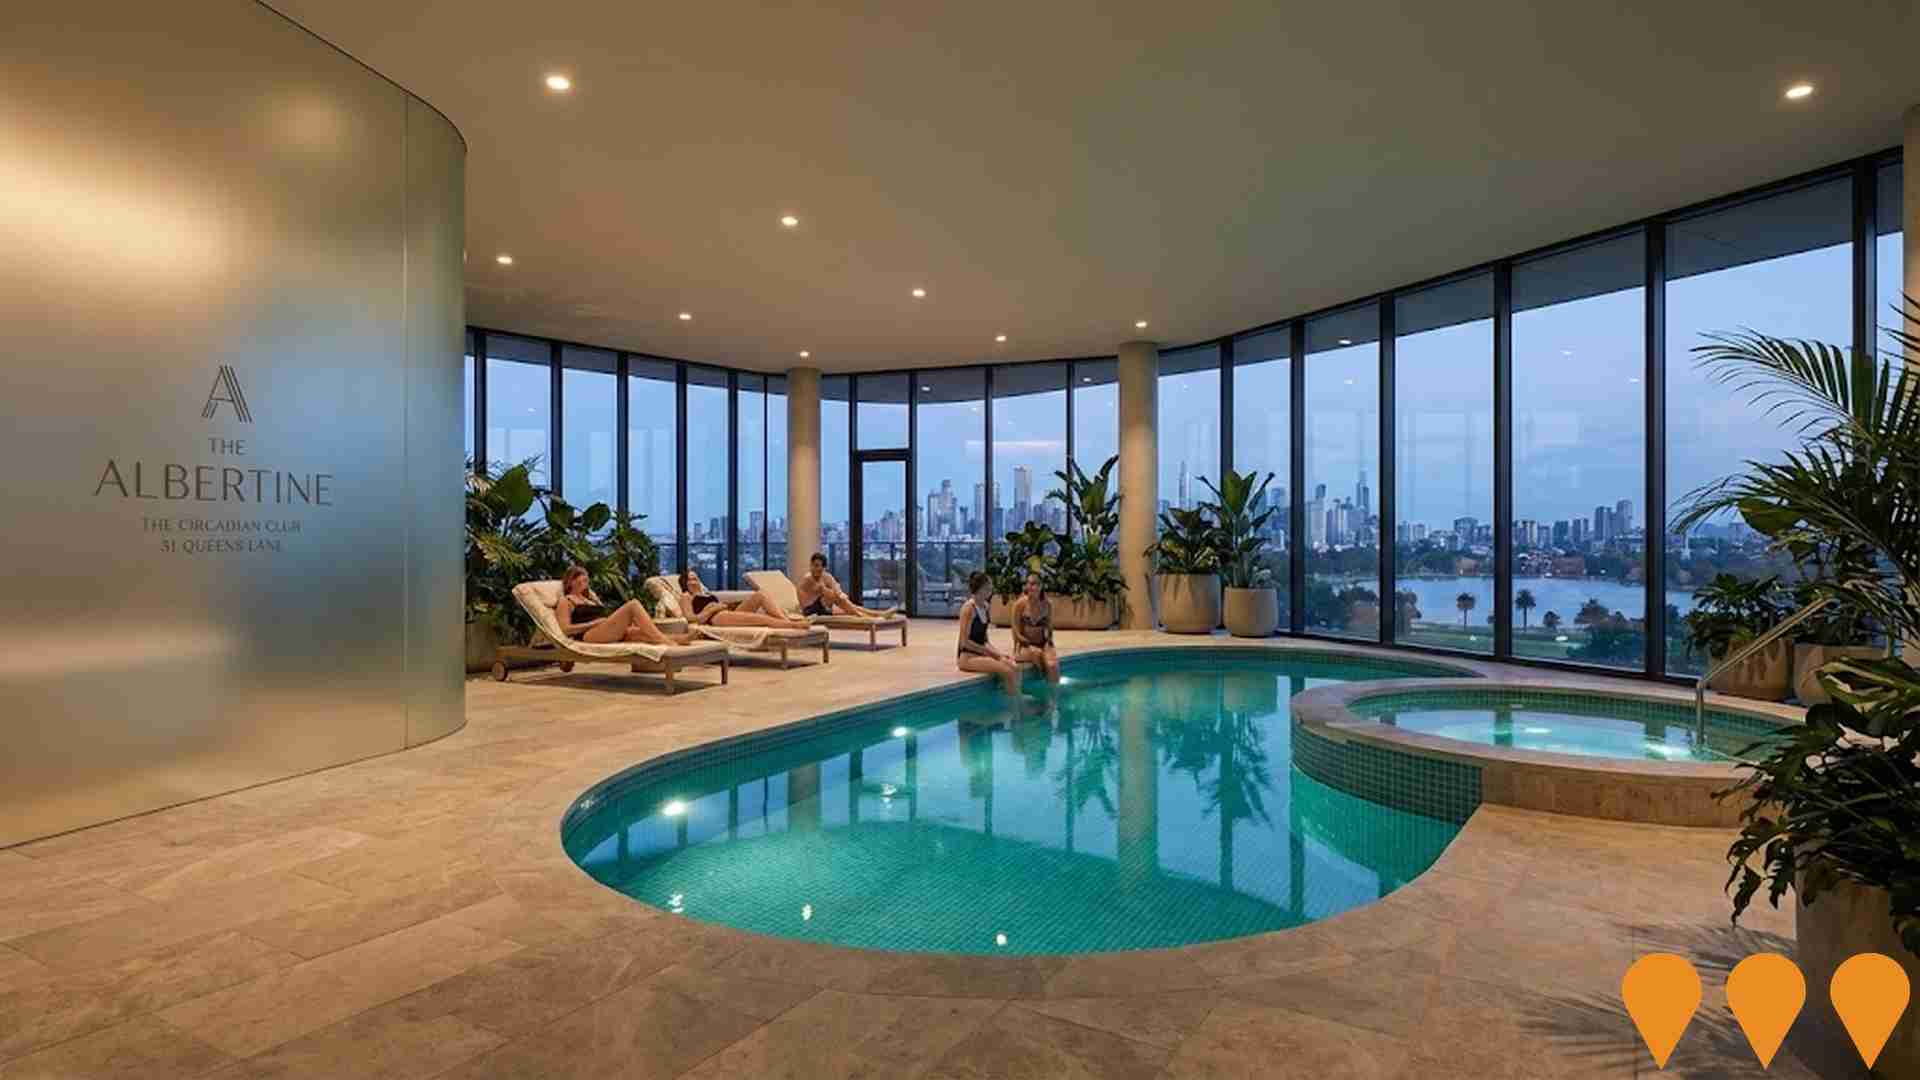
The Albertine
A boutique all-electric residential development featuring 98 luxury one to four-bedroom apartments across 15 levels. The project includes premium amenities within The Circadian Club (indoor pool, spa, gym, yoga studio, sauna) and The Elysian Room exclusive dining space on level 10 with panoramic Melbourne views. Designed with 7-star average NatHERS energy efficiency rating and located on the doorstep of Albert Park Lake.
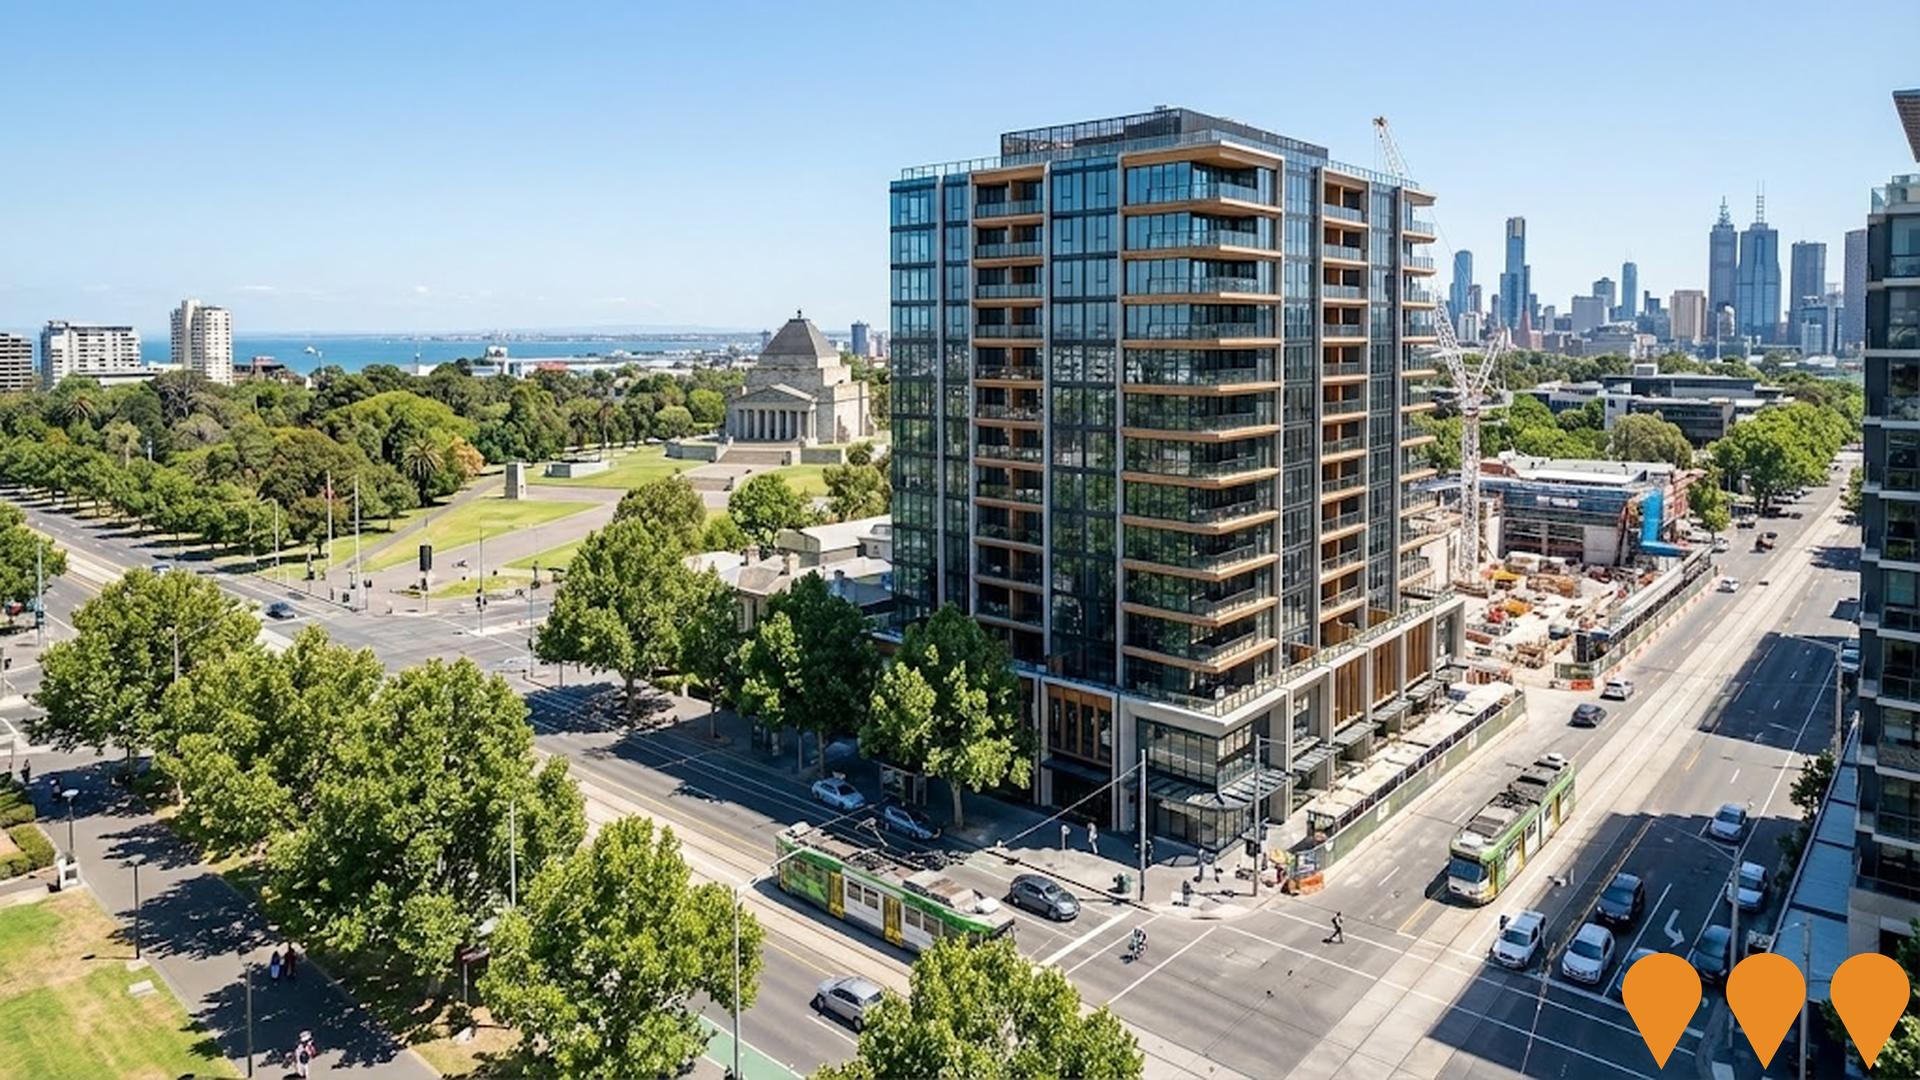
Verde Arts Precinct
An exclusive collection of 174 one, two, and three-bedroom apartments offering premium living in the heart of Southbank's arts precinct. Designed by award-winning Bruce Henderson Architects, featuring SMEG appliances, engineered timber floors, and premium amenities including concierge services, co-working spaces, and rooftop terrace. Located next to Anzac Station with panoramic views over Melbourne's skyline, Royal Botanic Gardens, and Port Phillip Bay.
Moray House
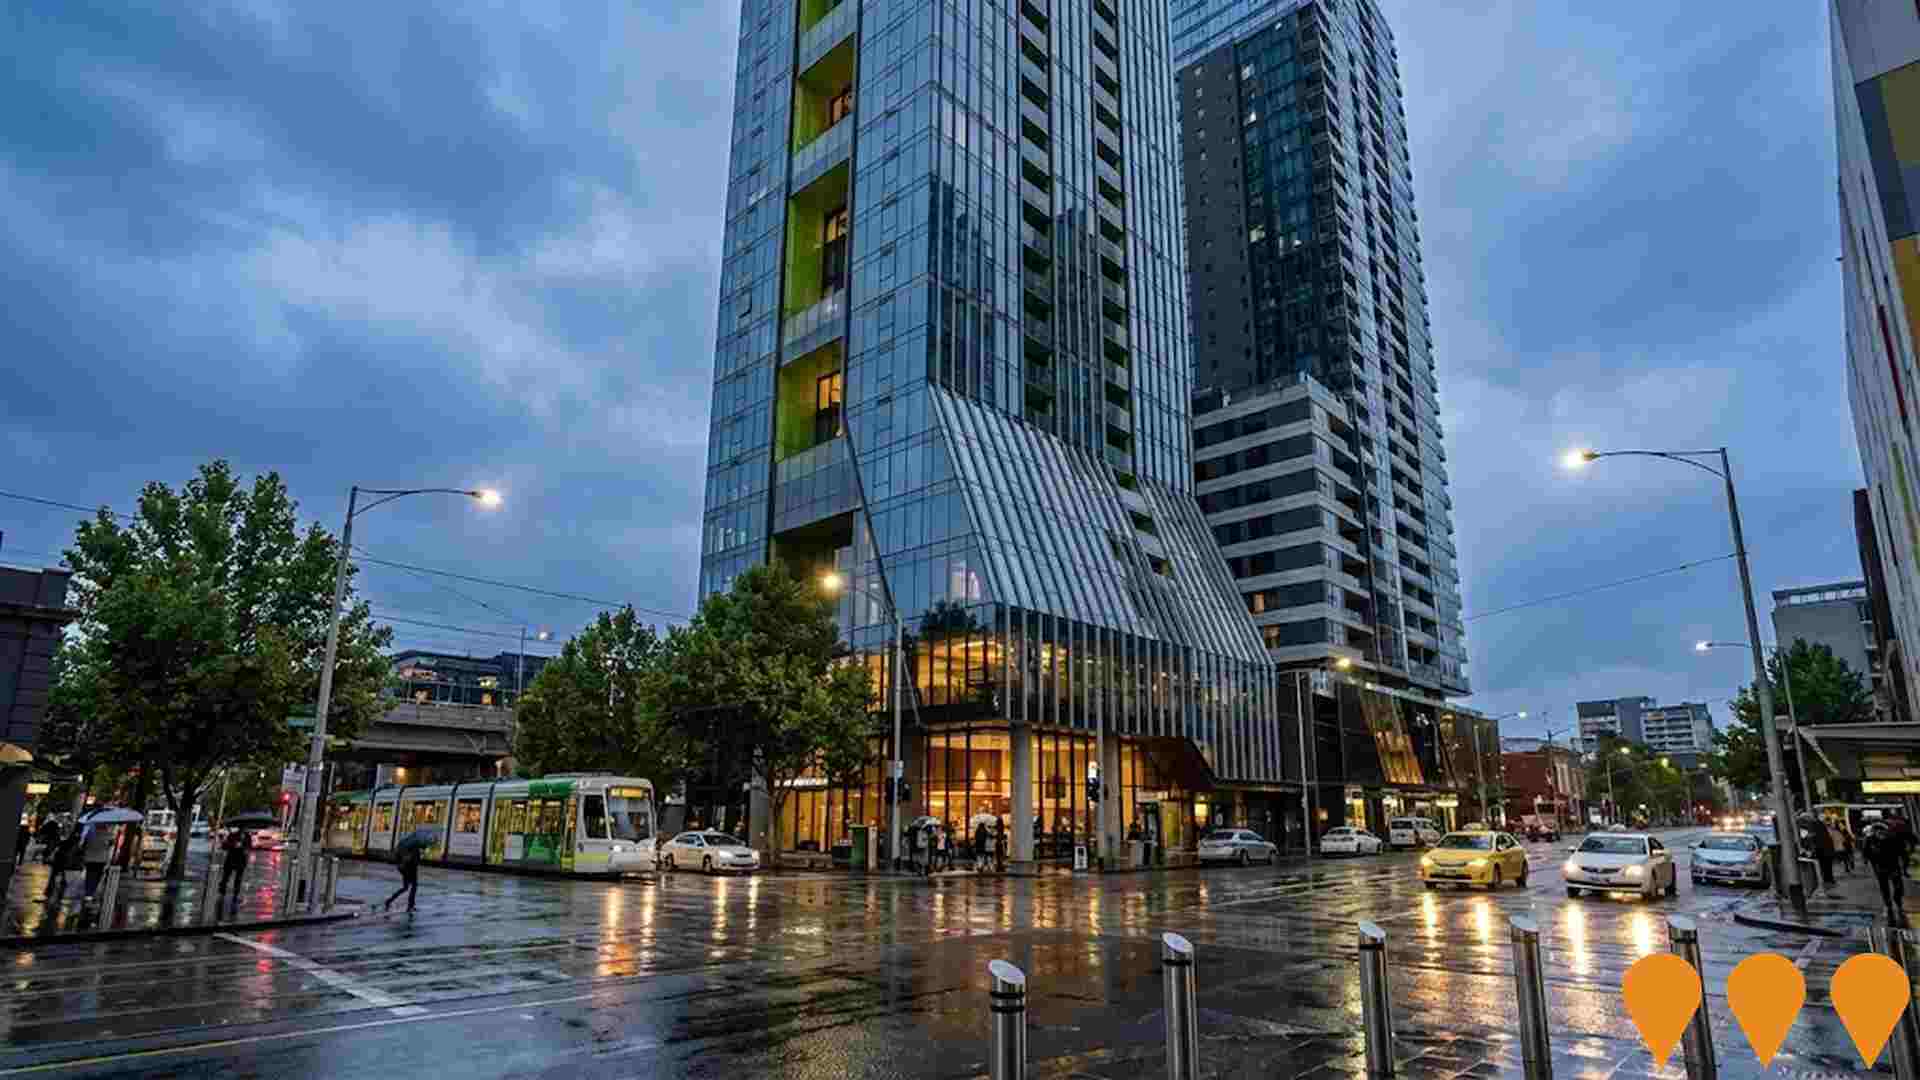
56-storey residential tower featuring 305 apartments, eight floors of office space, co-working facilities, and extensive wellness amenities including a day spa, yoga room, pool, gym, private dining rooms, residents' lounges, and outdoor terraces. Includes a hotel-grade reception, cafe, and bar. Designed by Rothelowman architects with interiors by David Hicks.
122 Moray
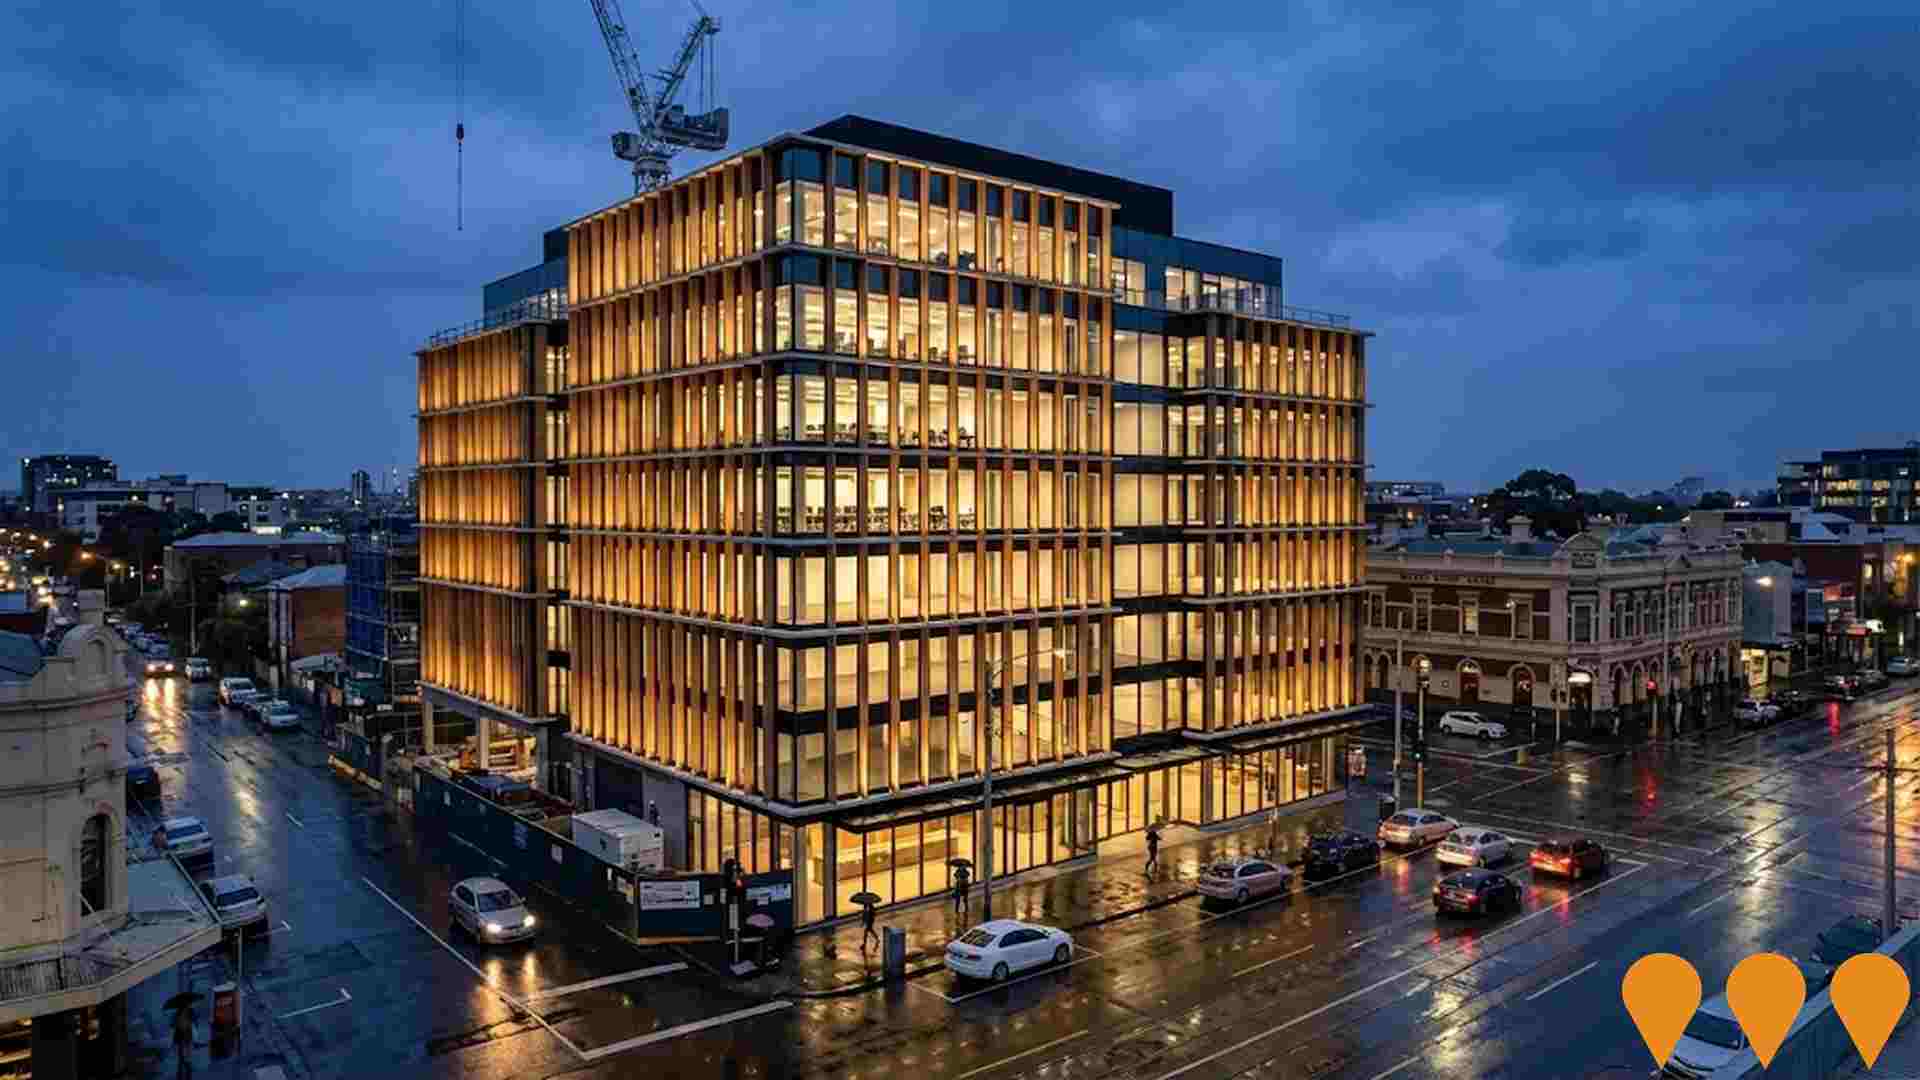
A $50 million mixed-use commercial project by Fortis comprising seven levels of premium office space (approx. 3,492 sqm) over ground-floor retail (approx. 303 sqm), designed by Fender Katsalidis with premium end-of-trip facilities and private terraces. Construction is underway with completion targeted for Q2 2026.
Employment
South Melbourne has seen below average employment performance when compared to national benchmarks
South Melbourne has an educated workforce with a notable technology sector. Its unemployment rate is 6.6%, with estimated employment growth of 4.4% over the past year.
As of September 2025, there are 8,128 employed residents, with an unemployment rate of 6.7%. The workforce participation rate is 67.8%, slightly higher than Greater Melbourne's 64.1%. Major employment industries include professional & technical services (2.1 times the regional average), health care & social assistance, and finance & insurance. Construction is under-represented with only 5.8% of South Melbourne's workforce compared to Greater Melbourne's 9.7%.
The worker-to-resident ratio is 1.8:1, indicating it serves as an employment hub attracting workers from nearby areas. Between September 2024 and September 2025, employment increased by 4.4% while the labour force grew by 5.0%, resulting in a 0.6 percentage point rise in unemployment rate. In contrast, Greater Melbourne's employment grew by 3.0%, labour force expanded by 3.3%, with unemployment rising by 0.3 percentage points. Statewide, Victoria's employment grew by 1.13% year-on-year to November 25, with an unemployment rate of 4.7%. National forecasts from May-25 project overall employment growth of 6.6% over five years and 13.7% over ten years. Applying these projections to South Melbourne's industry mix suggests local employment could increase by 7.3% in five years and 14.4% in ten years, although this is a simple extrapolation for illustrative purposes only.
Frequently Asked Questions - Employment
Income
Income metrics indicate excellent economic conditions, with the area achieving higher performance than 75% of national locations assessed by AreaSearch
South Melbourne SA2's income level is among the top percentile nationally according to latest ATO data aggregated by AreaSearch for financial year 2022. Its median income among taxpayers is $68,937 and average income stands at $106,223, compared to Greater Melbourne's figures of $54,892 and $73,761 respectively. Based on Wage Price Index growth of 12.16% since financial year 2022, current estimates would be approximately $77,320 (median) and $119,140 (average) as of September 2025. Census data reveals individual earnings stand out at the 94th percentile nationally ($1,310 weekly). Distribution data shows the $1,500 - 2,999 earnings band captures 29.5% of the community (3,841 individuals), mirroring regional levels where 32.8% occupy this bracket. Higher earners represent a substantial presence with 34.4% exceeding $3,000 weekly. High housing costs consume 16.9% of income, though strong earnings still place disposable income at the 71st percentile and the area's SEIFA income ranking places it in the 9th decile.
Frequently Asked Questions - Income
Housing
South Melbourne features a more urban dwelling mix with significant apartment living, with a higher proportion of rental properties than the broader region
In South Melbourne, as per the latest Census, 4.6% of dwellings were houses while 95.5% consisted of other types such as semi-detached homes, apartments and 'other' dwellings. In contrast, Melbourne metropolitan area had 8.7% houses and 91.3% other dwellings. Home ownership in South Melbourne stood at 20.9%, similar to Melbourne metro's figure, with mortgaged properties at 23.3% and rented ones at 55.9%. The median monthly mortgage repayment in South Melbourne was $2,217, higher than the Melbourne metro average of $2,170. The median weekly rent in South Melbourne was recorded as $421, compared to Melbourne metro's $420. Nationally, South Melbourne's median monthly mortgage repayments were significantly higher at $2,217 versus Australia's average of $1,863, while median weekly rents stood at $421 against the national figure of $375.
Frequently Asked Questions - Housing
Household Composition
South Melbourne features high concentrations of lone person households and group households, with a fairly typical median household size
Family households compose 51.2% of all households, including 15.2% couples with children, 27.7% couples without children, and 7.0% single parent families. Non-family households account for the remaining 48.8%, with lone person households at 43.2% and group households comprising 5.6%. The median household size is 1.9 people, which aligns with the Greater Melbourne average.
Frequently Asked Questions - Households
Local Schools & Education
The educational profile of South Melbourne exceeds national averages, with above-average qualification levels and academic performance metrics
South Melbourne's educational attainment significantly exceeds national and state averages. Among residents aged 15 and above, 56.9% have university qualifications, compared to 30.4% nationally and 33.4% in Victoria. Bachelor degrees are the most common at 35.8%, followed by postgraduate qualifications (16.6%) and graduate diplomas (4.5%). Vocational pathways account for 20.1% of qualifications, with advanced diplomas at 10.8% and certificates at 9.3%.
Educational participation is high, with 26.4% of residents currently enrolled in formal education. This includes 8.7% in tertiary education, 6.3% in primary education, and 5.0% pursuing secondary education.
Frequently Asked Questions - Education
Schools Detail
Nearby Services & Amenities
Transport
Transport servicing is high compared to other areas nationally based on assessment of service frequency, route connectivity and accessibility
South Melbourne has 39 active public transport stops operating within its boundaries. These stops are a mix of light rail and bus services. There are 8 individual routes servicing these stops, collectively providing 4,457 weekly passenger trips.
Transport accessibility is rated as excellent, with residents typically located 144 meters from the nearest transport stop. Service frequency averages 636 trips per day across all routes, equating to approximately 114 weekly trips per individual stop.
Frequently Asked Questions - Transport
Transport Stops Detail
Health
The level of general health in South Melbourne is notably higher than the national average with both young and old age cohorts seeing low prevalence of common health conditions
South Melbourne shows superior health outcomes for both young and elderly populations, with low prevalence of common conditions. Private health cover is exceptionally high at approximately 75%, compared to the national average of 55.3%.
The most prevalent medical issues are mental health (9.1%) and asthma (7.2%), while 72.1% report no medical ailments, slightly lower than Greater Melbourne's 73.3%. Residents aged 65 and over comprise 16.6%, higher than Greater Melbourne's 14.3%. Senior health outcomes are above average, mirroring the general population's profile.
Frequently Asked Questions - Health
Cultural Diversity
South Melbourne was found to be more culturally diverse than the vast majority of local markets in Australia, upon assessment of a range of language and cultural background related metrics
South Melbourne, surveyed in June 2016, had higher linguistic diversity than most local areas, with 25.0% speaking a language other than English at home and 37.2% born overseas. Christianity was the predominant religion, comprising 37.5%. Judaism, however, was more prevalent at 1.5%, compared to Greater Melbourne's 3.7%.
In terms of ancestry, the top three groups were English (24.3%), Australian (17.2%), and Other (12.5%). Some ethnic groups showed notable differences: Russian (0.8% vs regional 0.9%), French (0.9% vs 1.1%), and Greek (3.2% vs 3.2%) were similar to regional figures.
Frequently Asked Questions - Diversity
Age
South Melbourne's population aligns closely with national norms in age terms
The median age in South Melbourne is 39 years, which is higher than Greater Melbourne's average of 37 years and close to the national average of 38 years. The 25-34 cohort is notably over-represented in South Melbourne at 22.2%, compared to Greater Melbourne's average of 16.0%. Conversely, the 5-14 age group is under-represented at 6.4% locally, compared to Greater Melbourne's average of 9.3%. Nationally, the 25-34 cohort comprises 14.5%. According to post-2021 Census data, the 15-24 age group has grown from 8.7% to 10.3%, while the 25-34 cohort increased from 20.7% to 22.2%. Meanwhile, the 45-54 cohort has declined from 14.3% to 13.0%, and the 5-14 age group dropped from 7.4% to 6.4%. Population forecasts for South Melbourne in 2041 indicate substantial demographic changes. The 45-54 age group is projected to grow by 55%, reaching 2,616 people from 1,690.
