Chart Color Schemes
This analysis uses ABS Statistical Areas Level 2 (SA2) boundaries, which can materially differ from Suburbs and Localities (SAL) even when sharing similar names.
SA2 boundaries are defined by the Australian Bureau of Statistics and are designed to represent communities for statistical reporting (e.g., census and ERP).
Suburbs and Localities (SAL) represent commonly-used suburb/locality names (postal-style areas) and may use different geographic boundaries. For comprehensive analysis, consider reviewing both boundary types if available.
est. as @ -- *
ABS ERP | -- people | --
2021 Census | -- people
Sales Activity
Curious about local property values? Filter the chart to assess the volume and appreciation (including resales) trends and regional comparisons, or scroll to the map below view this information at an individual property level.
Find a Recent Sale
Sales Detail
Population
An assessment of population growth drivers in Bundoora - West reveals an overall ranking slightly below national averages considering recent, and medium term trends
Bundoora - West's population was around 6,780 as of November 2025. This reflected an increase of 594 people since the 2021 Census, which reported a population of 6,186 people. The change was inferred from the estimated resident population of 6,742 in June 2024 and an additional 63 validated new addresses since the Census date. This level of population resulted in a density ratio of 2,648 persons per square kilometer, placing it in the upper quartile relative to national locations assessed by AreaSearch. Bundoora - West's growth rate of 9.6% since the 2021 census exceeded the national average of 8.9%, indicating it as a growth leader in the region. Overseas migration contributed approximately 88.4% of overall population gains during recent periods, driving primary growth for the area.
AreaSearch adopted ABS/Geoscience Australia projections for each SA2 area released in 2024 with 2022 as the base year. For areas not covered by this data, AreaSearch utilized VIC State Government's Regional/LGA projections released in 2023, adjusting them employing a method of weighted aggregation of population growth from LGA to SA2 levels. Growth rates by age group were applied across all areas for years 2032 to 2041. Based on demographic trends and the latest annual ERP population numbers, exceptional growth is predicted over the period with the area expected to increase by 2,894 persons to 2041, reflecting a gain of 42.1% in total over the 17 years.
Frequently Asked Questions - Population
Development
Residential development activity is lower than average in Bundoora - West according to AreaSearch's national comparison of local real estate markets
Bundoora West has averaged approximately 21 new dwelling approvals annually over the past five financial years, totalling 106 homes. As of FY-26, 15 approvals have been recorded. On average, each dwelling built between FY-21 and FY-25 has resulted in an increase of 2.5 new residents per year, indicating strong demand which supports property values. The average construction cost value for new homes is $178,000, reflecting more affordable housing options compared to regional norms.
In the current financial year, there have been $12.5 million in commercial approvals, demonstrating moderate levels of commercial development. Compared to Greater Melbourne, Bundoora West records significantly lower building activity, at 77.0% below the regional average per person. This limited new supply generally supports stronger demand and values for established properties. The area's population density stands at around 826 people per approval, indicating a mature, established area. Recent construction in Bundoora West comprises 38.0% standalone homes and 62.0% medium to high-density housing. This shift from the existing housing stock (currently 79.0% houses) indicates decreasing availability of developable sites and reflects changing lifestyles and the need for more diverse, affordable housing options. Looking ahead, Bundoora West is projected to grow by 2,856 residents through to 2041, according to the latest AreaSearch quarterly estimate.
If current development rates continue, housing supply may not keep pace with population growth, potentially increasing competition among buyers and supporting stronger price growth.
Frequently Asked Questions - Development
Infrastructure
Bundoora - West has strong levels of nearby infrastructure activity, ranking in the top 40% nationally
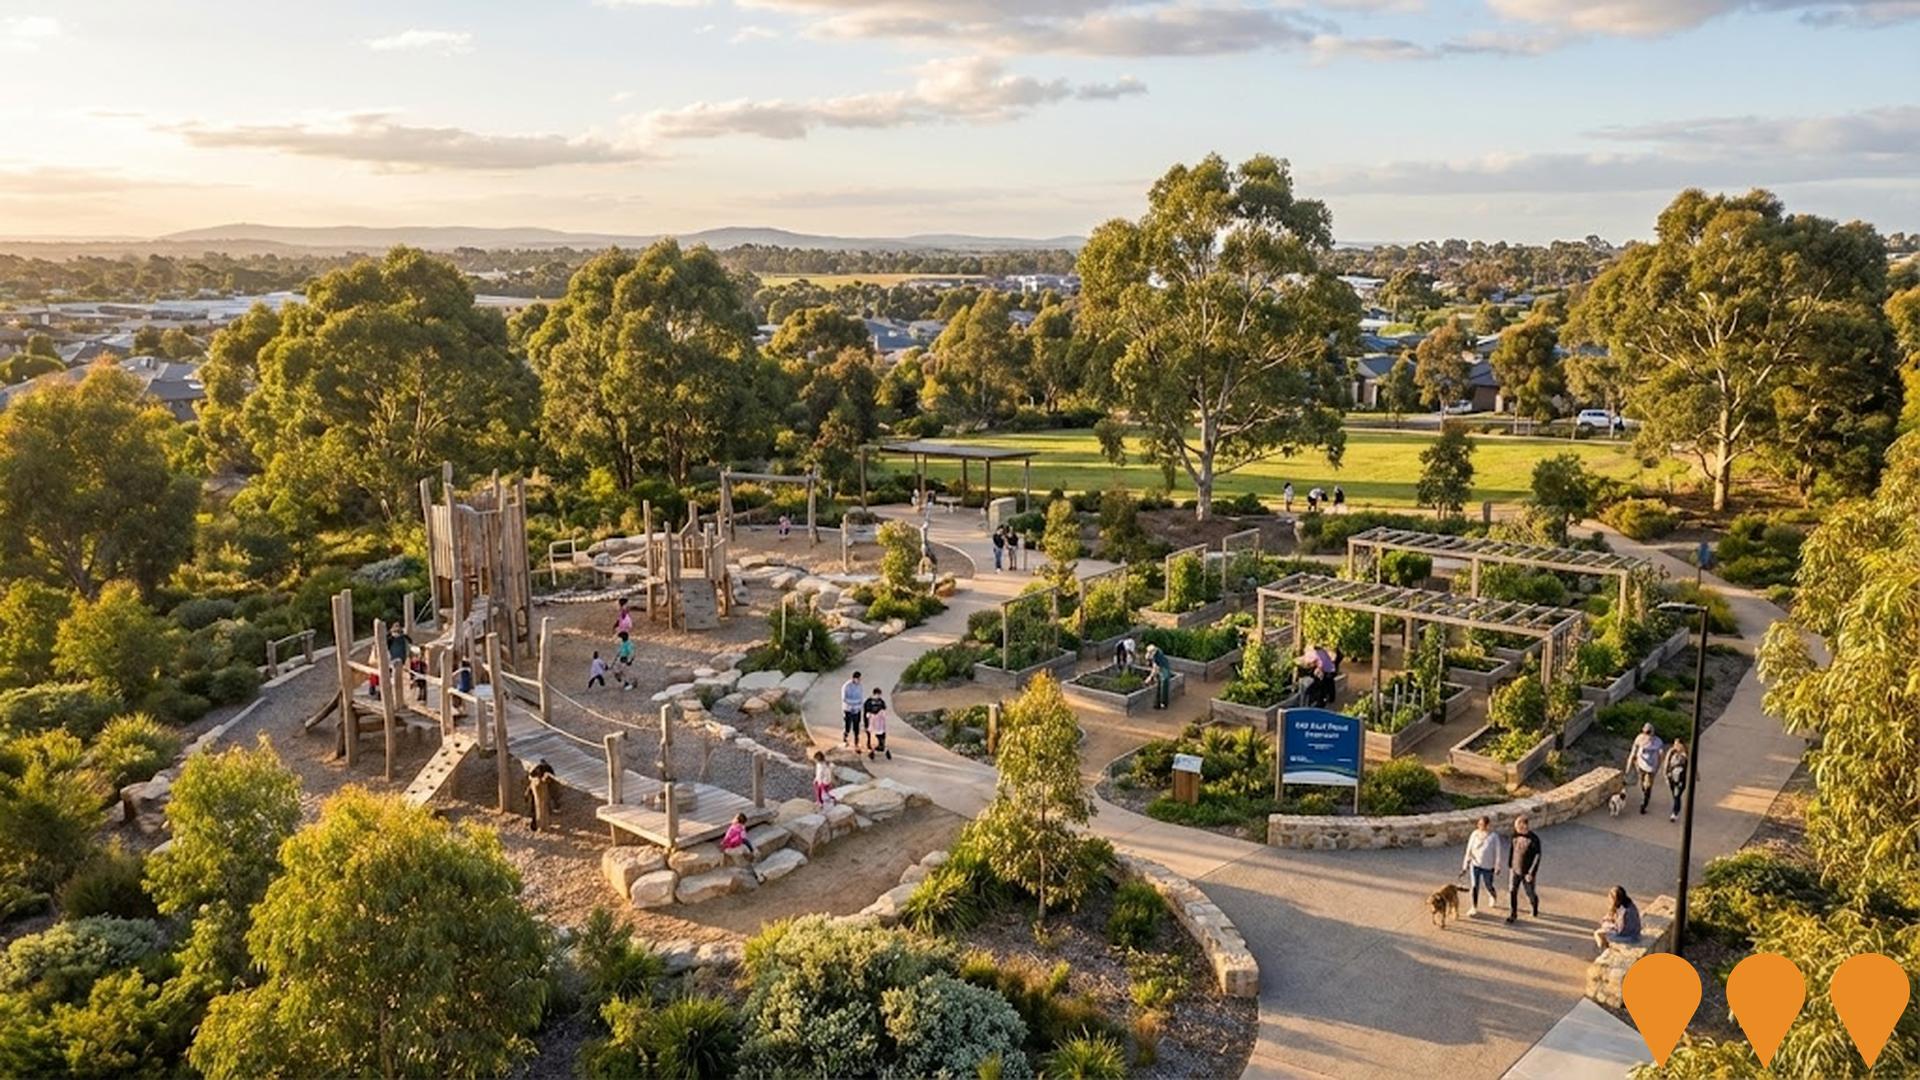
Changes to local infrastructure significantly affect an area's performance. AreaSearch identified ten projects likely impacting the region. Notable ones are M80 Ring Road Completion, Research and Development Centre, Mill Park Secondary College Performing Arts Centre, Norris Bank Reserve Upgrade. The following details those most relevant:.
Professional plan users can use the search below to filter and access additional projects.
INFRASTRUCTURE SEARCH
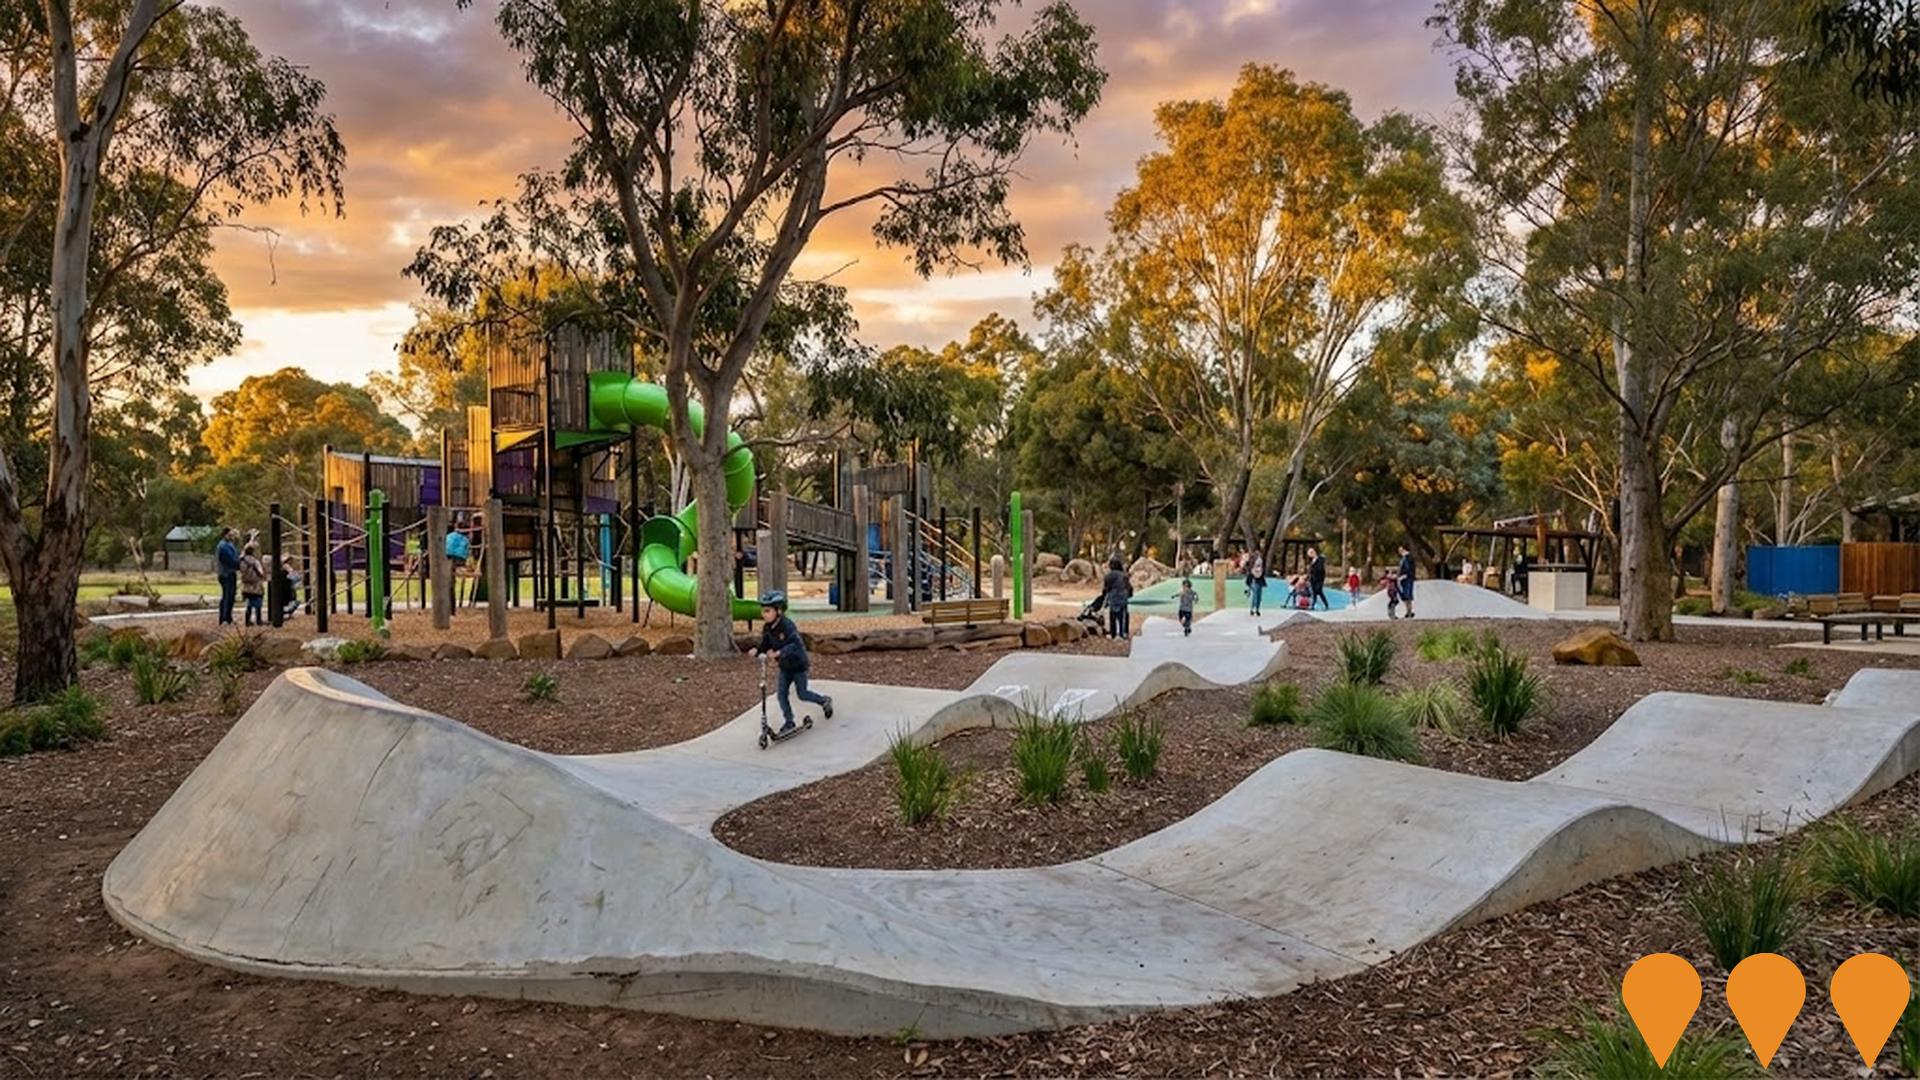
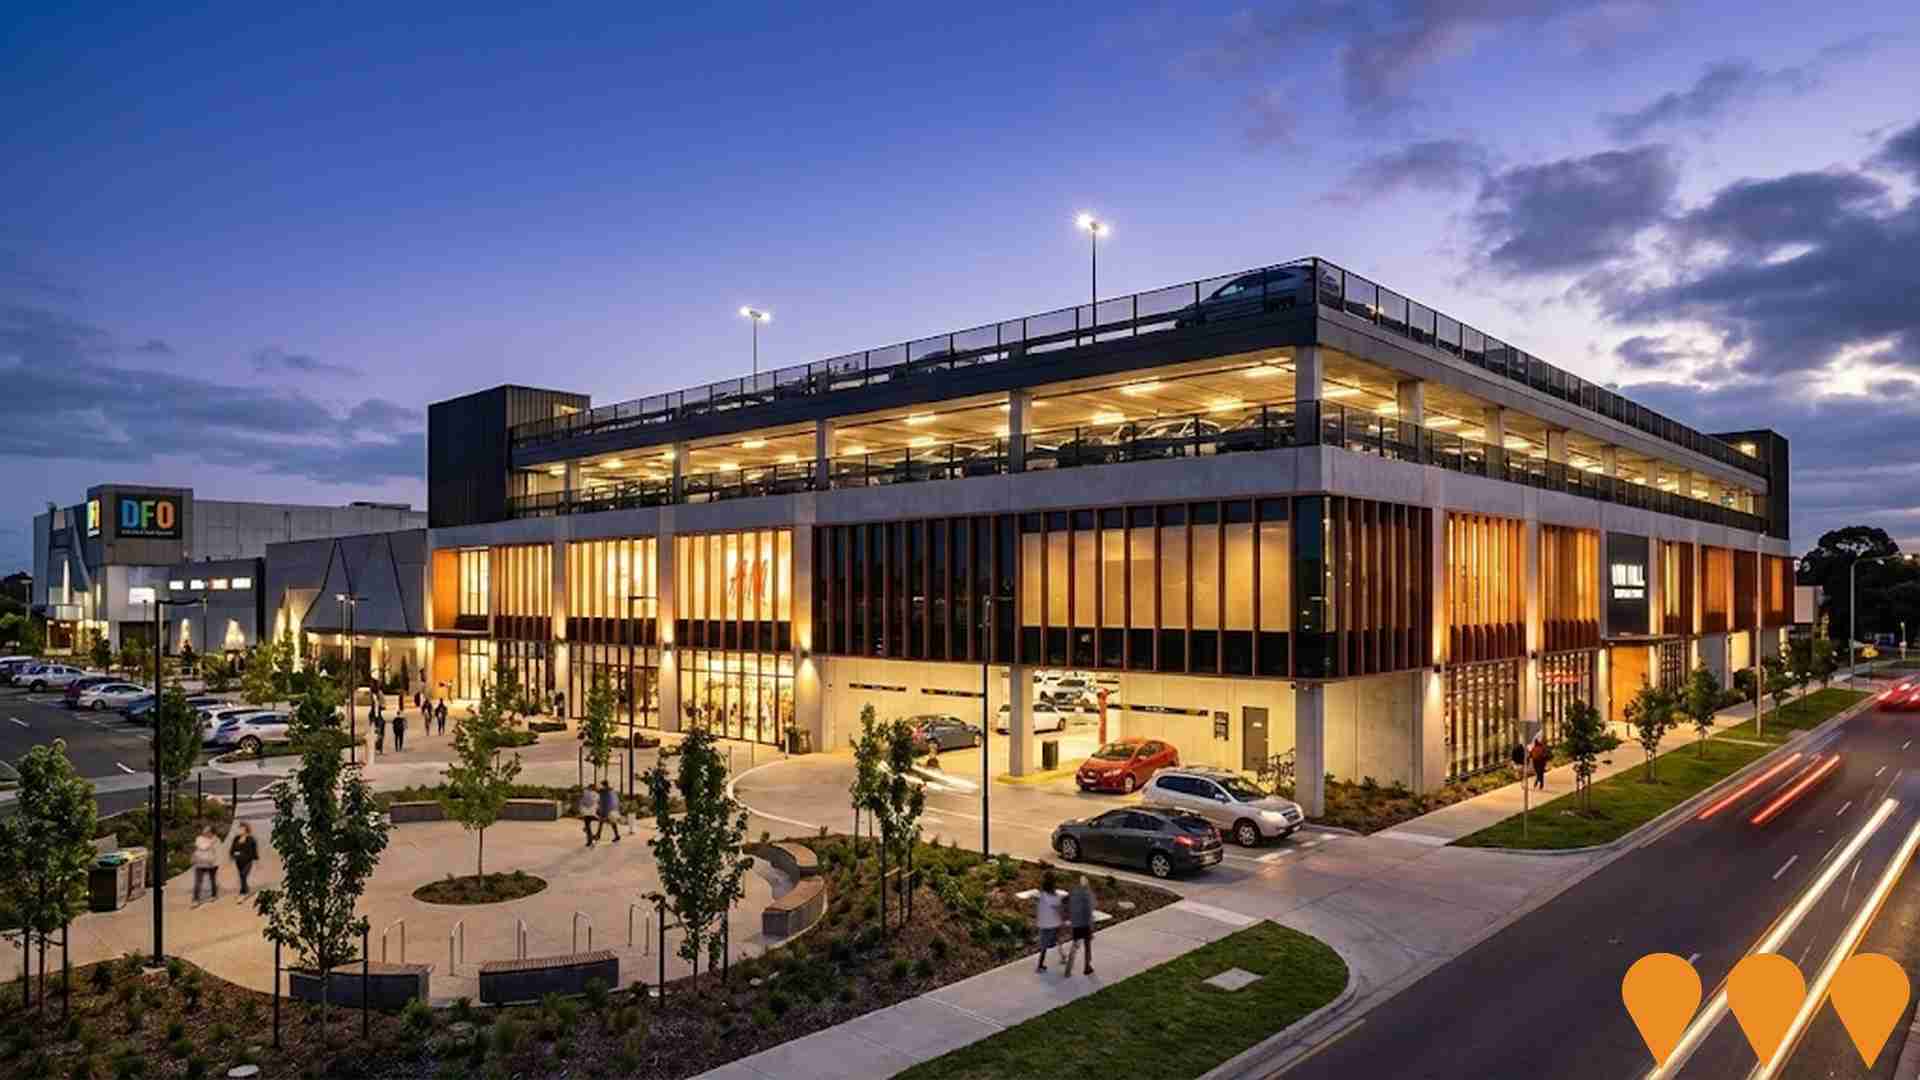
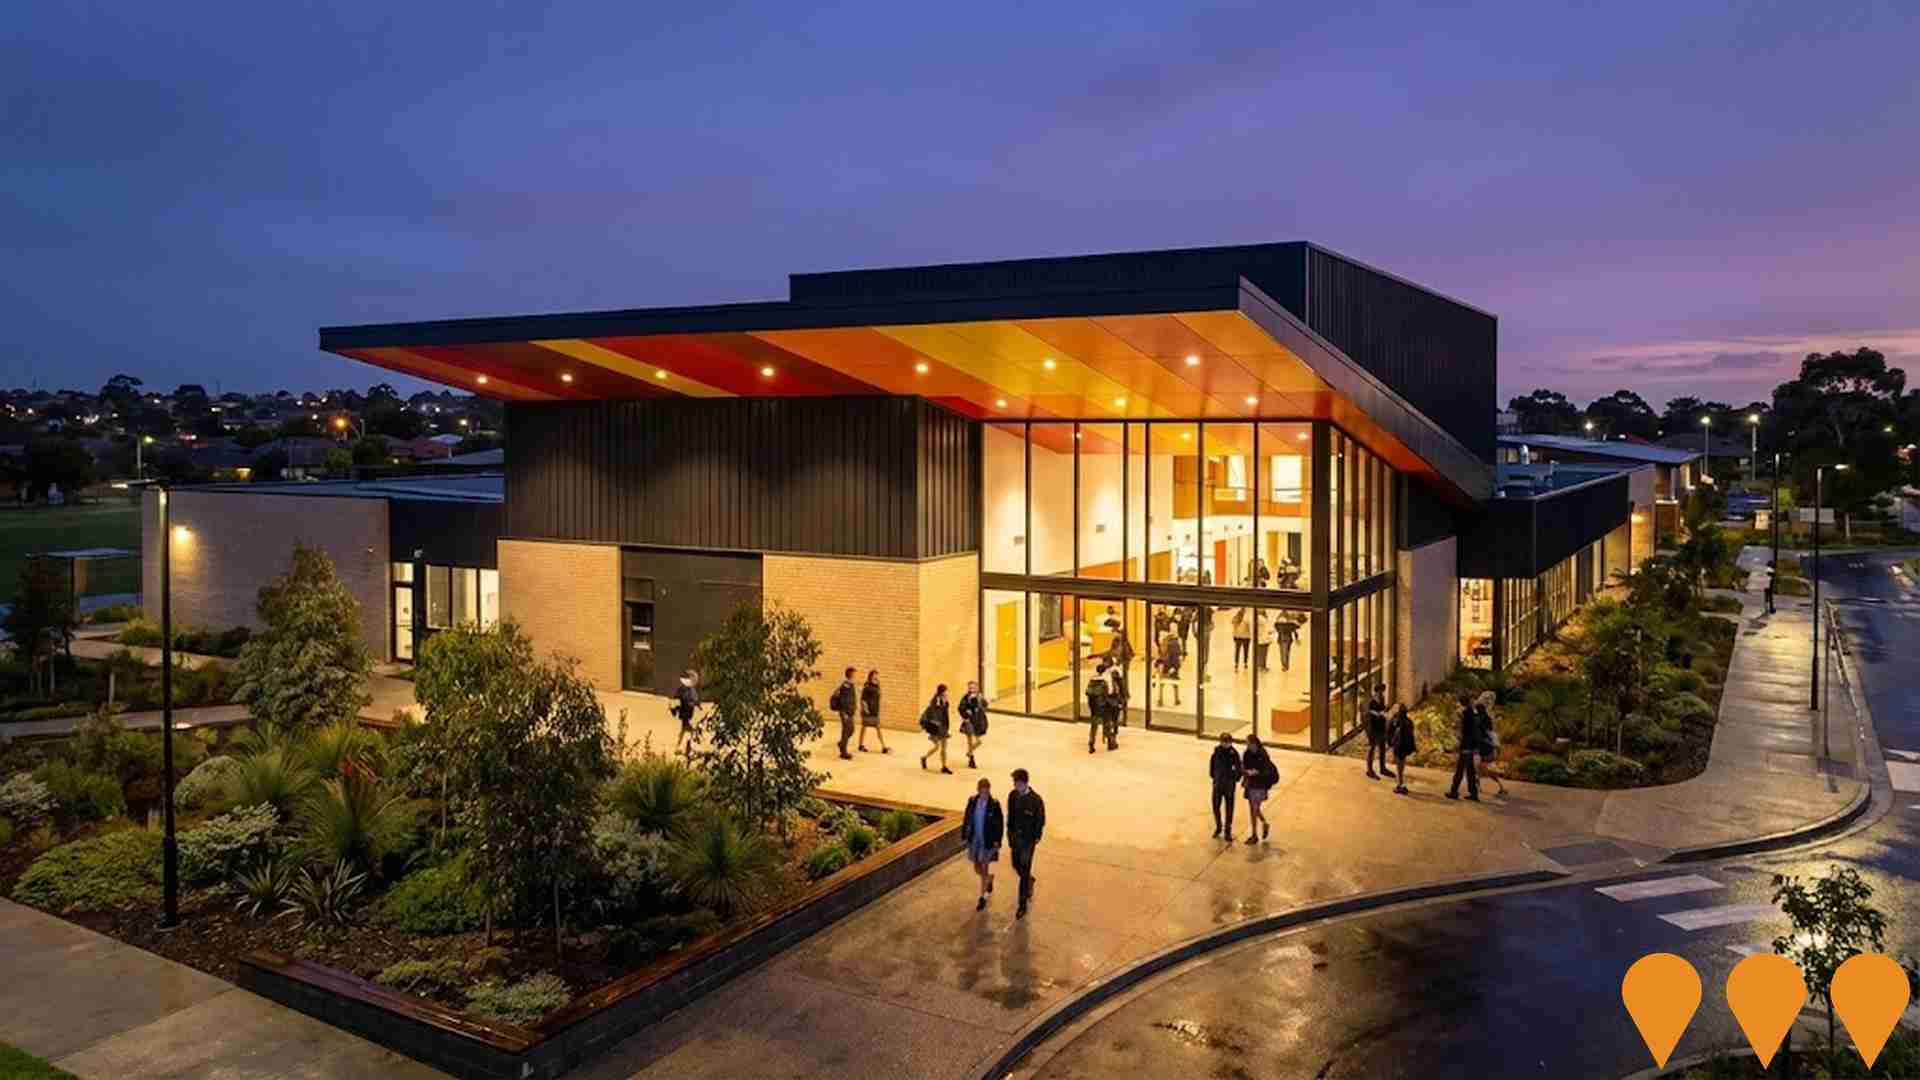
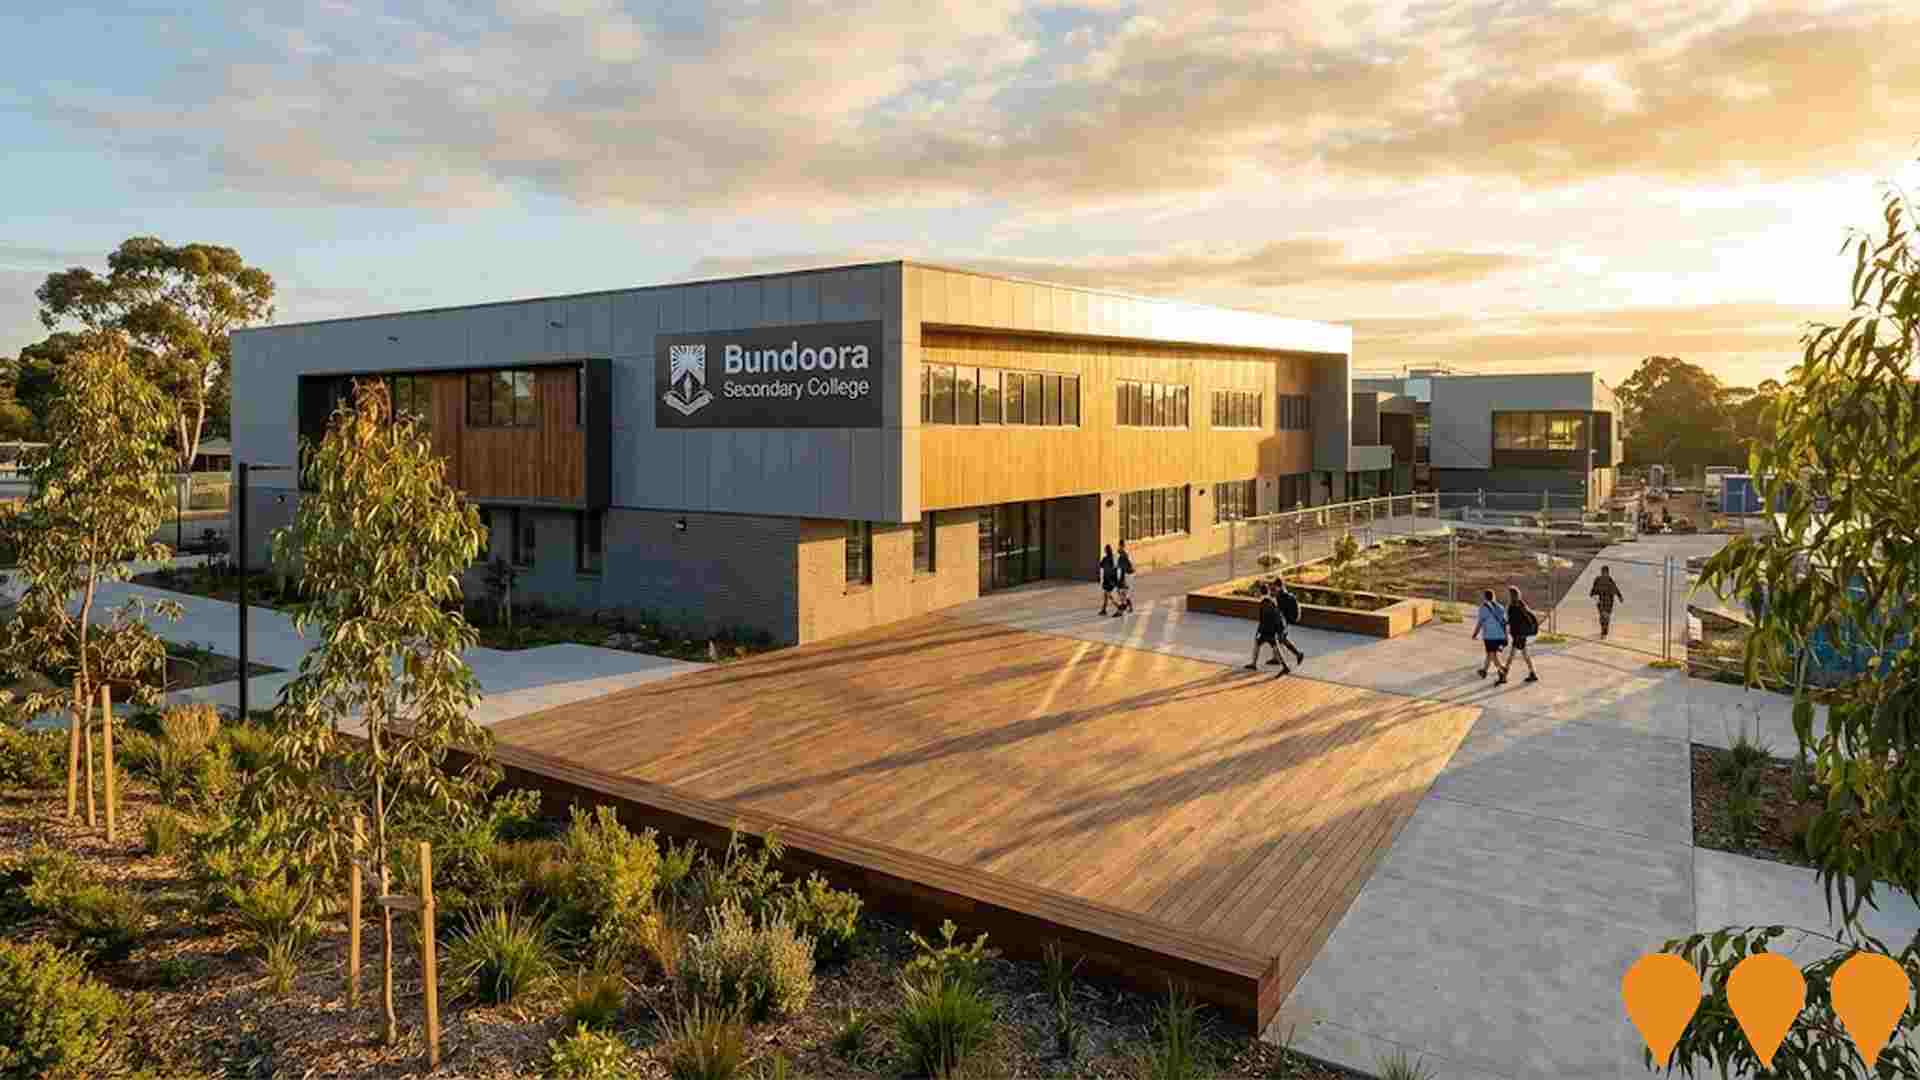
 Denotes AI-based impression for illustrative purposes only, not to be taken as definitive under any circumstances. Please follow links and conduct other investigations from the project's source for actual imagery. Developers and project owners wishing us to use original imagery please Contact Us and we will do so.
Frequently Asked Questions - Infrastructure
Suburban Rail Loop North
Suburban Rail Loop North is the 26 km second stage of Melbourne's orbital rail project, running underground from Box Hill to Melbourne Airport with new stations at Doncaster, Heidelberg, Bundoora, Reservoir, Fawkner, Broadmeadows and Melbourne Airport. It will connect with the metropolitan and regional rail network and provide direct rail access to Melbourne Airport for the first time.

M80 Ring Road Completion
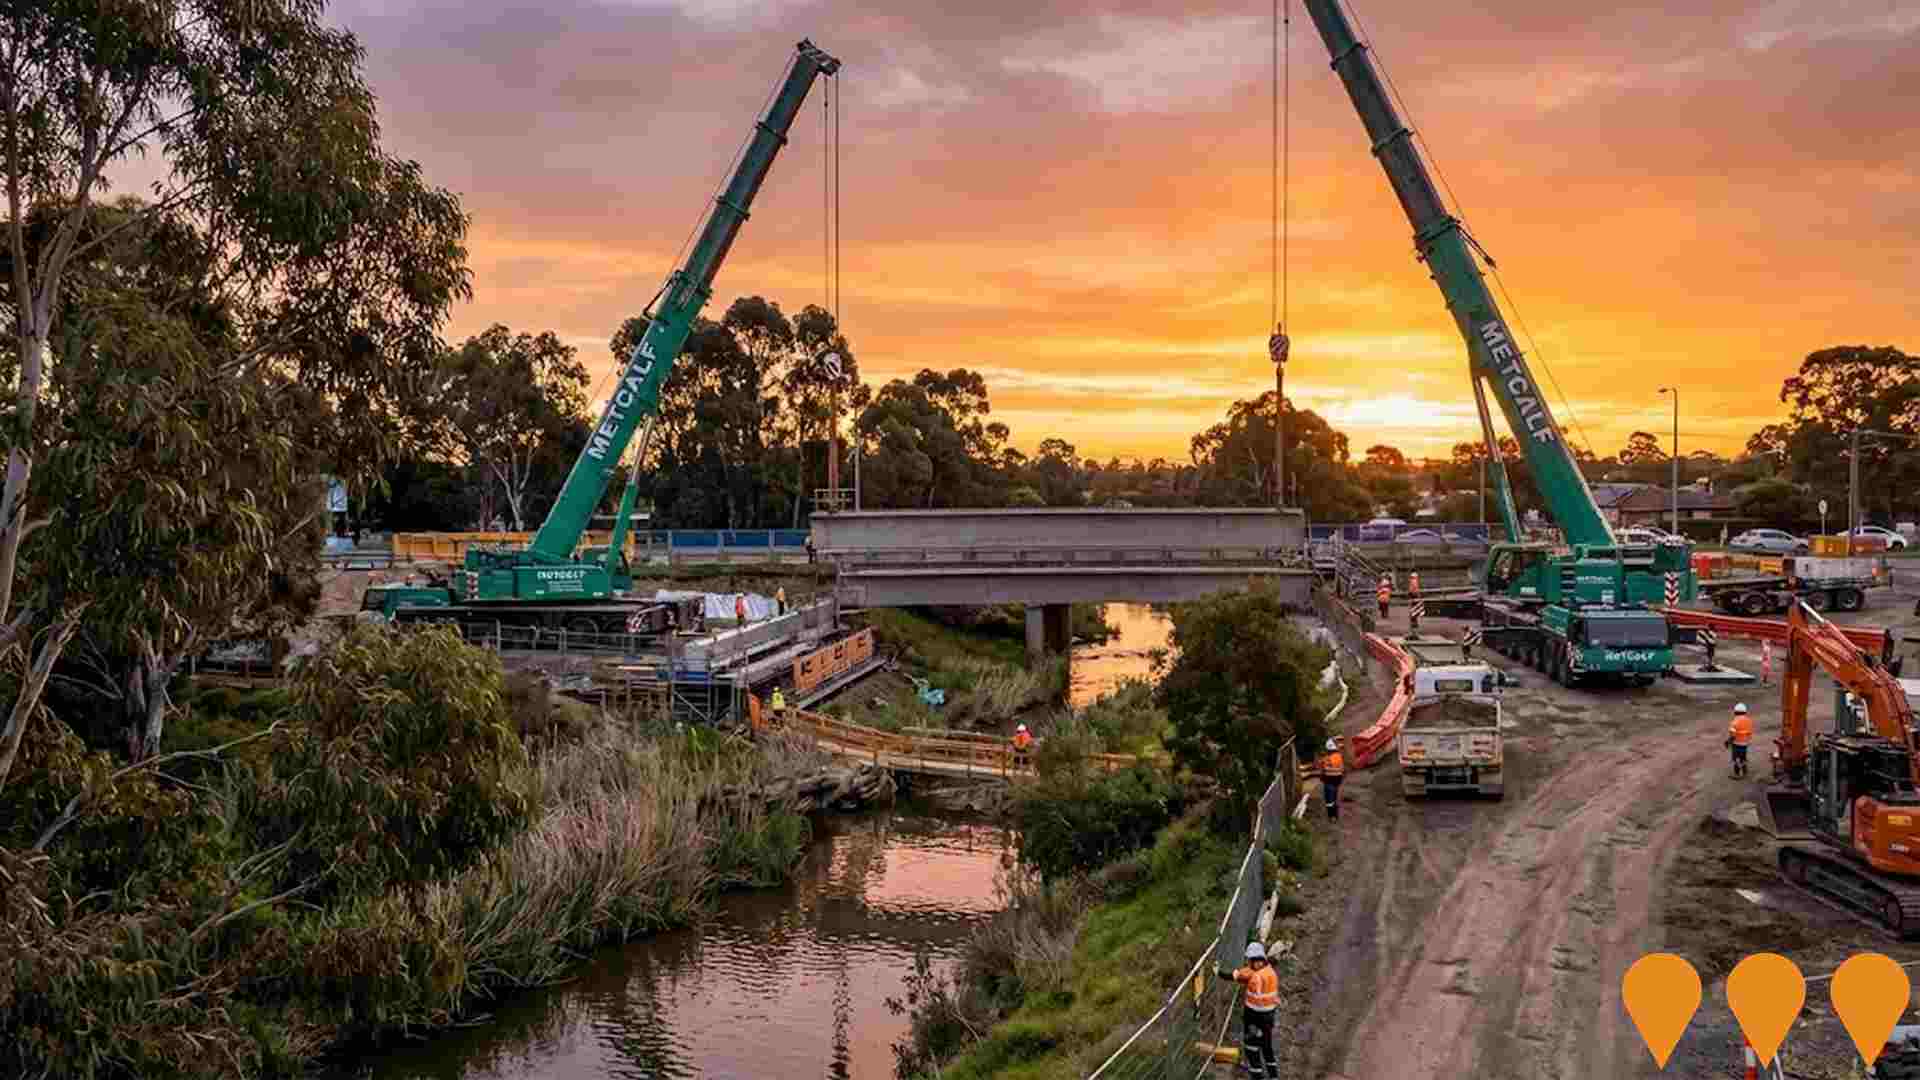
Final stage completing the M80 Ring Road upgrade between Plenty Road (Greensborough) and the North East Link tunnels (Watsonia). Delivers 14 km of new lanes, express lanes to North East Link, new interchanges at Plenty Road and Grimshaw Street, landscaped bridges at Elder Street and Watsonia Road, over 10 km of walking and cycling paths, and smart freeway technology. Expected to remove up to 19,000 vehicles per day from local roads.

Reservoir Leisure Centre Redevelopment
Major redevelopment and expansion of the Reservoir Leisure Centre into a modern regional aquatic and wellbeing hub. Includes new 50m pool, warm-water program pool, learn-to-swim facilities, hydrotherapy pool, larger gym, group fitness studios, allied health services, creche, cafe and community spaces. Designed to improve health outcomes and address disadvantage in Reservoir and surrounding suburbs.

Plenty Road Upgrade Stage 1 & 2
A $178.6 million upgrade of Plenty Road between McKimmies Road and Bridge Inn Road. Includes adding a new lane in each direction, upgrading 17 intersections, installing traffic lights at Rivergum and Mayfield Drives, widening footpaths, building new shared walking and cycling paths, on-road cyclist lanes, and installing 10,000 metres of safety barriers. Reduces congestion and improves safety.

Northpark Private Hospital Redevelopment
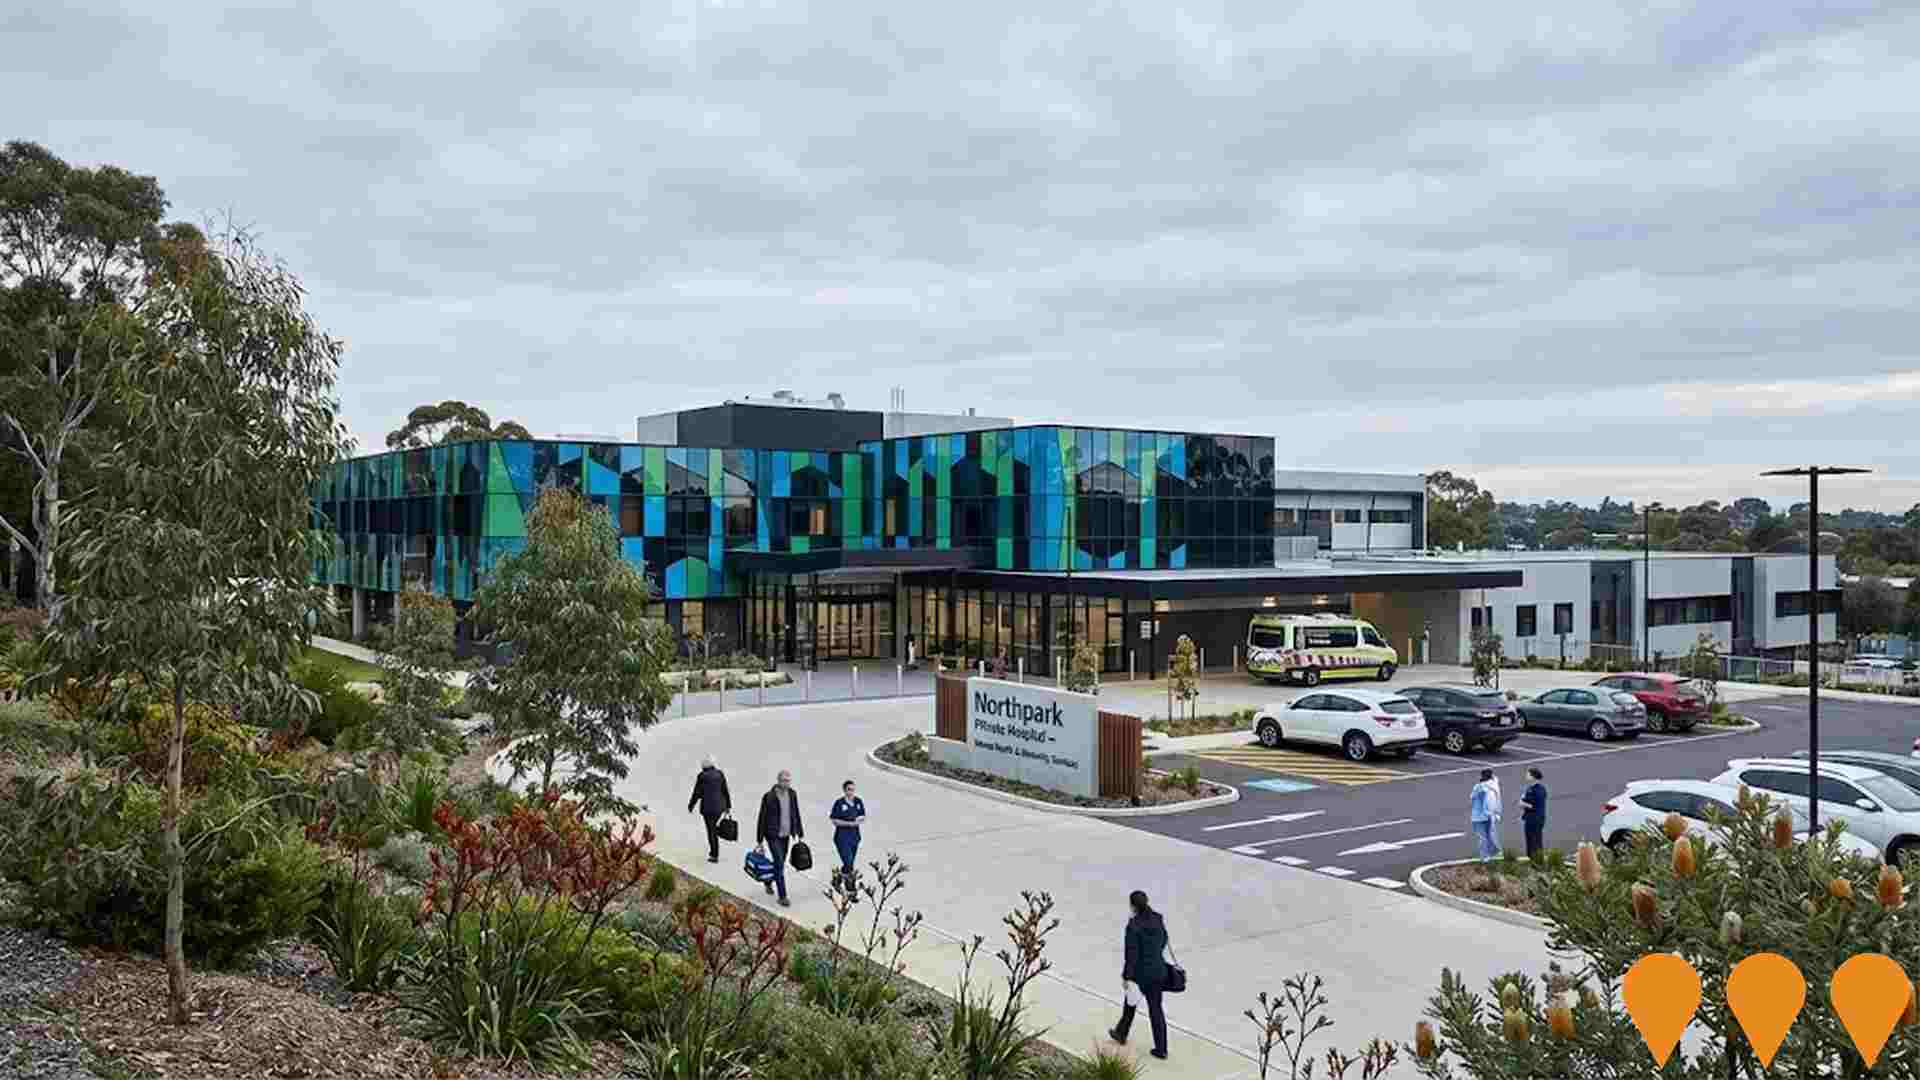
Major redevelopment adding 22 mental health beds, dedicated older persons' mental health unit, expanded TMS (Transcranial Magnetic Stimulation) service, group therapy rooms, patient lounges, dining areas, courtyards, and activity rooms. The expansion provides 73 total mental health beds including Early Parenting Unit, focusing on adult mental health, older persons' mental health, maternity, women's health, surgical, and medical services.
Research and Development Centre
Use and development of land for a Research and Development Centre, including reduction in car parking requirements and removal of native vegetation. The project was approved under the Development Facilitation Program on 21 March 2024.

Parc Vue Master Planned Development
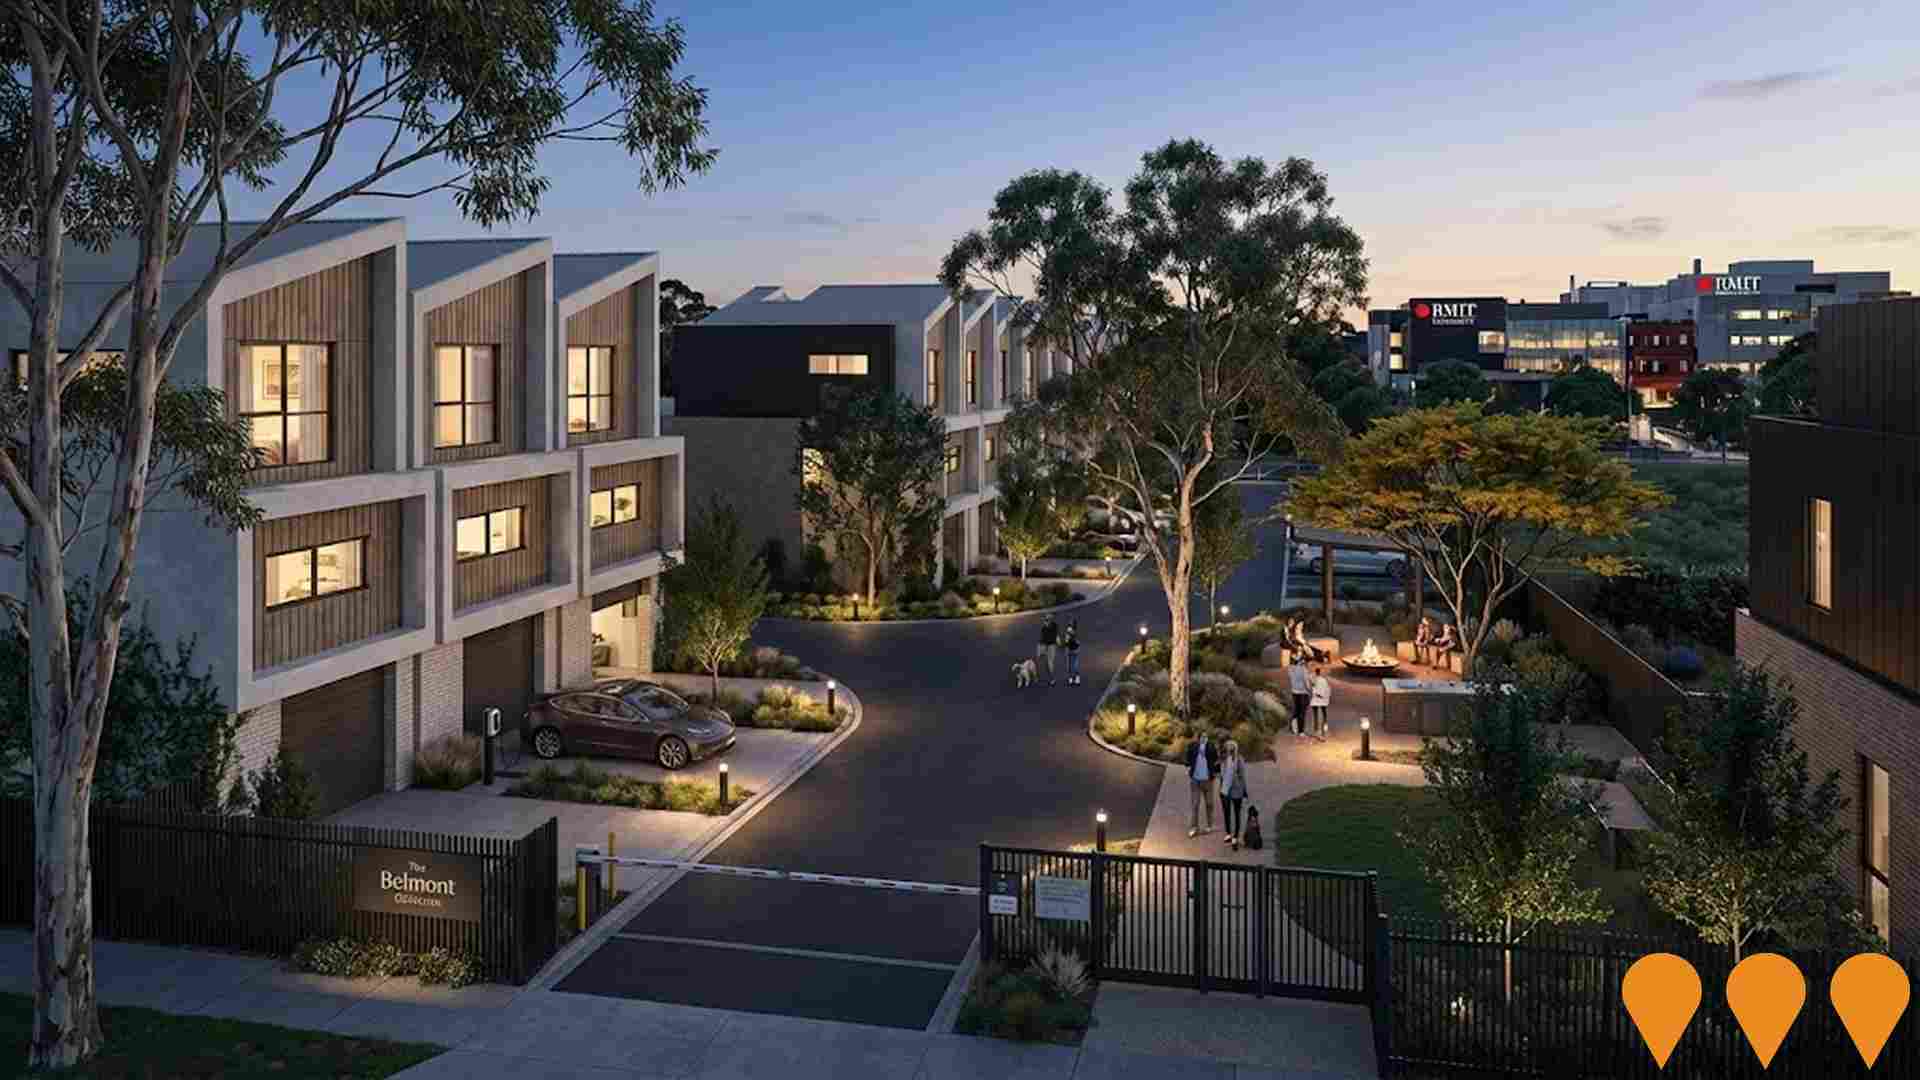
A $450 million three-stage development by Future Estate featuring luxury apartments, retail spaces, and conference facilities. Located opposite Bundoora Park with views of Melbourne CBD. Includes Botanic and Laureate stages with comprehensive amenities.

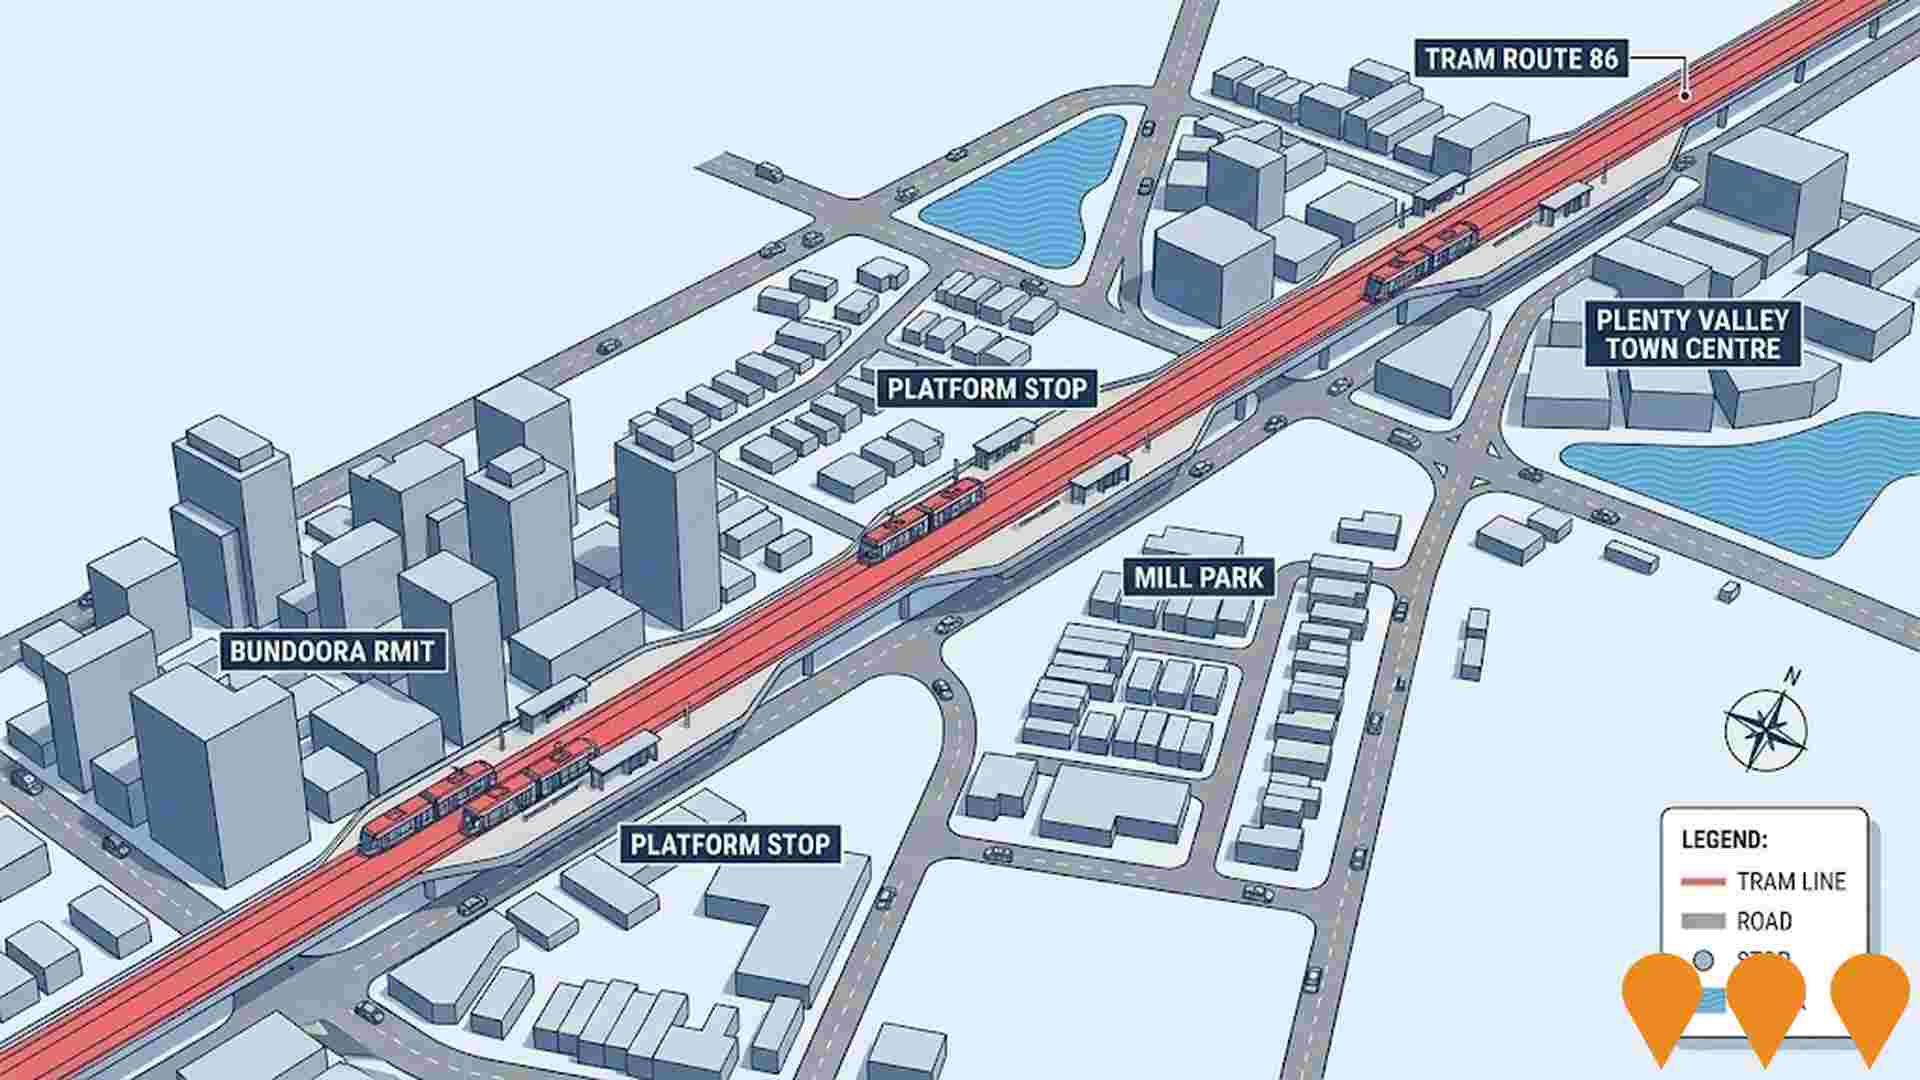
Tram Route 86 Extension
Proposed extension of Melbourne's Tram Route 86 from Bundoora RMIT to South Morang via Mill Park and Plenty Valley Town Centre, as part of long-term plans to improve public transport connectivity in northern suburbs. According to Melbourne's Tram Plan released in 2023, future extensions will be considered beyond 2032 in response to land use changes. Local councils continue to advocate for feasibility studies and funding.
Employment
AreaSearch analysis indicates Bundoora - West maintains employment conditions that align with national benchmarks
Bundoora-West has a well-educated workforce with prominent representation in essential services sectors. Its unemployment rate is 3.4%, lower than Greater Melbourne's 4.7%.
Over the past year, employment growth was estimated at 1.1%. As of September 2025, 3,558 residents are employed, with an unemployment rate of 1.2% below Greater Melbourne's rate. Workforce participation is significantly lower at 56.8%, compared to Greater Melbourne's 64.1%. Employment in Bundoora-West is concentrated in health care & social assistance, retail trade, and construction.
Retail trade shows strong specialization with an employment share of 1.2 times the regional level. Conversely, professional & technical services have lower representation at 6.7%, compared to the regional average of 10.1%. Limited local employment opportunities are indicated by the count of Census working population versus resident population in Bundoora-West. From September 2024 to September 2025, employment increased by 1.1% while labour force grew by 0.5%, reducing the unemployment rate by 0.5 percentage points. In contrast, Greater Melbourne recorded employment growth of 3.0%, with unemployment rising slightly. State-level data as of 25-Nov-25 shows Victoria's employment grew by 1.13% year-on-year, adding 41,950 jobs, with the state unemployment rate at 4.7%. National employment forecasts from May-25 project national growth rates of 6.6% over five years and 13.7% over ten years. Applying these projections to Bundoora-West's employment mix suggests local employment should increase by approximately 6.4% over five years and 13.4% over ten years, assuming constant population projections.
Frequently Asked Questions - Employment
Income
Income figures position the area below 75% of locations analysed nationally by AreaSearch
The median taxpayer income in Bundoora - West SA2 is $45,068 and the average is $56,128 based on latest postcode level ATO data aggregated by AreaSearch for financial year 2022. This is lower than national averages, with Greater Melbourne's median income being $54,892 and average income $73,761. By September 2025, estimated incomes would be approximately $50,548 (median) and $62,953 (average), accounting for a 12.16% Wage Price Index growth since financial year 2022. Census data indicates that incomes in Bundoora - West fall between the 17th and 30th percentiles nationally. The income band of $1,500 - 2,999 captures 32.2% of the community (2,183 individuals), similar to regional trends showing 32.8% in the same category. Housing affordability pressures are severe, with only 83.5% of income remaining after housing costs, ranking at the 29th percentile nationally. The area's SEIFA income ranking places it in the 5th decile.
Frequently Asked Questions - Income
Housing
Bundoora - West is characterized by a predominantly suburban housing profile, with above-average rates of outright home ownership
Dwelling structure in Bundoora - West, as per the latest Census, consisted of 78.6% houses and 21.3% other dwellings (semi-detached, apartments, 'other' dwellings), compared to Melbourne metro's 88.7% houses and 11.3% other dwellings. Home ownership in Bundoora - West was higher than Melbourne metro at 42.2%, with the rest being mortgaged (27.9%) or rented (29.8%). The median monthly mortgage repayment was $1,900, aligning with Melbourne metro's average, while median weekly rent was $380 compared to Melbourne metro's $371. Nationally, Bundoora - West's mortgage repayments exceeded the Australian average of $1,863, and rents were higher than the national figure of $375.
Frequently Asked Questions - Housing
Household Composition
Bundoora - West features high concentrations of group households, with a lower-than-average median household size
Family households account for 67.6% of all households, including 26.7% couples with children, 27.5% couples without children, and 11.8% single parent families. Non-family households constitute the remaining 32.4%, with lone person households at 26.2% and group households comprising 6.1%. The median household size is 2.4 people, smaller than Greater Melbourne's average of 2.9.
Frequently Asked Questions - Households
Local Schools & Education
The educational profile of Bundoora - West exceeds national averages, with above-average qualification levels and academic performance metrics
Educational qualifications in Bundoora show that 30.5% of residents aged 15+ have university degrees, compared to Greater Melbourne's 37.0%. This indicates potential for educational development. Bachelor degrees are the most common (18.4%), followed by postgraduate qualifications (9.7%) and graduate diplomas (2.4%). Vocational credentials are also prevalent, with 28.5% of residents holding them - advanced diplomas at 10.8% and certificates at 17.7%.
Educational participation is high, with 26.6% currently enrolled in formal education. This includes tertiary (7.5%), primary (6.7%), and secondary education (5.0%).
Frequently Asked Questions - Education
Schools Detail
Nearby Services & Amenities
Transport
Transport servicing is good compared to other areas nationally based on assessment of service frequency, route connectivity and accessibility
Transport analysis shows 17 active stops operating within Bundoora-West. These include lightrail and bus services. Five routes serve these stops, collectively providing 3,212 weekly passenger trips.
Transport accessibility is rated good, with residents typically located 328 meters from the nearest stop. Service frequency averages 458 trips per day across all routes, equating to approximately 188 weekly trips per individual stop.
Frequently Asked Questions - Transport
Transport Stops Detail
Health
Health outcomes in Bundoora - West are marginally below the national average with common health conditions slightly more prevalent than average across both younger and older age cohorts
Bundoora - West shows below-average health outcomes, with common conditions more prevalent than average across all ages. Private health cover is low at approximately 48%, compared to the national average of 55.3%.
The most common conditions are arthritis (8.8%) and mental health issues (7.6%), while 69.1% report no medical ailments, slightly lower than Greater Melbourne's 74.0%. Residents aged 65 and over make up 22.7%, higher than Greater Melbourne's 13.2%.
Frequently Asked Questions - Health
Cultural Diversity
Bundoora - West is among the most culturally diverse areas in the country based on AreaSearch assessment of a range of language and cultural background related metrics
Bundoora-West has a high level of cultural diversity, with 45.6% of its population born overseas and 49.2% speaking a language other than English at home. The predominant religion in Bundoora-West is Christianity, making up 54.5% of the population. Islam, however, is overrepresented compared to Greater Melbourne, comprising 4.7% versus 9.1%.
In terms of ancestry, the top three groups are Australian (14.1%), English (13.3%), and Other (12.8%). Notably, Greek (6.5%) and Macedonian (3.8%) are overrepresented compared to regional averages of 4.1% and 4.6%, respectively, while Croatian is also overrepresented at 1.8% versus 0.7%.
Frequently Asked Questions - Diversity
Age
Bundoora - West's population is slightly older than the national pattern
The median age in Bundoora-West is 39 years, which is higher than Greater Melbourne's average of 37 years and close to the national average of 38 years. The 75-84 age cohort is over-represented at 8.6% compared to Greater Melbourne's average, while the 5-14 age group is under-represented at 8.4%. Post-2021 Census data shows that the 15 to 24 age group has increased from 11.3% to 14.0%, while the 45 to 54 cohort has declined from 11.1% to 9.4% and the 65 to 74 group has dropped from 12.0% to 10.5%. Population forecasts for 2041 indicate substantial demographic changes in Bundoora-West, with the 25 to 34 age group expected to grow by 33%, reaching 1,590 people from 1,192.
