Chart Color Schemes
This analysis uses ABS Statistical Areas Level 2 (SA2) boundaries, which can materially differ from Suburbs and Localities (SAL) even when sharing similar names.
SA2 boundaries are defined by the Australian Bureau of Statistics and are designed to represent communities for statistical reporting (e.g., census and ERP).
Suburbs and Localities (SAL) represent commonly-used suburb/locality names (postal-style areas) and may use different geographic boundaries. For comprehensive analysis, consider reviewing both boundary types if available.
est. as @ -- *
ABS ERP | -- people | --
2021 Census | -- people
Sales Activity
Curious about local property values? Filter the chart to assess the volume and appreciation (including resales) trends and regional comparisons, or scroll to the map below view this information at an individual property level.
Find a Recent Sale
Sales Detail
Population
Mill Park - South is positioned among the lower quartile of areas assessed nationally for population growth based on AreaSearch's assessment of recent, and medium term trends
Mill Park - South's population was approximately 11,605 as of November 2025. This figure represents an increase from the 2021 Census count of 11,240 people, a rise of 365 individuals (3.2%). The change is inferred from ABS estimates: the population was 11,322 in June 2024 and there were 111 validated new addresses since the Census date. This results in a density ratio of 2,354 persons per square kilometer, placing it in the upper quartile nationally according to AreaSearch assessments. Overseas migration contributed approximately 69.4% of overall population growth recently.
AreaSearch uses ABS/Geoscience Australia projections for each SA2 area, released in 2024 with a base year of 2022. For areas not covered by this data, AreaSearch employs VIC State Government's Regional/LGA projections from 2023, adjusted using weighted aggregation methods to SA2 levels. Growth rates by age group are applied across all areas for years 2032 to 2041. By 2041, the area is forecasted to grow by 3,038 persons based on latest annual ERP population numbers, reflecting a total increase of 23.7% over 17 years.
Frequently Asked Questions - Population
Development
Residential development activity is lower than average in Mill Park - South according to AreaSearch's national comparison of local real estate markets
Mill Park - South has recorded approximately 29 residential properties granted approval per year over the past five financial years, totalling 146 homes. As of FY-2025/26, 5 approvals have been recorded. The population decline in recent years suggests that new supply has likely kept pace with demand, offering good choice to buyers. New homes are being built at an average construction cost value of $338,000.
This financial year, $1.0 million in commercial approvals have been registered, indicating the area's residential nature. Compared to Greater Melbourne, Mill Park - South records significantly lower building activity, 82.0% below the regional average per person. This constrained new construction typically reinforces demand and pricing for existing dwellings, although development activity has increased recently. This is also lower than nationally, reflecting market maturity and possible development constraints. New development consists of 15.0% detached houses and 85.0% medium and high-density housing, representing a shift from the area's current housing mix of 90.0% houses. This trend may indicate decreasing availability of developable sites and changing lifestyles requiring more diverse, affordable housing options. With approximately 993 people per approval, Mill Park - South shows a mature, established area.
According to AreaSearch quarterly estimates, the population is forecasted to gain 2,755 residents by 2041. If current development rates continue, housing supply may not keep pace with population growth, potentially increasing competition among buyers and supporting stronger price growth.
Frequently Asked Questions - Development
Infrastructure
Mill Park - South has strong levels of nearby infrastructure activity, ranking in the top 40% nationally
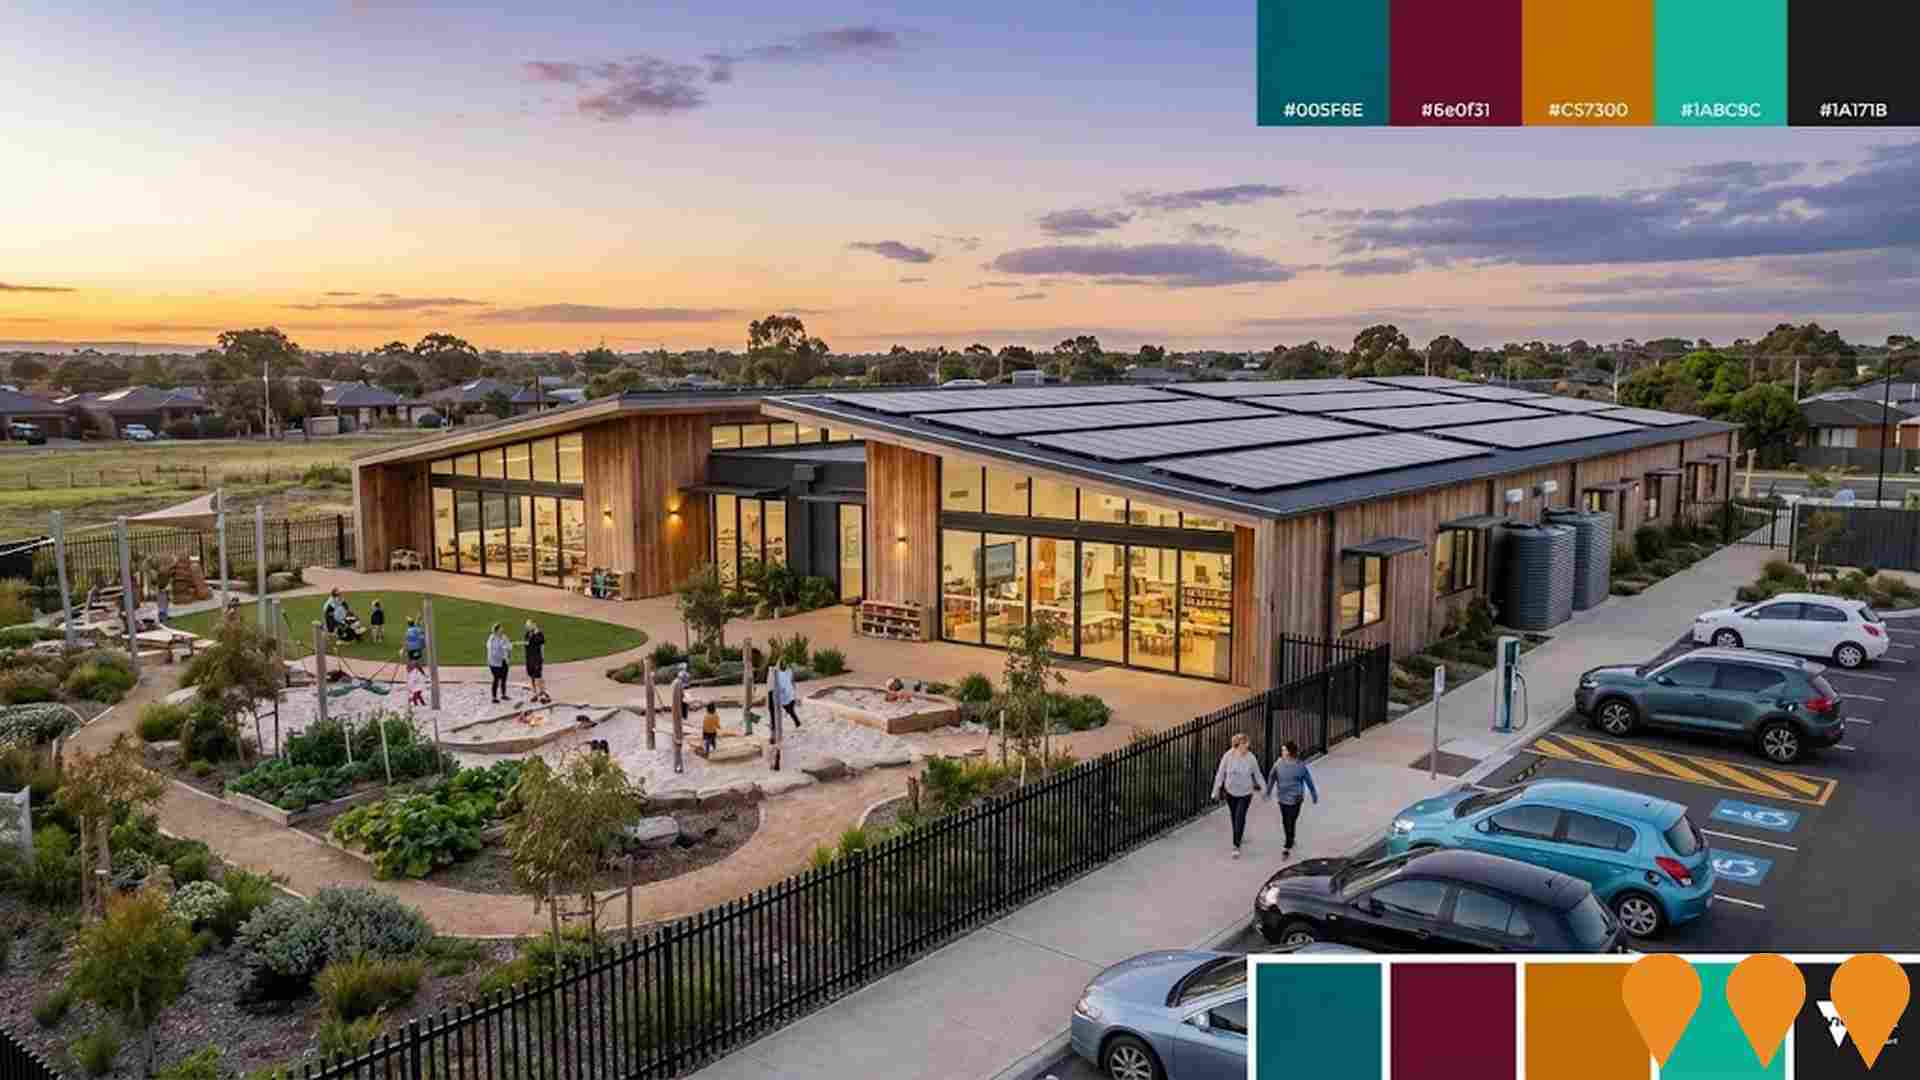
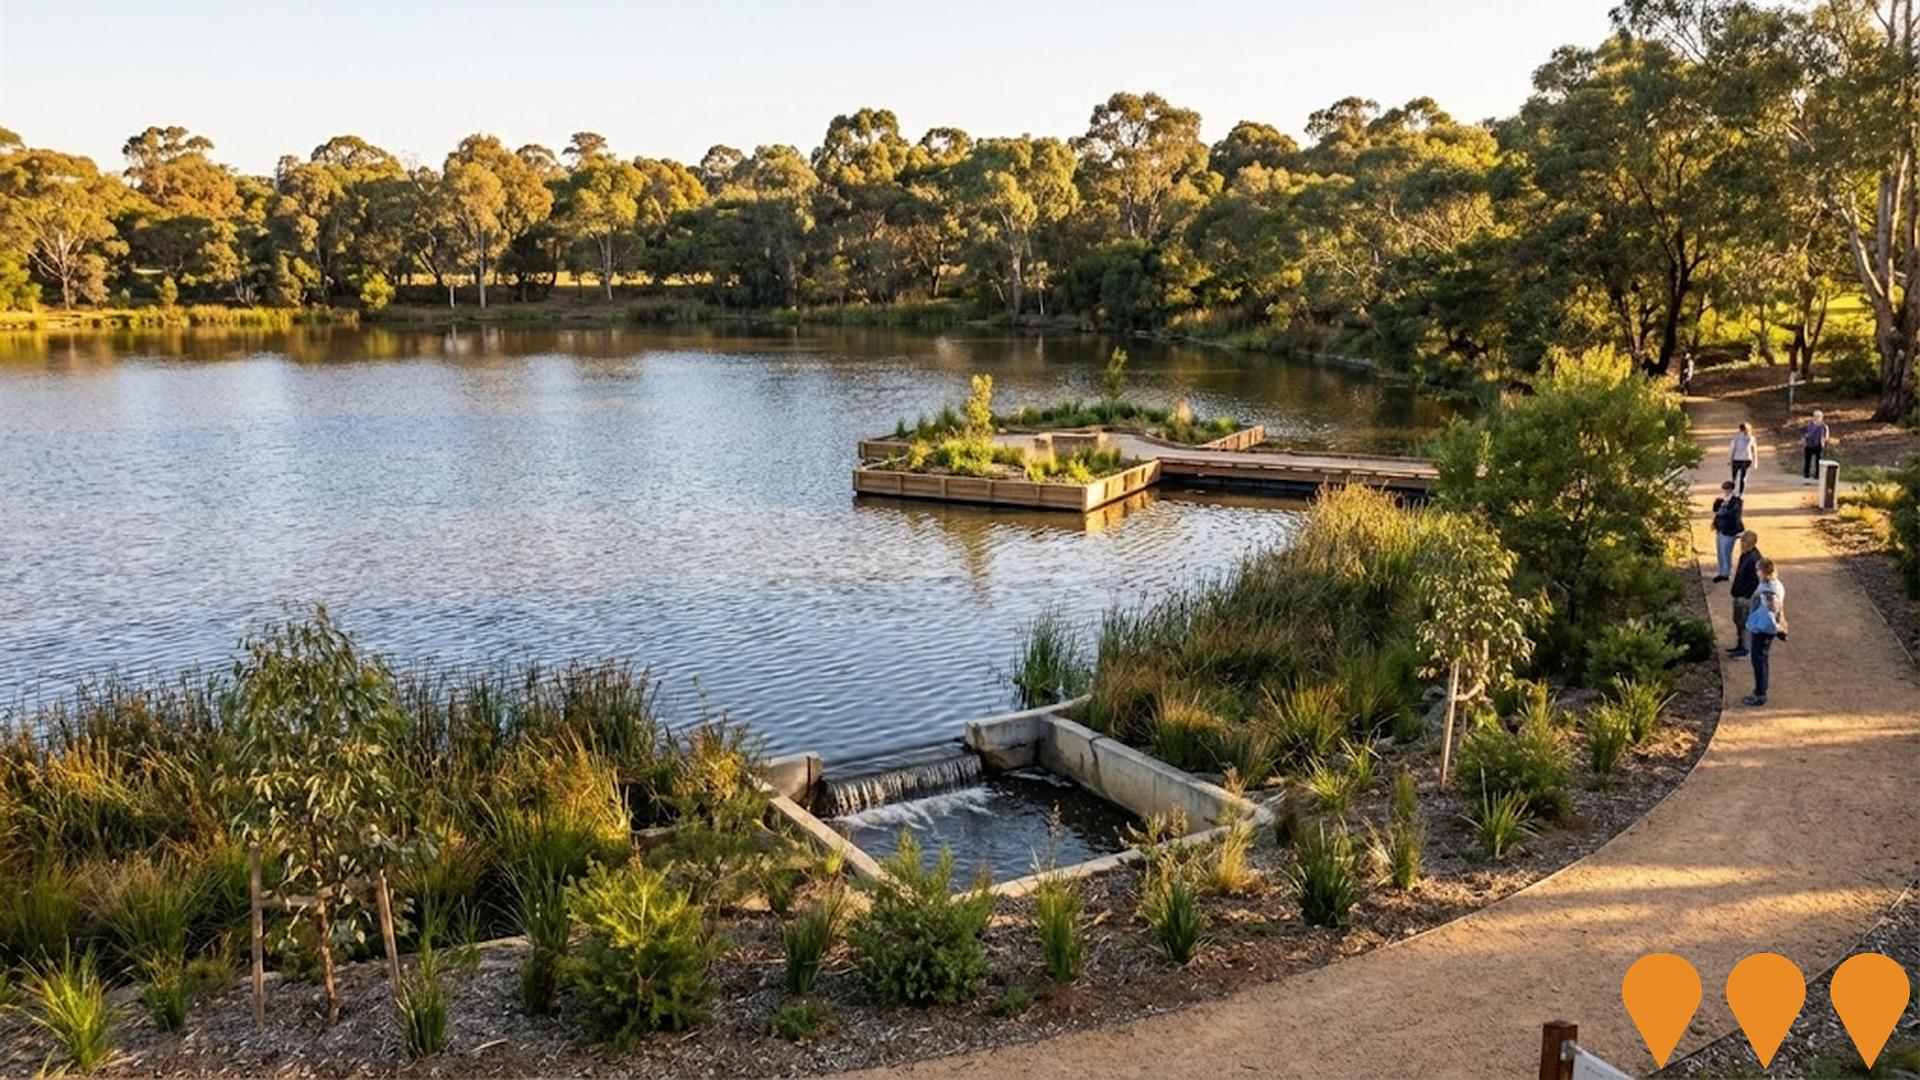
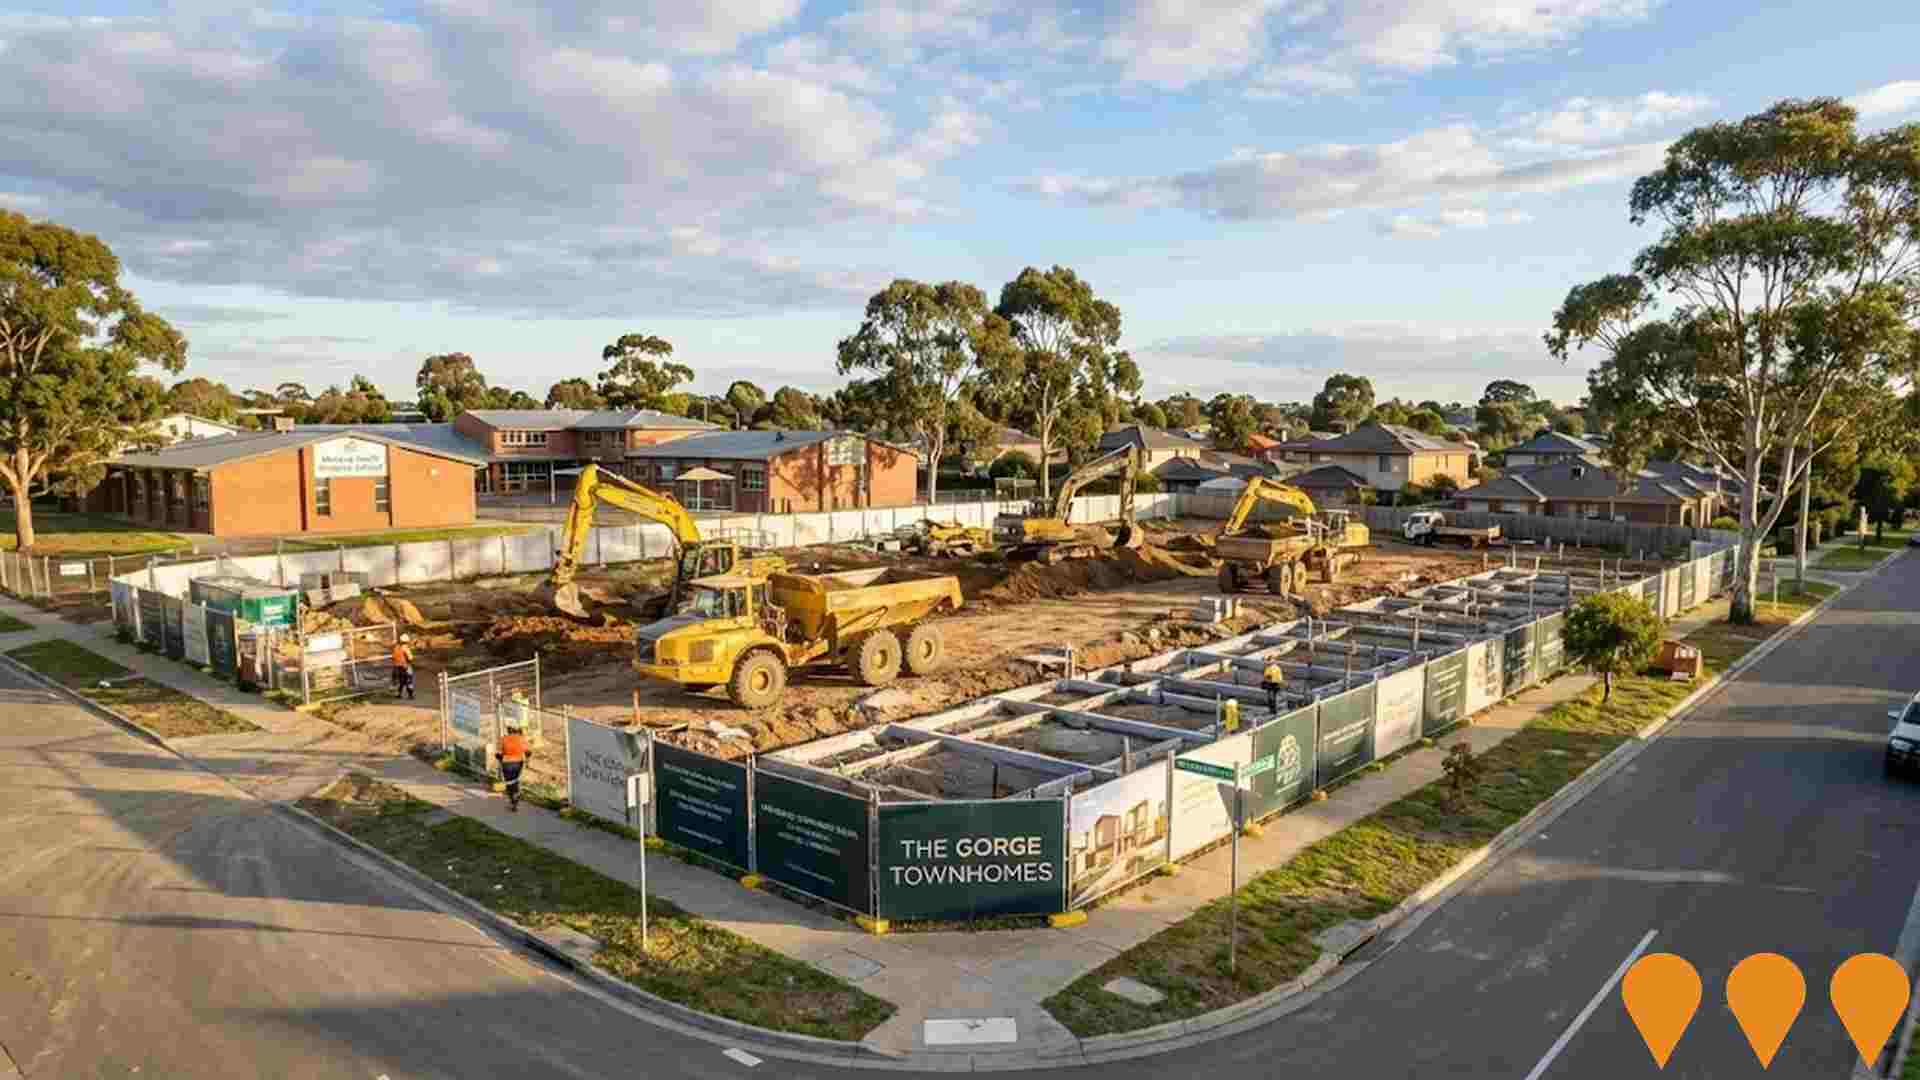
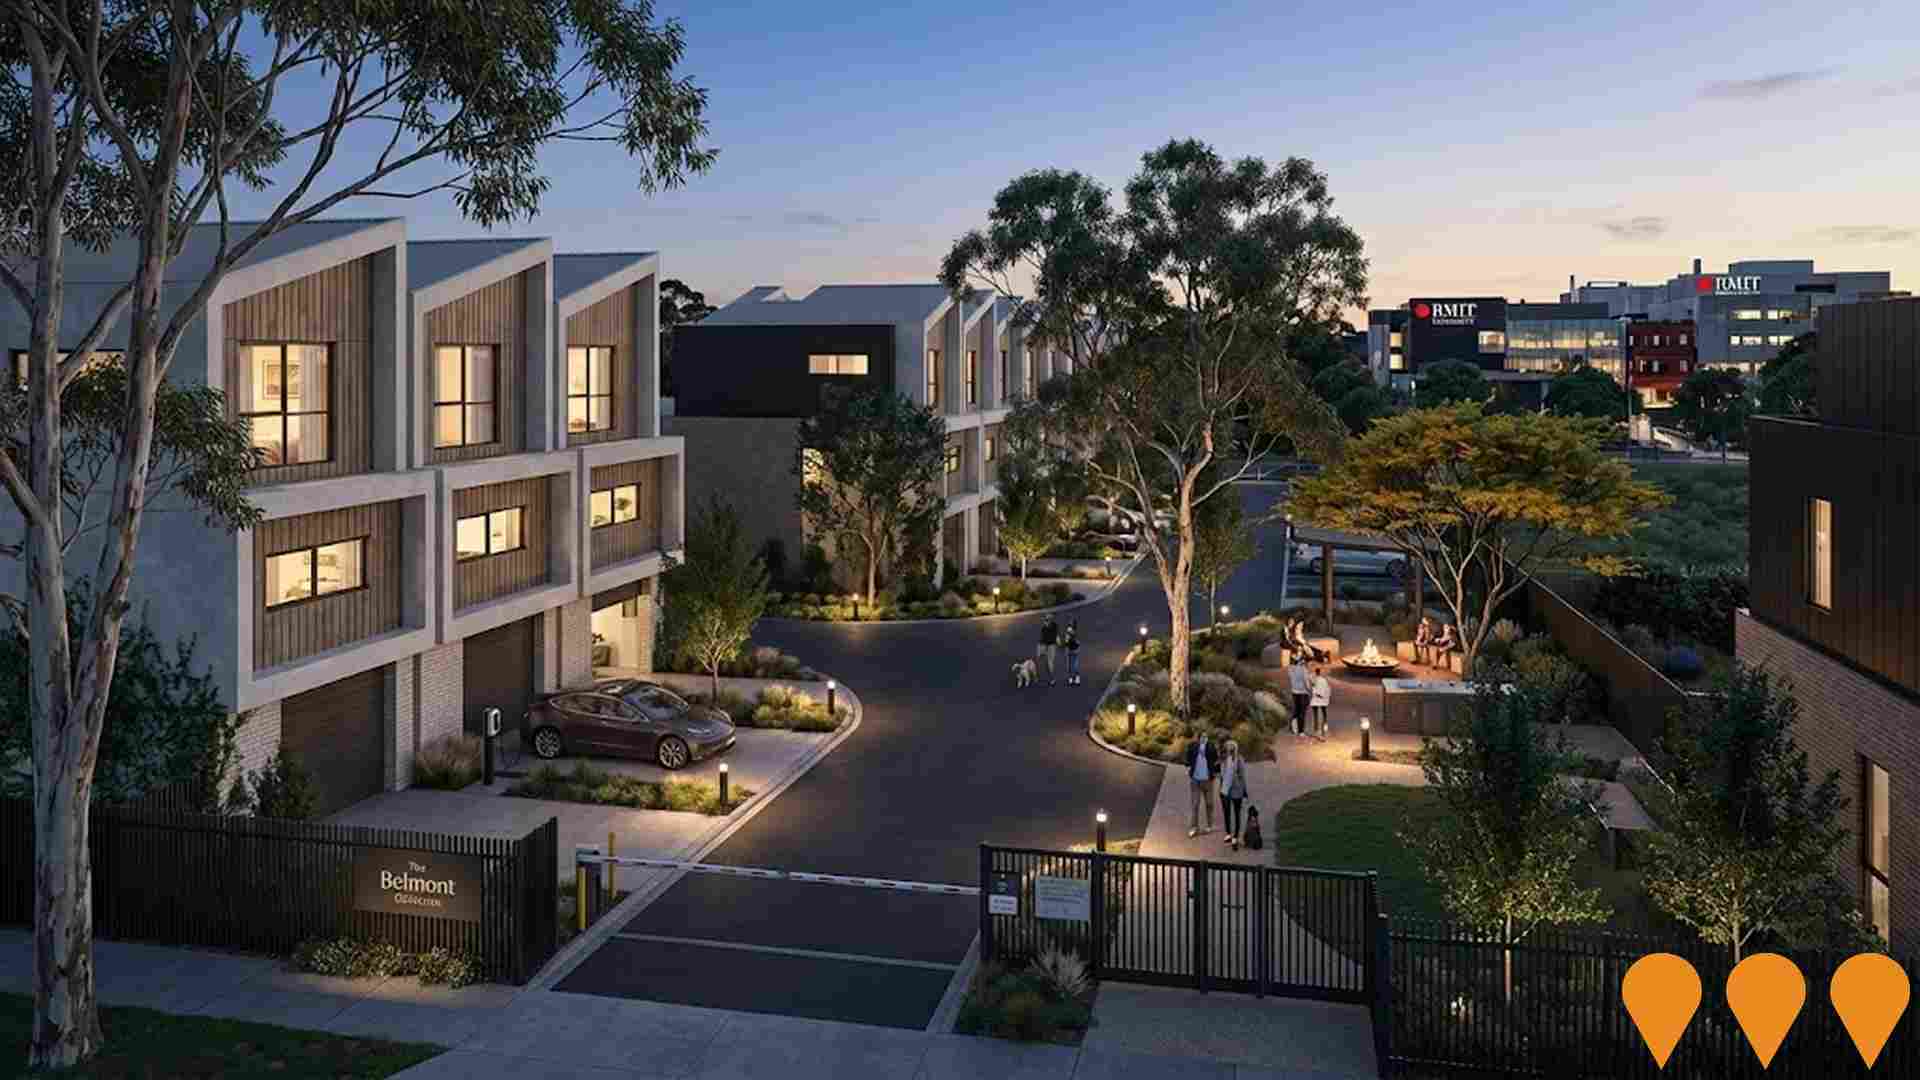
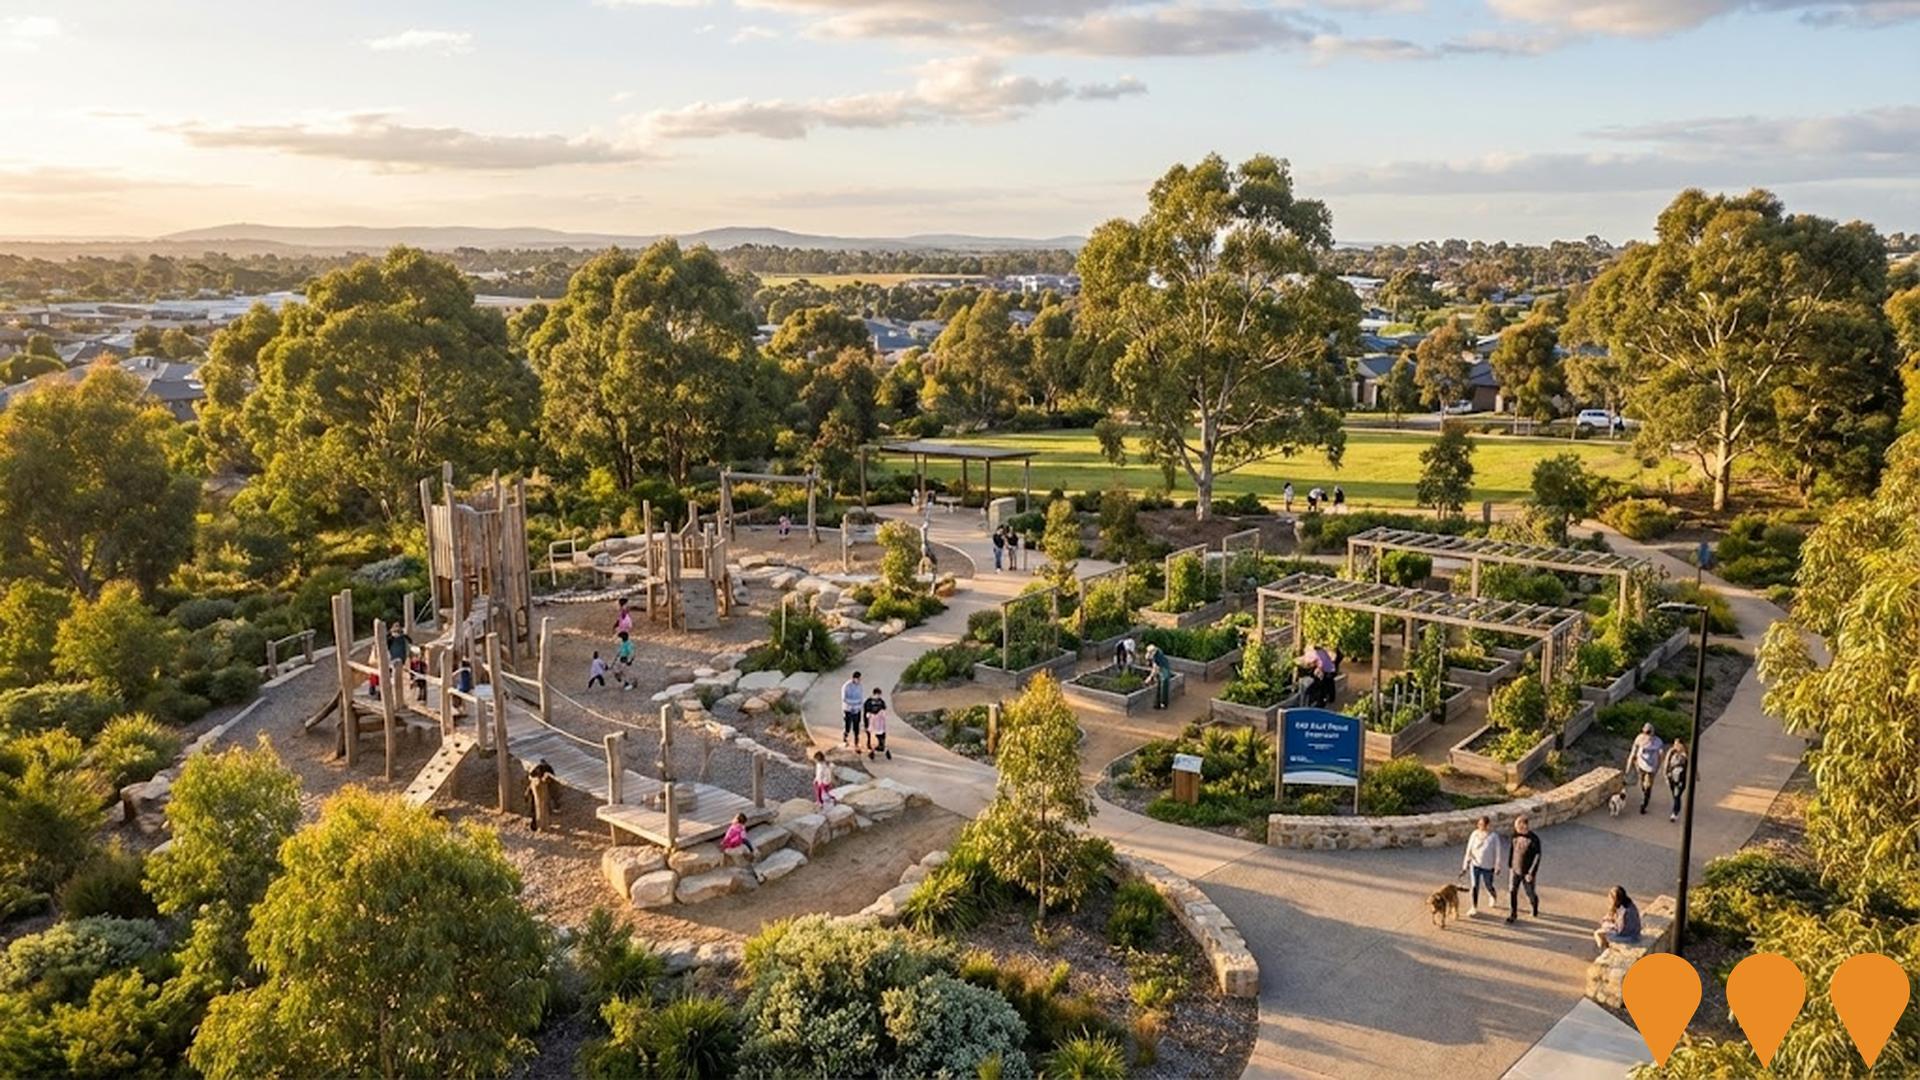
Changes to local infrastructure significantly influence an area's performance. AreaSearch identified ten projects likely impacting the area. Notable ones are Mill Park Place Framework, Tram Route 86 Extension, The Stables Kindergarten Redevelopment, and Peter Hopper Lake Revitalisation. Below is a list detailing those most relevant.
Professional plan users can use the search below to filter and access additional projects.
INFRASTRUCTURE SEARCH
 Denotes AI-based impression for illustrative purposes only, not to be taken as definitive under any circumstances. Please follow links and conduct other investigations from the project's source for actual imagery. Developers and project owners wishing us to use original imagery please Contact Us and we will do so.
Frequently Asked Questions - Infrastructure
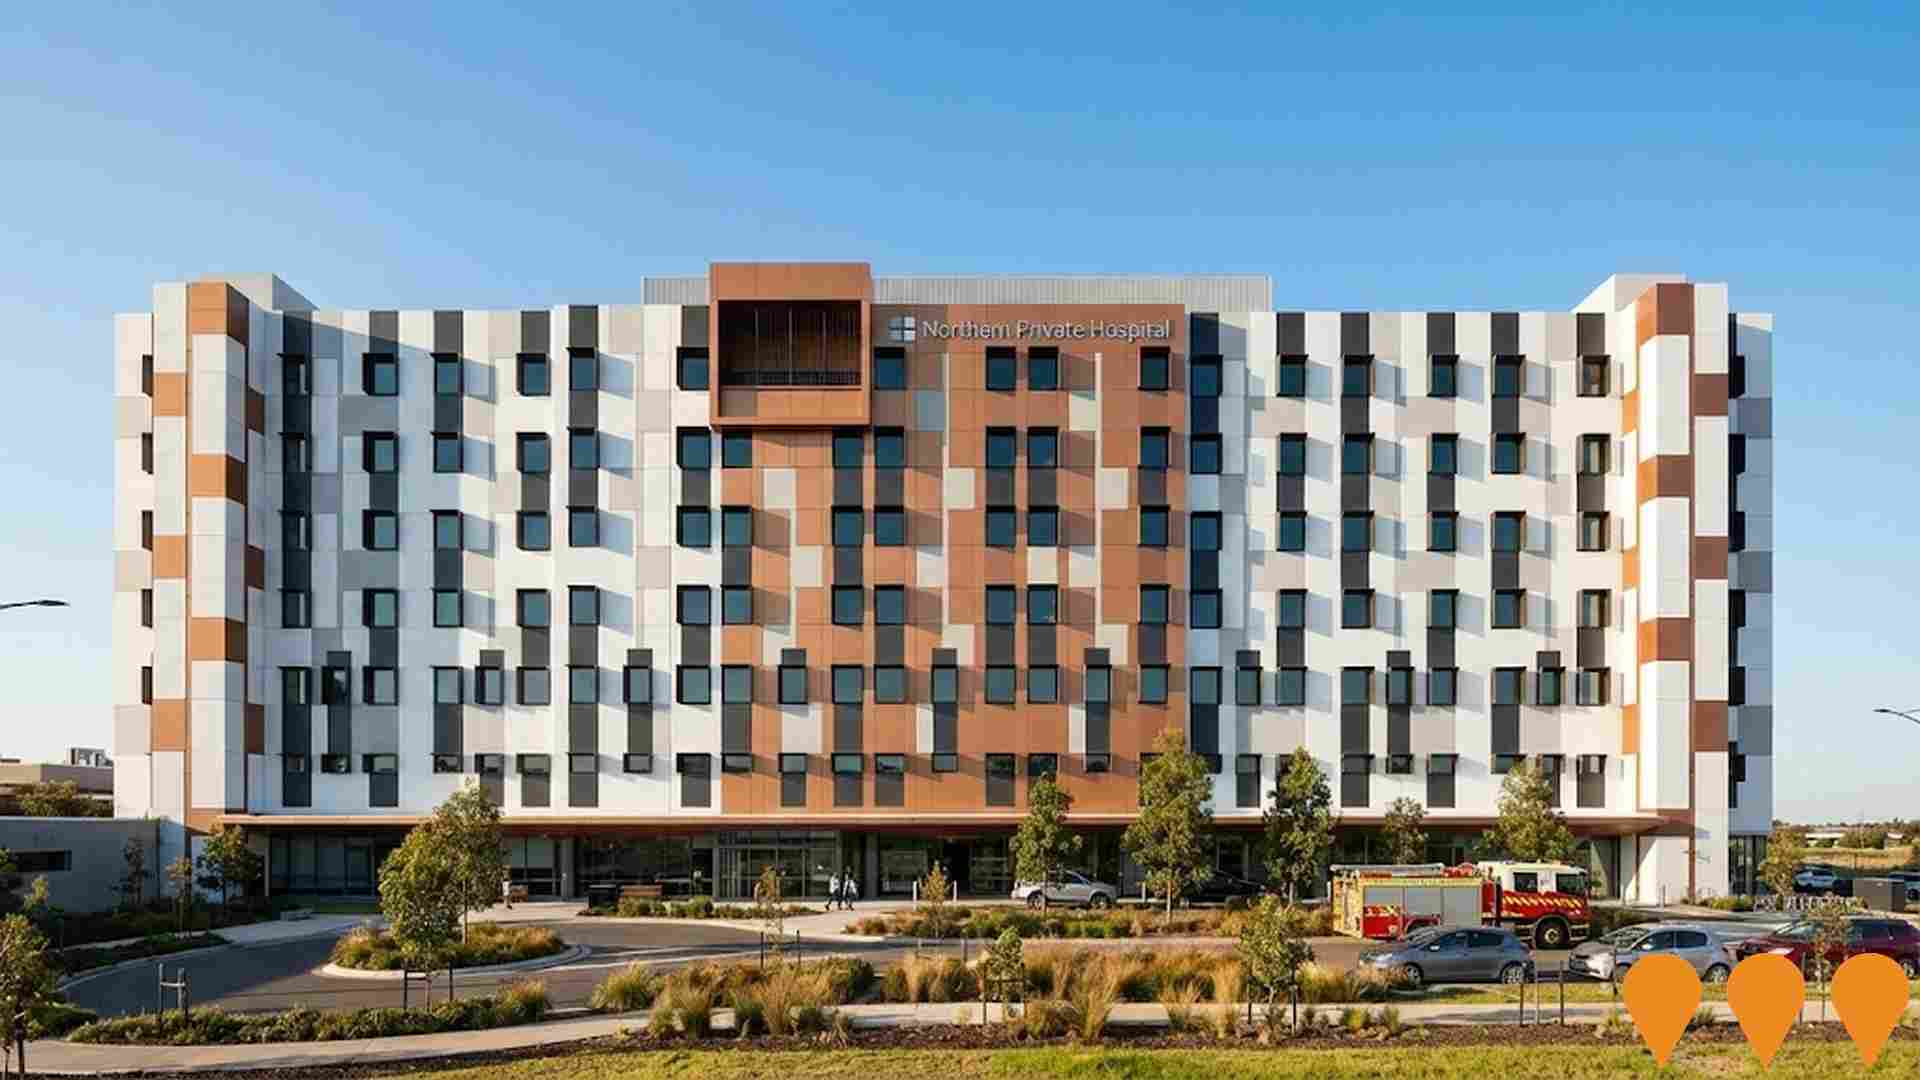
New Epping Health Hub
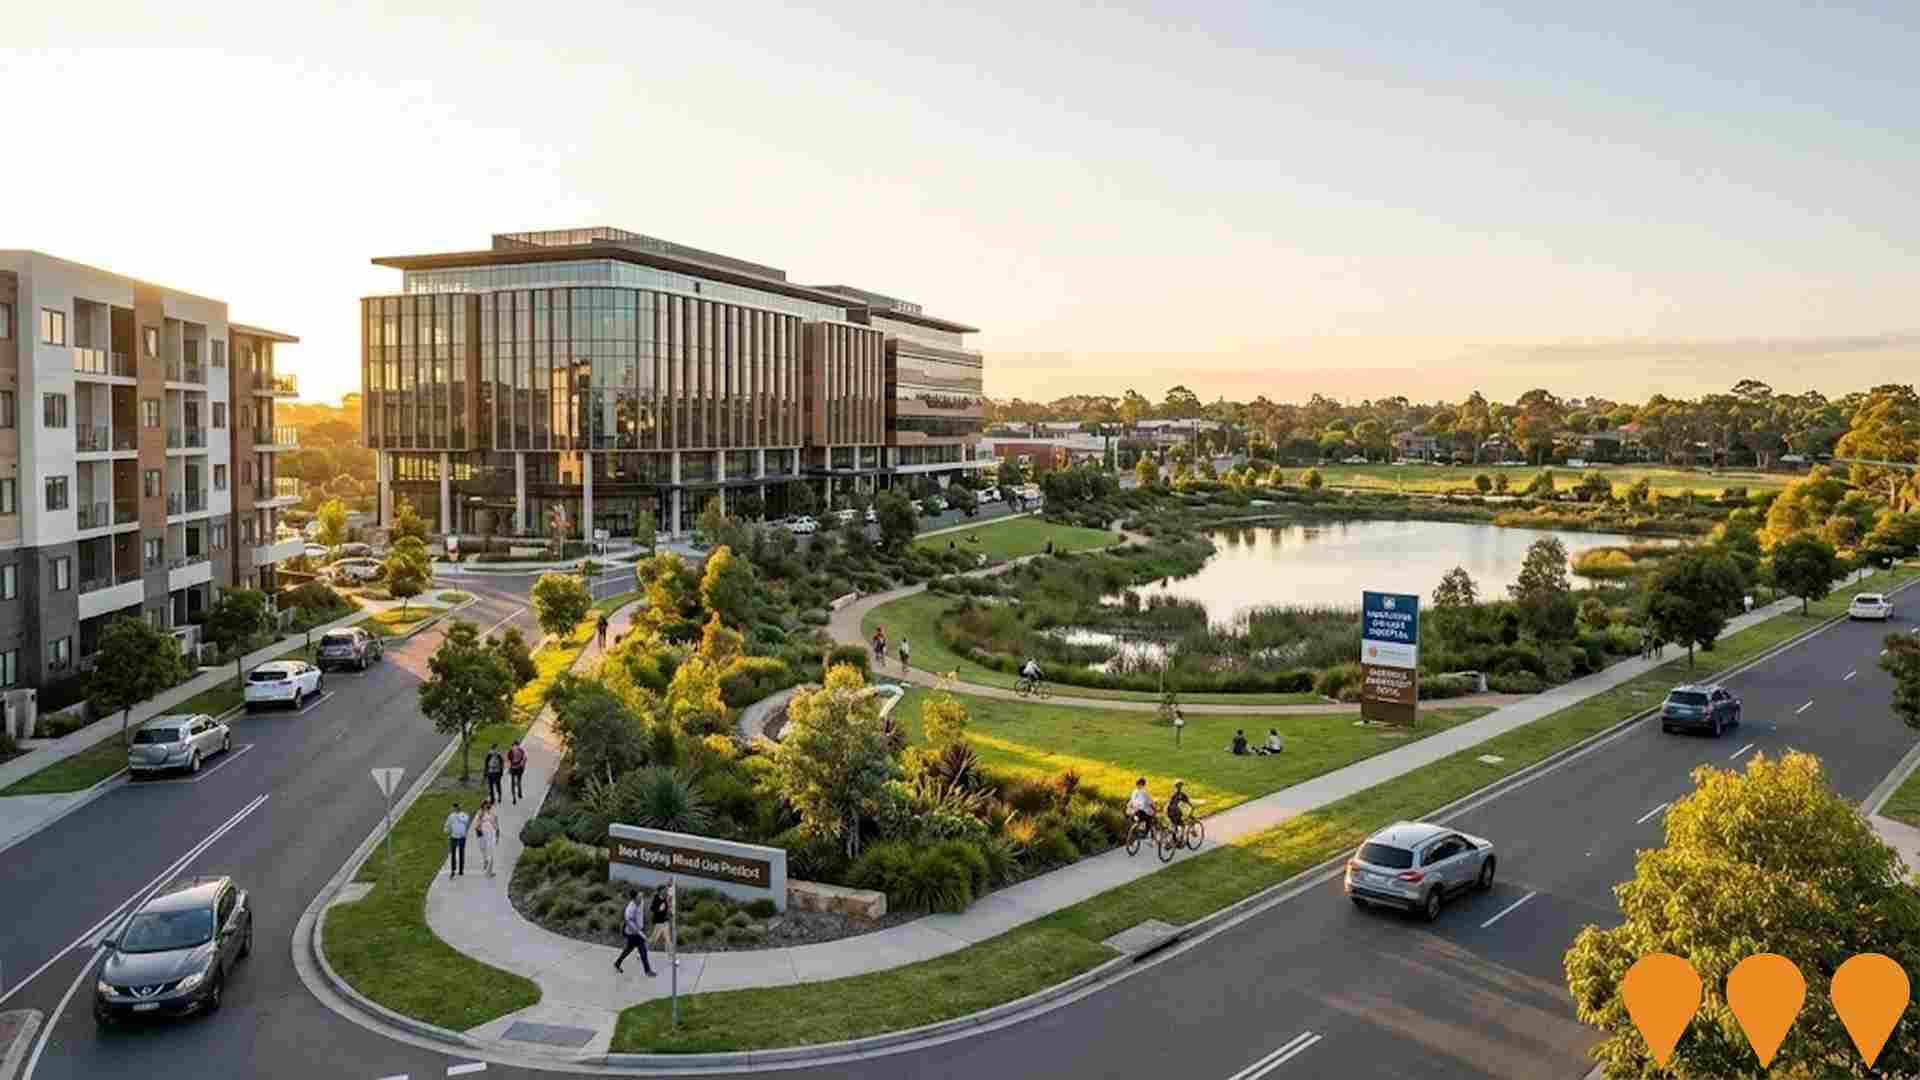
The New Epping Health Hub is a $1 billion integrated health, healing and innovation precinct in Melbourne's north. Anchored by the new Northern Private Hospital (operated by Ramsay Health Care), it includes specialist medical consulting suites, allied health services, ambulatory care, mental health facilities, medical education and research spaces, plus community health and wellness programs. The precinct is being delivered in stages with the private hospital now under construction.
New Epping
Riverlee is delivering a 51-hectare masterplanned mixed-use precinct on the former Epping quarry site. Features include Northern Private Hospital (Stage 1 opened February 2024), up to 110,000 sqm of commercial and health-related floorspace, an 11-hectare central green spine with lake and wetlands, a 100-key Punthill Apartment Hotel (under construction), and approximately 2,500 new homes including 151 affordable dwellings delivered in partnership with Haven; Home, Safe. Full build-out is expected over 15+ years.
M80 Ring Road Completion
Final stage completing the M80 Ring Road upgrade between Plenty Road (Greensborough) and the North East Link tunnels (Watsonia). Delivers 14 km of new lanes, express lanes to North East Link, new interchanges at Plenty Road and Grimshaw Street, landscaped bridges at Elder Street and Watsonia Road, over 10 km of walking and cycling paths, and smart freeway technology. Expected to remove up to 19,000 vehicles per day from local roads.

Epping Central Renewal Site
Large-scale urban renewal of the former Epping Quarry and landfill site into a vibrant mixed-use precinct. Delivering approximately 2,000 new homes (including affordable housing), a new health and education hub, retail and commercial spaces, significant public open space and community facilities.

Westfield Plenty Valley Redevelopment
Major shopping centre redevelopment by Scentre Group and Dexus Wholesale Property Fund, completed in 2018 with an $80 million investment adding a new al fresco leisure and dining precinct with around 20 specialty businesses and enhanced entertainment options including a Village Cinemas complex with Gold Class, Vpremium, Vmax, and Vjunior. The centre features approximately 191 stores anchored by Coles, Woolworths, ALDI, Target, and Kmart, two fresh food precincts, a 600-seat food court, and 2,650 car spaces. The redevelopment increased the centre by over 10,300 square metres to around 62,500 sqm. It serves a trade area population of nearly 312,000 residents and is located adjacent to South Morang railway station.

Melbourne Wholesale Markets
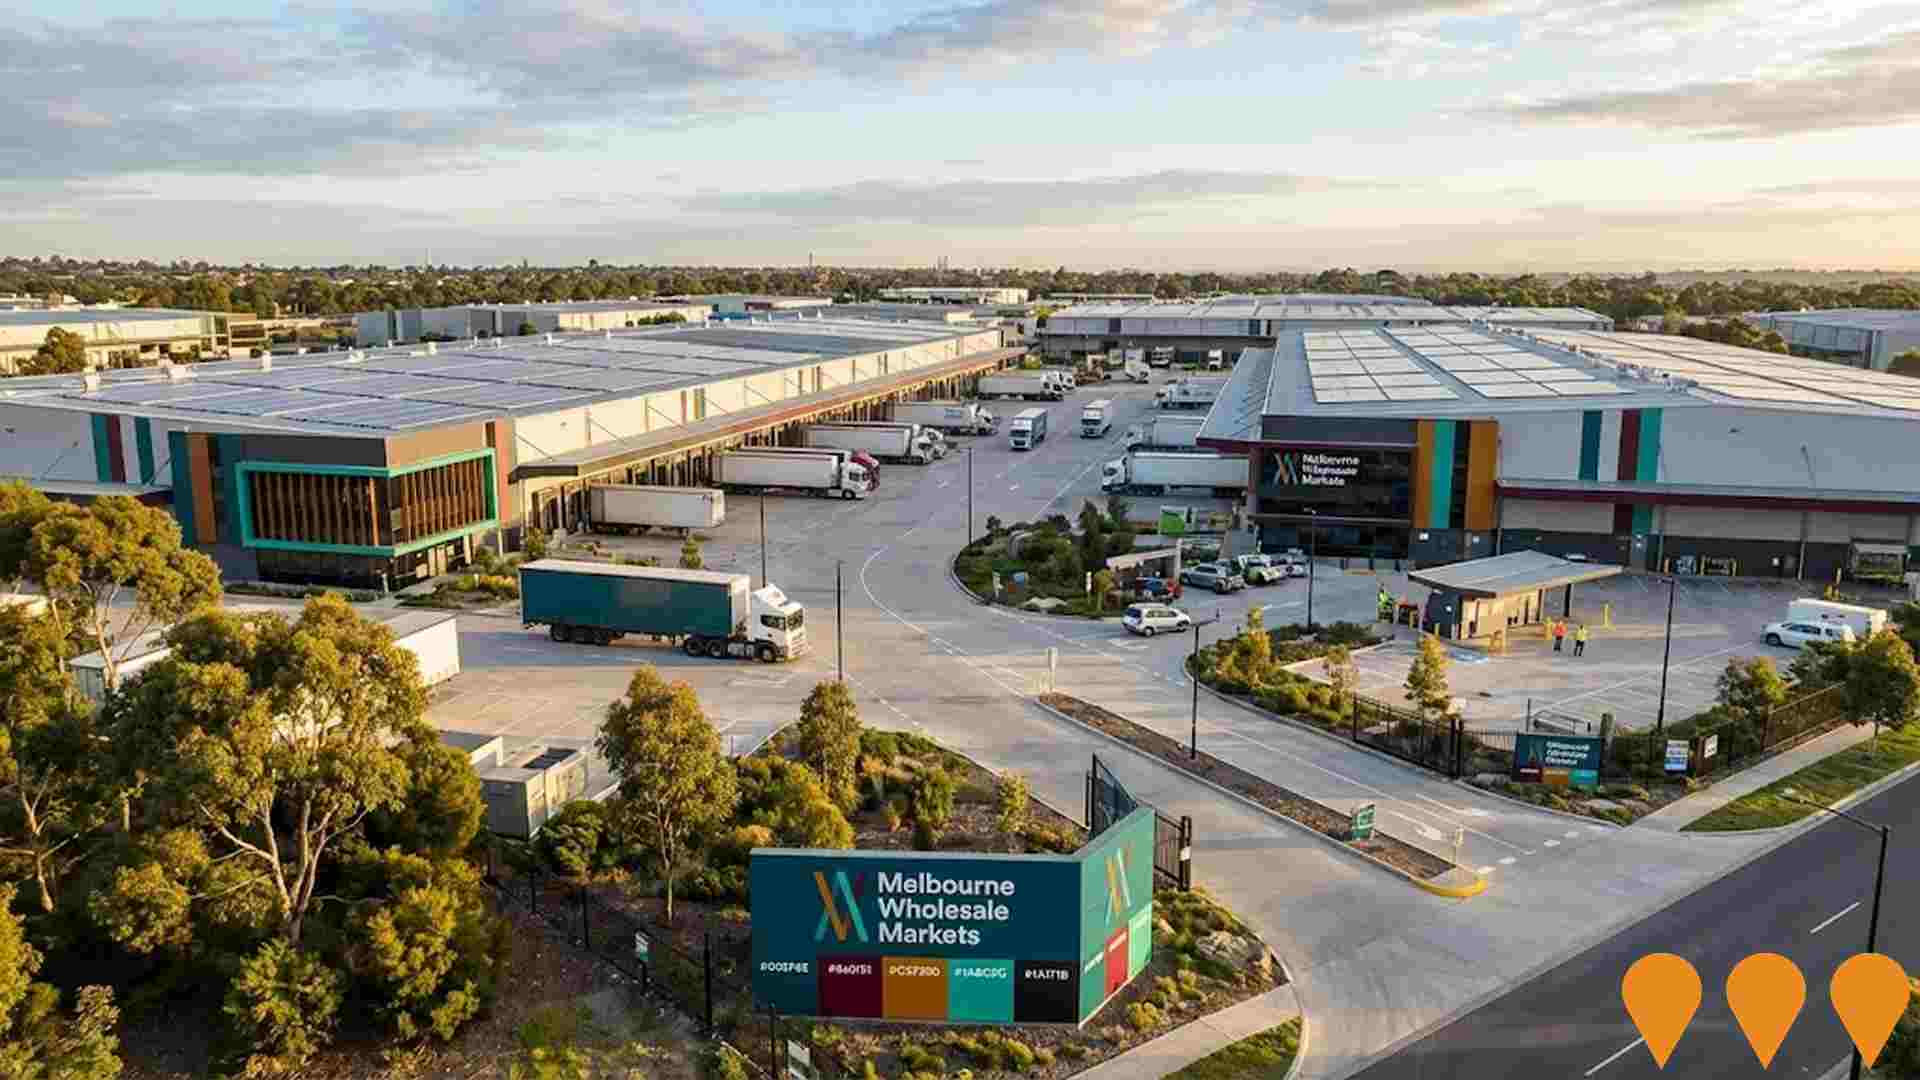
State-of-the-art wholesale fresh produce and flower market relocated from Footscray to Epping in 2015. Spans 67 hectares with 95,000 square metres of warehousing space, serving as Victoria's primary distribution hub for fresh produce. Features advanced logistics, sustainability initiatives including solar power, rainwater harvesting, and a high recycling rate. Plans to expand warehousing to 130,000 square metres. Recent developments include rent disputes and potential expansions.
Tram Route 86 Extension
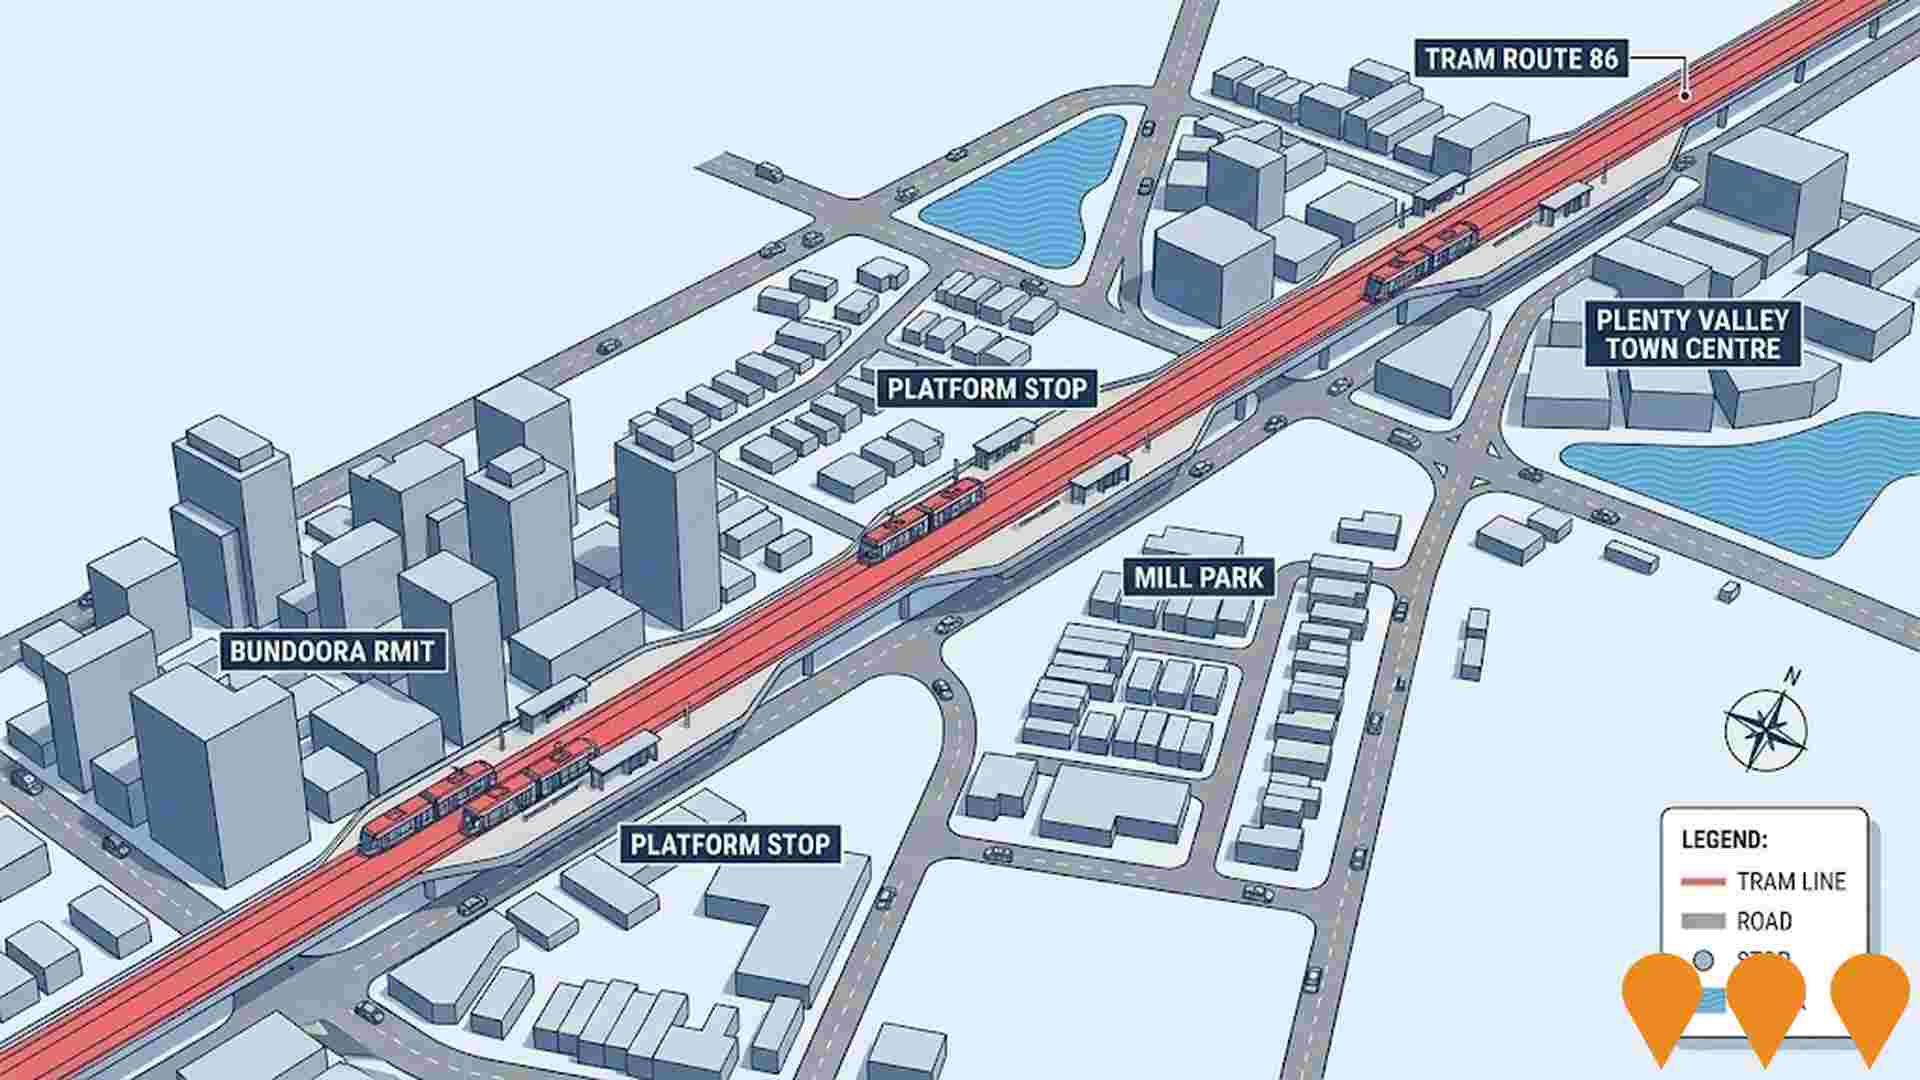
Proposed extension of Melbourne's Tram Route 86 from Bundoora RMIT to South Morang via Mill Park and Plenty Valley Town Centre, as part of long-term plans to improve public transport connectivity in northern suburbs. According to Melbourne's Tram Plan released in 2023, future extensions will be considered beyond 2032 in response to land use changes. Local councils continue to advocate for feasibility studies and funding.
Mill Park Basketball Stadium Upgrade
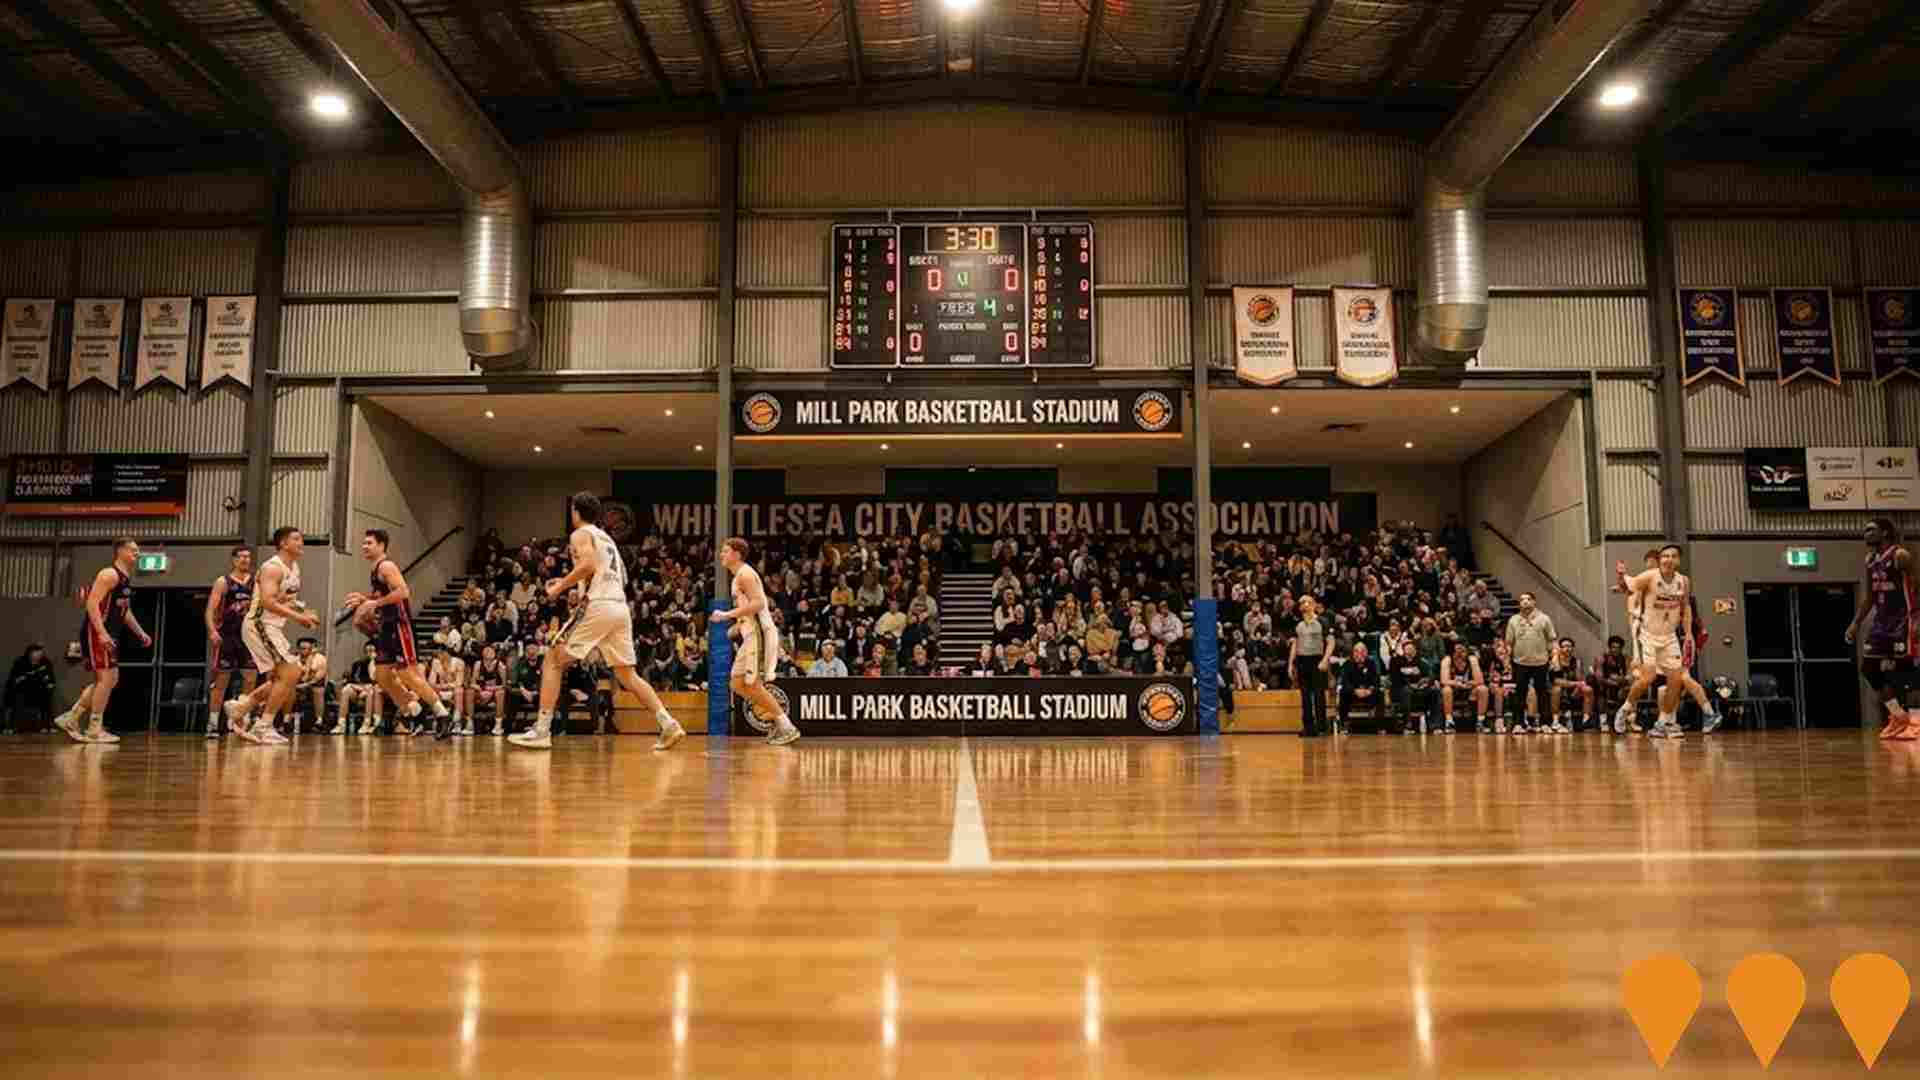
The $3 million redevelopment of Mill Park Basketball Stadium has been completed, officially opening in October 2022. The upgrade transformed the facility with female-friendly change rooms, accessible public toilets, shower and change facilities, an updated kitchen and canteen, front reception area improvements, and HVAC system upgrades. The stadium now features four courts accommodating over 600 spectators and serves as home to the Whittlesea City Basketball Association with more than 4,400 members. Managed by Sports Stadiums Victoria, the facility provides inclusive participation opportunities and modern amenities for basketball, netball, and various community activities.
Employment
Mill Park - South shows employment indicators that trail behind approximately 70% of regions assessed across Australia
Mill Park - South has a skilled workforce with essential services sectors well represented. Its unemployment rate is 4.8%.
Employment stability has been relative over the past year. As of September 2025, 5982 residents are employed while the unemployment rate is 0.2% higher than Greater Melbourne's rate of 4.7%. Workforce participation is somewhat lower at 60.5%, compared to Greater Melbourne's 64.1%.
Key industries of employment among residents are health care & social assistance, construction, and retail trade. Professional & technical services have limited presence with 6.6% employment compared to the regional average of 10.1%. The area appears to offer limited local employment opportunities. Over a 12-month period ending in September 2025, employment increased by 0.3% while labour force decreased by 0.0%, causing the unemployment rate to fall by 0.3 percentage points. In comparison, Greater Melbourne recorded employment growth of 3.0%, labour force growth of 3.3%, and a rise in unemployment of 0.3 percentage points. State-level data from 25-Nov-25 shows Victoria's employment grew by 1.13% year-on-year, adding 41950 jobs, with the state unemployment rate at 4.7%. National forecasts from May-25 suggest national employment will expand by 6.6% over five years and 13.7% over ten years. Applying these projections to Mill Park - South's employment mix indicates local employment should increase by 6.4% over five years and 13.4% over ten years, though this is a simple extrapolation for illustrative purposes only and does not account for localised population projections.
Frequently Asked Questions - Employment
Income
Income levels sit below national averages according to AreaSearch assessment
Mill Park - South SA2 had a median taxpayer income of $49,176 and an average income of $57,834 in financial year 2022. These figures are lower than the national averages of $54,892 and $73,761 for Greater Melbourne respectively. By September 2025, estimated median and average incomes would be approximately $55,156 and $64,867 respectively, based on a 12.16% growth in the Wage Price Index since financial year 2022. According to 2021 Census figures, household income ranks at the 44th percentile ($1,647 weekly) and personal income at the 26th percentile. The predominant income cohort spans 35.0% of locals (4,061 people), falling within the $1,500 - 2,999 category, which is consistent with broader trends across the surrounding region showing 32.8% in the same category. After housing costs, 85.9% of income remains for other expenses. The area's SEIFA income ranking places it in the 4th decile.
Frequently Asked Questions - Income
Housing
Mill Park - South is characterized by a predominantly suburban housing profile, with above-average rates of outright home ownership
Mill Park - South's dwelling structures, as per the latest Census, consisted of 89.8% houses and 10.2% other dwellings (semi-detached, apartments, 'other' dwellings). This compares to Melbourne metro's 87.2% houses and 12.8% other dwellings. Home ownership in Mill Park - South stood at 40.0%, with mortgaged dwellings at 35.8% and rented ones at 24.2%. The median monthly mortgage repayment was $1,733, lower than Melbourne metro's average of $1,900. The median weekly rent figure in Mill Park - South was $369, compared to Melbourne metro's $371. Nationally, Mill Park - South had lower mortgage repayments ($1,733 vs $1,863) and rents ($369 vs $375).
Frequently Asked Questions - Housing
Household Composition
Mill Park - South features high concentrations of family households, with a lower-than-average median household size
Family households account for 78.0% of all households, including 37.9% couples with children, 25.2% couples without children, and 13.4% single parent families. Non-family households constitute the remaining 22.0%, with lone person households at 19.1% and group households comprising 2.7%. The median household size is 2.7 people, which is smaller than the Greater Melbourne average of 2.9.
Frequently Asked Questions - Households
Local Schools & Education
Educational attainment in Mill Park - South aligns closely with national averages, showing typical qualification patterns and performance metrics
The area's university qualification rate is 26.3%, significantly lower than Greater Melbourne's average of 37.0%. Bachelor degrees are the most common at 17.7%, followed by postgraduate qualifications (6.2%) and graduate diplomas (2.4%). Vocational credentials are prevalent, with 31.5% of residents aged 15+ holding them, including advanced diplomas (11.3%) and certificates (20.2%). Educational participation is high, with 26.6% currently enrolled in formal education: 8.5% in primary, 6.6% in secondary, and 6.0% in tertiary education.
Educational participation is notably high, with 26.6% of residents currently enrolled in formal education. This includes 8.5% in primary education, 6.6% in secondary education, and 6.0% pursuing tertiary education.
Frequently Asked Questions - Education
Schools Detail
Nearby Services & Amenities
Transport
Transport servicing is high compared to other areas nationally based on assessment of service frequency, route connectivity and accessibility
Mill Park - South has 45 active public transport stops, all of which are bus stops. These stops are served by 8 different routes that together facilitate 6,308 weekly passenger trips. The area's transport accessibility is rated as good, with residents on average located 204 meters from the nearest stop.
Across all routes, service frequency averages 901 trips per day, equating to approximately 140 weekly trips per individual stop.
Frequently Asked Questions - Transport
Transport Stops Detail
Health
Mill Park - South's residents are healthier than average in comparison to broader Australia with prevalence of common health conditions quite low across both younger and older age cohorts
Health data for Mill Park - South shows a relatively low prevalence of common health conditions across both younger and older age groups. Approximately 49% (~5,674 people) have private health cover, which is lower than the national average of 55.3%.
The most prevalent medical conditions are arthritis (7.7%) and asthma (7.0%). Around 70.9% of residents report being completely clear of medical ailments, compared to 74.0% in Greater Melbourne. In Mill Park - South, 19.9% (~2,305 people) are aged 65 and over, higher than the 13.2% in Greater Melbourne. Health outcomes among seniors are above average, broadly aligning with the general population's health profile.
Frequently Asked Questions - Health
Cultural Diversity
Mill Park - South is among the most culturally diverse areas in the country based on AreaSearch assessment of a range of language and cultural background related metrics
Mill Park-South has a high cultural diversity, with 38.5% of its population born overseas and 43.3% speaking a language other than English at home. Christianity is the dominant religion in Mill Park-South, comprising 56.0% of its population. Islam is overrepresented compared to Greater Melbourne, making up 6.2% of the population versus 9.1%.
The top three ancestry groups are Australian (15.5%), Other (15.1%), and English (14.7%). Notably, Macedonian (4.5%) and Greek (6.6%) groups are overrepresented compared to regional averages of 4.6% and 4.1%, respectively. Italian group is also notably represented at 10.7%.
Frequently Asked Questions - Diversity
Age
Mill Park - South's population aligns closely with national norms in age terms
The median age in Mill Park - South is 39 years, slightly higher than Greater Melbourne's average of 37 years, which is close to the national average of 38 years. Compared to Greater Melbourne, Mill Park - South has a notably higher proportion of people aged 65-74 (12.4% locally) and a lower proportion of those aged 15-24 (11.1%). According to post-2021 Census data, the percentage of people aged 65-74 increased from 10.8% to 12.4%, while those aged 75-84 rose from 4.5% to 5.9%. Conversely, the proportion of people aged 55-64 decreased from 15.5% to 14.0%, and those aged 45-54 dropped from 12.1% to 10.8%. Population forecasts for 2041 indicate significant demographic changes in Mill Park - South, with the 75-84 age group expected to grow by 108% (adding 743 people), reaching 1,433 from 689. This growth is largely driven by residents aged 65 and older, who will represent 56% of anticipated population growth. The 0-4 age group will experience more modest growth, increasing by 5% with an addition of 32 residents.
