Chart Color Schemes
This analysis uses Suburbs and Localities (SAL) boundaries, which can materially differ from Statistical Areas (SA2) even when sharing the same name.
SAL boundaries are defined by Australia Post and the Australian Bureau of Statistics to represent commonly-known suburb names used in postal addresses.
Statistical Areas (SA2) are designed for census data collection and may combine multiple suburbs or use different geographic boundaries. For comprehensive analysis, consider reviewing both boundary types if available.
est. as @ -- *
2021 Census | -- people







The median house price in Millfield is $885k. House values have moved 4.8% a year compounded over five years.
Curious about local property values? Filter the chart to assess the volume and appreciation (including resales) trends and regional comparisons, or scroll to the map below view this information at an individual property level.
Find a Recent Sale

Sales Detail
Millfield has an estimated 1,522 residents, up from 1,282 at the 2021 Census — a change of 240 people, or 18.7%. Growth has averaged 3.7% a year over five years, faster than 90% of areas nationally. Interstate and internal migration accounts for 71.0% of that increase. Density is about 47 people per square kilometre. Population is estimated from ABS Estimated Resident Population releases and GNAF address data, re-based from the 2021 Census and updated annually.
Detail
Based on ABS population updates for the broader area and new addresses validated by AreaSearch, the estimated population of Millfield as of Feb 2026 is around 1,522. This reflects an increase of 240 people since the 2021 Census, which reported a population of 1,282 people. The change is inferred from the resident population of 1,399 estimated by AreaSearch following examination of the latest ERP data release by the ABS in June 2024 and an additional 8 validated new addresses since the Census date. This level of population equates to a density ratio of 47 persons per square kilometer.
Millfield's 18.7% growth since the 2021 census exceeded the Rest of NSW (5.9%) and the state, marking it as a growth leader in the region. Population growth for the area was primarily driven by interstate migration contributing approximately 71.0% of overall population gains during recent periods, although all drivers including natural growth and overseas migration were positive factors. AreaSearch is adopting ABS/Geoscience Australia projections for each SA2 area released in 2024 with a base year of 2022. For any SA2 areas not covered by this data, AreaSearch utilises the NSW State Government's SA2 level projections released in 2022 with a base year of 2021. Growth rates by age group from these aggregations are also applied to all areas for years 2032 to 2041. Considering projected demographic shifts, an above median population growth of national non-metropolitan areas is projected for the suburb of Millfield, with an expected expansion of 362 persons to 2041 based on aggregated SA2-level projections, reflecting a total increase of 15.7% over the 17 years.
Frequently Asked Questions - Population
50 new dwellings have been approved in Millfield over the past five years, an average of 10 a year. That places the area in the 66th percentile for residential development activity nationally, about 7 approvals per 1,000 residents a year. Approvals are currently running at an annualised 10, broadly in line with that longer-run average. Figures come from ABS building approvals aggregated to this Suburb (SAL) boundary and are updated monthly as the ABS releases them.
Detail
AreaSearch analysis of ABS building approval numbers indicates Millfield received around 10 dwelling approvals annually over the past 5 financial years, totalling approximately 50 homes. As of FY26, 6 approvals have been recorded. On average, each dwelling adds about 2.9 new residents yearly between FY21 and FY25, suggesting strong demand supporting property values. New homes are being built at an average expected construction cost of $459,000, targeting the premium market with high-end developments. This financial year has seen $544,000 in commercial development approvals, reflecting Millfield's residential nature. Compared to Rest of NSW, Millfield has about three-quarters the rate of new dwelling approvals per person and ranks among the 85th percentile nationally.
Recent construction consists of 82.0% standalone homes and 18.0% medium-high density housing, maintaining the area's traditional low-density character appealing to families seeking space. This shift from existing patterns (currently 100.0% houses) suggests diminishing developable land availability and evolving lifestyle preferences. There are approximately 107 people per dwelling approval in Millfield, indicating an expanding market. AreaSearch projects a growth of 239 residents by 2041. Current development trends suggest new housing supply should meet demand, offering favourable conditions for buyers and potentially facilitating further population growth beyond current projections.
Frequently Asked Questions - Development
Development applications around Millfield
Loading development applications…
| Lodged | Address | Description | Type | Distance | Status |
|---|
SOURCE: Planning portals and council registers, compiled by AreaSearch. Distance & bearing measured from the suburb midpoint.
AreaSearch tracks 43 current infrastructure and development projects close to Millfield, worth an estimated $8.58 billion. 18 are already under construction and 22 are due for completion within three years. The pipeline spans residential development, transport & logistics and communities. Records are compiled from Infrastructure Australia, state agencies, council planning portals and public announcements, reviewed and updated daily, then ranked by proximity, construction stage, completion horizon and project scale.
Detail
No infrastructure changes in the area will influence its performance more than local projects. AreaSearch has identified zero such projects that could impact the region. Notable initiatives include the Hunter Transmission Project, Hunter Valley Operations Continuation Project, Hunter Regional Plan 2041, and Hunter Gas Pipeline. The following list details those considered most relevant.
Professional plan users can use the search below to filter and access additional projects.
INFRASTRUCTURE SEARCH
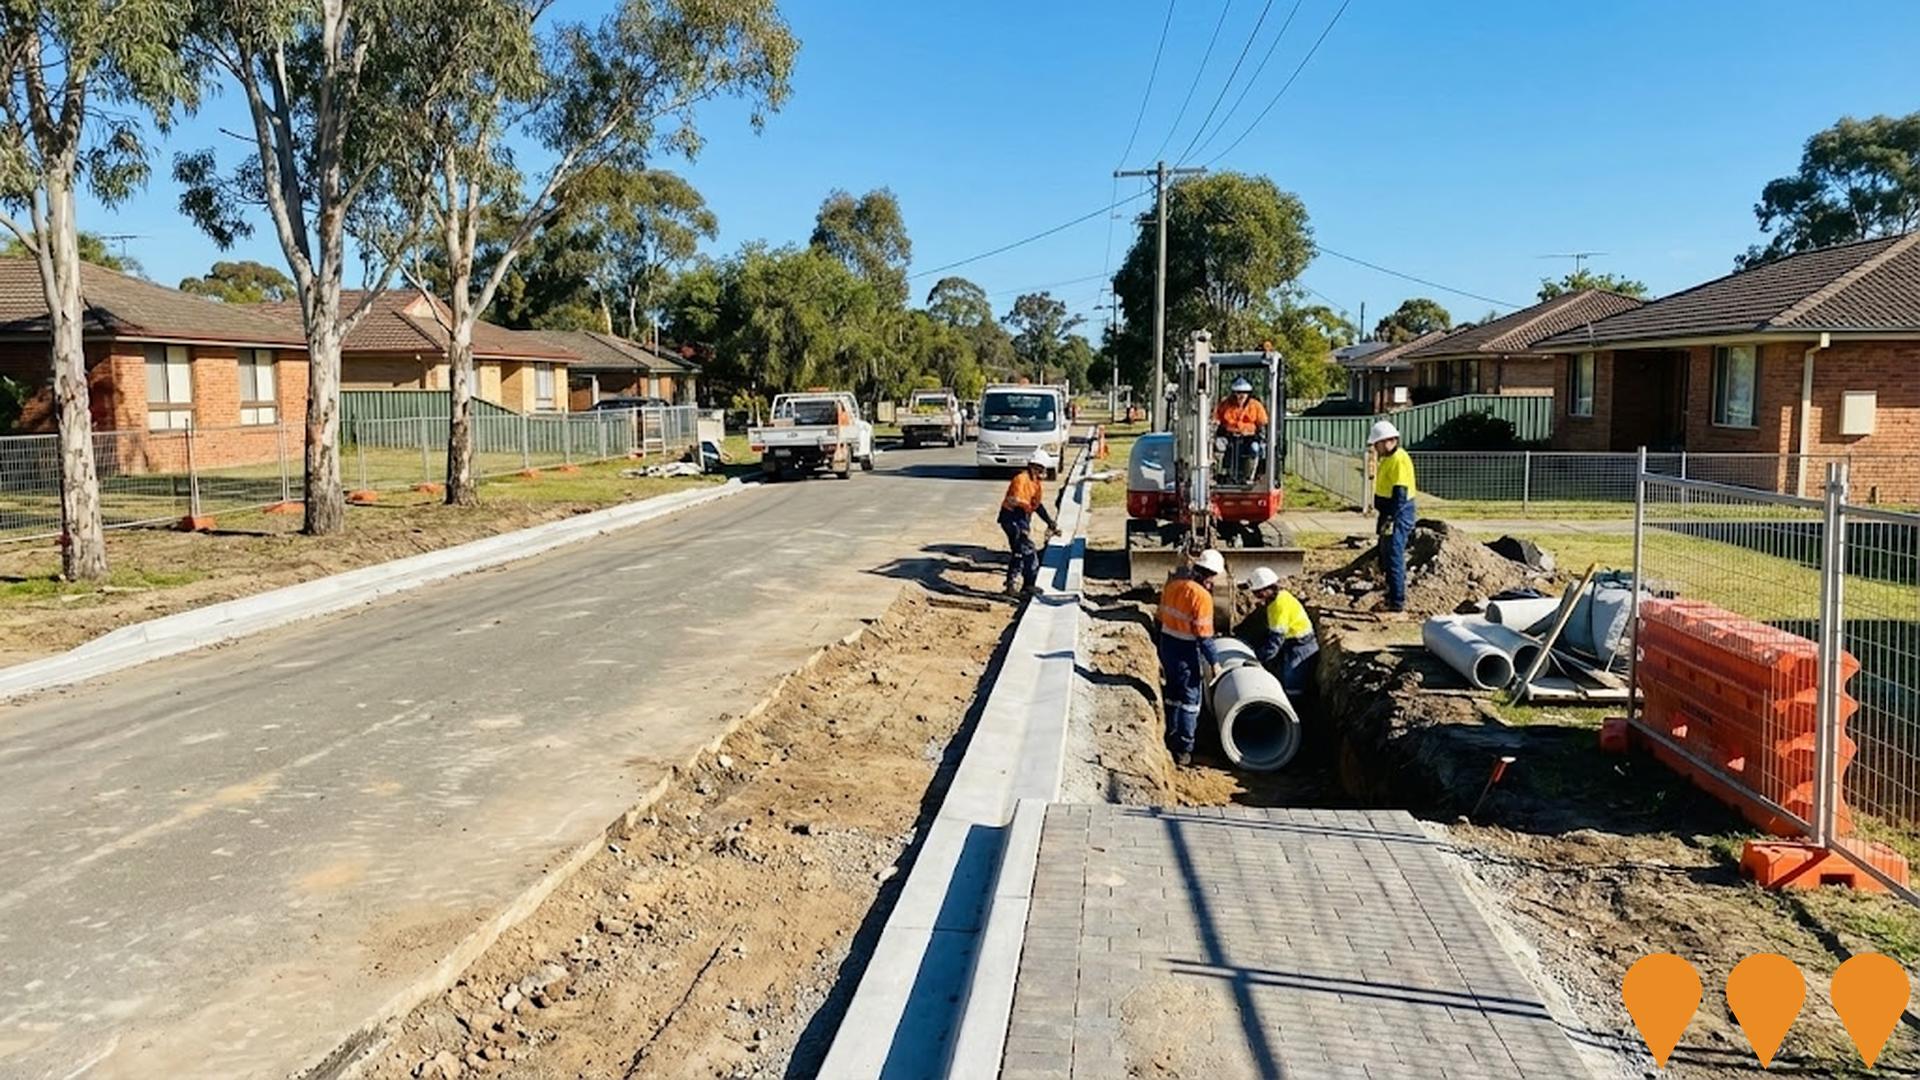
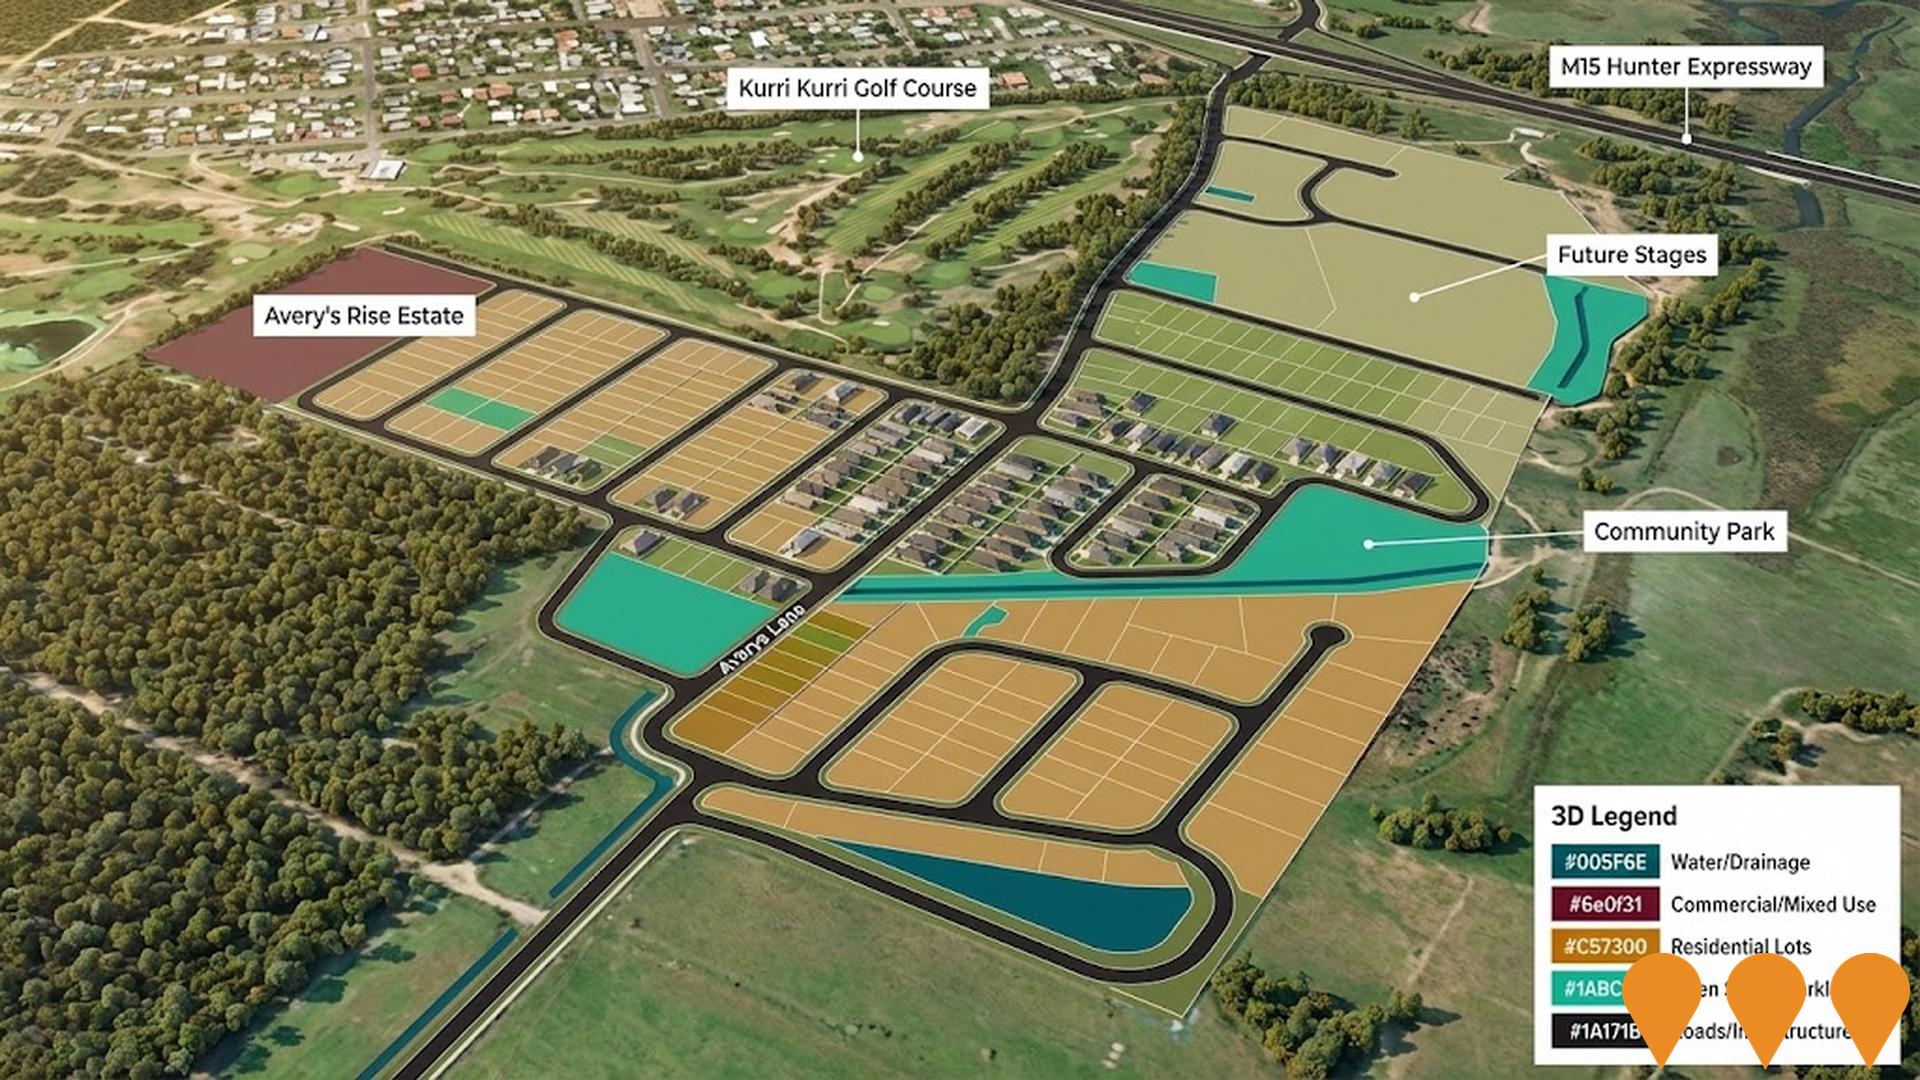
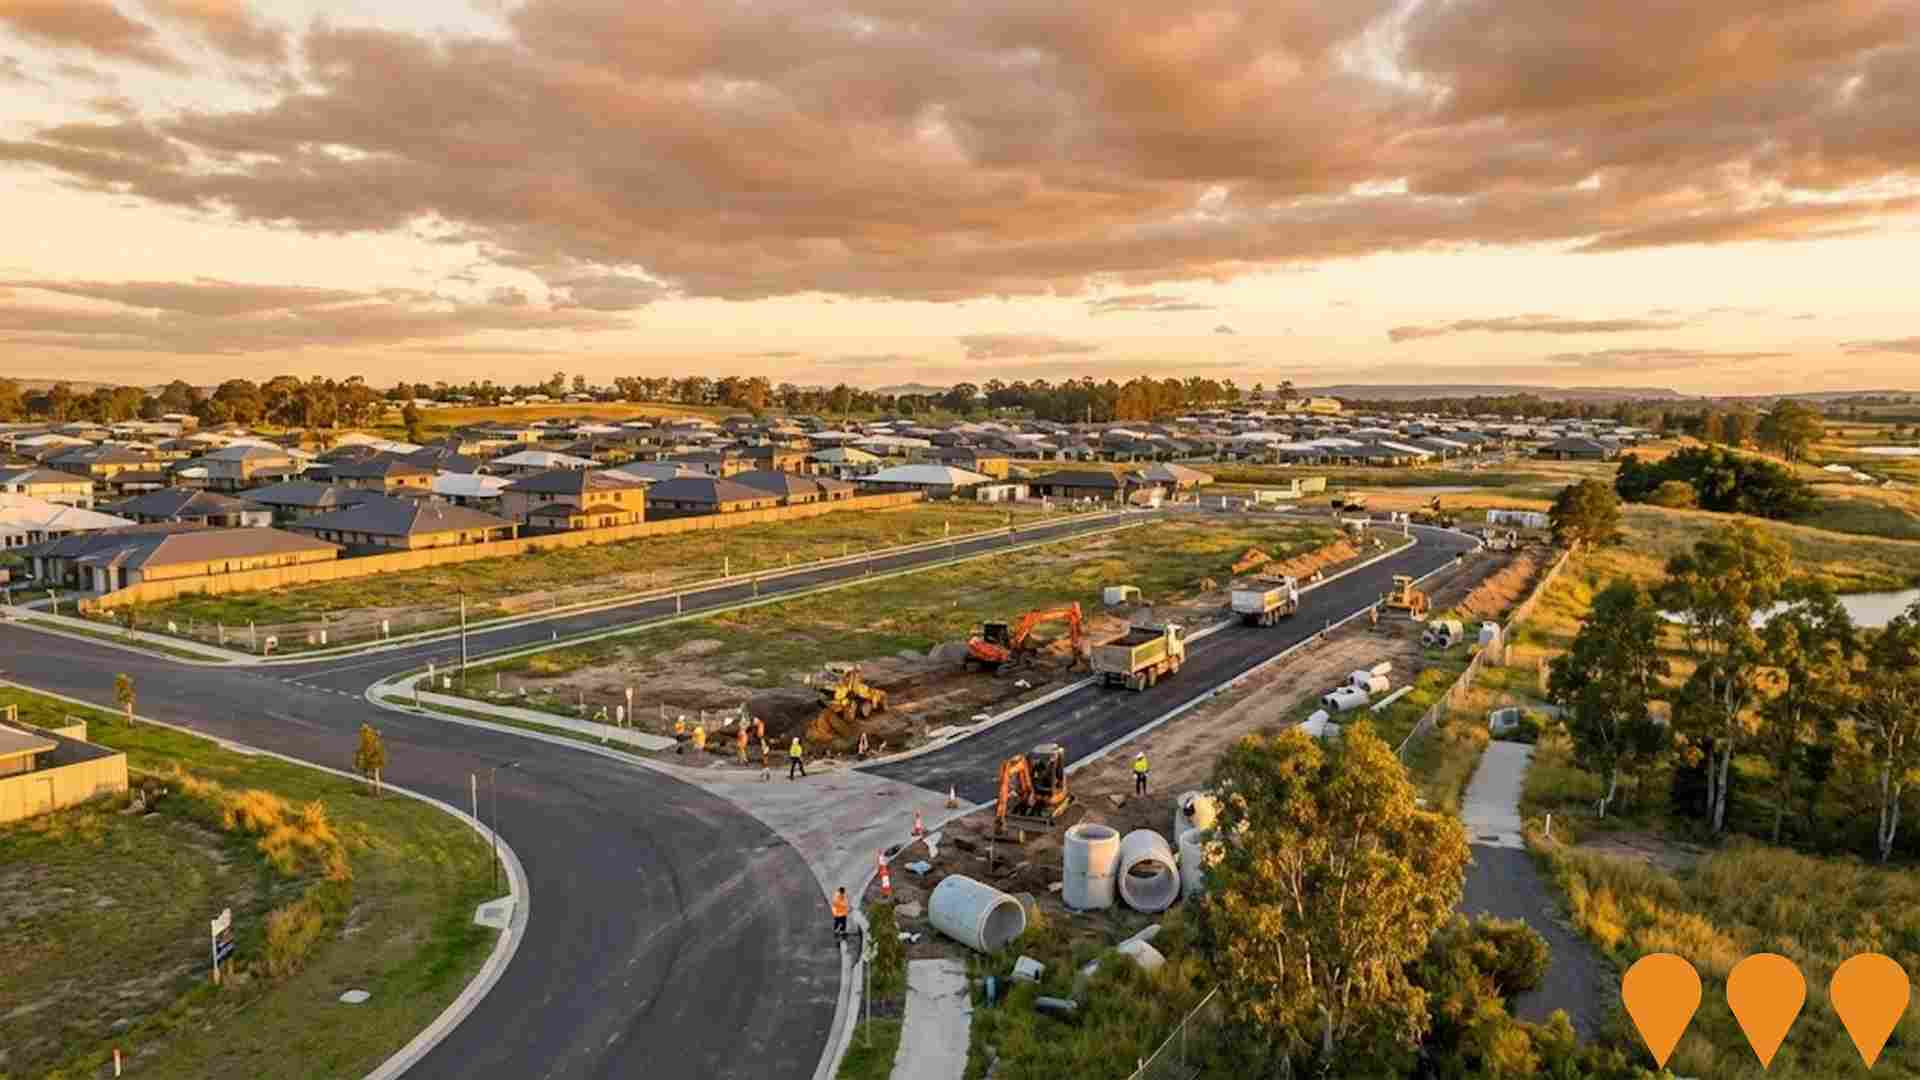
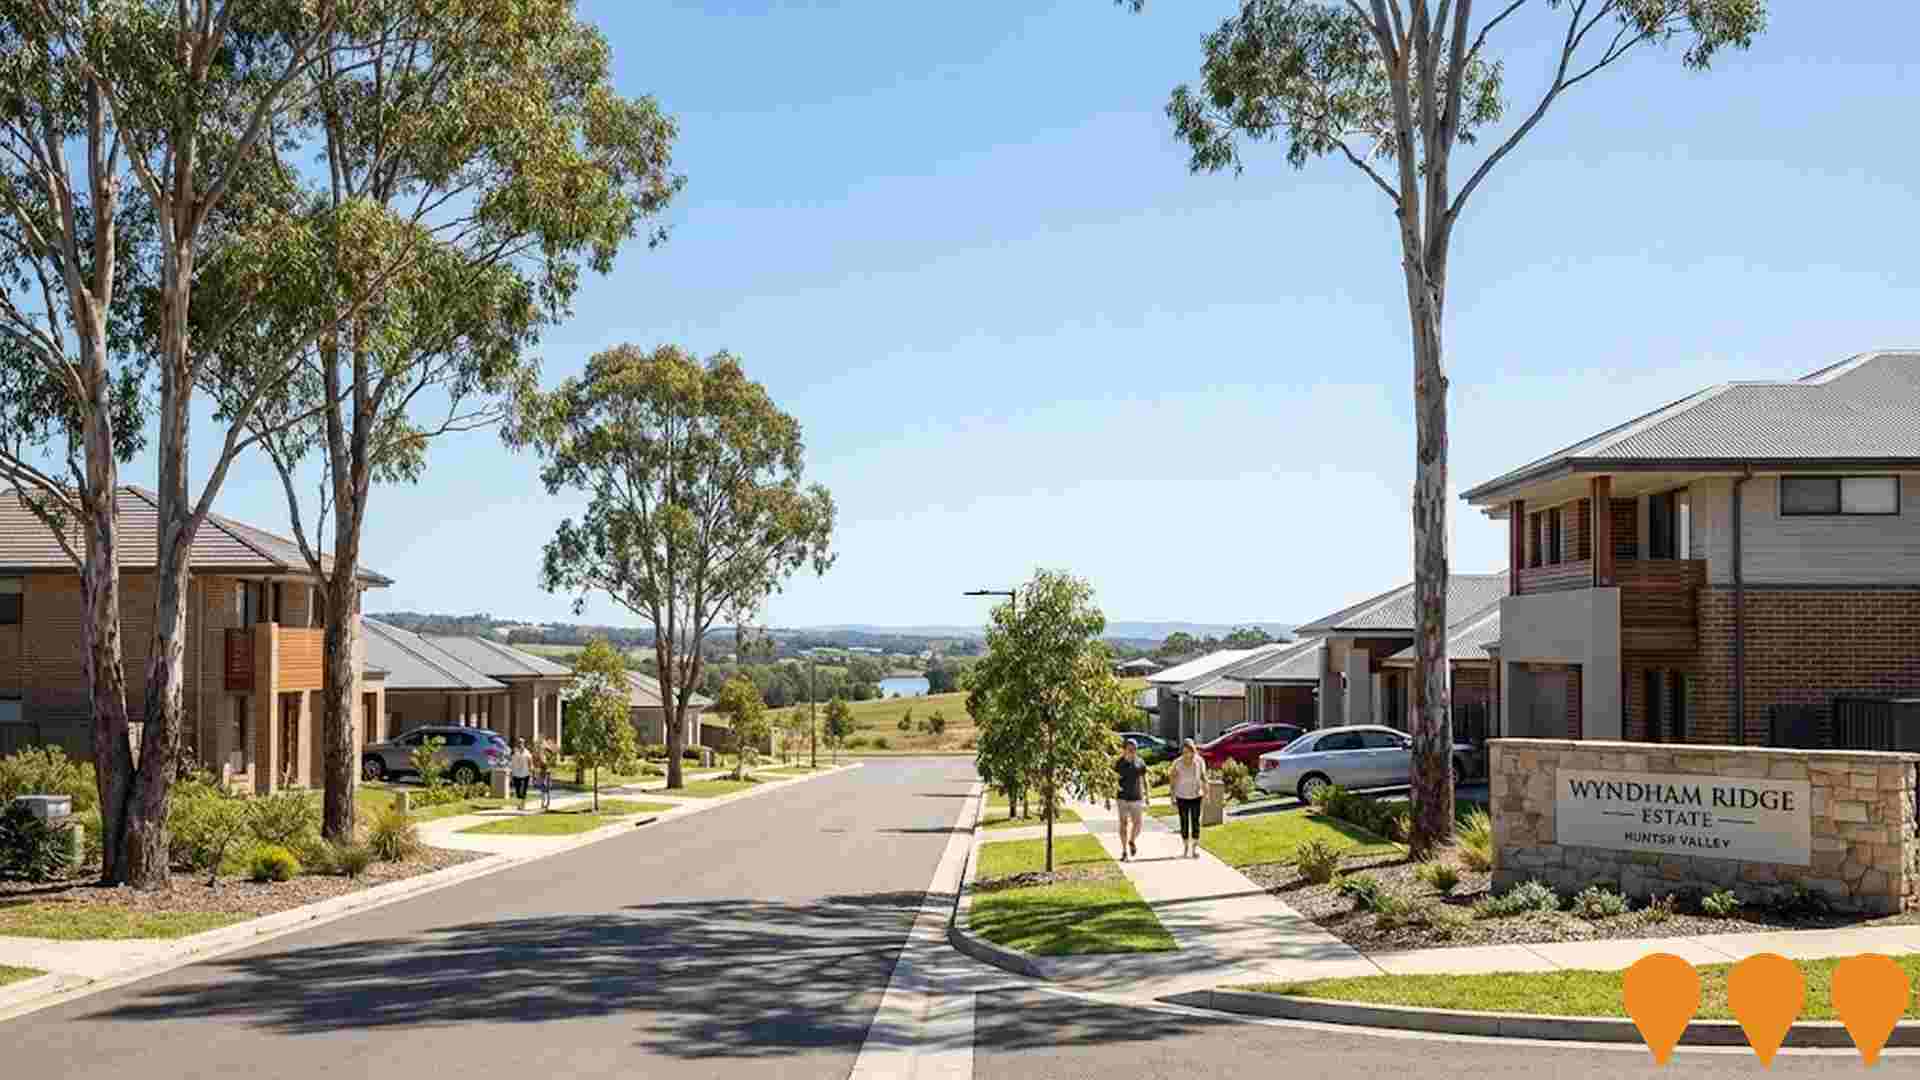
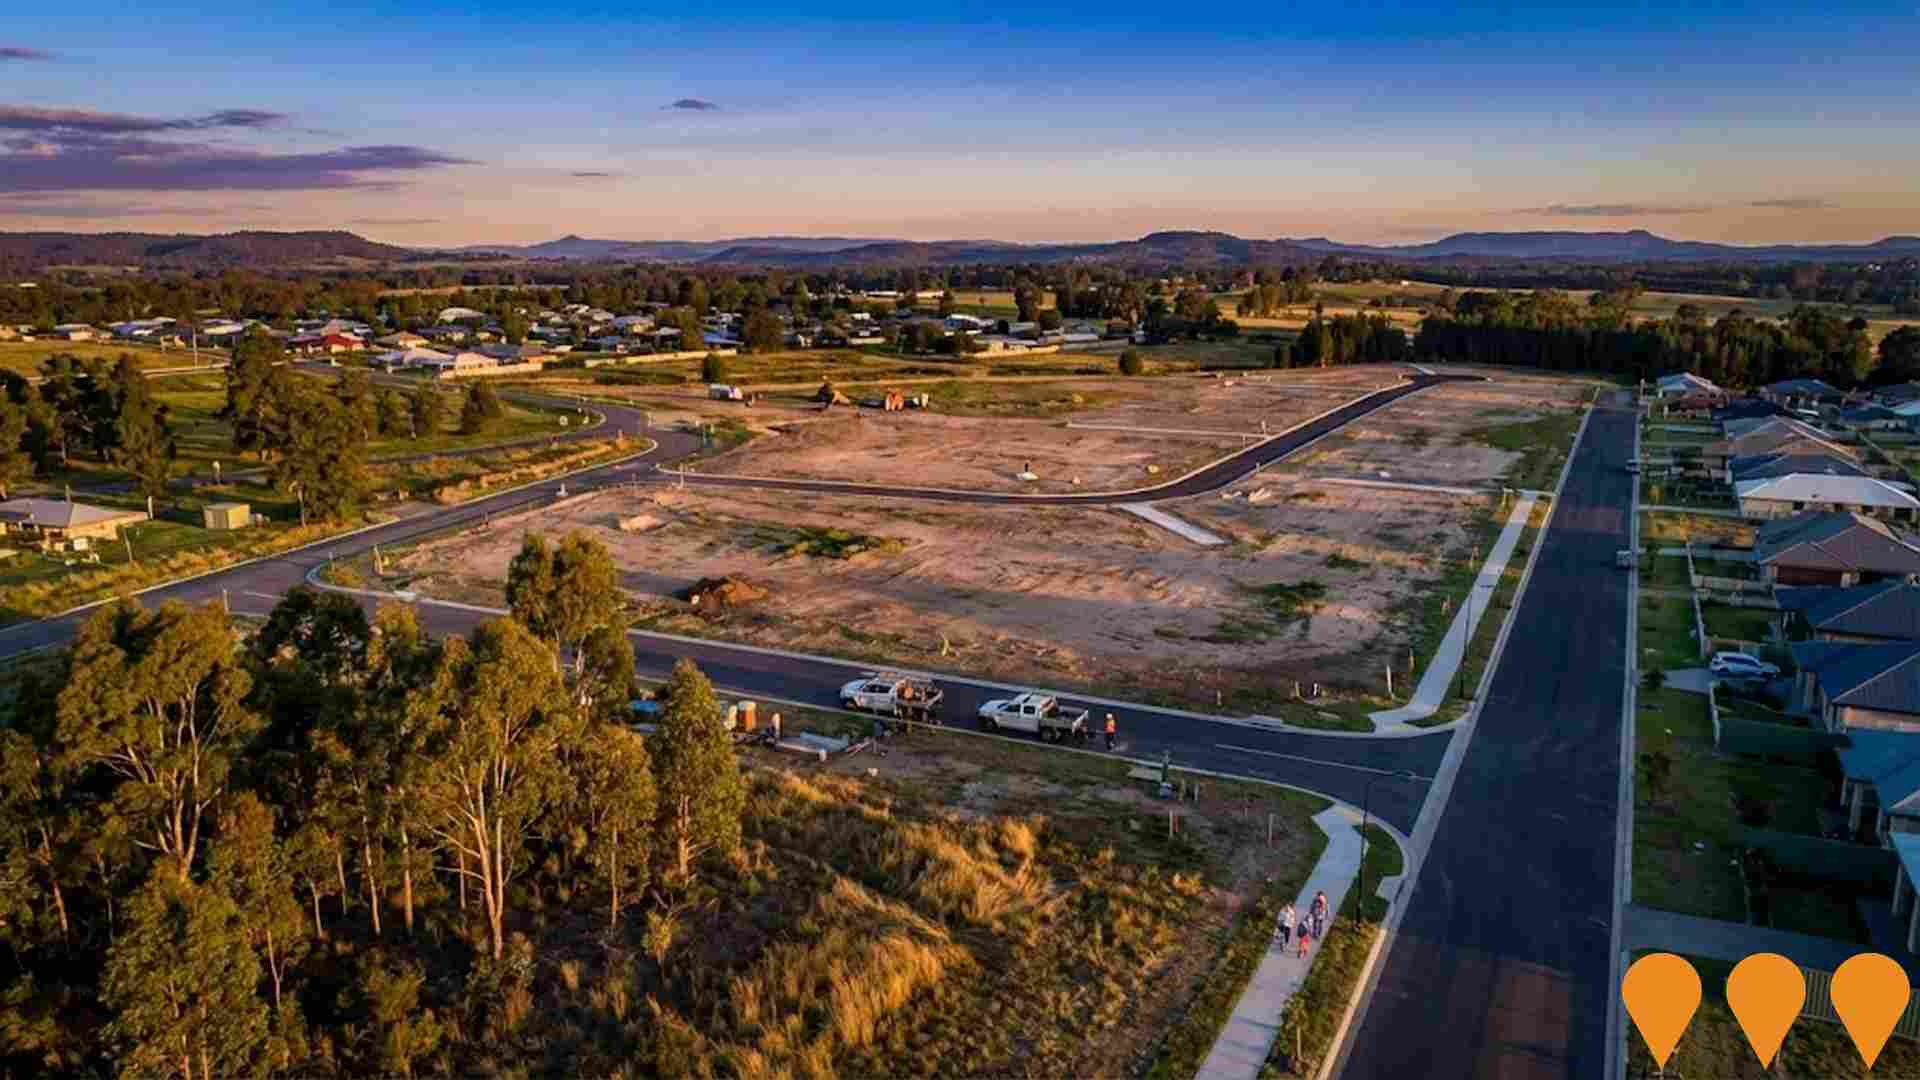
 Denotes AI-based impression for illustrative purposes only, not to be taken as definitive under any circumstances. Please follow links and conduct other investigations from the project's source for actual imagery. Developers and project owners wishing us to use original imagery please Contact Us and we will do so.
Frequently Asked Questions - Infrastructure
Mount View Grange Estate
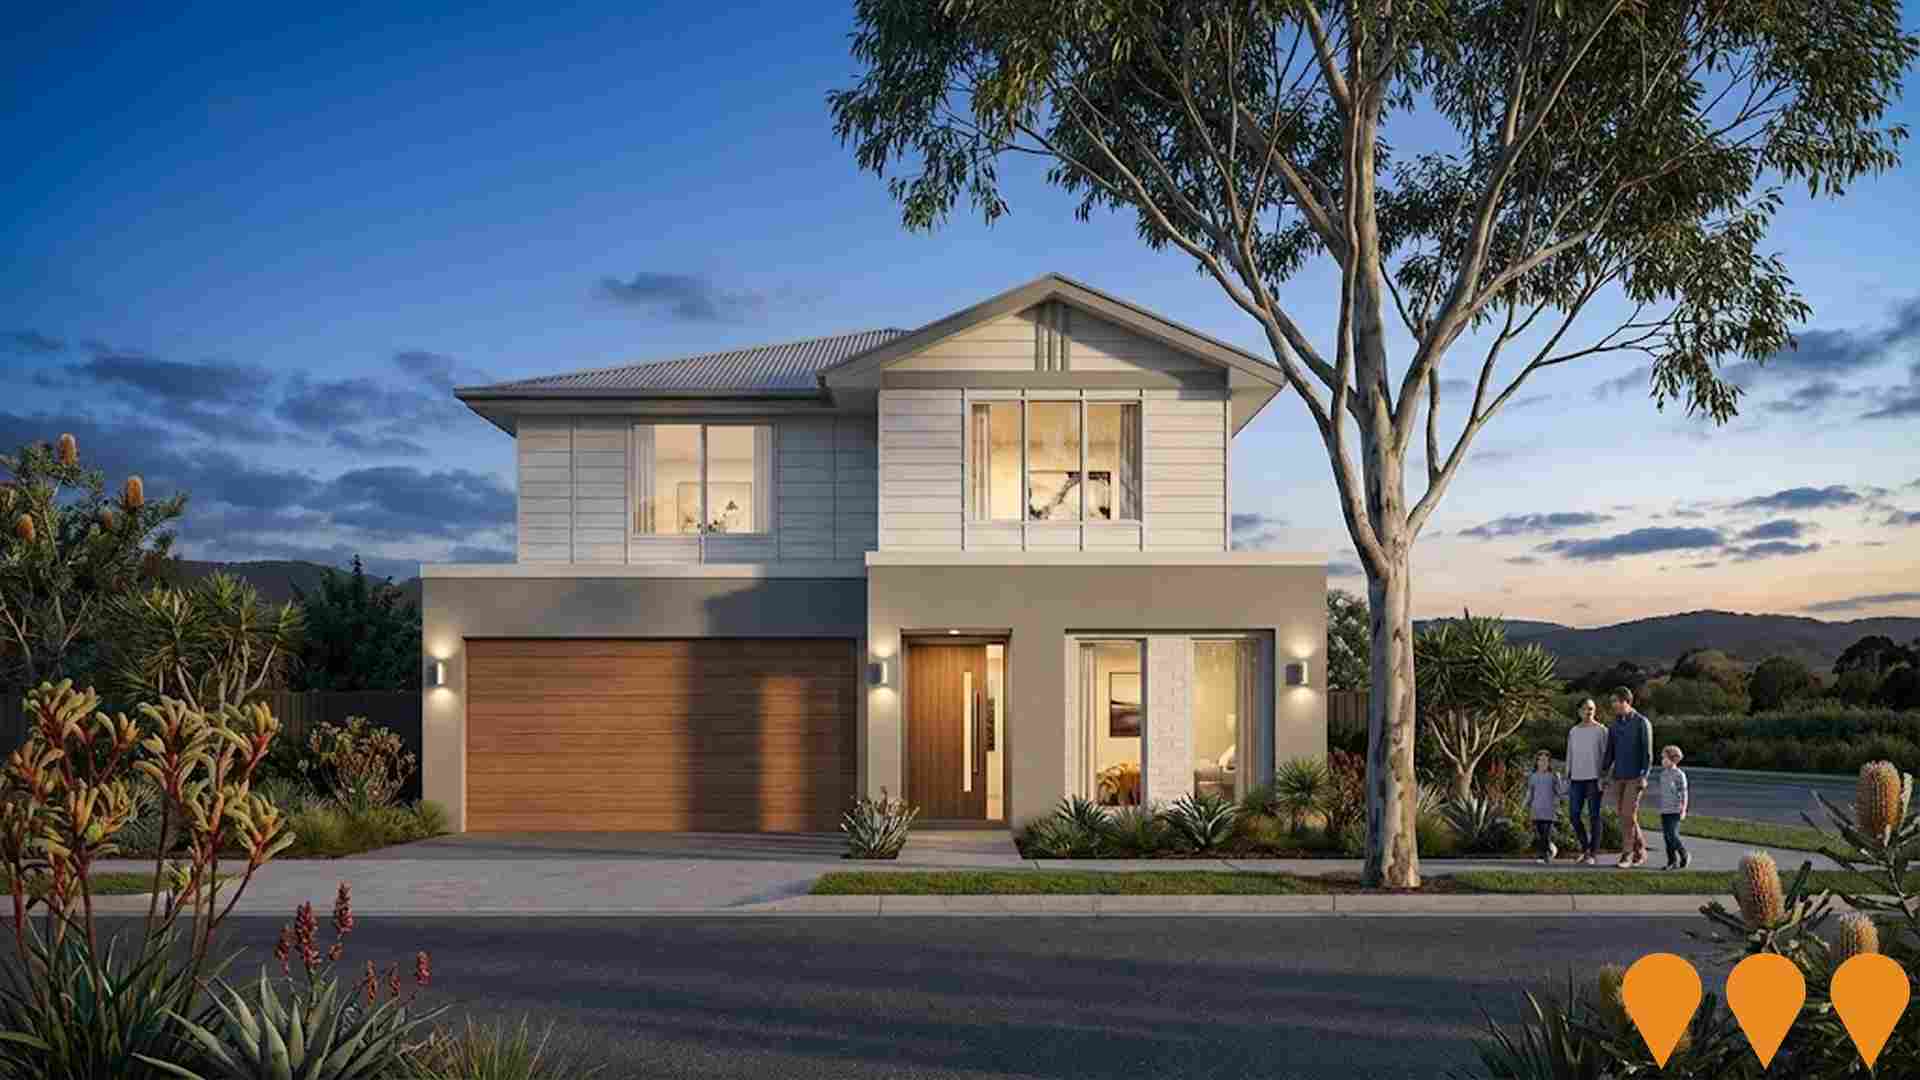
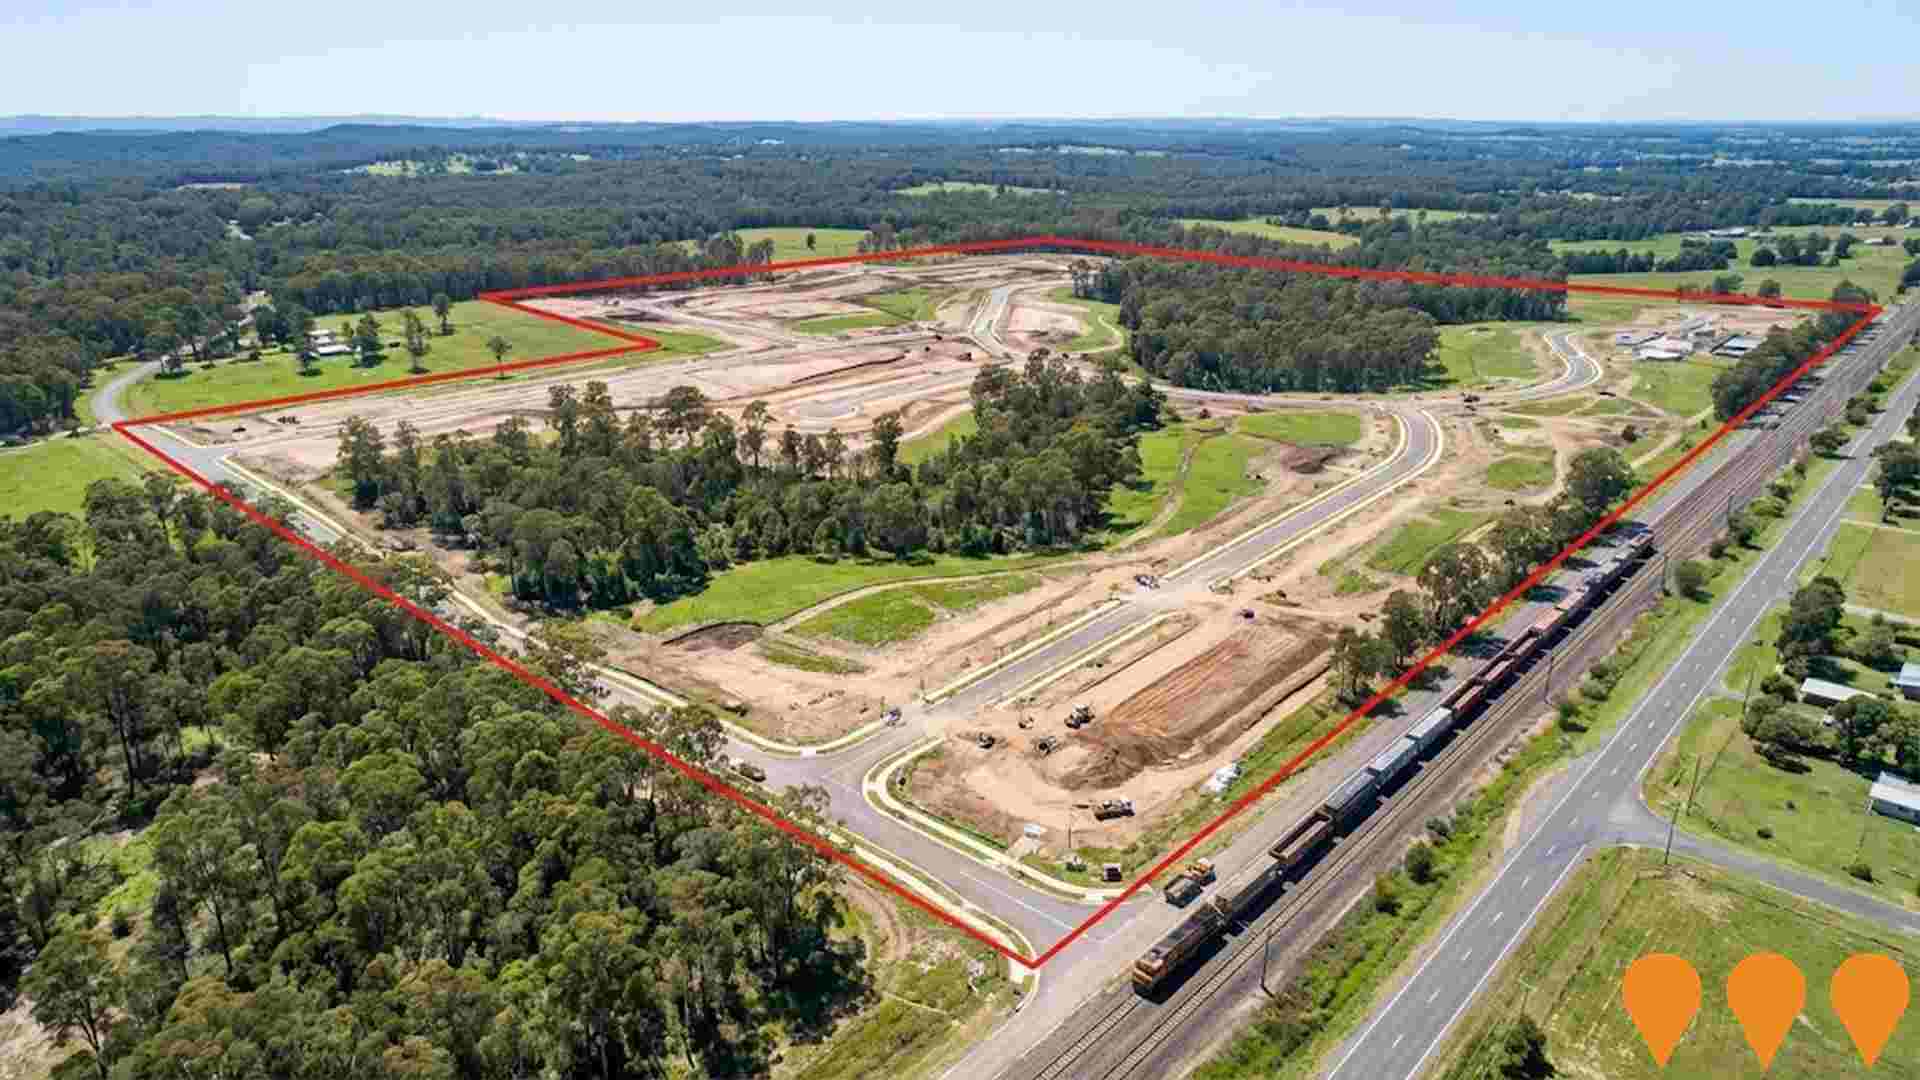
Mount View Grange Estate is a 240 hectare masterplanned residential community in Bellbird, located within the Hunter Valley region of NSW. The project is designed to deliver approximately 1,681 home sites along with a 3.11 hectare town centre site catering to supermarket, specialty retail, and community spaces. Staged civil and infrastructure works continue across the masterplan to supply ongoing releases for owner occupiers.
North Ridge Estate
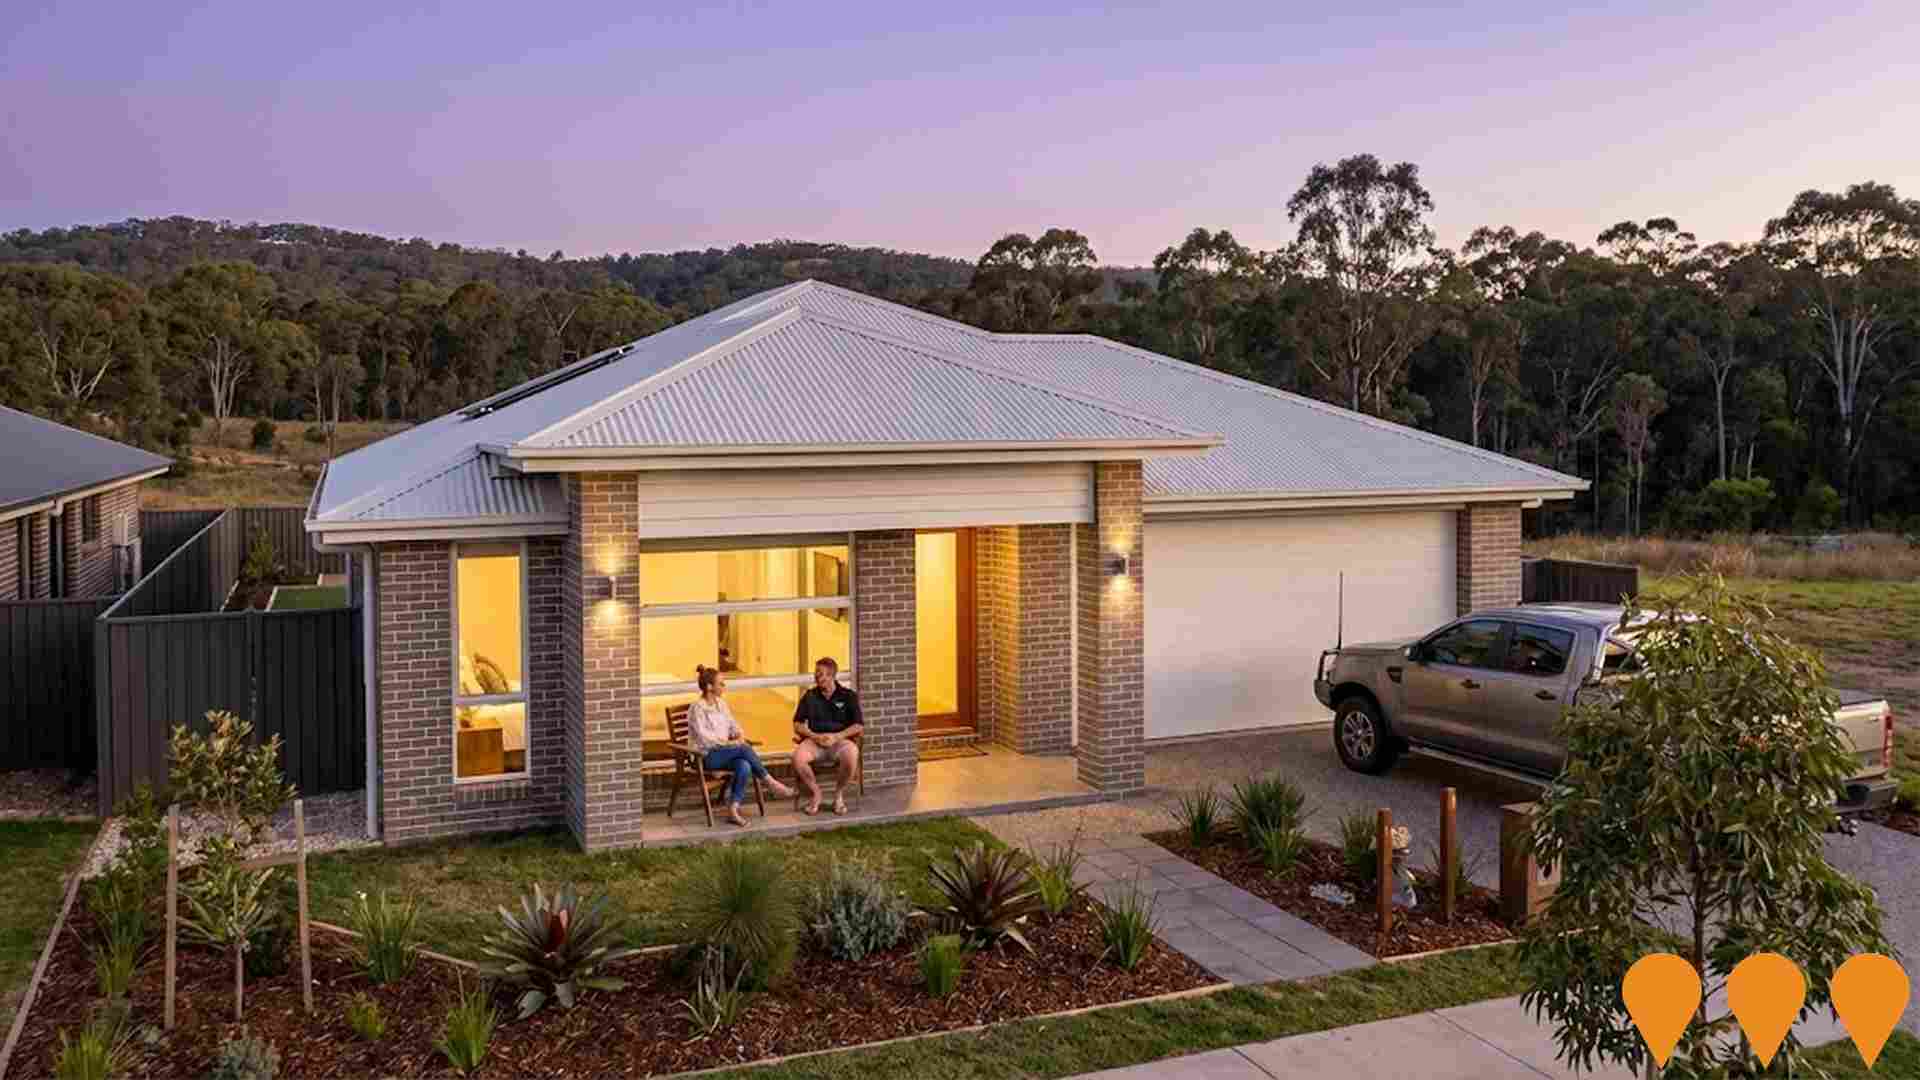
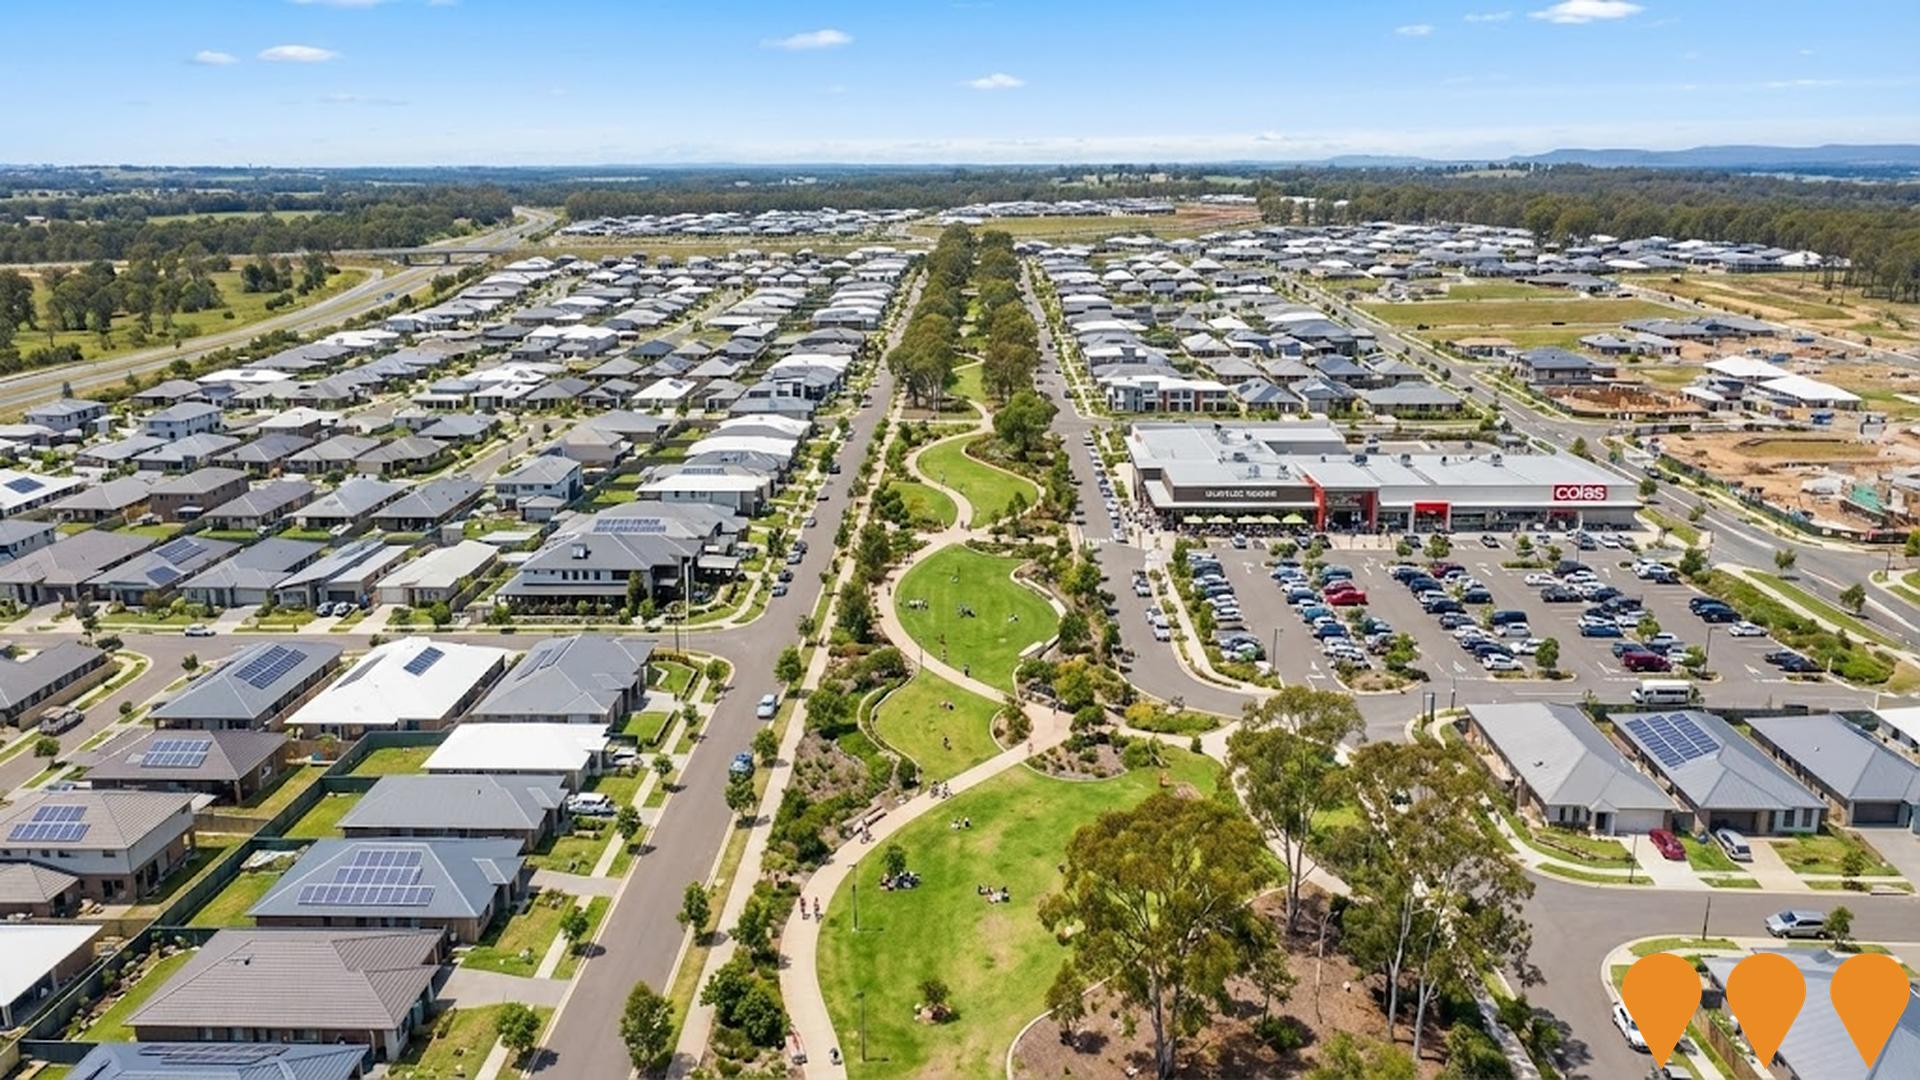
North Ridge Estate is a master planned residential community on the top of Bellbird Ridge in Cessnock, in the Hunter Valley. The estate is planned to deliver over 350 residential lots, with lot sizes typically ranging from around 450 m2 up to more than 2,000 m2, many with views over surrounding bushland and the Hunter Valley. Construction of the subdivision has commenced, early stages are sold out and new land releases and house and land packages continue to be brought to market, offering buyers the flexibility to choose their own builder and design within a bushland setting a short drive from Cessnock CBD.
Vineyard Grove Estate
A boutique house and land estate in Cessnock set amongst scenic bushland and nearby Hunter Valley vineyards. Developed by Landlink Property Group, the estate offered land lots from 581m2 with proximity to the Hunter Expressway, Newcastle CBD (45 mins), and John Hunter Hospital (40 mins). Home and land packages were delivered by builders including Mojo Homes and McDonald Jones. The estate is now listed as a completed development on the Landlink website.

Cessnock Hospital Redevelopment
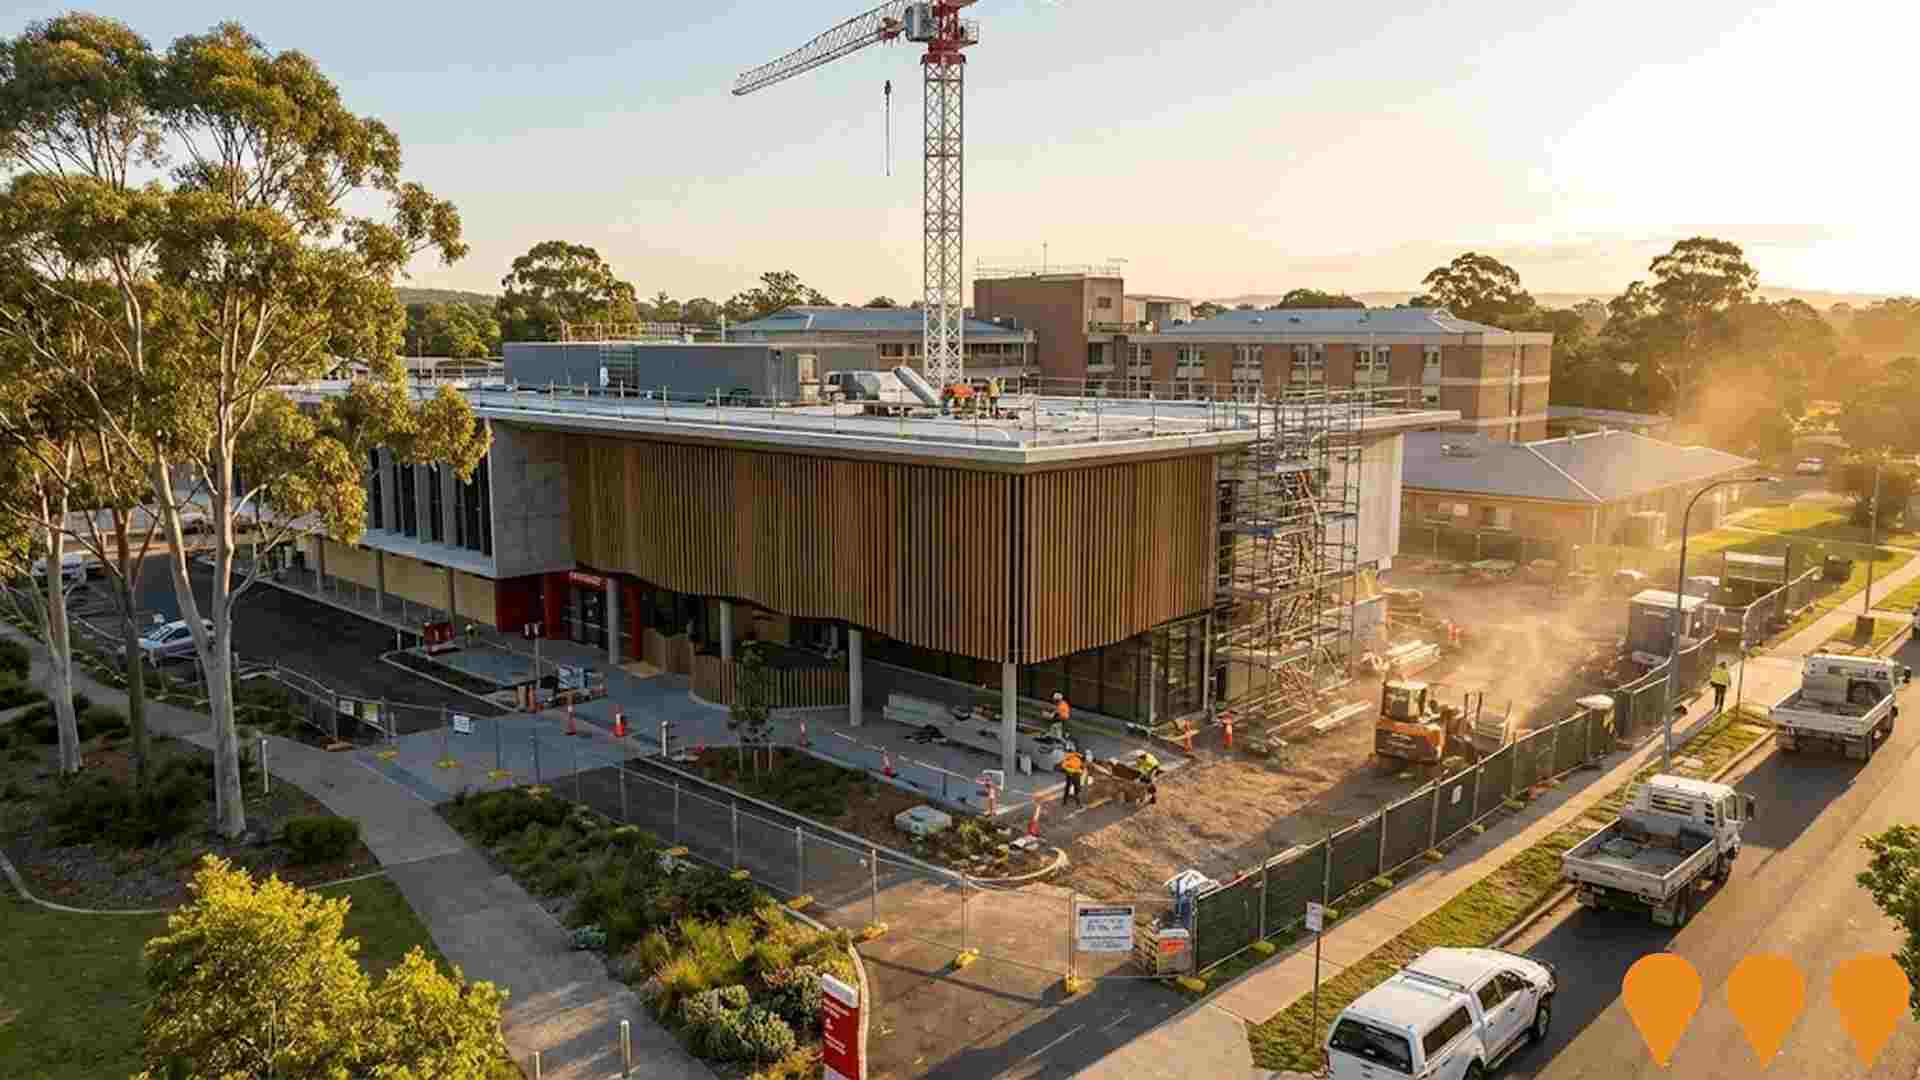
A 138 million dollar redevelopment delivering a new two-storey Acute Services Building. Features include an expanded Emergency Department, new operating theatres, day surgery spaces, two inpatient wards with ensuites, medical imaging, a Central Sterilising Services Department, and a modern pharmacy. As of May 2026, foundations are being laid with concrete pouring for the ground floor slab underway. The project includes the demolition of the Drinkwater Building, former View Street Clinic, and engineering workshops to facilitate the new clinical footprint.The hospital remains fully operational throughout works.
Wollombi Road Upgrade Project
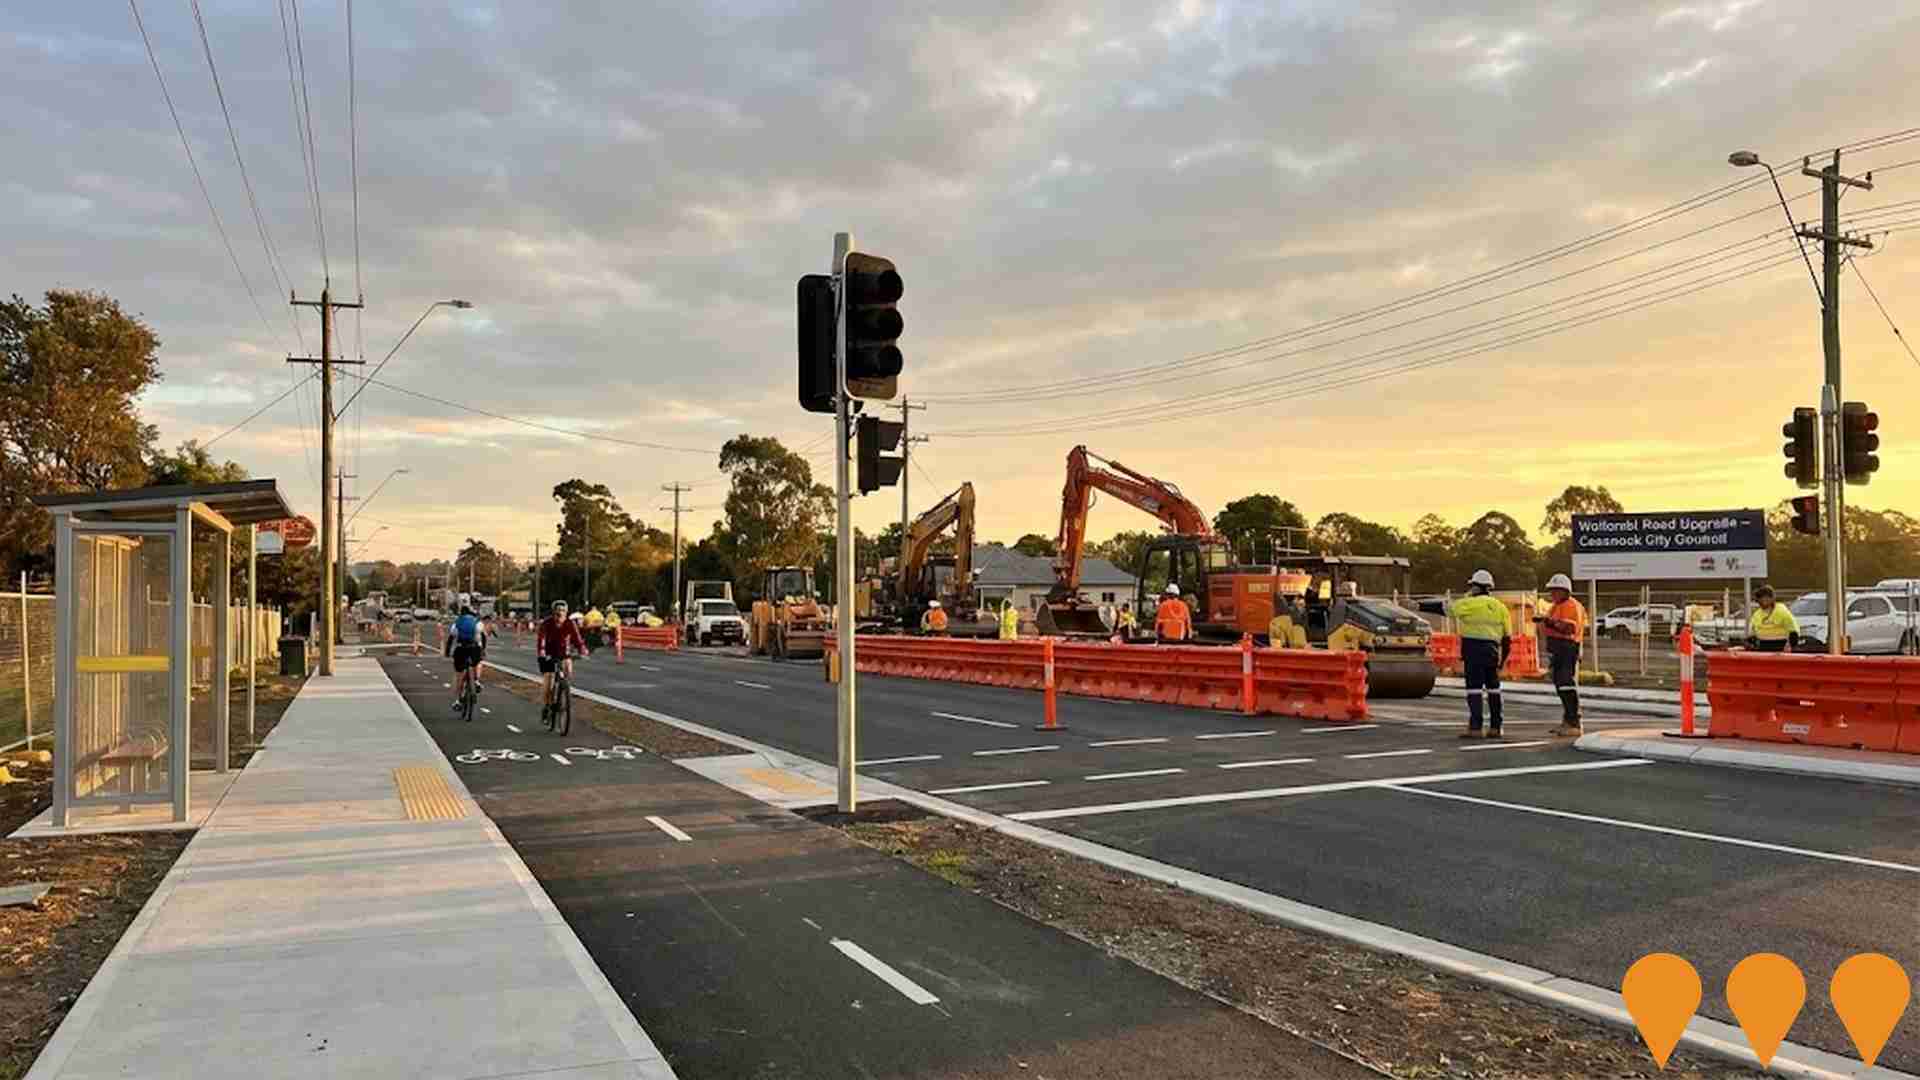
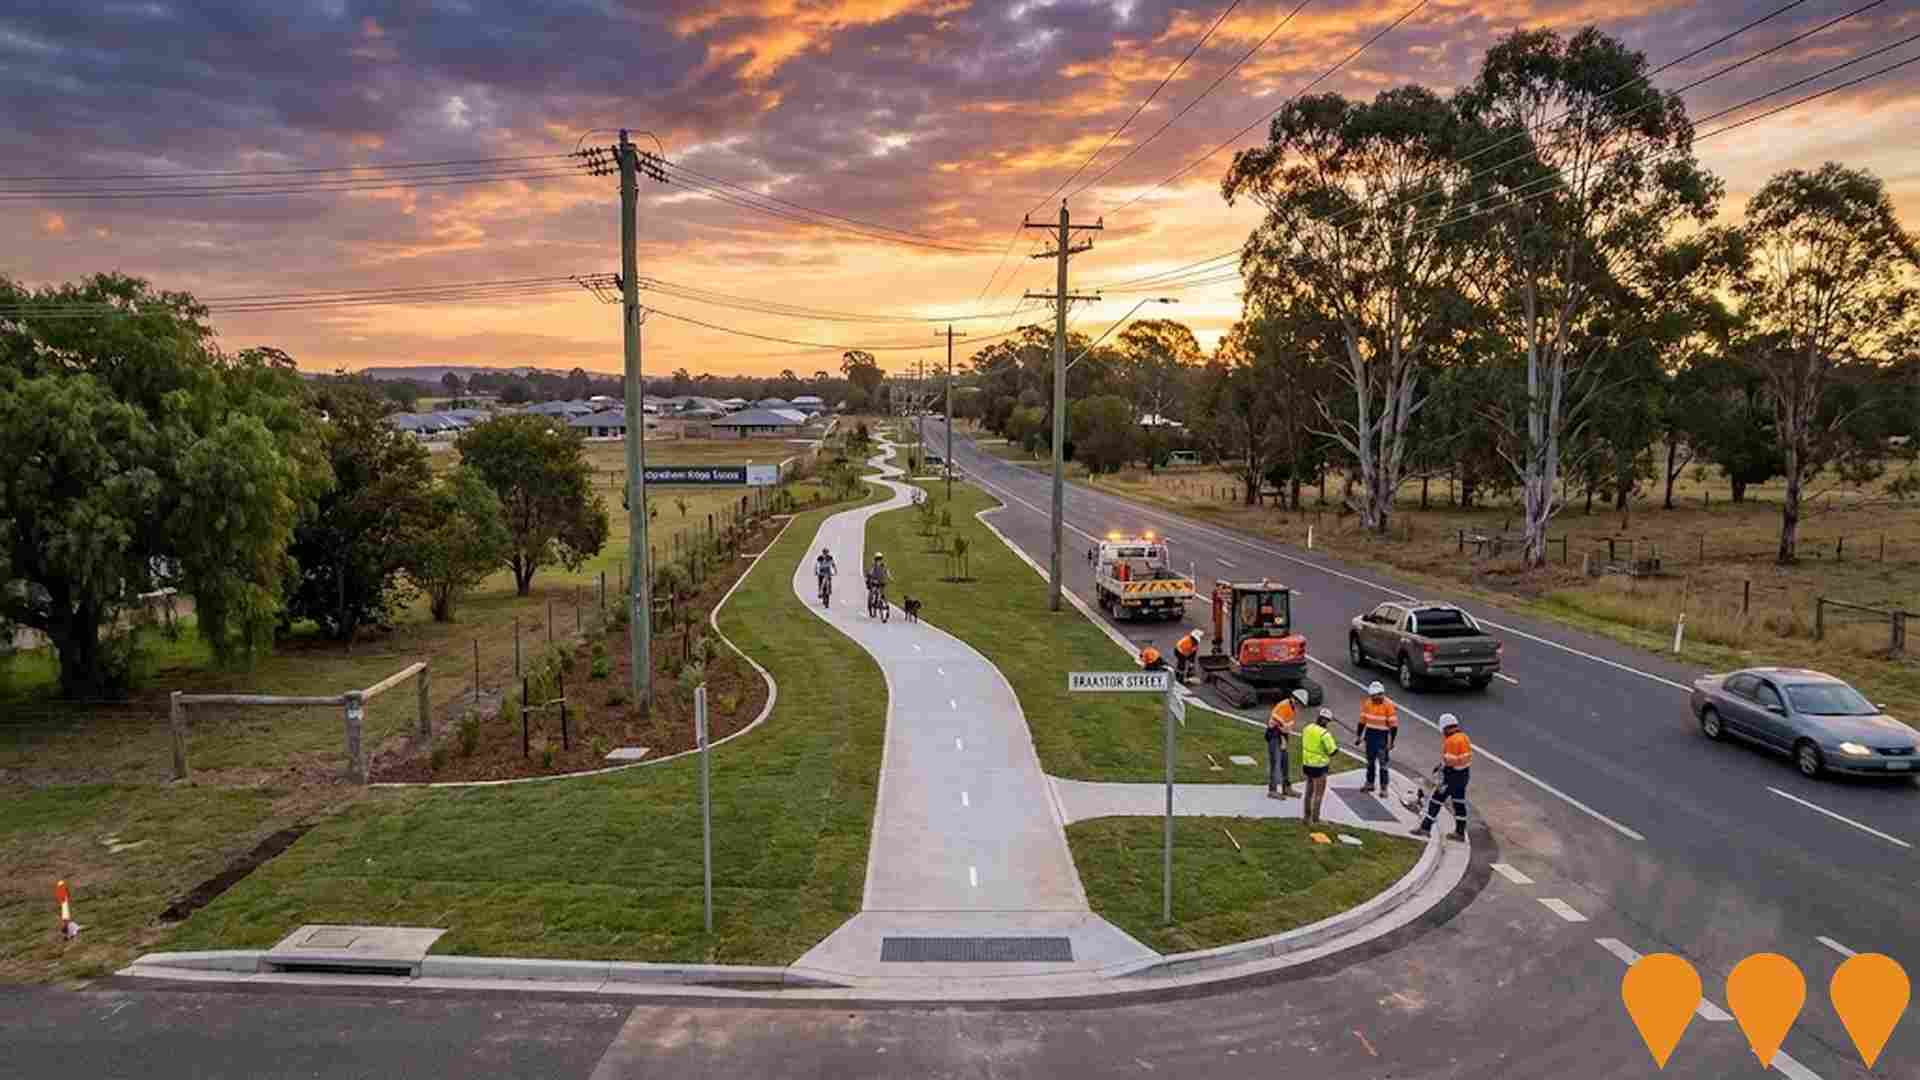
Major staged upgrade of approximately 4km of Wollombi Road between Abbotsford Street, Bellbird and Allandale Road, Cessnock. The project includes road duplication, intersection upgrades, new traffic signals, shared paths, stormwater and utility works, and improved public transport infrastructure. The project supports the Bellbird North Urban Release Area and is expected to unlock around 3,500 future homes. Following termination of the original Stage 1 contract, Daracon was appointed in April 2026 to deliver the full project under a single construction program, with works continuing through 2027.
Apex Park Precinct Transformation
Transformation of the underutilised Apex Park into a thriving community and tourism precinct serving as an iconic gateway to the Hunter Valley vineyards. Funded by a $14 million Australian Government Regional Precincts and Partnerships Program grant secured in February 2025, the project involves naturalisation of Black Creek (currently concreted), all-abilities park features, Aboriginal storytelling and interpretive art developed with Mindaribba Local Aboriginal Land Council, red cedar elements, meeting circles with water misting, a fishing net bridge, EV parking, upgraded disabled facilities, a kiosk building with kitchenette, and improved connectivity to the Cessnock Pool recreation area.Council issued a tender for a Principal Design Consultant in August 2025 to develop detailed design documentation.

Campbell Lifestyle Estate
A thriving land lease community in the heart of Hunter Valley offering 165 architect-designed homes with resort-style facilities including heated outdoor swimming pool, clubhouse, gym, theatrette, bowling green, community garden, and sports pavilion. Features no entry fees, exit fees, or deferred management fees with residents keeping 100% of capital gains.

Weston Commercial Centre Masterplan
A masterplan to revitalise the Weston commercial centre through public domain improvements, enhanced pedestrian and cyclist connectivity, traffic calming, park upgrades, street tree planting, and heritage preservation. The plan aims to attract private redevelopment and activate the public domain for community and commercial uses, and forms part of the broader Kurri Kurri District Strategy adopted by Cessnock City Council in March 2018.

665 residents of Millfield are employed, from a labour force of 691. Unemployment sits at 3.8%, with participation at 61.4%. Weighted for its industry mix, the area's sectors are forecast to grow about 5.8% nationally over five years. That reflects industry composition only and makes no allowance for local population growth, so in an area growing as fast as this one it understates the likely rise in local jobs. The working-day population is estimated at 1,218, about 80% of the resident population, so more people leave the area for work than travel in. Unemployment and labour force come from ABS Small Area Labour Markets, updated quarterly; the industry and occupation profile is from the 2021 Census.
Detail
Millfield's workforce is balanced across white and blue-collar jobs, with manufacturing and industrial sectors well-represented. As of December 2025, the unemployment rate is 3.8%, based on AreaSearch data aggregation. In this month, 665 residents are employed, with an unemployment rate 0.2% lower than Regional NSW's rate of 3.9%. Workforce participation matches Regional NSW's 61.3%. According to Census responses, 20.7% of residents work from home, potentially influenced by Covid-19 lockdowns. Key industries include health care & social assistance, accommodation & food services, and construction. Notably, mining employment is at 2.7 times the regional average.
Conversely, health care & social assistance represents 12.5%, below the regional average of 16.9%. The area may have limited local employment opportunities, indicated by Census data comparing working population to resident population. Over a 12-month period ending in December 2025, labour force decreased by 0.9% and employment fell by 0.6%, reducing unemployment by 0.3 percentage points. This contrasts with Regional NSW where employment fell by 1.2%, labour force contracted by 0.8%, and unemployment rose by 0.4 percentage points. Jobs and Skills Australia's national employment forecasts from May-25 project overall employment growth of 6.6% over five years and 13.7% over ten years. Applying these projections to Millfield's industry mix suggests local employment could increase by 5.8% over five years and 12.5% over ten years, though this is a simplified extrapolation for illustrative purposes and does not consider local population projections.
Frequently Asked Questions - Employment
Median household income in Millfield is $1,668 a week (about $87,000 a year), with median personal income at $682 a week. ATO records put median taxable income at $45,285 a year against an average of $56,472. Household income is from the 2021 Census; taxable income is from ATO Taxation Statistics for the latest financial year available, indexed forward using the ABS Wage Price Index.
Detail
The suburb of Millfield's income level is below the national average according to the latest ATO data aggregated by AreaSearch for financial year 2023. The median income among taxpayers in Millfield is $45,285 and the average income stands at $56,472. In comparison, Regional NSW has figures of $52,390 and $65,215 respectively. Based on Wage Price Index growth of 8.86% since financial year 2023, current estimates for Millfield would be approximately $49,297 (median) and $61,475 (average) as of September 2025. According to the 2021 Census, household income ranks at the 45th percentile ($1,668 weekly), while personal income sits at the 25th percentile.
The largest segment comprises 31.4% earning $1,500 - 2,999 weekly (477 residents), mirroring regional levels where 29.9% occupy this bracket. After housing expenses, 85.0% of income remains for other expenses.
Frequently Asked Questions - Income
Millfield had 412 occupied dwellings at the 2021 Census, 100% detached houses and 0% apartments. 53% are owned with a mortgage, 10% rented and 37% owned outright. At that Census the median rent was $320 a week and the median mortgage repayment $1,794 a month. Rent absorbs 19.2% of household income here and mortgage repayments 24.8%. Dwelling stock, tenure and housing costs are 2021 Census measures — the only source that counts dwellings at this boundary size.
Detail
Millfield's dwelling structures, as per the latest Census, consisted entirely of houses with 0.0% other dwellings such as semi-detached homes or apartments. This contrasted with Regional NSW where 82.6% were houses and 17.4% were other dwellings. Home ownership in Millfield stood at 37.2%, lower than Regional NSW's figure, with mortgaged dwellings at 53.0% and rented ones at 9.8%. The median monthly mortgage repayment was $1,794, higher than the Regional NSW average of $1,733, while the median weekly rent was $320 compared to Regional NSW's $330. Nationally, Millfield's mortgage repayments were lower than the Australian average of $1,863, and rents were substantially below the national figure of $375.
Frequently Asked Questions - Housing
Millfield counted 412 households at the 2021 Census, an estimated 489 today, averaging 2.8 people each. 38% are couples with children, against 28% couples without children. 19% of households are people living alone, and families average 1.7 children. Household and family composition is measured only by the Census, so these are 2021 figures.
Detail
Family households account for 77.9% of all households, including 38.3% couples with children, 28.1% couples without children, and 11.6% single parent families. Non-family households make up the remaining 22.1%, with lone person households at 18.6% and group households comprising 3.4%. The median household size is 2.8 people, larger than the Regional NSW average of 2.4.
Frequently Asked Questions - Households
13.6% of adults in Millfield hold a university qualification, including 10.5% with a bachelor degree and 2.0% with postgraduate qualifications, lower than 85% of areas nationally. A further 37.4% hold a vocational qualification. 1 school serves the area, with 96 enrolment places and an average ICSEA of 929 against a national benchmark of 1,000. Qualifications come from the 2021 Census; school enrolments, ICSEA and results come from ACARA's current release.
Detail
The area's university qualification rate is 13.6%, significantly lower than the NSW average of 32.2%. Bachelor degrees are most common at 10.5%, followed by postgraduate qualifications (2.0%) and graduate diplomas (1.1%). Vocational credentials are prevalent, with 46.6% of residents aged 15+ holding such qualifications, including advanced diplomas (9.2%) and certificates (37.4%). Educational participation is high, with 30.3% currently enrolled in formal education: 11.0% in primary, 8.5% in secondary, and 3.1% in tertiary education. Educational participation is notably high, with 30.3% of residents currently enrolled in formal education. This includes 11.0% in primary education, 8.5% in secondary education, and 3.1% pursuing tertiary education.
Frequently Asked Questions - Education
Schools Detail
Getting around Millfield means driving: households keep an average of 1.9 vehicles, and scheduled services reach only a handful of stops. Service data is built from operators' published GTFS timetables; vehicle ownership is from the 2021 Census.
Detail
Millfield has 14 operational public transport stops, all serving buses. These stops are covered by 13 different routes, offering a total of 92 weekly passenger trips. The area's transport accessibility is deemed good, with residents on average situated 246 meters from the nearest stop. As predominantly residential, most Millfield inhabitants commute outward, primarily using cars (98%). Each dwelling owns an average of 1.9 vehicles, exceeding regional norms. According to the 2021 Census, 20.7% of residents work from home, possibly due to COVID-19 conditions. Across all routes, service frequency averages 13 trips per day, equating to roughly 6 weekly trips per stop.
Frequently Asked Questions - Transport
Transport Stops Detail
60.6% of residents in Millfield report no long-term health condition, a less healthy profile than 81% of areas nationally. 6.4% need daily assistance with core activities, and 49.3% hold private health cover. The standardised death rate runs at 6.1 per 1,000 residents. Health conditions, assistance needs and insurance are 2021 Census measures; the death rate comes from current ABS releases.
Detail
AreaSearch's health assessment for Millfield shows significant health challenges. Mortality rates and chronic condition prevalence are high across both younger and older age groups. Only approximately 49% of Millfield residents have private health cover, lower than Regional NSW's 51.9% and the national average of 55.7%. The most prevalent conditions are asthma (11.6%) and mental health issues (11.5%). Sixty-point-six percent of residents report no medical ailments, compared to 63.3% in Regional NSW. Working-age adults face substantial health challenges due to high chronic condition rates. Millfield has 16.2% of residents aged 65 and over, lower than Regional NSW's 23.4%.
Senior health outcomes align with national rankings.
Frequently Asked Questions - Health
Millfield is largely Australian-born, at 90.8% of residents, with 1.9% speaking a language other than English at home. The largest reported ancestries are Australian (34.0%) and English (31.8%). 5.1% of residents identify as Aboriginal and/or Torres Strait Islander. Ancestry, language and country of birth are counted only by the Census, so these are 2021 figures.
Detail
Millfield's cultural diversity was found to be below average, with 90.1% of its population being citizens, 90.8% born in Australia, and 98.1% speaking English only at home. The predominant religion in Millfield is Christianity, comprising 54.7% of the population, compared to 55.9% across Regional NSW. Regarding ancestry, the top three groups in Millfield are Australian (34.0%), English (31.8%), and Irish (8.3%). Notably, Australian Aboriginal people are overrepresented at 5.1%, compared to 4.6% regionally, while Welsh (0.6%) and Lebanese (0.5%) populations also exceed their regional counterparts by 0.1%.
Frequently Asked Questions - Diversity
The median resident of Millfield is 38. 25.1% of residents are aged 15 to 34. Age cohorts are not raw Census counts: the Census split is re-based to the latest ABS population estimates and state projections.
Detail
Millfield's median age is 38, which is lower than Regional NSW's figure of 43 but matches the national norm of 38. The age group of 35-44 is strongly represented at 15.1%, compared to Regional NSW, while the 75-84 cohort is less prevalent at 4.4%. According to the 2021 Census, the 75-84 age group grew from 2.8% to 4.4%, and the 15-24 cohort increased from 12.9% to 14.0%. Conversely, the 45-54 cohort declined from 13.1% to 11.6%, and the 5-14 group dropped from 13.8% to 12.5%. By 2041, demographic modeling suggests Millfield's age profile will change significantly.
Leading this shift, the 25-34 age group is projected to grow by 28%, reaching 216 from 168. Meanwhile, numbers in the 5-14 age range are expected to fall by 6%.
Frequently Asked Questions - Age
Data & MethodBoundaries, Sources & Method for Millfield
9 of 14 data sections on this page were updated within the last 12 months — the newest current to Oct 2026.
Everything is aggregated to the Suburb (SAL) boundary shown above, on a 2021 Census baseline. Only 3 sections — housing, households and cultural diversity — still wait on the 2026 Census.
The ledger — source, cycle and currency by section
| Section | Source & update cycle | Currency |
|---|---|---|
| Updated within the last 12 months 9 sections | ||
| Population | ABS, GNAF, Geoscience Australia Annual (ABS ERP) | Aug 2026 2 months ago headline measures · 2021 Census baseline |
| Re-based to the ABS Estimated Resident Population (June 2024 release) and updated with new dwellings from GNAF address data. Current to Aug 2026, with the 2021 Census supplying the small-area baseline. | ||
| Age profile | ABS, Geoscience Australia, State governments Annual | Aug 2026 2 months ago headline measures · 2021 Census baseline |
| Age cohorts are re-based to the latest ABS population estimates and state projections, current to Aug 2026. Each cohort is held as a Census baseline and a current estimate. | ||
| Development & approvals | ABS, GNAF Monthly (ABS approvals) | Aug 2026 2 months ago headline measures · Jul 2026 baseline |
| Property sales & rents | Valuer General, Rental Board, ABS Weekly sales, quarterly rents | Oct 2026 this month headline measures · Sep 2026 baseline |
| Sales from the state Valuer General register, refreshed weekly, and rents from quarterly rental bond lodgements. Both are read live each time this page loads, current to Oct 2026. | ||
| Infrastructure projects | Infrastructure Australia, Local governments Daily | May 2026 5 months ago all 2 projects tracked here |
| Project pipeline maintained continuously from Infrastructure Australia, state agencies, local government and public announcements. Records are added and revised daily; this area was last updated May 2026. | ||
| Employment | ABS, DEWR, JSA Quarterly (ABS SALM) | Mar 2026 7 months ago headline measures · 2021 Census baseline |
| Unemployment and labour force from ABS Small Area Labour Markets, current to Mar 2026. The growth outlook applies Department of Employment (now Jobs and Skills Australia) forecasts for all 19 industry divisions to the local industry mix, so it measures sector composition rather than local expansion and makes no allowance for population growth. Job demand comes from the same agency via its Internet Vacancy Index; industry and occupation structure from the 2021 Census. | ||
| Education | ABS, ACARA Annual (ACARA) | Sep 2026 last month headline measures · 2021 Census baseline |
| Transport | ABS, State Transport Departments Each timetable release | Jul 2026 3 months ago headline measures · 2021 Census baseline |
| Services & amenities | Provider directories, ACECQA Continuous | Sep 2026 last month all 14 measures |
| Annual and financial-year sources 2 sections | ||
| Income | ABS, ATO Annual (ATO) | FY 2023 3 years ago headline measures · 2021 Census baseline |
| ATO taxable income statistics for FY 2023, indexed forward using the Wage Price Index. Census household income provides the distribution detail. | ||
| Health | ABS, ATO Annual | 2024 2 years ago headline measures · 2021 Census baseline |
| Census-measured — next update: 2026 Census 3 sections No more current small-area source exists for these, so they are labelled as Census-measured rather than implied to be current. | ||
| Housing | ABS 5-yearly (Census) | 2021 Census next update 2026 all 30 measures |
| Households | ABS 5-yearly (Census) | 2021 Census next update 2026 all 18 measures |
| Cultural diversity | ABS, Geoscience Australia 5-yearly (Census) | 2021 Census next update 2026 all 44 measures |
"Currency" is the most recent release feeding that section. Where the Census supplies the structural baseline underneath a current headline figure, the row says so.
How the numbers are built
Population
The Census provides the small-area baseline, aggregated from mesh blocks to this boundary. It is then re-based to the ABS Estimated Resident Population (June 2024 release), and new dwellings built since Census night are counted from address data — 8 validated new addresses here. The headline figure is therefore a current estimate for Feb 2026, not a 2021 count (1,268 at the 2021 Census → 1,522 now). Annual growth rates are compound (CAGR), not simple averages.
Age profile
Cohort shares are not raw Census counts. Every cohort is held as a pair — the Census baseline and a current estimate — and the split is re-based using ERP and state population projections, current to Feb 2026. Median age is the Census median plus modelled change since. Charts that show both are labelled "2021 Census vs Current Estimate".
Property sales
Sourced from the state valuation authority's sales register — current, not Census, and refreshed weekly. Medians are calculated from settled transactions in the period shown; periods with very low transaction counts are flagged or suppressed, because a handful of sales can move a median substantially.
Rents
Derived from state rental bond lodgement data, by dwelling type and bedroom count. Bonds are lodged at the start of a new tenancy, so this reflects new lettings, not the whole rented stock.
Development & infrastructure
Building approvals come from current ABS releases; development applications are collected from council and state planning portals; the infrastructure pipeline is compiled from Infrastructure Australia and local government sources. Applications are matched to this boundary by address or coordinates, so very recent lodgements may not yet appear.
Employment & income
Industry and occupation structure comes from the Census, but the headline labour-market indicators do not. Unemployment and labour force are derived from ABS Small Area Labour Markets (quarterly). The employment outlook applies Department of Employment forecasts for all 19 industry divisions to this area's own industry mix (the agency is now Jobs and Skills Australia), as does the Internet Vacancy Index used for job demand. Because it is weighted on industry composition alone, that outlook carries no allowance for local population growth — in fast-growing areas the real rise in local jobs will typically be higher. Income combines Census household income with ATO taxable-income statistics for FY 2023, indexed forward using the Wage Price Index.
Education, transport & amenities
School enrolments, ICSEA and performance come from ACARA's current release, not the Census. Public transport stops and service frequency are derived from GTFS timetable feeds published by state transport departments. Services and amenities are proximity and count scores built from provider directories, refreshed on their own cycle. The Census contributes only the travel-to-work and qualification measures.
Rankings and benchmarks. Where we rank this area, the comparison set is every area of the same boundary type — suburbs against suburbs, SA2s against SA2s. Benchmarks compare this area against its greater capital city region and the national figure for the same measure and period.
Limits worth knowing. Small areas carry larger error margins, and the ABS introduces small random adjustments to Census counts to protect confidentiality — so totals may not sum exactly. Estimates re-based from regional data describe the area's expected trajectory, not a direct count of it. Figures are indicative for research and are not financial, planning or valuation advice.
Cross-check us. The Census baseline for this boundary is at ABS 2021 Census QuickStats (SAL12631). QuickStats reports 2021 only — the figures on this page are more current wherever the ledger shows a later date.